Growing Colorado. Population Transitions In Boulder
|
|
|
- Clifton Ramsey
- 6 years ago
- Views:
Transcription

1 Growing Colorado Population Transitions In Boulder Elizabeth Garner State Demography Office Colorado Department of Local Affairs 2018 Demography.dola.colorado.gov
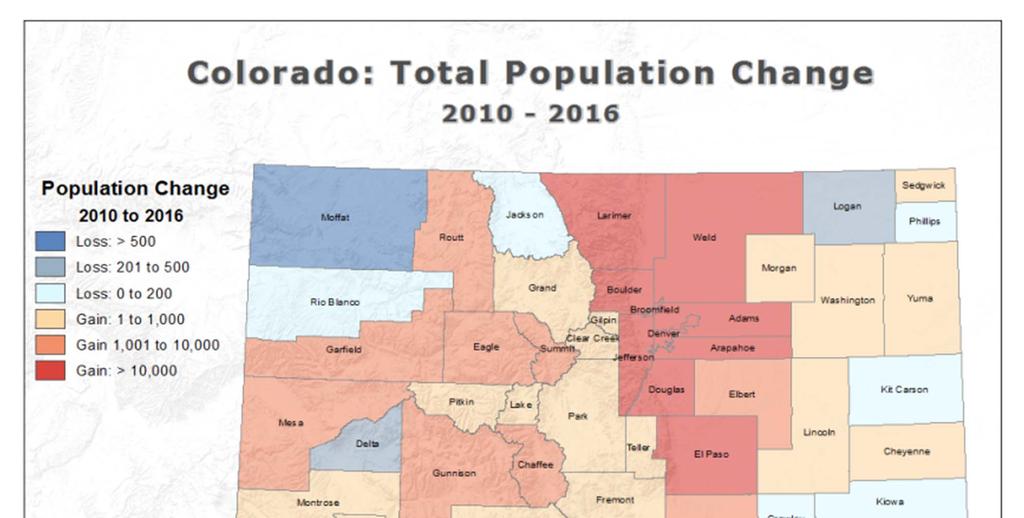
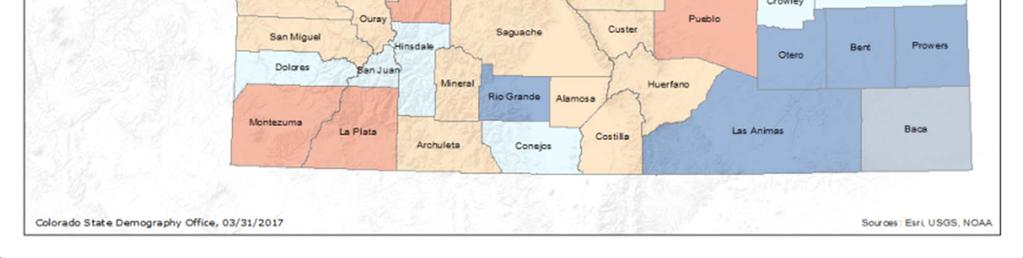
2 Transitions to Watch Disparate growth across the state. Migration attracting and retaining the best and brightest. Can we continue to do it? Do we want to? And where do we put them? Aging impacts everything including the economy. Changes to industries retail, manuf., construction Increase racial and ethnic diversity. Population growing at a slowing rate
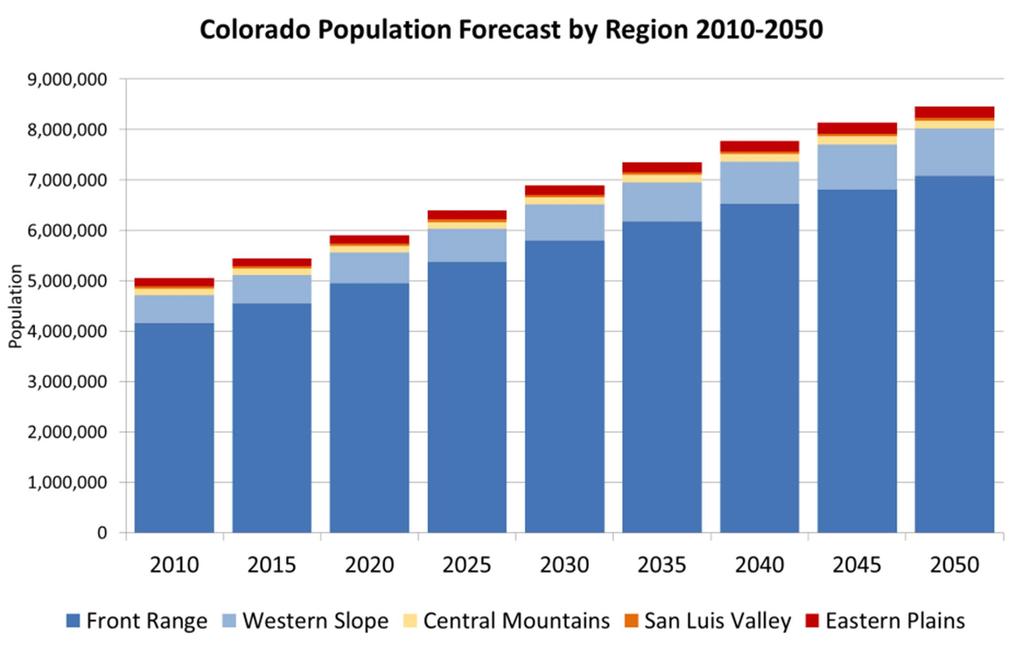
3 Big Picture Pop Change US million, million or.7% Colorado - 5,607,154 Ranked 9 th fastest 1.4% - ID, NV, UT, WA, FL 8 th in total growth 77,049 TX, FL, CA, WA, NC, GA, AZ Growth of 578,000 since 2010
4
5
6
7
8
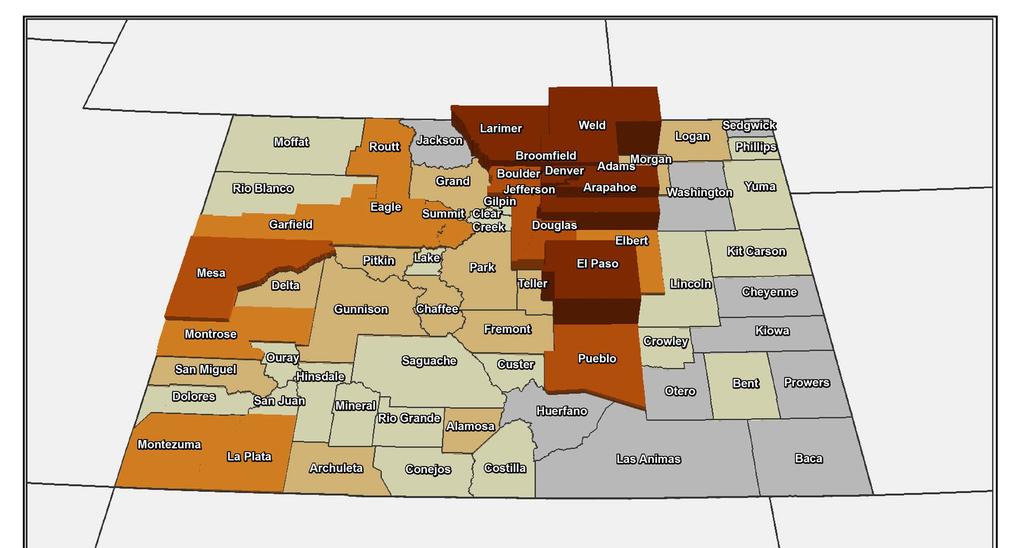
9 Total Population Areaname 2010 Tp16 Abs Change Ann Avg Pct Change Total Ch Pct Ch COLORADO 5,050,332 5,538, , % 90, % ADAMS 443, ,673 53, % 7, % ARAPAHOE 574, ,254 62, % 8, % BOULDER 295, ,989 26, % 3, % BROOMFIELD 56,107 66,252 10, % 1, % DENVER 604, ,292 88, % 12, % DOUGLAS 287, ,330 41, % 6, % JEFFERSON 535, ,711 36, % 7, % LARIMER 300, ,663 38, % 5, % WELD 254, ,397 40, % 9, %
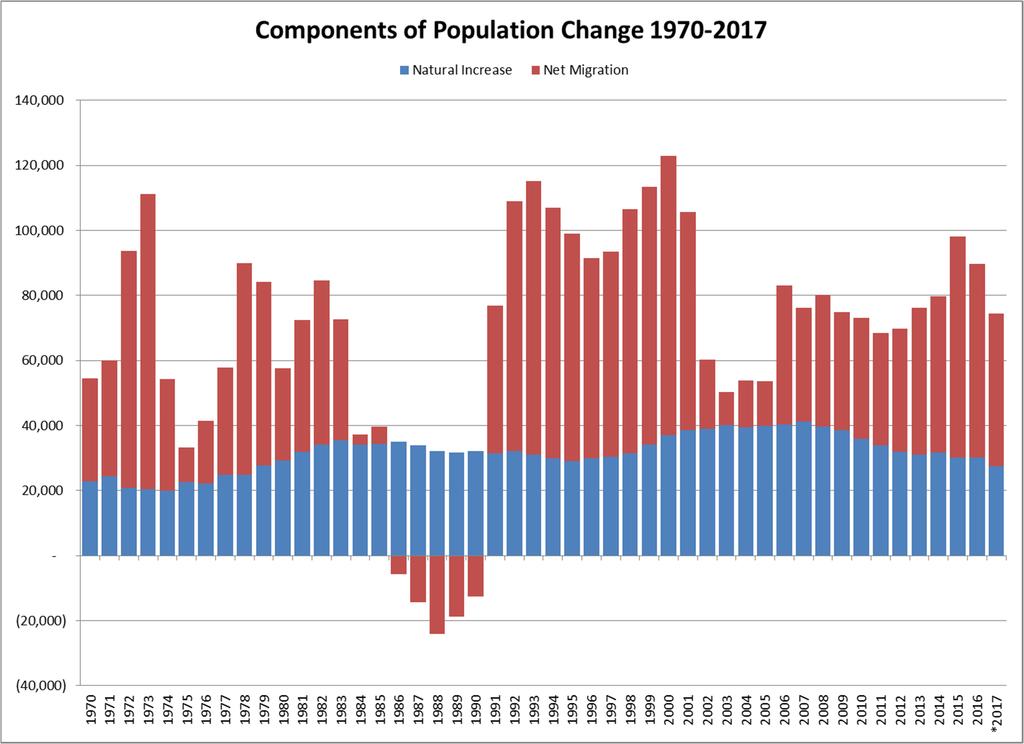
10 Population Change Change Ann. Ave % Ch BOULDER 295, ,989 26, % Boulder 97, ,789 9, % Erie (Part) 8,409 9,769 1, % Jamestown (27) -1.7% Lafayette 24,553 28,326 3, % (Part) 86,409 93,254 6, % Louisville 18,412 20,643 2, % Lyons 2,038 1,923 (115) -1.0% Nederland 1,447 1, % Superior (Part) 12,501 13, % Ward % Unincorp. Area 43,484 45,173 1, %
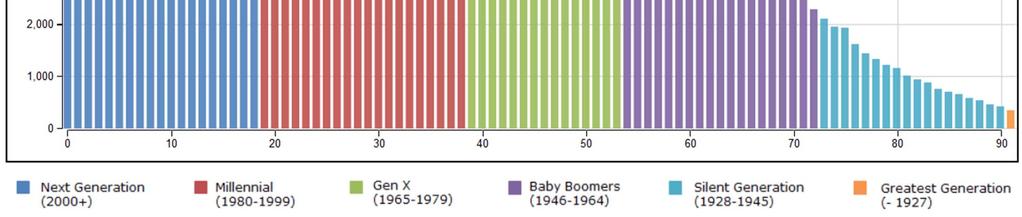
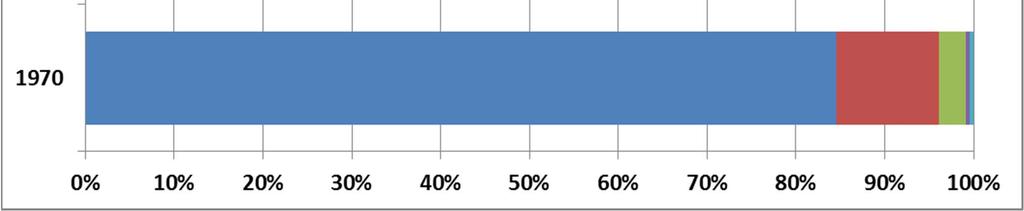
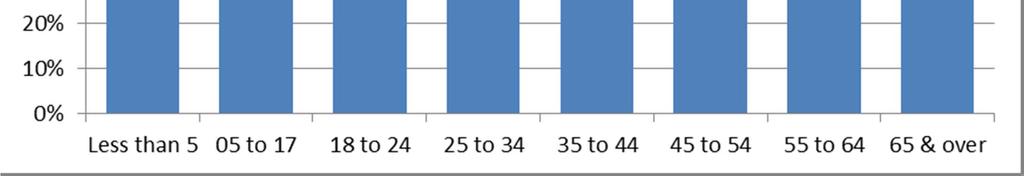
11 Age
12
13

14 100,000 80,000 Colorado New Jobs and Net Migration New Jobs Net Migration 60,000 40,000 20, ,000 40,000 Source: State Demography Office


15 Employment Change by Sector 2016 vs. Pre recession Peak Health Services Government Professional & Technical services Accommodation & Food Education Other Services Admin & Waste Retail Trade Transportation & warehousing Arts, Entertainment & Rec. Management of Companies Agriculture Real estate Wholesale trade Utilities Financial Activities Manufacturing Mining Information Construction 20, ,000 40,000 60,000 80, ,000
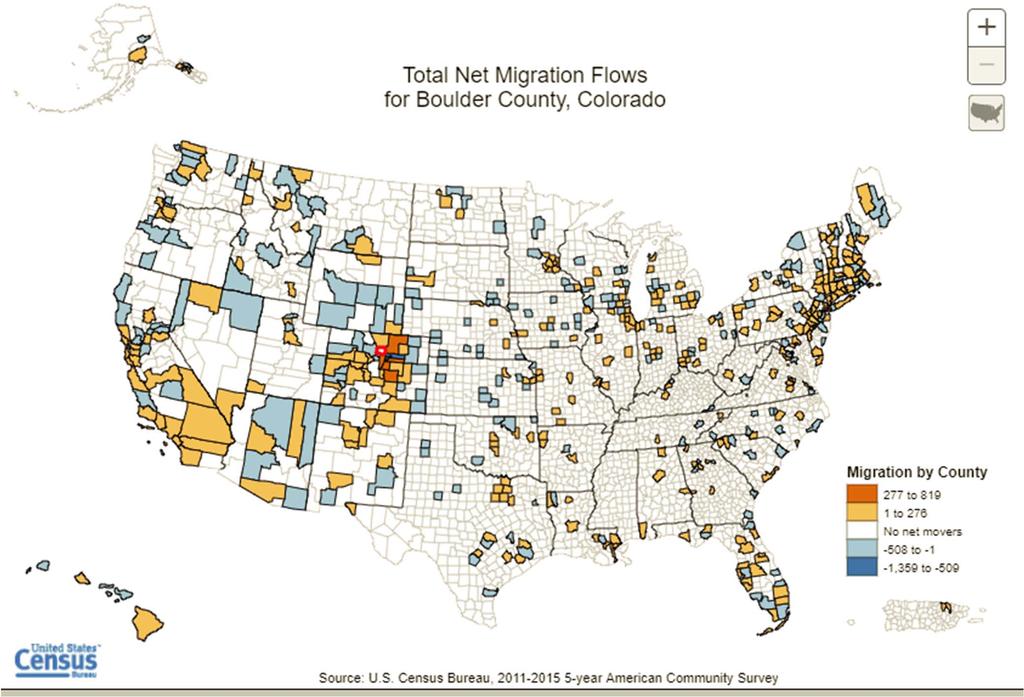
16 Migration Characteristics Boulder Current In Migrants Never married 28% 63% Now married 55% 26% Divorced 11% 8% Separated Widowed 1% 4% 1% 2% Income by Geographic Mobility Boulder Current In Migrant No income 10% 12% $1 to $9,999 or loss 15% 32% $10,000 to $14,999 7% 9% $15,000 to $24,999 11% 12% $25,000 to $34,999 10% 8% $35,000 to $49,999 11% 9% $50,000 to $64,999 9% 5% $65,000 to $74,999 $75,000 or more 4% 23% 2% 10%
17 AGE MATTERS Why? Preferences Housing Income Service Demands Labor Force
18
19
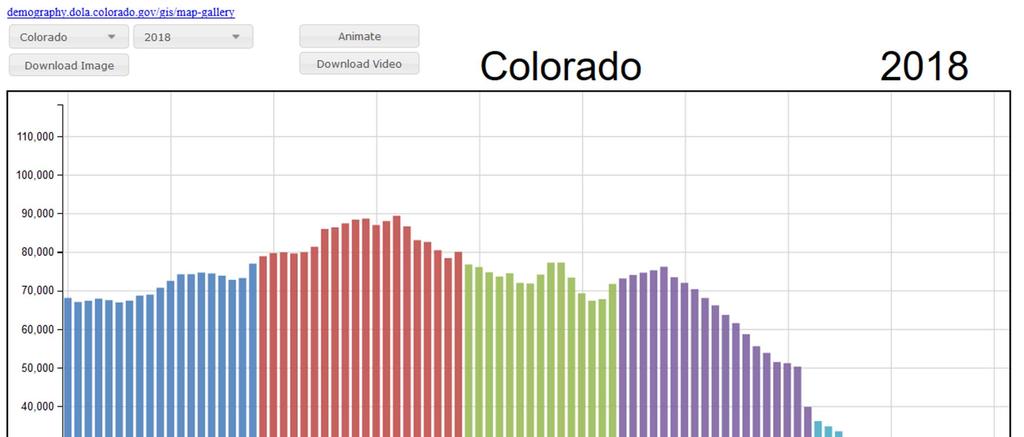
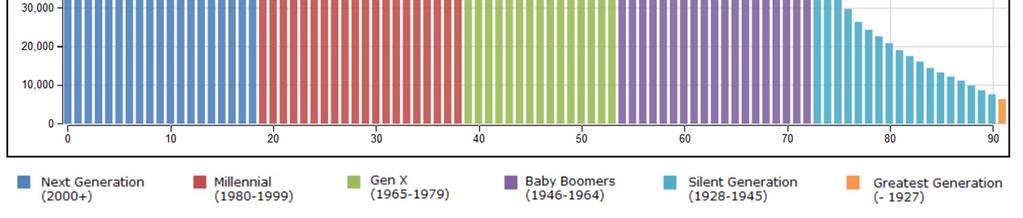
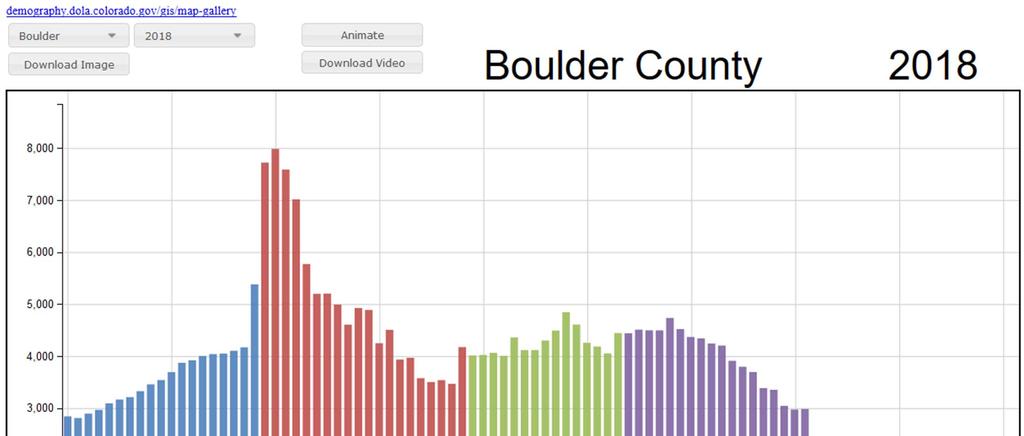
20 We Are Aging Fast.. Currently very few people over the age th lowest share of all states in US (13%) in rd fastest growth in the US Baby Boomers Born ,360,000 Boomers in Colorado (25% of pop. in 2015) increase 719,000 to 1,270,000. or 77% (primarily from aging) Transition age distribution from young to more US average between 2015 and State Demography Office, Census Bureau


21 Growth in young adults due to migration Demographic Dividend Aging AGE

22 Source: State Demography Office, 2015
23
24
25
26 Aging Issues Numbers Economic Driver - wealthier. depends Impact on occupational mix. Growing at 6% per year Labor Force Housing Non - movers Income Downward Pressure Health Disabilities Transportation Public Finance Downward Pressure
27 Working Age Population in Colorado Colorado s population of working age will continue to grow more slowly than Colorado s population as a whole.
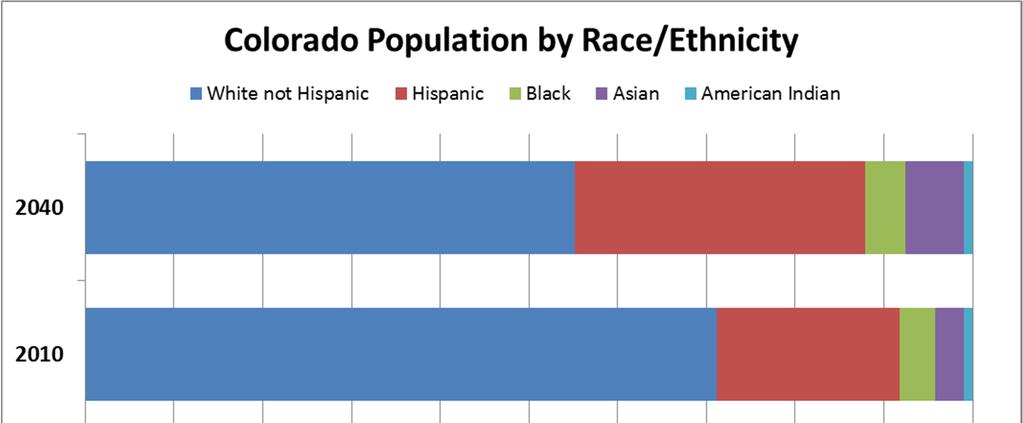
28 Ethnicity/Race increasing
29

30 Census Bureau
31 Share of Net Increase in Working Age Population, American Indian, NH Black, NH White, NH Asian, NH Hispanic 0% 20% 40% 60% 80%
32 Growth is Slowing
33 Population forecast methodology Economic forecast Jobs -2 nd & 3 rd job - Commuters Cohort-component +Births - Deaths + Net Migration X LFPR Labor Demand Labor Supply Differences resolved by net migration


34 Colorado and U.S. Growth Rates US forecast prepared by U.S. Bureau of the Census, 2014.
35

36
37 Population Forecast Total Ch Ann Ave. Pct Ch Adams 489, , , , , % Arapahoe 629, , , , , % Boulder 318, , , ,540 96, % Broomfield 64,656 75,627 96,097 97,318 32, % Denver 680, , , , , % Douglas 322, , , , , % Jefferson 564, , , , , % Larimer 332, , , , , % Weld 284, , , , , % El Paso 676, , , , , %
38 Risks (plus or minus) National Growth National Policies Intl immigration Water Housing supply, price, type, location Infrastructure/Transportation State Budget/Policy Aging labor force, prepared labor force Industry changes downturn, bust, recession, competitiveness. Natural disasters - nationally
39 Is Affordability a Concern? Change in Median Home Value District of Columbia 125,200 Nevada (71,800) Colorado 80,300 California (54,800) North Dakota 77,300 Rhode Island (45,100) Montana 47,200 New Jersey (44,100) South Dakota 42,000 Maryland (40,100) Change in Median Household Income District of Columbia 21,189 Nevada 118 North Dakota 16,903 Puerto Rico 2,337 Massachusetts 12,932 Florida 3,056 Alaska 12,107 Arizona 3,669 Washington 11,515 Louisiana 4,220 Colorado 10,473 Change in Median Home Value - Median Household Income District of Columbia 104,011 Nevada (71,918) Colorado 69,827 California (62,591) North Dakota 60,397 New Jersey (53,191) Montana 40,704 Rhode Island (52,128) Texas 31,583 Maryland (50,965) Source: American Community Survey 2007, 2016
40 Summary Trends Disparate growth what is causing it and what can be done? Can linkages be created between Metro and Non- Metro. Migration how do we attract the best fit for the jobs and where do we house them? What if we can t attract? Aging we are getting old fast, is the state ready for the opportunities and changes to the labor force, income, industrial mix, housing, etc. Colorado is becoming more racially and ethnically diverse, especially those currently under the age of 24. Continued growth but slowing.
41 Thank you State Demography Office Department of Local Affairs Elizabeth Garner Demography.dola.colorado.gov
Transitions. Population and Economic Trends For Northern Colorado
 Transitions Population and Economic Trends For Northern Colorado EDCC 2017 Elizabeth Garner State Demography Office Colorado Department of Local Affairs Demography.dola.colorado.gov Transitions to Watch
Colorado and Eagle County
 Colorado and Eagle County Population and Economic Transitions Vail Symposium 2017 Elizabeth Garner State Demography Office Colorado Department of Local Affairs Demography.dola.colorado.gov Ideas Demographics
Transitions. Population and Economic Trends for Colorado and Garfield County
 Transitions Population and Economic Trends for Colorado and Garfield County Elizabeth Garner State Demography Office Colorado Department of Local Affairs Summer 2016 www.colorado.gov/demography Main Points
Transitions. Population and Economic Trends for Colorado
 Transitions Population and Economic Trends for Colorado Cindy DeGroen State Demography Office Colorado Department of Local Affairs 2016 www.colorado.gov/demography State Demography Office State agency
POPULATION AND ECONOMIC OVERVIEW. State Demography Office Colorado Department of Local Affairs February 2014
 POPULATION AND ECONOMIC OVERVIEW State Demography Office Colorado Department of Local Affairs February 2014 Big Picture 2011-2012 Pop Change US 313 million, + 2.3 million or.7% Colorado 5,189,458, + 70,157
Regional Issues Forum Labor Force Trends in Northern Colorado
 Regional Issues Forum Labor Force Trends in Northern Colorado Elizabeth Garner State Demography Office Colorado Department of Local Affairs 2015 www.colorado.gov/demography Big Picture - 2013-2014 Pop
EBRI Databook on Employee Benefits Chapter 6: Employment-Based Retirement Plan Participation
 EBRI Databook on Employee Benefits Chapter 6: Employment-Based Retirement Plan Participation UPDATED July 2014 This chapter looks at the percentage of American workers who work for an employer who sponsors
Health and Health Coverage in the South: A Data Update
 February 2016 Issue Brief Health and Health Coverage in the South: A Data Update Samantha Artiga and Anthony Damico With its recent adoption of the Affordable Care Act (ACA) Medicaid expansion to adults,
Rifle city Demographic and Economic Profile
 Rifle city Demographic and Economic Profile Community Quick Facts Population (2014) 9,289 Population Change 2010 to 2014 156 Place Median HH Income (ACS 10-14) $52,539 State Median HH Income (ACS 10-14)
Town Profiles: Demographic, Economic, and Housing Statistics for De Smet City and Wall Town, SOuth Dakota
 South Dakota State University Open PRAIRIE: Open Public Research Access Institutional Repository and Information Exchange Census Data Center News Releases SDSU Census Data Center 12-7-2017 Town Profiles:
DEMOGRAPHY AND THE ECONOMY
 DEMOGRAPHY AND THE ECONOMY David Keyser State Demography Office September 22, 2011 Colorado.gov/demography Demography Powerful Big changes often predictable Informative Today Information about us Role
Minnesota s Economics & Demographics Looking To 2030 & Beyond. Tom Stinson, State Economist Tom Gillaspy, State Demographer July 2008
 Minnesota s Economics & Demographics Looking To 2030 & Beyond Tom Stinson, State Economist Tom Gillaspy, State Demographer July 2008 Minnesota Has Been Very Successful (Especially For A Cold Weather State
Health Insurance Coverage among Puerto Ricans in the U.S.,
 Health Insurance Coverage among Puerto Ricans in the U.S., 2010 2015 Research Brief Issued April 2017 By: Jennifer Hinojosa Centro RB2016-15 The recent debates and issues surrounding the 2010 Affordable
Household Income for States: 2010 and 2011
 Household Income for States: 2010 and 2011 American Community Survey Briefs By Amanda Noss Issued September 2012 ACSBR/11-02 INTRODUCTION Estimates from the 2010 American Community Survey (ACS) and the
NORTH CENTRAL COLORADO
 DOLA Planning and Management Region 2 Socioeconomic Profile Regional Profile NORTH CENTRAL COLORADO The central work of the State Demography Office is the research and production of population data and
FUTURE LANDSCAPES. The effects of changing demographics. Background. Future landscapes: The effects of changing demographics February, 2007
 FUTURE LANDSCAPES The effects of changing demographics Background DRCOG Board Retreat 1 Our region is changing Demographic facts: Rapid growth of the older population Increasing immigration Flexible, creative
REBUILD & RECOVER. VEGAS HOUSING REPORT Suncoast Hotel & Casino April 22, Prepared by:
 REBUILD & RECOVER VEGAS HOUSING REPORT Suncoast Hotel & Casino April 22, 2014 Prepared by: REBUILD The Great Recovery continues moderately. Nevada Recovery Comparison: Last 11 Recessions % Job Losses Compared
Monte Vista Population, ,744 4,651 4,564 4,467 4,458 4,432 4,451
 1 Monte Vista 4,8 4,7 4,6 4,5 4,4 4,3 4,2 4,1 4,61 4,612 4,61 4,676 Monte Vista, 2-213 4,744 4,651 4,564 4,467 4,458 4,432 4,451 4,418 4,412 4,355 2 21 22 23 24 25 26 27 28 29 21 211 212 213 Year Monte
Health Coverage for the Black Population Today and Under the Affordable Care Act
 fact sheet Health Coverage for the Black Population Today and Under the Affordable Care Act July 2013 As of 2011, 37 million individuals living in the United States identified as Black or African American.
National Vital Statistics Reports
 National Vital Statistics Reports Volume 60, Number 9 September 14, 2012 U.S. Decennial Life Tables for 1999 2001: State Life Tables by Rong Wei, Ph.D., Office of Research and Methodology; Robert N. Anderson,
CENTER FOR ECONOMIC AND POLICY RESEARCH. Union Membership Byte 2018
 CEPR CENTER FOR ECONOMIC AND POLICY RESEARCH Union Membership Byte 2018 By Brian Dew* January 2018 Center for Economic and Policy Research 1611 Connecticut Ave. NW Suite 400 Washington, DC 20009 tel: 202-293-5380
medicaid a n d t h e How will the Medicaid Expansion for Adults Impact Eligibility and Coverage? Key Findings in Brief
 on medicaid a n d t h e uninsured July 2012 How will the Medicaid Expansion for Adults Impact Eligibility and Coverage? Key Findings in Brief Effective January 2014, the ACA establishes a new minimum Medicaid
Health Insurance Coverage: 2001
 Health Insurance Coverage: 200 Consumer Income Issued September 2002 P60-220 Reversing 2 years of falling uninsured rates, the share of the population without health insurance rose in 200. An estimated
Financing Unemployment Benefits in Today s Tough Economic Times
 Financing Unemployment Benefits in Today s Tough Economic Times Maurice Emsellem 7 th Annual Workers Voice State Legislative Issues Conference July 19, 2003. Today s Funding Situation The Good, the Bad
Age of Insured Discount
 A discount may apply based on the age of the insured. The age of each insured shall be calculated as the policyholder s age as of the last day of the calendar year. The age of the named insured in the
Issue Brief No Sources of Health Insurance and Characteristics of the Uninsured: Analysis of the March 2005 Current Population Survey
 Issue Brief No. 287 Sources of Health Insurance and Characteristics of the Uninsured: Analysis of the March 2005 Current Population Survey by Paul Fronstin, EBRI November 2005 This Issue Brief provides
TABLE OF CONTENTS INTRODUCTION... 1
 TABLE OF CONTENTS INTRODUCTION... GENERAL WORKFORCE TRENDS... 3 General Workforce Trends and Comparisons Overview... 5 State Government Employees to State Population... 6 State Government Full-Time Equivalent
A Study of Factors Impacting Resiliency
 A Study of Factors Impacting Resiliency Place cover image here Brian Lewandowski Associate Director, Business Research Division June 13, 2017 Project Team Colorado Research Team: Brian Lewandowski Richard
Financial Firsts: When Do People Take Their First Financial Steps? Appendix: Annotated Questionnaire 1
 Financial Firsts: When Do People Take Their First Financial Steps? Appendix: Annotated Questionnaire 1 Conducted for AARP by at the University of Chicago through the Amerispeak Panel Interviews: 946 adults
BY THE NUMBERS 2016: Another Lackluster Year for State Tax Revenue
 BY THE NUMBERS 2016: Another Lackluster Year for State Tax Revenue Jim Malatras May 2017 Lucy Dadayan and Donald J. Boyd 2016: Another Lackluster Year for State Tax Revenue Lucy Dadayan and Donald J. Boyd
Basic Economic Security in the United States: How Much Income Do Working Adults Need in Each State?
 IWPR R590 October 2018 Basic Economic Security in the United States: How Much Income Do Working Adults Need in Each State? Economic security is a critical part of the overall health and well-being of women,
Uninsured Children : Charting the Nation s Progress
 Uninsured Children 2009-2011: Charting the Nation s Progress by Joan Alker, Tara Mancini, and Martha Heberlein Key Findings 1. 2. 3. While nationally children s coverage rates continued to improve, more
City of Edmonton Population Change by Age,
 Population Change by Age, 1996-2001 2001 Edmonton Demographic Profile The City of Edmonton s 2001population increased by 49,800 since the 1996 census. Migration figures are not available at the municipal
NCSL Midwest States Fiscal Leaders Forum. March 10, 2017
 NCSL Midwest States Fiscal Leaders Forum March 10, 2017 Public Pensions: 50-State Overview David Draine, Senior Officer Public Sector Retirement Systems Project The Pew Charitable Trusts More than 40 active,
ACORD Forms in ebixasp (03/2004)
") ACORD Forms in ebixasp (03/2004) Form number Form Name Edition Date 1 Property Loss Notice 2002/1 2 Automobile Loss Notice 2002/1 3 General Liability Notice of Occurrence/Claim 2002/1 4 Workers Compensation
ACORD Forms in ebixasp (03/2004) Form number Form Name Edition Date 1 Property Loss Notice 2002/1 2 Automobile Loss Notice 2002/1 3 General Liability Notice of Occurrence/Claim 2002/1 4 Workers Compensation
TABLE OF CONTENTS INTRODUCTION... 1
 TABLE OF CONTENTS INTRODUCTION... GENERAL WORKFORCE TRENDS... 3 General Workforce Trends and Comparisons Overview... 5 State Government Employees to State Population... 6 State Government Full-Time Equivalent
CHAPTER 6. The Economic Contribution of Hospitals
 CHAPTER 6 The Economic Contribution of Hospitals Chart 6.1: National Health Expenditures as a Percentage of Gross Domestic Product and Breakdown of National Health Expenditures, 2014 U.S. GDP 2014 $3.03
TABLE OF CONTENTS INTRODUCTION... 1
 TABLE OF CONTENTS INTRODUCTION... GENERAL WORKFORCE TRENDS... 3 General Workforce Trends and Comparisons Overview... 5 State Government Employees to State Population... 6 State Government Full-Time Equivalent
The Office of Advocacy
 The Office of Advocacy Created by Congress in 1976, the Office of Advocacy of the U.S. Small Business Administration (SBA) is an independent voice for small business within the federal government. Appointed
State, Local and Net Tuition Revenue Supporting General Operating Expenses of Higher Education, U.S., Fiscal Year 2010, Current (unadjusted) Dollars
 Dollars") State, Local and Net Tuition Revenue Supporting General Operating Expenses of Higher Education, U.S., Fiscal Year 2010, Current (unadjusted) Dollars Net Tuition $51.3 Billion 37% All State Support $73.7
State, Local and Net Tuition Revenue Supporting General Operating Expenses of Higher Education, U.S., Fiscal Year 2010, Current (unadjusted) Dollars Net Tuition $51.3 Billion 37% All State Support $73.7
Children s Health Insurance Coverage in the United States from
 Despite Economic Challenges, Progress Continues: Children s Health Insurance Coverage in the United States from 2008-2010 Key Findings 1. 2. 3. New data allows for a closer examination of how states are
Growing Slowly, Getting Older:*
 Growing Slowly, Getting Older:* Demographic Trends in the Third District States BY TIMOTHY SCHILLER N ational trends such as slower population growth, an aging population, and immigrants as a larger component
Demographic and Economic Profile. Nevada. Updated May 2006
 Demographic and Economic Profile Nevada Updated May 2006 Metro and Nonmetro Counties in Nevada Based on the most recent listing of core based statistical areas by the Office of Management and Budget (December
State Postal Abbreviation Codes
 State Postal Areviation Codes State Areviation State Areviation Alaama AL Montana MT Alaska AK Neraska NE Arizona AZ Nevada NV Arkansas AR New Hampshire NH California CA New Jersey NJ Colorado CO New Mexico
Regional Socio-Economic Profile
 Overview The central work of the State Demography Office is the research and production of population data and information and of the forces (fertility, mortality, migration) that lead to population change.
TABLE OF CONTENTS INTRODUCTION... 1
 TABLE OF CONTENTS INTRODUCTION... GENERAL WORKFORCE TRENDS... 3 General Workforce Trends and Comparisons Overview... 5 State Government Employees to State Population... 6 State Government Full-Time Equivalent
ACORD Forms Updated in AMS R1
 ACORD Forms Updated in AMS360 2017 R1 The following forms will use the ACORD form viewer, also new in this release. Forms with an indicate they were added because of requests in the Product Enhancement
SOUTHERN NEVADA 2015 ECONOMIC OUTLOOK
 SOUTHERN NEVADA 2015 ECONOMIC OUTLOOK NAIOP Washington D.C. Legislative Retreat February 9-11, 2015 Prepared by: ECONOMIC OVERVIEW 2 Nevada job recovery from Great Recession after 90 months. Nevada Recession
Update: 50-State Survey of Retiree Health Care Liabilities Most recent data show changes to benefits, funding policies could help manage rising costs
 A fact sheet from Dec 2018 Update: 50-State Survey of Retiree Health Care Liabilities Most recent data show changes to benefits, funding policies could help manage rising costs Getty Images Overview States
36 Million Without Health Insurance in 2014; Decreases in Uninsurance Between 2013 and 2014 Varied by State
 36 Million Without Health Insurance in 2014; Decreases in Uninsurance Between 2013 and 2014 Varied by State An estimated 36 million people in the United States had no health insurance in 2014, approximately
Measuring the Recession: An Impact Index
 Measuring the Recession: An Impact Index October 2009 65 Broadway, Suite 1800, New York NY 10006 (212) 248-2785 www.centerforsocialinclusion.org 1 Executive Summary Across America people have been hit
Highlights. Percent of States with a Decrease in MH Expenditures from Prior Year: FY2001 to 2010
 FY 2010 State Mental Health Revenues and Expenditures Information from the National Association of State Mental Health Program Directors Research Institute, Inc (NRI) Sept 2012 Highlights SMHA Funding
CURRENT DEMOGRAPHICS & CONTEXT GROWTH FORECAST SOUTHERN CALIFORNIA ASSOCIATION OF GOVERNMENTS APPENDIX
 CURRENT DEMOGRAPHICS & CONTEXT GROWTH FORECAST SOUTHERN CALIFORNIA ASSOCIATION OF GOVERNMENTS APPENDIX PROPOSED FINAL MARCH 2016 INTRODUCTION 1 FORECASTING PROCESS 1 GROWTH TRENDS 2 REGIONAL GROWTH FORECAST
Required Training Completion Date. Asset Protection Reciprocity
 Completion Alabama Alaska Arizona Arkansas California State Certification: must complete initial 16 hours (8 hrs of general LTC CE and 8 hrs of classroom-only CE specifically on the CA for LTC prior to
Final Paycheck Laws by State
 ALABAMA AL No Provision No Provision ALASKA AK 23.05.140(b) ARIZONA AZ Ariz. Rev. Stat. 23-350, 23-353 ARKANSAS AR Ark. Code Ann. 11-4-405 CALIFORNIA CA Cal. Lab. Code 201 to 202, 227.3 COLORADO CO Colo.
September Turning 65. Beyond a Rite of Passage. A nonprofit service and advocacy organization National Council on Aging
 September 2012 Turning 65 Beyond a Rite of Passage 1 Cumulatively 31.4 million adults will turn 65 between 2012 and 2020 4,000,000 3,900,000 Turning 65 by Year 3.8 M 3,800,000 3,700,000 3,600,000 3,500,000
While one in five Californians overall is uninsured, the rate among those who work is even higher: one in four.
 : By the Numbers December 2013 Introduction California had the greatest number of uninsured residents of any state, 7 million, and the seventh largest percentage of uninsured residents under 65 in the
STATE TAX WITHHOLDING GUIDELINES
 STATE TAX WITHHOLDING GUIDELINES ( Guardian Insurance & Annuity Company, Inc. and Guardian Life Insurance Company of America (hereafter collectively referred to as Company )) (Last Updated 11/2/215) state
Installment Loans CHARTS. No cap other than unconscionability:
 NCLC NATIONAL CONSUMER LAW CENTER Installment Loans WILL STATES PROTECT BORROWERS FROM A NEW WAVE OF PREDATORY LENDING? Copyright 2015, National Consumer Law Center, Inc. CHARTS CHART 1 Full APRs Allowed
State Individual Income Taxes: Personal Exemptions/Credits, 2011
 Individual Income Taxes: Personal Exemptions/s, 2011 Elderly Handicapped Blind Deaf Disabled FEDERAL Exemption $3,700 $7,400 $3,700 $7,400 $0 $3,700 $0 $0 $0 $0 Alabama Exemption $1,500 $3,000 $1,500 $3,000
NASRA Issue Brief: Employee Contributions to Public Pension Plans
 NASRA Issue Brief: Employee Contributions to Public Pension Plans September 2017 Unlike in the private sector, nearly all employees of state and local government are required to share in the cost of their
Undocumented Immigrants are:
 Immigrants are: Current vs. Full Legal Status for All Immigrants Appendix 1: Detailed State and Local Tax Contributions of Total Immigrant Population Current vs. Full Legal Status for All Immigrants
Metro Houston Population Forecast
 Metro Houston Population Forecast Projections to 2050 Prepared by the Greater Houston Partnership Research Department Data from Texas Demographic Center www.houston.org April 2017 Greater Houston Partnership
From Crisis to Transition Demographic trends and American housing futures, with lessons from Texas
 From Crisis to Transition Demographic trends and American housing futures, with lessons from Texas Rolf Pendall, Ph.D. The Urban Institute Presentation to the Bipartisan Housing Commission, San Antonio,
Income from U.S. Government Obligations
 Baird s ----------------------------------------------------------------------------------------------------------------------------- --------------- Enclosed is the 2017 Tax Form for your account with
The Puzzling Decline in State Sales Tax Collections
 The Puzzling Decline in State Sales Tax Collections Introduction This is the first of a series of papers that will investigate fiscal problems confronting the states. In spite of low unemployment rates,
State Retiree Health Care Liabilities: An Update Increased obligations in 2015 mirrored rise in overall health care costs
 A brief from Sept 207 State Retiree Health Care Liabilities: An Update Increased obligations in 205 mirrored rise in overall health care costs Overview States paid a total of $20.8 billion in 205 for nonpension
TOP EMPLOYERS ARMY 12.2% NAVY 10.9% AIR FORCE 8.4% JUSTICE 5.9% AGRICULTURE 3.8% OTHER 18.3% CLERICAL
 Federal Workforce 2019 The federal government employs about 2 million people who provide a wide array of critical services to the American public, from defending our national security to responding to
Issue Brief. Sources of Health Insurance and Characteristics of the Uninsured: Analysis of the March 1999 Current Population Survey
 January 2000 Jan. Sources of Health Insurance and Characteristics of the Uninsured: Analysis of the March 1999 Current Population Survey by Paul Fronstin, EBRI EBRI EMPLOYEE BENEFIT RESEARCH INSTITUTE
Census Data on Health Insurance Coverage of Women and Children. Highlights of National Data for 2009
 March of Dimes Foundation Office of Government Affairs 1401 K Street, NW, Suite 900 Washington, DC 20005 Telephone (202) 659-1800 Fax (202) 296-2964 marchofdimes.com nacersano.org Census Data on Health
EMPLOYMENT COST INDEX MARCH 2011
 Transmission of material in this release is embargoed until 8:30 a.m. (EDT) Friday, April 29, USDL-11-0586 Technical information: Media contact: (202) 691-6199 NCSinfo@bls.gov www.bls.gov/ect (202) 691-5902
The Economics of Homelessness
 15 The Economics of Homelessness Despite frequent characterization as a psychosocial problem, the problem of homelessness is largely economic. People who become homeless have insufficient financial resources
Federal Reserve Bank of Dallas. July 15, 2005 SUBJECT. Banking Agencies Issue Host State Loan-to-Deposit Ratios DETAILS
 Federal Reserve Bank of Dallas 2200 N. PEARL ST. DALLAS, TX 75201-2272 July 15, 2005 Notice 05-37 TO: The Chief Executive Officer of each financial institution and others concerned in the Eleventh Federal
(In effect as of January 1, 2006*) TABLE 17. OFFSET PROVISIONS IN STATE WORKERS' COMPENSATION LAWS
 TABLE 17. OFFSET PROVISIONS IN STATE WORKERS' COMPENSATION LAWS") (In effect as of January 1, 2006*) TABLE 17. OFFSET PROVISIONS IN STATE WORKERS' COMPENSATION LAWS ALASKA Section 23.30.224--When public employees receive total disability compensation, compensation is
(In effect as of January 1, 2006*) TABLE 17. OFFSET PROVISIONS IN STATE WORKERS' COMPENSATION LAWS ALASKA Section 23.30.224--When public employees receive total disability compensation, compensation is
Unionization Trends in Ohio and the U.S.
 February, 2011 Unionization Trends in Ohio and the U.S. Prepared by Felicia Bernardini, MPA,SPHR Maria L. Mone, JD, MPA The Ohio State University The John Glenn School of Public Affairs Management Development
TThe Supplemental Nutrition Assistance
 STATE SUPPLEMENTAL NUTRITION ASSISTANCE PROGRAM PARTICIPATION RATES IN 2010 TThe Supplemental Nutrition Assistance Program (SNAP) is a central component of American policy to alleviate hunger and poverty.
Minnesota Energy Industry
 Energy Industry Jobs Q3 2000 Q3 2001 Q3 2002 Q3 2003 Q3 2004 Q3 2005 Q3 2006 Q3 2007 Q3 2008 Q3 2009 Q3 2010 Q3 2011 Q3 Q3 Q3 Q3 Q3 2016 Minnesota Energy Consortium April 13, 2017 Cameron Macht DEED Labor
Transmission of material in this release is embargoed until 8:30 a.m. (EDT) Wednesday, October 31, 2012
 Wednesday, October 31, 2012") Transmission of material in this release is embargoed until 8:30 a.m. (EDT) Wednesday, October 31, USDL-12-2162 Technical information: Media contact: (202) 691-6199 NCSinfo@bls.gov www.bls.gov/ect (202)
Transmission of material in this release is embargoed until 8:30 a.m. (EDT) Wednesday, October 31, USDL-12-2162 Technical information: Media contact: (202) 691-6199 NCSinfo@bls.gov www.bls.gov/ect (202)
Demographic Future of the Southern California Region
 Demographic Future of the Southern California Region Simon Choi, Ph.D Chief of Research & Forecasting Southern California Association of Governments(SCAG) Southern California Water Dialogue, Metropolitan
Q309 NATIONAL DELINQUENCY SURVEY FROM THE MORTGAGE BANKERS ASSOCIATION. Data as of September 30, 2009
 NATIONAL DELINQUENCY SURVEY FROM THE MORTGAGE BANKERS ASSOCIATION Q309 Data as of September 30, 2009 2009 Mortgage Bankers Association (MBA). All rights reserved, except as explicitly granted. Data are
Health Insurance Price Index for October-December February 2014
 Health Insurance Price Index for October-December 2013 February 2014 ehealth 2.2014 Table of Contents Introduction... 3 Executive Summary and Highlights... 4 Nationwide Health Insurance Costs National
Residual Income Requirements
 Residual Income Requirements ytzhxrnmwlzh Ch. 4, 9-e: Item 44, Balance Available for Family Support (04/10/09) Enter the appropriate residual income amount from the following tables in the guideline box.
Nation s Uninsured Rate for Children Drops to Another Historic Low in 2016
 Nation s Rate for Children Drops to Another Historic Low in 2016 by Joan Alker and Olivia Pham The number of uninsured children nationwide dropped to another historic low in 2016 with approximately 250,000
Data Note: What if Per Enrollee Medicaid Spending Growth Had Been Limited to CPI-M from ?
 Data Note: What if Per Enrollee Medicaid Spending Growth Had Been Limited to CPI-M from 2001-2011? Rachel Garfield, Robin Rudowitz, and Katherine Young Congress is currently debating the American Health
UNBIASED AND UNFILTERED: THE REAL IMPACT OF THE AFFORDABLE CARE ACT ON INSURANCE COVERAGE, ATTITUDES AND OPINIONS
 UNBIASED AND UNFILTERED: THE REAL IMPACT OF THE AFFORDABLE CARE ACT ON INSURANCE COVERAGE, ATTITUDES AND OPINIONS JULY 10, 2014 Dan Witters Research Director, Gallup-Healthways Well-Being Index TODAY S
Q209 NATIONAL DELINQUENCY SURVEY FROM THE MORTGAGE BANKERS ASSOCIATION. Data as of June 30, 2009
 NATIONAL DELINQUENCY SURVEY FROM THE MORTGAGE BANKERS ASSOCIATION Q209 Data as of June 30, 2009 2009 Mortgage Bankers Association (MBA). All rights reserved, except as explicitly granted. Data are from
Utah s Long Run Demographic Trends: Evolving Community Contexts
 Utah s Long Run Demographic Trends: Evolving Community Contexts Pamela S. Perlich, Ph.D. Director, Demographic Research Kem C. Gardner Policy Institute, University of Utah GROWTH Intermountain States Population:
kaiser medicaid and the uninsured commission on The Cost and Coverage Implications of the ACA Medicaid Expansion: National and State-by-State Analysis
 kaiser commission on medicaid and the uninsured The Cost and Coverage Implications of the ACA Expansion: National and State-by-State Analysis Executive Summary John Holahan, Matthew Buettgens, Caitlin
Tassistance program. In fiscal year 1998, it represented 18.2 percent of all food stamp
 CHARACTERISTICS OF FOOD STAMP HOUSEHOLDS: FISCAL YEAR 1998 (Advance Report) United States Department of Agriculture Office of Analysis, Nutrition, and Evaluation Food and Nutrition Service July 1999 he
THREE DISPARATE CHICAGO-AREA HOUSING MARKETS
 Manufactured Housing Community Council ULI 2008 FALL MEETING MIAMI, FLA OCTOBER 27-28, 2008 Understanding Demographics/Market Analysis: THREE DISPARATE CHICAGO-AREA HOUSING MARKETS Three Disparate Chicago-area
Policy lessons from Illinois exodus of people and money By J. Scott Moody and Wendy P. Warcholik Illinois Policy Institute Senior Fellows
 ILLINOIS POLICY INSTITUTE SPECIAL REPORT JULY 2014 Policy lessons from Illinois exodus of people and money By J. Scott Moody and Wendy P. Warcholik Illinois Policy Institute Senior Fellows Executive summary
DATA AS OF SEPTEMBER 30, 2010
 NATIONAL DELINQUENCY SURVEY Q3 2010 DATA AS OF SEPTEMBER 30, 2010 2010 Mortgage Bankers Association (MBA). All rights reserved, except as explicitly granted. Data are from a proprietary paid subscription
Q3105 Which of the following, if any, apply to you? Please select all that apply.
 Q3105 Which of the following, if any, apply to you? Please select all that apply. Page 1 Married In Past 5 Years/ 328 266 76 Married In Next 12 14% 100% 100% Months (Net) I have gotten married in 266 266
Housing Market Update. September 23, 2013
 Housing Market Update September 23, 2013 Overview Housing market gradually recovering from the deepest and longest downturn since the Great Depression. Excess supply of housing largely worked off. Underlying
MASS LAYOFFS DECEMBER 2012 ANNUAL TOTALS 2012
 For release 10:00 a.m. (EST) Friday, January 25, 2013 USDL-13-0106 Technical information: (202) 691-6392 mlsinfo@bls.gov www.bls.gov/mls Media contact: (202) 691-5902 PressOffice@bls.gov MASS LAYOFFS DECEMBER
Demographic and Economic Profile. Florida. Updated May 2006
 Demographic and Economic Profile Florida Updated May 2006 Metro and Nonmetro Counties in Florida Based on the most recent listing of core based statistical areas by the Office of Management and Budget
Special Report. Sources of Health Insurance and Characteristics of the Uninsured EBRI EMPLOYEE BENEFIT RESEARCH INSTITUTE
 January 1993 Jan. Feb. Sources of Health Insurance and Characteristics of the Uninsured Analysis of the March 1992 Current Population Survey Mar. Apr. May Jun. Jul. Aug. EBRI EMPLOYEE BENEFIT RESEARCH
University of Wisconsin System SFS Business Process AP /1042s/Tax Bolt-On
 Contents 1099/1042-S Tax Bolt-On Process Overview... 1 Process Detail... 2 I. Search/Update for Existing Value 1099 / 1042 Records on the Bolt-On table... 2 II. Enter a New 1099/1042s records into the
Electronic Supplementary Material for the Article: The Impact of Internet Diffusion on Marriage Rates: Evidence from the Broadband Market
 Electronic Supplementary Material for the Article: The Impact of Internet Diffusion on Marriage Rates: Evidence from the Broadband Market By Andriana Bellou 1 Appendix A. Data Definitions and Sources This
Committee on Ways and Means Democrats
 DRAFT Committee on Ways and Means Democrats Representative Sandy Levin - Ranking Member Report November 7, 2013 Millions of Unemployed Americans Will Lose Benefits Unless Congress Acts Over 3 Million Will