Transitions. Population and Economic Trends For Northern Colorado
|
|
|
- Colin Hensley
- 5 years ago
- Views:
Transcription
1 Transitions Population and Economic Trends For Northern Colorado EDCC 2017 Elizabeth Garner State Demography Office Colorado Department of Local Affairs Demography.dola.colorado.gov
2 Transitions to Watch Disparate growth across state. Industrial transitions Retail consolidation Manufacturing more automation Transportation more automation Construction more automation Aging will impact economy. Increase racial and ethnic diversity Growing and slowing
3 Big Picture Pop Change US million, million or.7% Colorado - 5,540,500 Ranked 7 th fastest 1.7% - UT, NV, ID, FL, WA, OR 8 th absolute growth 91,700 TX, FL, CA, WA, AZ, NC, GA Range in Colorado +14,000-50

4

5

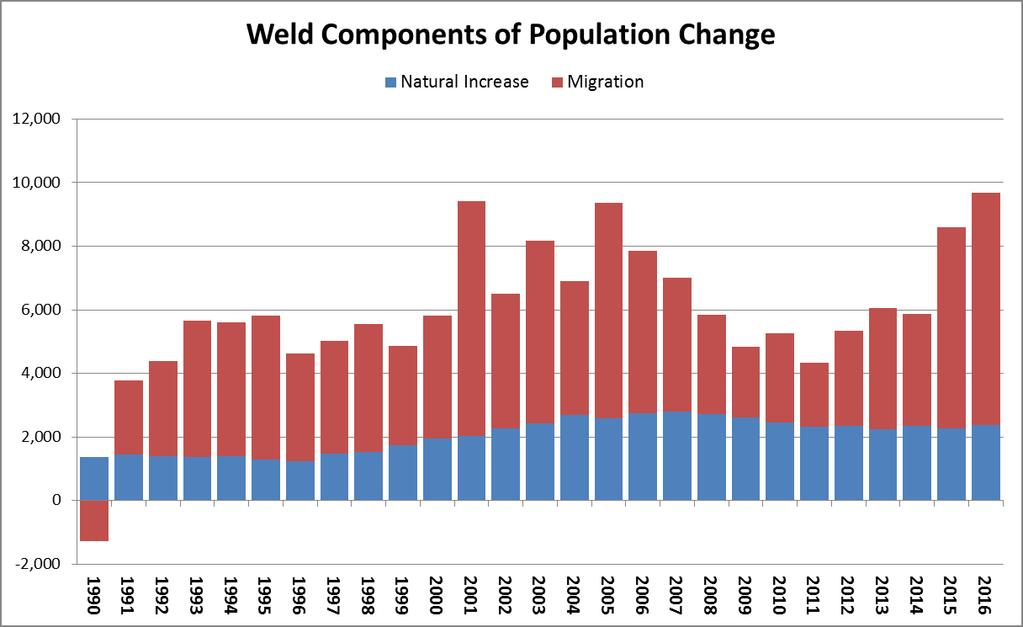
6 Weld 2 nd fastest and 6 th in total change since 2010 Larimer 5 th fastest and 7 th total since 2010

7
8 Age
9 Larimer Weld In Out Net Net Non CO In Out Net Net Non CO Weld Weld El Paso Texas Larimer Boulder Adams California Denver Boulder Jefferson California Adams Larimer Douglas South Carolina Boulder Denver Douglas Iowa Boulder Adams Pueblo Arizona Jefferson Arapahoe Collin TX Wyoming Jefferson Denver Larimer Wyoming El Paso Adams Taylor TX Massachusetts El Paso Jefferson Morgan Texas
10 100,000 80,000 Colorado New Jobs and Net Migration New Jobs Net Migration 60,000 40,000 20, ,000-40,000 State Demography Office v2015
11 Employment Transitions: Retail - Consolidation Manufacturing automation Transportation automation Warehousing - automation Larimer Weld NOCO NOCO Growth Total, All Industries 153, , ,318 48,005 Accommodation and Food Services 18,175 7,744 25,919 5,867 Administrative and Waste Services 8,518 5,688 14,206 2,220 Agriculture 798 3,982 4, Arts, Entertainment, and Recreation 3,006 1,213 4, Construction 10,426 9,410 19,836 6,026 Educational Services 17,295 9,289 26,584 2,573 Finance and Insurance 3,673 3,018 6, Health Care and Social Assistance 21,111 9,318 30,429 5,942 Information 2, , Management of Co ,442 2, Manufacturing 13,321 13,420 26,741 5,919 Mining, Oil, Gas 498 5,493 5,991 2,550 Other Services, Ex. Public Admin 4,314 2,347 6,661 1,392 Professional and Technical Services 10,662 2,587 13,249 2,524 Public Administration 7,926 5,210 13, Real Estate and Rental and Leasing 2,721 1,279 4, Retail Trade 18,582 10,062 28,644 4,585 Transportation and Warehousing 3,151 3,423 6,574 1,794 Utilities , Wholesale Trade 4,359 3,929 8,288 1,963 QCEW 2016 Annual


12 Economic Drivers Larimer Weld Basic/Driver 107,985 78,168 Local Resident Service 82,530 53,025 Ratio 76% 68%
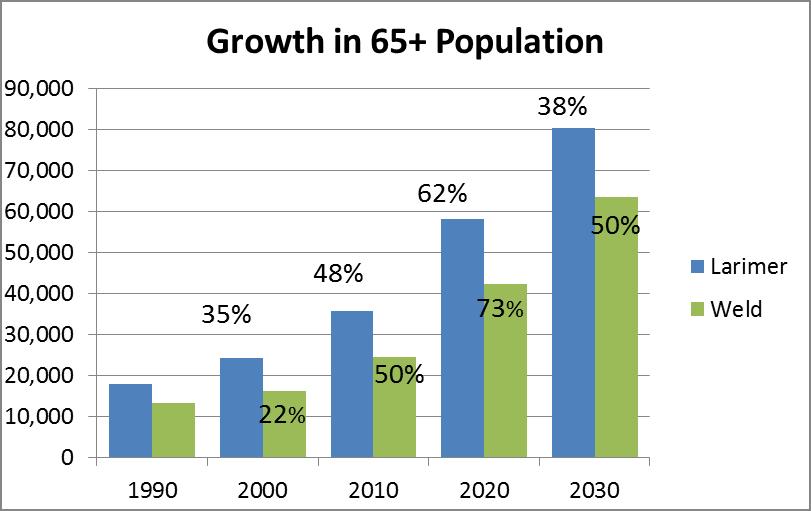
13 AGE
14 Why Are We Getting Old Fast? Currently very few people over the age th lowest share of all states in US (13%) in 2015 Baby Boomers Born ,360,000 Boomers in Colorado (25% of pop. in 2015) By 2030, Colorado s population 65+ will be 77% larger than it was in 2015 growing from 719,000 to 1,270,000. (primarily from aging) Transition age distribution from young to more US average between 2015 and State Demography Office, Census Bureau

15 Growth in young adults due to migration Demographic Dividend AGE
16 Aging
17 Aging Issues Numbers Economic Driver - wealthier. depends Impact on occupational mix Labor Force Housing Income Downward Pressure Health Disabilities Transportation Public Finance Downward Pressure
18 Labor Force Tightening Largest share of population in highest labor participation rates hit peak in Boomers aging out but many staying longer Participation rate of 65+ increase from 14% in 1990 to 19% 2010 Approx. 1,000,000 workers aging out the next 20 years. Largest increase in leavers between Female share of the labor force peaked in 2010 at 46%. Fewer Gen X Oldest Aged Industries - Education, Health, Utilities, Mining, Govt., Transportation. Higher un/under employment for year olds during recession. Lowest unemployment region in lowest unemployment state.

19 Median Home Value


20 Commuting to Jobs In Larimer and Weld 2014 Data Source:
21 More Racially and Ethnically Diverse

22 Census Bureau
23 Share of Net Increase in Working Age Population, American Indian, NH Black, NH White, NH Asian, NH Hispanic 0% 20% 40% 60% 80%
24 Growing and Slowing
25 100,000 80,000 Colorado New Jobs and Net Migration New Jobs Net Migration 60,000 40,000 20, ,000-40,000 State Demography Office v2015

26

27
28 Larimer and Weld Growth Rates

29 Forecast Fastest Region in State
30 Summary in Northern Colorado Migration how much, where, and can we compete for the best and the brightest? The Right Fit Aging we are getting old fast, is NOCO ready for the changes to the labor force, income, industrial mix (job growth), housing, etc. Ethnic/race diversity increasing and aging into labor force. Educational attainment gap continues putting downward pressure on income and labor force. Industrial transitions Ready for the transitions? What are your biggest risks or constraints? Automation, Consolidation - Retail Plan for the Transitions Discuss and Design, Implement when needed. What would we do if.
31 Thank you State Demography Office Department of Local Affairs Elizabeth Garner Demography.dola.colorado.gov
Colorado and Eagle County
 Colorado and Eagle County Population and Economic Transitions Vail Symposium 2017 Elizabeth Garner State Demography Office Colorado Department of Local Affairs Demography.dola.colorado.gov Ideas Demographics
Growing Colorado. Population Transitions In Boulder
 Growing Colorado Population Transitions In Boulder Elizabeth Garner State Demography Office Colorado Department of Local Affairs 2018 Demography.dola.colorado.gov Transitions to Watch Disparate growth
Transitions. Population and Economic Trends for Colorado and Garfield County
 Transitions Population and Economic Trends for Colorado and Garfield County Elizabeth Garner State Demography Office Colorado Department of Local Affairs Summer 2016 www.colorado.gov/demography Main Points
Regional Issues Forum Labor Force Trends in Northern Colorado
 Regional Issues Forum Labor Force Trends in Northern Colorado Elizabeth Garner State Demography Office Colorado Department of Local Affairs 2015 www.colorado.gov/demography Big Picture - 2013-2014 Pop
Transitions. Population and Economic Trends for Colorado
 Transitions Population and Economic Trends for Colorado Cindy DeGroen State Demography Office Colorado Department of Local Affairs 2016 www.colorado.gov/demography State Demography Office State agency
POPULATION AND ECONOMIC OVERVIEW. State Demography Office Colorado Department of Local Affairs February 2014
 POPULATION AND ECONOMIC OVERVIEW State Demography Office Colorado Department of Local Affairs February 2014 Big Picture 2011-2012 Pop Change US 313 million, + 2.3 million or.7% Colorado 5,189,458, + 70,157
Rifle city Demographic and Economic Profile
 Rifle city Demographic and Economic Profile Community Quick Facts Population (2014) 9,289 Population Change 2010 to 2014 156 Place Median HH Income (ACS 10-14) $52,539 State Median HH Income (ACS 10-14)
NORTH CENTRAL COLORADO
 DOLA Planning and Management Region 2 Socioeconomic Profile Regional Profile NORTH CENTRAL COLORADO The central work of the State Demography Office is the research and production of population data and
DEMOGRAPHY AND THE ECONOMY
 DEMOGRAPHY AND THE ECONOMY David Keyser State Demography Office September 22, 2011 Colorado.gov/demography Demography Powerful Big changes often predictable Informative Today Information about us Role
Monte Vista Population, ,744 4,651 4,564 4,467 4,458 4,432 4,451
 1 Monte Vista 4,8 4,7 4,6 4,5 4,4 4,3 4,2 4,1 4,61 4,612 4,61 4,676 Monte Vista, 2-213 4,744 4,651 4,564 4,467 4,458 4,432 4,451 4,418 4,412 4,355 2 21 22 23 24 25 26 27 28 29 21 211 212 213 Year Monte
Minnesota Energy Industry
 Energy Industry Jobs Q3 2000 Q3 2001 Q3 2002 Q3 2003 Q3 2004 Q3 2005 Q3 2006 Q3 2007 Q3 2008 Q3 2009 Q3 2010 Q3 2011 Q3 Q3 Q3 Q3 Q3 2016 Minnesota Energy Consortium April 13, 2017 Cameron Macht DEED Labor
ECONOMIC OUTLOOK GROWING BUT SLOWING. Chris Akers State Demography Office November 4, 2016
 z ECONOMIC OUTLOOK GROWING BUT SLOWING Chris Akers State Demography Office November 4, 2016 OVERVIEW Global Economic Outlook Better in 2017 U.S. Economic Overview Slowing Job Growth Colorado 2015 Economic
From Crisis to Transition Demographic trends and American housing futures, with lessons from Texas
 From Crisis to Transition Demographic trends and American housing futures, with lessons from Texas Rolf Pendall, Ph.D. The Urban Institute Presentation to the Bipartisan Housing Commission, San Antonio,
TABLE OF CONTENTS INTRODUCTION... 1
 TABLE OF CONTENTS INTRODUCTION... GENERAL WORKFORCE TRENDS... 3 General Workforce Trends and Comparisons Overview... 5 State Government Employees to State Population... 6 State Government Full-Time Equivalent
2016 Labor Market Profile
 2016 Labor Market Profile Prepared by The Tyler Economic Development Council Tyler Area Sponsor June 2016 The ability to demonstrate a regions availability of talented workers has become a vital tool
Regional Socio-Economic Profile
 Overview The central work of the State Demography Office is the research and production of population data and information and of the forces (fertility, mortality, migration) that lead to population change.
Monthly Rates. Plans A, F, High Deductible Plan F, G & N Effective January 1, 2012
 Administrative Office: PO Box 906, Oxnard, CA 90-906 Toll Free Telephone Number: -877-8-000 Effective January, 0 Premium Information We, Anthem, can only raise your premium if we raise the premium for
REGIONAL SNAPSHOT. Foothills Region, North Carolina
 REGIONAL SNAPSHOT Foothills Region, North Carolina Table of contents 01 Overview 04 Labor force 02 Demography 05 Industry and occupation 03 Human capital 01 overview Foothills Region, NC What is a regional
Economic Overview City of Tyler, TX. January 8, 2018
 Economic Overview City of Tyler, TX January 8, 2018 DEMOGRAPHIC PROFILE...3 EMPLOYMENT TRENDS...5 WAGE TRENDS...5 COST OF LIVING INDEX...6 INDUSTRY SNAPSHOT...7 OCCUPATION SNAPSHOT...9 INDUSTRY CLUSTERS...
Economic Overview York County, South Carolina. February 14, 2018
 Economic Overview York County, February 14, 2018 DEMOGRAPHIC PROFILE... 3 EMPLOYMENT TRENDS... 5 UNEMPLOYMENT RATE... 5 WAGE TRENDS... 6 COST OF LIVING INDEX... 6 INDUSTRY SNAPSHOT... 7 OCCUPATION SNAPSHOT...
BROWARD COUNTY LABOR FORCE
 BROWARD COUNTY LABOR FORCE Broward County s has a workforce of 978,000 people, including 54,000 self-employed. Twenty-three percent of residents commute to a job outside Broward County and five percent
Demographic and Economic Profile. Nevada. Updated May 2006
 Demographic and Economic Profile Nevada Updated May 2006 Metro and Nonmetro Counties in Nevada Based on the most recent listing of core based statistical areas by the Office of Management and Budget (December
TABLE OF CONTENTS INTRODUCTION... 1
 TABLE OF CONTENTS INTRODUCTION... GENERAL WORKFORCE TRENDS... 3 General Workforce Trends and Comparisons Overview... 5 State Government Employees to State Population... 6 State Government Full-Time Equivalent
TABLE OF CONTENTS INTRODUCTION... 1
 TABLE OF CONTENTS INTRODUCTION... GENERAL WORKFORCE TRENDS... 3 General Workforce Trends and Comparisons Overview... 5 State Government Employees to State Population... 6 State Government Full-Time Equivalent
CURRENT DEMOGRAPHICS & CONTEXT GROWTH FORECAST SOUTHERN CALIFORNIA ASSOCIATION OF GOVERNMENTS APPENDIX
 CURRENT DEMOGRAPHICS & CONTEXT GROWTH FORECAST SOUTHERN CALIFORNIA ASSOCIATION OF GOVERNMENTS APPENDIX PROPOSED FINAL MARCH 2016 INTRODUCTION 1 FORECASTING PROCESS 1 GROWTH TRENDS 2 REGIONAL GROWTH FORECAST
Town Profiles: Demographic, Economic, and Housing Statistics for De Smet City and Wall Town, SOuth Dakota
 South Dakota State University Open PRAIRIE: Open Public Research Access Institutional Repository and Information Exchange Census Data Center News Releases SDSU Census Data Center 12-7-2017 Town Profiles:
Economic Overview New York
 Report created on October 20, 2015 Economic Overview Created using: Contact: Lisa.Montiel@suny.edu DEMOGRAPHIC PROFILE...3 EMPLOYMENT TRENDS...5 UNEMPLOYMENT RATE...5 WAGE TRENDS...6 COST OF LIVING INDEX...6
TABLE OF CONTENTS INTRODUCTION... 1
 TABLE OF CONTENTS INTRODUCTION... GENERAL WORKFORCE TRENDS... 3 General Workforce Trends and Comparisons Overview... 5 State Government Employees to State Population... 6 State Government Full-Time Equivalent
Economic Overview. Lawrence, KS MSA
 Economic Overview Lawrence, KS MSA March 5, 2019 DEMOGRAPHIC PROFILE... 3 EMPLOYMENT TRENDS... 5 UNEMPLOYMENT RATE... 5 WAGE TRENDS... 6 COST OF LIVING INDEX... 7 INDUSTRY SNAPSHOT... 8 OCCUPATION SNAPSHOT...
Texas Mid-Year Economic Outlook: Strong Growth Continues
 Texas Mid-Year Economic Outlook: Strong Growth Continues Keith Phillips Assistant Vice President and Senior Economist 9/27/18 The views expressed in this presentation are strictly those of the presenter
Economic Overview Long Island
 Report created on October 20, 2015 Economic Overview Long Island Created using: Contact: Lisa.Montiel@suny.edu DEMOGRAPHIC PROFILE...3 EMPLOYMENT TRENDS...5 UNEMPLOYMENT RATE...5 WAGE TRENDS...6 COST OF
City of Edmonton Population Change by Age,
 Population Change by Age, 1996-2001 2001 Edmonton Demographic Profile The City of Edmonton s 2001population increased by 49,800 since the 1996 census. Migration figures are not available at the municipal
REGIONAL SNAPSHOT. Eastern Shore Region, Virginia
 REGIONAL SNAPSHOT Eastern Shore Region, Virginia Table of contents 01 Overview 04 Labor force 02 Demography 05 Industry and occupation 03 Human capital 01 overview Eastern Shore Region, VA What is a regional
Analysis & Background
 1 Values shown are June estimates. # # # Analysis & Background Expected Revisions to Colorado Second quarter 2017 Quarterly Census of Employment and Wages (QCEW) results indicate Colorado total nonfarm
REGIONAL SNAPSHOT. Northern Shenandoah Valley Regional Partnership (NSVRP), Virginia
, Virginia") REGIONAL SNAPSHOT Northern Shenandoah Valley Regional Partnership (NSVRP), Virginia Table of contents 01 Overview 04 Labor force 02 Demography 05 Industry and occupation 03 Human capital 01 overview Northern
REGIONAL SNAPSHOT Northern Shenandoah Valley Regional Partnership (NSVRP), Virginia Table of contents 01 Overview 04 Labor force 02 Demography 05 Industry and occupation 03 Human capital 01 overview Northern
The Office of Advocacy
 The Office of Advocacy Created by Congress in 1976, the Office of Advocacy of the U.S. Small Business Administration (SBA) is an independent voice for small business within the federal government. Appointed
National & Colorado. Economic Update. Alison Felix Economist & Branch Executive Federal Reserve Bank of Kansas City Denver Branch
 National & Colorado Economic Update Alison Felix Economist & Branch Executive Federal Reserve Bank of Kansas City Denver Branch The views expressed are those of the presenter and do not necessarily reflect
ECONOMIC OVERVIEW DuPage County, Illinois
 ECONOMIC OVERVIEW DuPage County, Illinois DEMOGRAPHIC PROFILE... 3 EMPLOYMENT TRENDS... 5 UNEMPLOYMENT RATE... 5 WAGE TRENDS... 6 COST OF LIVING INDEX... 7 INDUSTRY SNAPSHOT... 8 OCCUPATION SNAPSHOT...
Utah s Long Run Demographic Trends: Evolving Community Contexts
 Utah s Long Run Demographic Trends: Evolving Community Contexts Pamela S. Perlich, Ph.D. Director, Demographic Research Kem C. Gardner Policy Institute, University of Utah GROWTH Intermountain States Population:
June 9, Economic Overview Billings, MT MSA
 June 9, 2016 Economic Overview Billings, MT MSA DEMOGRAPHIC PROFILE... 3 EMPLOYMENT TRENDS... 5 UNEMPLOYMENT RATE... 5 WAGE TRENDS... 6 COST OF LIVING INDEX... 6 INDUSTRY SNAPSHOT... 7 OCCUPATION SNAPSHOT...
Demographic and Economic Profile. North Dakota. Updated June 2006
 Demographic and Economic Profile North Dakota Updated June 2006 Metro and Nonmetro Counties in North Dakota Based on the most recent listing of core based statistical areas by the Office of Management
Utah. Demographic and Economic Profile. Metro and Nonmetro Counties in Utah
 Demographic and Economic Profile Utah Updated July 2006 Metro and Nonmetro Counties in Utah Based on the most recent listing of core based statistical areas by the Office of Management and Budget (December
Sussex Demographic and Labor Market Trends
 Sussex Demographic and Labor Market Trends Ed Simon (302) 672-6845 edward.simon@state.de.us October 2012 Introduction Statistical Update Economic and labor market update for 2012 Is Sussex doing better?
2013 ECONOMY REPORT. Produced by the Research Division, January Alvaro Lima, Director of Research Mark Melnik John Avault Gregory Perkins
 2013 ECONOMY REPORT Produced by the Research Division, January 2013 Alvaro Lima, Director of Research Mark Melnik John Avault Gregory Perkins PETER MEADE, DIRECTOR AS WE ENTER 2013, Boston s population
Economic Overview Monterey County, California. July 22, 2016
 Economic Overview Monterey July 22, 2016 DEMOGRAPHIC PROFILE... 3 EMPLOYMENT TRENDS... 5 UNEMPLOYMENT RATE... 5 WAGE TRENDS... 6 COST OF LIVING INDEX... 6 INDUSTRY SNAPSHOT... 7 OCCUPATION SNAPSHOT...
Demographic and Economic Profile. Texas. Updated April 2006
 Demographic and Economic Profile Texas Updated April 2006 Metro and Nonmetro Counties in Texas Based on the most recent listing of core based statistical areas by the Office of Management and Budget (December
Health and Health Coverage in the South: A Data Update
 February 2016 Issue Brief Health and Health Coverage in the South: A Data Update Samantha Artiga and Anthony Damico With its recent adoption of the Affordable Care Act (ACA) Medicaid expansion to adults,
White Pine County Economic Overview
 Economic Overview Population (2016) 10,105 Jobs (2016) 4,597 Average Earnings (2016) $65,033 Unemployed (2/2016) 229 GRP (2014) $996,944,330 Exports (2014) $1,789,478,088 Imports (2014) $1,181,738,119
Demographic and Economic Profile. Kentucky. Updated June 2006
 Demographic and Economic Profile Kentucky Updated June 2006 Metro and Nonmetro Counties in Kentucky Based on the most recent listing of core based statistical areas by the Office of Management and Budget
DEMOGRAPHIC PROFILE...3 EMPLOYMENT TRENDS...5 UNEMPLOYMENT RATE...5 WAGE TRENDS...6 COST OF LIVING INDEX...6 INDUSTRY SNAPSHOT...7
 March 14, 2017 DEMOGRAPHIC PROFILE...3 EMPLOYMENT TRENDS...5 UNEMPLOYMENT RATE...5 WAGE TRENDS...6 COST OF LIVING INDEX...6 INDUSTRY SNAPSHOT...7 OCCUPATION SNAPSHOT...9 INDUSTRY CLUSTERS... 12 EDUCATION
Economic Overview 45-Minute Commute From Airport Park. June 6, 2017
 Economic Overview 45-Minute Commute From Airport Park June 6, 2017 DEMOGRAPHIC PROFILE... 3 EMPLOYMENT TRENDS... 5 WAGE TRENDS... 5 COST OF LIVING INDEX... 6 INDUSTRY SNAPSHOT... 7 OCCUPATION SNAPSHOT...
Economic Overview Loudoun County, Virginia. October 23, 2017
 Economic Overview October 23, 2017 DEMOGRAPHIC PROFILE... 3 EMPLOYMENT TRENDS... 5 UNEMPLOYMENT RATE... 5 WAGE TRENDS... 6 COST OF LIVING INDEX... 6 INDUSTRY SNAPSHOT... 7 OCCUPATION SNAPSHOT... 9 INDUSTRY
Economic Overview Long Island
 Report created on August 29, 2017 Economic Overview Long Island Contact: Lisa.Montiel@suny.edu DEMOGRAPHIC PROFILE... 3 EMPLOYMENT TRENDS... 5 UNEMPLOYMENT RATE... 5 WAGE TRENDS... 6 COST OF LIVING INDEX...
Labor Force & Economic Analysis I-70 Corridor
 Labor Force & Economic Analysis I-70 Corridor Prepared by Patrick J. Holwell Arapahoe/Douglas Works! For Don Klemme, Director Arapahoe County Department of Community Resources August 5, 2014 Arapahoe County
REGIONAL SNAPSHOT. Indiana 15 Regional Planning Commission Region, Indiana
 REGIONAL SNAPSHOT Indiana 15 Regional Planning Commission Region, Indiana Table of contents 01 Overview 04 Labor force 02 Demography 05 Industry and occupation 03 Human capital 01 overview Indiana 15 Regional
Pennsylvania. Demographic and Economic Profile. Metro and Nonmetro Counties in Pennsylvania
 Demographic and Economic Profile Pennsylvania Updated June 2006 Metro and Nonmetro Counties in Pennsylvania Based on the most recent listing of core based statistical areas by the Office of Management
Minnesota s Economics & Demographics Looking To 2030 & Beyond. Tom Stinson, State Economist Tom Gillaspy, State Demographer July 2008
 Minnesota s Economics & Demographics Looking To 2030 & Beyond Tom Stinson, State Economist Tom Gillaspy, State Demographer July 2008 Minnesota Has Been Very Successful (Especially For A Cold Weather State
October 28, Economic Overview Yellowstone County, Montana
 October 28, 2016 Economic Overview Yellowstone DEMOGRAPHIC PROFILE...3 EMPLOYMENT TRENDS...5 UNEMPLOYMENT RATE...5 WAGE TRENDS...6 COST OF LIVING INDEX...6 INDUSTRY SNAPSHOT...7 OCCUPATION SNAPSHOT...9
Economic Overview Western New York
 Report created on August 29, 2017 Economic Overview Western New Contact: Lisa.Montiel@suny.edu DEMOGRAPHIC PROFILE... 3 EMPLOYMENT TRENDS... 5 UNEMPLOYMENT RATE... 5 WAGE TRENDS... 6 COST OF LIVING INDEX...
Demographic and Economic Profile. Florida. Updated May 2006
 Demographic and Economic Profile Florida Updated May 2006 Metro and Nonmetro Counties in Florida Based on the most recent listing of core based statistical areas by the Office of Management and Budget
Economic Overview Plant City Region. April 5, 2017
 Economic Overview Plant City Region April 5, 2017 DEMOGRAPHIC PROFILE... 3 EMPLOYMENT TRENDS... 5 WAGE TRENDS... 5 COST OF LIVING INDEX... 6 INDUSTRY SNAPSHOT... 7 OCCUPATION SNAPSHOT... 9 INDUSTRY CLUSTERS...
Economic Overview Fairfax / Falls Church. October 23, 2017
 Economic Overview Fairfax / Falls Church October 23, 2017 DEMOGRAPHIC PROFILE... 3 EMPLOYMENT TRENDS... 5 UNEMPLOYMENT RATE... 5 WAGE TRENDS... 6 COST OF LIVING INDEX... 6 INDUSTRY SNAPSHOT... 7 OCCUPATION
REGIONAL SNAPSHOT. Crossing Borders Region (CBR), Oklahoma
, Oklahoma") REGIONAL SNAPSHOT Crossing Borders Region (CBR), Oklahoma Table of contents 01 Overview 04 Labor force 02 Demography 05 Industry and occupation 03 Human capital 01 overview Crossing Borders Region, OK
REGIONAL SNAPSHOT Crossing Borders Region (CBR), Oklahoma Table of contents 01 Overview 04 Labor force 02 Demography 05 Industry and occupation 03 Human capital 01 overview Crossing Borders Region, OK
While one in five Californians overall is uninsured, the rate among those who work is even higher: one in four.
 : By the Numbers December 2013 Introduction California had the greatest number of uninsured residents of any state, 7 million, and the seventh largest percentage of uninsured residents under 65 in the
REGIONAL SNAPSHOT. Partner for Progress Region, NE
 REGIONAL SNAPSHOT Partner for Progress Region, NE Table of contents 01 Overview 04 Labor force 02 Demography 05 Industry and occupation 03 Human capital 01 overview Partner for Progress Region, NE What
Economic Overview Marlboro County Labor Shed. June 29, 2016
 Economic Overview Marlboro County Labor June 29, 2016 DEMOGRAPHIC PROFILE...3 EMPLOYMENT TRENDS...5 UNEMPLOYMENT RATE...5 WAGE TRENDS...6 COST OF LIVING INDEX...6 INDUSTRY SNAPSHOT...7 OCCUPATION SNAPSHOT...9
Demographic and Economic Profile. New Jersey. Updated December 2006
 Demographic and Economic Profile New Jersey Updated December 2006 Metro and Nonmetro Counties in New Jersey Based on the most recent listing of core based statistical areas by the Office of Management
Health Coverage for the Black Population Today and Under the Affordable Care Act
 fact sheet Health Coverage for the Black Population Today and Under the Affordable Care Act July 2013 As of 2011, 37 million individuals living in the United States identified as Black or African American.
Economic Overview Capital District
 August 29, 2017 Economic Overview Capital District Contact: Lisa.Montiel@suny.edu DEMOGRAPHIC PROFILE... 3 EMPLOYMENT TRENDS... 5 UNEMPLOYMENT RATE... 5 WAGE TRENDS... 6 COST OF LIVING INDEX... 6 INDUSTRY
FUTURE LANDSCAPES. The effects of changing demographics. Background. Future landscapes: The effects of changing demographics February, 2007
 FUTURE LANDSCAPES The effects of changing demographics Background DRCOG Board Retreat 1 Our region is changing Demographic facts: Rapid growth of the older population Increasing immigration Flexible, creative
Economic Overview Mohawk Valley
 Report created on August 29, 2017 Economic Overview Mohawk Valley Contact: Lisa.Montiel@suny.edu DEMOGRAPHIC PROFILE... 3 EMPLOYMENT TRENDS... 5 UNEMPLOYMENT RATE... 5 WAGE TRENDS... 6 COST OF LIVING INDEX...
Demographic and Economic Profile. New Mexico. Updated June 2006
 Demographic and Economic Profile New Mexico Updated June 2006 Metro and Nonmetro Counties in New Mexico Based on the most recent listing of core based statistical areas by the Office of Management and
Economic Activity Report. October 2016
 Economic Activity Report October 2016 The current economic activity report for Commerce City economy reported mixed trends across many indicators. The employment situation improved, with overall employment
Nevada County Population Projections 2010 to 2030 October 2010
 Nevada County Projections 2010 to 2030 October 2010 Prepared By: The Nevada State Demographer s Office Jeff Hardcastle, AICP NV State Demographer University of NV Reno MS/032 Reno, NV 89557 (775) 784-6353
Sussex Demographic and Labor Market Trends
 Sussex Demographic and Labor Market Trends Ed Simon (302) 672-6845 edward.simon@state.de.us October 2013 Introduction Statistical Update Differences among the regions in Sussex Demographic, economic and
Ravenna s most significant growth occurred before Between 1960 and 1980 the city s population declined by 8.5%.
 DRAFT Ravenna Comprehensive Plan Draft May 2008 1 A Profile of Ravenna This section examines demographic trends that will affect Ravenna. The analysis examines population and demographic dynamics, including
Industry Overview. Austin Community College. Emsi Q Data Set. June Emsi Q Data Set
 Industry Overview Emsi Q2 2017 Data Set June 2017 Austin Community College 5930 Middle Fiskville Road Austin, Texas 78752 (512) 223.5100 Emsi Q2 2017 Data Set www.economicmodeling.com Page 1/8 Parameters
Latinas Access to Health Insurance
 FACT SHEET Latinas Access to Health Insurance APRIL 2018 Data released by the U.S. Census Bureau show that, despite significant health insurance gains since the Affordable Care Act (ACA) was implemented,
Demographic and Economic Profile. Ohio. Updated June Metro and Nonmetro Counties in Ohio
 Demographic and Economic Profile Ohio Updated June 2006 Metro and Nonmetro Counties in Ohio Based on the most recent listing of core based statistical areas by the Office of Management and Budget (December
SLUGGISH HOUSEHOLD GROWTH
 3 Demographic Drivers Household growth has yet to rebound fully as the weak economic recovery continues to prevent many young adults from living independently. As the economy strengthens, though, millions
Economic Overview Prince William/Manassas. October 23, 2017
 Economic Overview Prince William/Manassas October 23, 2017 DEMOGRAPHIC PROFILE... 3 EMPLOYMENT TRENDS... 5 UNEMPLOYMENT RATE... 5 WAGE TRENDS... 6 COST OF LIVING INDEX... 6 INDUSTRY SNAPSHOT... 7 OCCUPATION
EMPLOYEE TENURE IN 2014
 For release 10:00 a.m. (EDT) Thursday, September 18, 2014 USDL-14-1714 Technical information: (202) 691-6378 cpsinfo@bls.gov www.bls.gov/cps Media contact: (202) 691-5902 PressOffice@bls.gov EMPLOYEE TENURE
EBRI Databook on Employee Benefits Chapter 6: Employment-Based Retirement Plan Participation
 EBRI Databook on Employee Benefits Chapter 6: Employment-Based Retirement Plan Participation UPDATED July 2014 This chapter looks at the percentage of American workers who work for an employer who sponsors
Health Insurance Coverage: 2001
 Health Insurance Coverage: 200 Consumer Income Issued September 2002 P60-220 Reversing 2 years of falling uninsured rates, the share of the population without health insurance rose in 200. An estimated
Will the Recovery Ever End? Certified Financial Planners
 Will the Recovery Ever End? Certified Financial Planners Place cover image here Richard Wobbekind Senior Economist and Associate Dean for Business and Government Relations January 25, 219 Attention: This
Mid - City Industrial
 Minneapolis neighborhood profile October 2011 Mid - City Industrial About this area The Mid-City Industrial neighborhood is bordered by I- 35W, Highway 280, East Hennepin Avenue, and Winter Street Northeast.
SOUTH DAKOTA KIDS COUNT BEACOM SCHOOL OF BUSINESS UNIVERSITY OF SOUTH DAKOTA 414 E. CLARK STREET VERMILLION, SD
 Brookings County Compared to o SDSD Undergrad Enrollment approximately 11,225 o USD Undergrad Enrollment approximately 7,600 o Brookings County 1 year population estimate for 2013 is 32,968 o 1 year population
Economy Overview Champaign-Urbana, IL
 Economy Overview Champaign-Urbana, IL Emsi Q4 Data Set November Illinois Emsi Q4 Data Set www.economicmodeling.com Page 1/15 Economy Overview Population () 240,355 Jobs () 100,288 Average Earnings () $53,770
BUDGET BACKGROUNDER PLANNING FOR CALIFORNIA S FUTURE: THE STATE S POPULATION IS GROWING, AGING, AND BECOMING MORE DIVERSE.
 BUDGET BACKGROUNDER NOBVEMBER 2005 M A K I N G D O L L A R S M A K E S E N S E PLANNING FOR CALIFORNIA S FUTURE: THE STATE S POPULATION IS GROWING, AGING, AND BECOMING MORE DIVERSE Introduction California
2015 Mid-Year Economic Update
 BROOMFIELD Economic Development 2015 Mid-Year Economic Update Provided by: Broomfield Economic Development One Descombes Drive Broomfield, CO 80020 303-464-5579 www.investbroomfield.com Prepared by: Development
Demographic and Economic Profile. Delaware. Updated December 2006
 Demographic and Economic Profile Delaware Updated December 2006 Metro and Nonmetro Counties in Delaware Based on the most recent listing of core based statistical areas by the Office of Management and
Economic Overview of the Wild, Wild West
 Economic Overview of the Wild, Wild West Christine Cooper, Ph.D. Regional Economist (West) Copyright 217 CoStar Realty Information, Inc. No reproduction or distribution without permission. But first, let
Economy Overview Champaign County, IL
 Economy Overview Champaign County, IL Emsi Q4 2016 Data Set November 2016 Illinois Emsi Q4 2016 Data Set www.economicmodeling.com Page 1/17 Parameters Regions Code Description 17019 Champaign County, IL
THREE DISPARATE CHICAGO-AREA HOUSING MARKETS
 Manufactured Housing Community Council ULI 2008 FALL MEETING MIAMI, FLA OCTOBER 27-28, 2008 Understanding Demographics/Market Analysis: THREE DISPARATE CHICAGO-AREA HOUSING MARKETS Three Disparate Chicago-area
Poverty and the Safety Net After the Great Recession
 Poverty and the Safety Net After the Great Recession Deep Issues of the 2012 Elections: Equality, Liberty and Democracy, Cornell University Hilary Hoynes University of California, Davis November 2012 In
A SocioEconomic Profile
 www.headwaterseconomics.org A SocioEconomic Profile Bernalillo County, New Mexico Produced by the Economic Profile System (EPS) April 6, 2007 About EPS About The Economic Profile System (EPS) This profile
San Luis Valley Statistical Profile
 Valley Statistical Profile Revised December 3, 2007 Physical Setting Alamosa Conejos Costilla Mineral Rio Grande Saguache Valley Colorado Land area Total square miles 723 1,287 1,227 876 911 3,168 8,192
A SUMMARY OF ECONOMIC CONDITIONS IN HENRYETTA AND OKMULGEE COUNTY, OKLAHOMA 2009
 AE-09127 A SUMMARY OF ECONOMIC CONDITIONS IN HENRYETTA AND OKMULGEE COUNTY, OKLAHOMA 2009 Doug Maxey, Okmulgee County Extension Director, Okmulgee (918) 756-1958 Jack Frye, Community Development Specialist,
CENTER FOR ECONOMIC AND POLICY RESEARCH. Union Membership Byte 2018
 CEPR CENTER FOR ECONOMIC AND POLICY RESEARCH Union Membership Byte 2018 By Brian Dew* January 2018 Center for Economic and Policy Research 1611 Connecticut Ave. NW Suite 400 Washington, DC 20009 tel: 202-293-5380
Average persons in household. Top three industries Post-secondary education (25 64 years) 7.1% Unemployment rate
 7.1% Unemployment rate") Demographic snapshot The Town of Oakville City of Burl ington City of Mis sissauga Town of Milton Population 198,042 Median age Average persons in household 41 2.8 years old $149,945 Average household
Demographic snapshot The Town of Oakville City of Burl ington City of Mis sissauga Town of Milton Population 198,042 Median age Average persons in household 41 2.8 years old $149,945 Average household