Financing Unemployment Benefits in Today s Tough Economic Times
|
|
|
- Derek Mason
- 5 years ago
- Views:
Transcription
1 Financing Unemployment Benefits in Today s Tough Economic Times Maurice Emsellem 7 th Annual Workers Voice State Legislative Issues Conference July 19, 2003.
2 Today s Funding Situation The Good, the Bad & the Ugly Before the recession began (September 2000), the average state had about 11 months of funding to pay benefits at peak recession levels without taking in any additional revenue ( average high cost multiple, or ACHM). 22 months after the recession began (December 2002), the state average was 7 months of recession-level funding, including $8 billion in Reed Act funds distributed in As of December 2002, 19 states were able to pay benefits at peak levels for more than one year (the recommended level of funding going into a recession), and 9 states were above 9 months of recession-level funding. 12 states were below six months of recession-level funding Six states (Illinois, Missouri, Minnesota, North Carolina, New York, Texas) have applied for federal loans. 2
3 How Many Years of UI Benefits Can States Pay During a Peak Recession? "Average High Cost Multiple" (ACHM) as of December # of States or less.25 to.50.5 to to or more 6 States:MO, MN, NC, NY, IL, TX 6 States: AL, AR, MA, ND, OH, PA 11 States: CA, CO, CT, ID, KY, MI, RI, TN, VA, WA, WV 9 States: AK, KS, MD, NE, NJ, NV, SC, SD, WI 19 States: AZ, DC, DE, FL, GA, HI, IA, IN, LA, ME, MS, MT, NH, NM, OK, OR, UT, VT, WY 3
4 How Does the Funding Situation Compare with Prior Recessions? Trust funds should have been more solvent heading into this recession given comparatively less severe recession of the early 1990 s and the extended expansion that followed. The AHCM started off relatively high after the last recession, but never built up to earlier peak levels. Even experienced a drop off in solvency well before the recession began. Trust fund balances also did not increase much as a percent of total wages during the1990s expansion. 4
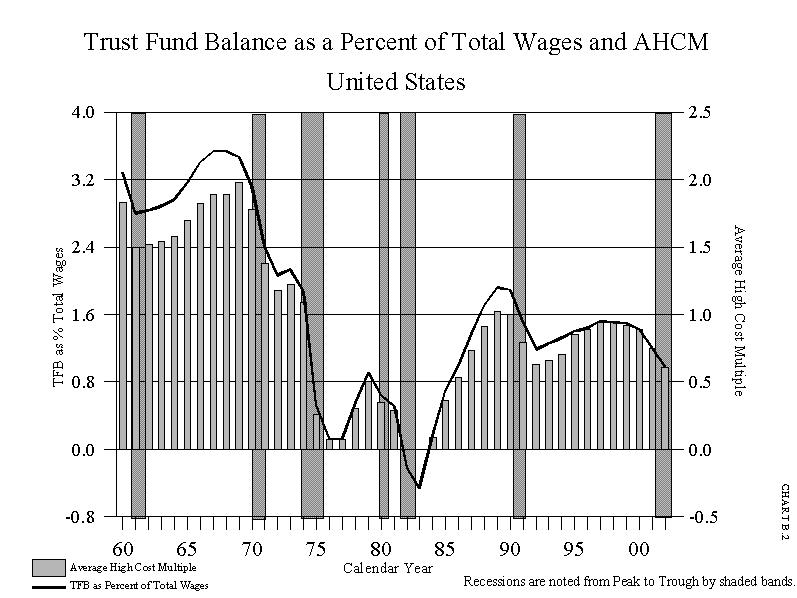
5 5
6 Record Low Taxes Account for Low Trust Fund Reserves As of December 2002, employers paid an average of 0.5% of their total payroll in UI taxes. UI tax rates fell to record low levels, having dropped significantly since the 1980s. In 1994, the national average tax on total wages was.94, or almost double today s rate. Shift to pay as you go financing in late 1980s brought rates down, and they only increased marginally during the 1990s recovery compared to prior years. Low unemployment and experience rating also account for some of the drop in taxes since the 1990s recession. Multibillion $$$ Question: Coming out of this recession, will reserves bounce back with the help of solvency taxes and other flexible financing mechanisms? Probably not, according to the research projections. 6
7 UI Taxes Paid as a Percent of Total Wages ( ) Percentage Year 7
8 The Case for Forward Funding Versus Flexible Financing Forward funding raises more revenue during good economic times and pumps money into the economy when it s needed most. Permits states to expand benefits (e.g., state-funded extensions, increased weekly benefits, low-wage worker eligiblity reforms). Avoids raising taxes significantly and/or pressure to cut benefits when workers/employers can least afford it. Allows states to collect significant federal interest on the trust funds (as much as $100 million a year in large states). Avoids federal loans, which leads to millions of dollars spent on interest payments and mandatory tax increases. 8
9 Forward Funding Oregon Case Study Highest unemployment rate in the nation (8.2%), paying benefits to 50% of the unemployed (above national average). Ranks 12 th on trust fund solvency (1 year, 3 months of recession-level funding). $26,000 taxable wage base, indexed at 80% of the state average annual wage. 1.2% average tax on total wages (up from 0.96 in 1994), or $ per worker. 52% of employers pay an average UI tax rate of less than 1% (on taxable wages), or at most $260 per worker. In 2003, Oregon enacted 20-week extension of unemployment benefits without triggering higher tax schedules. 9
10 Figure 1 - Oregon UI Taxes and Benefit Payments Regular Benefits Paid Payroll Tax Revenues End of Year Trust Fund Balance (000s) s of $ Year 10
11 Flexible Financing Illinois Case Study High unemployment state (6.1%), paying benefits to 45% of the unemployed (average nationally). In 1988, Illinois established a trust fund trigger of $750 million (not indexed), keeping taxes artificially low nearly every year thereafter. In 1996, also passed a bonus tax cut. This year, Illinois applied for a federal loan ($265 million) to cover benefits. $9,000 taxable wage base, last increased in % average tax on total wages (fell from 1.10% in 1994), or $ per worker. 74% of all employers pay the minimum tax of 0.6% (on taxable wages), or about $54 per worker. 11
12 Illinois' UI Taxes and Benefit Payments Regular Benefits Paid Payroll Tax Revenues End of Year Trust Fund Balance (000s) $2,500,000 $2,000,000 $1,500, s of $ $1,000,000 $500,000 $ Year 12
13 Oregon v. Illinois Going into the last recession, Illinois fund balance dropped far below benefits paid while the Oregon fund was solvent all along. During the economic boom ( ), Oregon collected more in taxes than it paid in benefits. Illinois collected less in taxes during three years of the economic expansion (another tax cut took effect in 1996). Since 1996, Illinois collected $84 million less in taxes than it paid out, while Oregon collected $274 million more, not counting substantial federal interest earned on the trust fund. 13
14 Key Financing Issues Adequate Taxable Wage Base & Indexing Experience Rating & Adequate Minimum Tax Rates Flexible Financing Gimmicks 14
15 Indexing the Taxable Wage Base High Priority Key to long-term solvency and more effective rebound postrecession is an adequate taxable wage base indexed to reflect growth in wages. The average taxable wage base is $12,661, but 10 states remain at federal minimum of $7,000 set in states index their taxable wage base (from % of average annual wages). Of the 21 states with the most solvent trust funds, 10 index their taxable wage base. If the $7,000 minimum wage base kept pace with average annual wages since 1983, it would be $17,500. The Illinois tax base of $9,000 established in 1988 would now be $15,
16 Experience Rating 101 The employer s layoff history, which is recalculated every year by the state, determines whether the company receives a lower or higher tax rate ( experience rating ). Small businesses tend to get bunched both at the top and bottom of the experience distribution. Larger firms tend to be bunched more at the lower end of the experience distribution. In practice, about 60% of benefits paid are actually charged to a given employer s experience rate. The rate (called the Experience Rating Index ) varies from a low of 14% in Georgia to 71% in New York. As a result, tax rates often do not increase for employers and the funds socialize the cost of the benefits. 16
17 Experience Rating 201 Step 1: Determine the proportion of employers paying at each of your state s tax rates. If too many are bunched at the low end that s indication that your minimum rate may be too low. In Illinois, 74% of all employers pay at the minimum tax rate compared with about 52% in Oregon. Step 2: Determine the proportion of ineffective charges, which happens when employers reach the maximum tax rate. If the proportion is relatively high, then it makes sense to look at the maximum tax rates so that those employers with a poor experience pay their fare share of taxes. Tax holidays and other tax freezes are also reflected in ineffective charges, thus Georgia s rate is 71.5% (meaning $292 million of the state s $408 million paid in unemployment benefits were never charged to an employer). 17
18 Experience Rating 201 (cont.) Step 3: Determine whether your state has a high rate of inactive charges, which happens when employers go out of business or the tax is not passed on new corporate entities. In Montana, 22% of charges ($13 million in benefits) were listed as inactive in Step 4: Determine the proportion of new employers in the state and evaluate their tax rates. After a specific period of time, new employers start paying experience rate taxes. Until then, they pay a flat rate, often the average tax in the state and sometimes the industry average. Some states, especially in the West, have a higher percentage of new employers which may justify adjustments to their tax rates. 18
19 Flexible Financing Gimmicks Key to avoid setting tax rates or tax schedules at artificial funding levels, especially dollar amounts that are not indexed (e.g., $750 million in Illinois and $300 million in Minnesota). The research says that solvency taxes (22 states have them now as a result of shift to flexible financing ) are not a reliable method to improve financing long-term. Eliminate voluntary payment of unemployment taxes (allowed in 27 states), which allows employers to artificially lower their tax rates (by increasing the balance in their reserve so that a lower rate is assigned which will save more than the amount of the contribution). 19
20 What About the Employer Arguments? Employer Arguments - UI taxes are too high, killing job creation! - UI taxes are too high compared to China! Some Responses - #1 Money paid into the system comes back to boost the economy especially in areas hardest hit by unemployment. The stronger the system, the greater the boost to the economy. (County data works great). - #2 UI taxes are a small percentage of total payroll, on average 0.5% nationally, and they have fallen almost in half since
21 Employer Arguments (cont.) - #3 Quantify the large proportion of employers (usually at least half) in most states that pay far less than the state s average tax rate (in Illinois, 74% of employers pay only $54 a worker). - #4 Don t always believe their numbers. Watch out for the sometimes bogus $ per worker number, especially in states with high taxable wage bases. Can t be used to compare states. 21
22 State AHCM Minimum Tax Rate Paid (2002) Maximum Tax Rate Paid (2002) Average Tax on Total Wages (2002) Average Amount of Tax Per Worker (2002) Experience Rating Index (Average ) Alabama % 6.2% 0.4% $ Alaska 0.99 na na 1.3% $ na Arizona % 5.4% 0.2% $ Arkansas % 5.5% 0.8% $ California 0.51 na na 0.6% $ Colorado % 5.6% 0.2% $ Connecticut 0.63 na na 0.4% $ Delaware 1.73 na na 0.5% $ na District of Columbia 1.09 na na 0.4% $ na Florida % 5.4% 0.3% $ Georgia % 5.4% 0.1% $ Hawaii % 4.8% 0.8% $ Idaho % 5.4% 0.8% $ Illinois % 6.8% 0.6% $ Indiana 1.10 na na 0.3% $ Iowa % 7.5% 0.6% $ Kansas % 7.4% 0.6% $ Kentucky % 5.4% 0.6% $ Louisiana 1.32 na na 0.4% $ Maine % 5.4% 0.8% $ Maryland 0.78 na na 0.4% $ na Massachusetts % 6.5% 0.7% $ Michigan 0.53 na na 0.7% $ Minnesota 0.10 na na 0.4% $ Mississippi % 5.4% 0.5% $ Missouri % 6.6% 0.2% $ Montana % 6.4% 0.7% $ Nebraska % 5.4% 0.3% $ Nevada 0.91 na na 0.8% $ New Hampshire % 6.2% 0.2% $ New Jersey % 5.4% 0.5% $ New Mexico 2.76 na na 0.5% $ New York % 9.4% 0.7% $ North Carolina % 5.7% 0.4% $ North Dakota % 2.2% 0.7% $ Ohio 0.44 na na 0.4% $ na Oklahoma 1.10 na na 0.2% $ Oregon % 5.0% 1.2% $ Pennsylvania % 8.9% 0.9% $ Rhode Island % 9.8% 1.1% $ South Carolina % 5.6% 0.4% $ South Dakota % 7.0% 0.2% $ Tennessee 0.59 na na 0.5% $ Texas % 6.5% 0.4% $ Utah 1.22 na na 0.3% $74.69 na Vermont % 5.4% 0.6% $ Virginia % 6.3% 0.1% $ Washington % 5.4% 1.2% $ West Virginia % 8.5% 1.0% $ Wisconsin % 9.5% 0.6% $ Wyoming % 6.8% 0.4% $ US Average % 6.3% 0.5% $ Source: US Department of Labor, Office of Workforce Security State UI Tax & Finance Statistics
23 Taxable Wage Base Indexes Taxable Wage Base State UI Tax & Finance Policies Min Rate possible under law Max rate possible under law New Employer Rates Benefit (BR) or Reserve (RR) State Allows Prepayment of Taxes Solvency Taxes State Alabama $26,700 N 0.2% 6.8% 2.7 BR N N Alaska $8,000 Y 1.0% 5.4% Avg. industry rate payroll variation N Y Arizona $7,000 N 0.1% 5.4% 2.7 RR Y N Arkansas $9,000 N 0.1% 6.8% 3.2 RR Y Y California $7,000 N 0.1% 5.4% 3.4 RR Y 1 Y Colorado $10,000 N 0.0% 5.4% 1.7 c RR Y Y Connecticut $15,000 N 0.5% 6.9% 2.4 BR N N Delaware $8,500 N 0.1% 9.5% Avg. industry rate benefit-wage-ratio N Y DC $9,000 N 0.1% 7.4% 2.7 * RR N N Florida $7,000 N 0.0% 6.4% 2.7 BR N N Georgia $8,500 N 0.1% 10.8% 2.62 RR Y N Hawaii $30,200 Y 0.0% 5.4% 2.4 RR N N Idaho $27,600 Y 0.1% 6.8% 1.5 RR N N Illinois $9,000 N 0.2% 9.0% 3.1 * BR N Y Indiana $7,000 N 0.1% 5.6% 2.7 RR Y N Iowa $19,200 Y 0.0% 9.0% 1 BR N N Kansas $8,000 N 0.0% 7.4% Avg. industry rate RR Y N Kentucky $8,000 N 0.3% 10.0% 2.7 RR Y N Louisiana $7,000 N 0.1% 6.0% Avg. industry rate RR Y N Maine $12,000 N 0.5% 7.5% 2.75 RR Y N Maryland $8,500 N 0.1% 9.5% BR N Y Massachusetts $10,800 N 0.6% 9.3% RR Y N Michigan $9,000 N 0.0% 10.0% 2.7 c BR Y N Minnesota $22,000 Y 0.1% 9.5% varies BR Y N Mississippi $7,000 N 0.1% 5.4% 2.7 BR N Y Missouri $7,500 N 0.0% 8.7% 2.7 RR Y Y Montana $19,700 Y 0.0% 6.4% Avg. industry rate RR N N Nebraska $7,000 N not specified 5.4% 3.5 RR Y N Nevada $21,500 Y 0.3% 5.4% 2.95 RR N N New Hampshire $8,000 N 0.1% 6.5% 2.7 RR N Y New Jersey $23,900 Y 0.3% 7.0% 2.8 RR Y Y New Mexico $16,600 Y 0.1% 5.4% 2.7 RR Y N New York $8,500 N 2.4% 8.9% varies RR Y Y North Carolina $15,900 Y 0.0% 5.4% 1 RR Y N North Dakota $18,000 Y 0.1% not specified varies RR Y N Ohio $9,000 N 0.1% 6.7% 2.7 * RR Y Y Oklahoma $11,700 Y 0.1% 5.5% 1 benefit-wage-ratio N Y Oregon $26,000 Y 0.5% 5.4% 3 BR N N Pennsylvania $8,000 N 0.3% 10.6% 3.5 RR Y Y Rhode Island $12,000 N 0.6% 10.0% 1.86 RR N Y South Carolina $7,000 N 0.5% 6.1% 2.64 RR N Y South Dakota $7,000 N 0.0% 10.5% 1.2 RR Y Y Tennessee $7,000 N 0.0% 10.0% 2.7 * RR N N Texas $9,000 N 0.0% 6.0% 2.6 * BR Y Y Utah $22,500 Y 0.1% 8.1% Avg. industry rate BR N N Vermont $8,000 N 0.4% 8.4% Avg. industry rate BR N N Virginia $8,000 N 0.0% 6.4% 2.5 BR N Y Washington $29,700 Y 0.5% 5.4% Avg. industry rate BR Y 1 N West Virginia $8,000 N 0.0% 8.5% 2.7 c RR Y N Wisconsin $10,500 N 0.0% 8.9% 2.7 c RR Y 1 Y Wyoming $14,700 Y 0.0% 8.5% Avg. industry rate BR N Y US Average $ 12, % 7.4% c = construction industry gets a diffferent rate * = rates may vary according to industry 1 = prepayment is not applicable to certain employers Source: US Department of Labor, Office of Workforce Security
24 STATE Experience Rating System EXPERIENCE RATING INDEX BY STATE RATE YEAR 2002 Ineffective Charges Inactive Charges Noncharges Benefits Paid ($000s) as % of as % of as % of ($000s) ($000s) BEN BEN BEN ($000s) Alabama BR 44, % 10, % 48, % 248, Alaska PD NA NA NA NA 114, % 114,743 NA Arizona RR 47, % 8, % 29, % 169, Arkansas RR 23, % 2, % 62, % 214, California RR INA INA 304, % 202, % 2,484,435 INA Colorado RR 30, % 15, % 7, % 174, Connecticut BR 40, % 44, % 33, % 374, Delaware BWR NA NA 3, % 20, % 80,393 NA Dist. of Columbia RR REPORT NOT SUBMITTED Florida BR 82, % 106, % 129, % 832, Georgia RR 291, % 32, % 25, % 407, Hawaii RR 28, % 12, % 23, % 133, Idaho RR2 28, % 1, % 22, % 115, Illinois BR 637, % 33, % 99, % 1,792, Indiana RR 153, % 44, % 51, % 446, Iowa BR2 33, % 16, % 48, % 257, Kansas RR2 32, % 13, % 29, % 182, Kentucky RR 87, % 19, % 20, % 361, Louisiana RR 26, % 4, % 31, % 175, Maine RR2 9, % % 34, % 84, Maryland BR INA INA 28, % 65, % 302,583 INA Massachusett s RR 341, % 2, % 122, % 1,052, Michigan BR3 INA INA 193, % 164, % 1,409,381 INA Minnesota BR 266, % 77, % 64, % 584, Mississippi BR 37, % 16, % 30, % 149, Missouri RR 104, % 1, % 75, % 388, Montana RR2 10, % 12, % 6, % 57, Nebraska RR 20, % 4, % 23, % 89, Nevada RR2 REPORT NOT SUBMITTED New Hampshire RR INA INA 7, % 10, % 64,502 INA New Jersey RR 371, % 156, % 201, % 1,503, New Mexico RR INA INA 5, % 15, % 72,880 INA New York RR 499, % 167, % 78, % 2,603, North Carolina RR 134, % 29, % 112, % 485, North Dakota RR2 1, % 1, % 4, % 40, Ohio RR REPORT NOT SUBMITTED Oklahoma4 BWR 79, % 23, % 29, % 169, Oregon BR2 100, % 33, % 83, % 475, Pennsylvania BR3 339, % 123, % 211, % 1,627, Puerto Rico RR REPORT NOT SUBMITTED ERI
25 STATE Experience Rating System EXPERIENCE RATING INDEX BY STATE RATE YEAR 2002 Benefits Ineffective Charges Inactive Charges Noncharges Paid as % of as % of as % of ($000s) ($000s) ($000s) ($000s) BEN BEN BEN Rhode Island RR 16, % 8, % 16, % 139, South Carolina RR 57, % 35, % 34, % 264, South Dakota RR 7, % 1, % 3, % 22, Tennessee RR 113, % 80, % 76, % 561, Texas BR 85, % 108, % 277, % 1,209, Utah BR INA INA 11, % 76, % 198,556 INA Vermont BR2 16, % 6, % 13, % 60, Virgin Islands RR REPORT NOT SUBMITTED Virginia BR 68, % 12, % 27, % 229, Washington BR2 125, % 114, % 172, % 951, West Virginia RR 28, % 14, % 9, % 120, Wisconsin RR 136, % 20, % 122, % 645, Wyoming BR 4, % % 4, % 23, For NH, NJ, TN, and VT, ERI is for rate year ending June 30, DE is a Benefit Wage Ratio state and is not required to report Ineffective Charges. AK is a Payroll Decline state and is not required to report Ineffective Charges. 1 Data supplied in the old format 2 State uses an array method for assigning tax rates. 3 State also uses reserve ratio elements in its system. 4 State supplied estimate of IEC RR - Reserve Ratio; BR - Benefit Ratio; BWR - Benefit Wage Ratio; PD - Payroll Decline INA- Information Not Available NA -Not Applicable Source: US Department of Labor, Office of Workforce Security ERI
26 Tax Distribution in Selected States (Tax Rate on Taxable Wages), 2002 New York Kansas Rate % Rate % 8%+ 2.7% 6%+ 6.4% 6-8% 6.1% 3-6% 8.0% 4-6% 10.0% 2-3% 29.4% 2-4% 28.7% 1-2% 19.5% 1-2% 20.4% 0.5-1% 11.3% 0-1% 32.1% 0-0.5% 25.5% Taxable Wage Base: $8,500 Avg. Tax on Taxable Wages: 3.4% Taxable Wage Base: $8,000 Avg. Tax on Taxable Wages: 1.4% Colorado Georgia Rate % Rate % 4%+ 2.4% 5%+ 2.2% 3-4% 3.8% % 0.2% 2-3% 0.7% % 6.2% 1-2% 5.1% % 35.7% 0.5-1% 25.3% % 0-0.5% 62.6% Taxable Wage Base: $10,000 Avg. Tax on Taxable Wages: 0.9% Oregon Illinois Rate % Rate % 0-1% 52.3% 0.5-1% 76.6% 1-2% 14.6% 1-2% 4.5% 2-3% 19.6% 2-3% 5.0% 3-4% 10.9% 3-5% 5.5% 4%+ 2.7% 5%+ 4.8% Taxable Wage Base: $22,000 Avg. Tax on Taxable Wages: 1.9% Source: US Department Office of Labor, Workforce Security Taxable Wage Base: $8,500 Avg. Tax on Taxable Wages: 0.5% Taxable Wage Base: $9,000 Avg. Tax on Taxable Wages: 2.2%
Age of Insured Discount
 A discount may apply based on the age of the insured. The age of each insured shall be calculated as the policyholder s age as of the last day of the calendar year. The age of the named insured in the
STATE TAX WITHHOLDING GUIDELINES
 STATE TAX WITHHOLDING GUIDELINES ( Guardian Insurance & Annuity Company, Inc. and Guardian Life Insurance Company of America (hereafter collectively referred to as Company )) (Last Updated 11/2/215) state
ACORD Forms Updated in AMS R1
 ACORD Forms Updated in AMS360 2017 R1 The following forms will use the ACORD form viewer, also new in this release. Forms with an indicate they were added because of requests in the Product Enhancement
NCSL Midwest States Fiscal Leaders Forum. March 10, 2017
 NCSL Midwest States Fiscal Leaders Forum March 10, 2017 Public Pensions: 50-State Overview David Draine, Senior Officer Public Sector Retirement Systems Project The Pew Charitable Trusts More than 40 active,
medicaid a n d t h e How will the Medicaid Expansion for Adults Impact Eligibility and Coverage? Key Findings in Brief
 on medicaid a n d t h e uninsured July 2012 How will the Medicaid Expansion for Adults Impact Eligibility and Coverage? Key Findings in Brief Effective January 2014, the ACA establishes a new minimum Medicaid
36 Million Without Health Insurance in 2014; Decreases in Uninsurance Between 2013 and 2014 Varied by State
 36 Million Without Health Insurance in 2014; Decreases in Uninsurance Between 2013 and 2014 Varied by State An estimated 36 million people in the United States had no health insurance in 2014, approximately
ACORD Forms in ebixasp (03/2004)
") ACORD Forms in ebixasp (03/2004) Form number Form Name Edition Date 1 Property Loss Notice 2002/1 2 Automobile Loss Notice 2002/1 3 General Liability Notice of Occurrence/Claim 2002/1 4 Workers Compensation
ACORD Forms in ebixasp (03/2004) Form number Form Name Edition Date 1 Property Loss Notice 2002/1 2 Automobile Loss Notice 2002/1 3 General Liability Notice of Occurrence/Claim 2002/1 4 Workers Compensation
National Employment Law Project UNEMPLOYMENT INSURANCE FINANCING: STATE TRUST FUNDS IN RECESSION AS OF SEPTEMBER 30, 2008
 National Employment Law Project UNEMPLOYMENT INSURANCE FINANCING: STATE TRUST FUNDS IN RECESSION AS OF SEPTEMBER 30, 2008 Introduction In May 2008, NELP issued a briefing paper (Unemployment Insurance
Household Income for States: 2010 and 2011
 Household Income for States: 2010 and 2011 American Community Survey Briefs By Amanda Noss Issued September 2012 ACSBR/11-02 INTRODUCTION Estimates from the 2010 American Community Survey (ACS) and the
Installment Loans CHARTS. No cap other than unconscionability:
 NCLC NATIONAL CONSUMER LAW CENTER Installment Loans WILL STATES PROTECT BORROWERS FROM A NEW WAVE OF PREDATORY LENDING? Copyright 2015, National Consumer Law Center, Inc. CHARTS CHART 1 Full APRs Allowed
State, Local and Net Tuition Revenue Supporting General Operating Expenses of Higher Education, U.S., Fiscal Year 2010, Current (unadjusted) Dollars
 Dollars") State, Local and Net Tuition Revenue Supporting General Operating Expenses of Higher Education, U.S., Fiscal Year 2010, Current (unadjusted) Dollars Net Tuition $51.3 Billion 37% All State Support $73.7
State, Local and Net Tuition Revenue Supporting General Operating Expenses of Higher Education, U.S., Fiscal Year 2010, Current (unadjusted) Dollars Net Tuition $51.3 Billion 37% All State Support $73.7
American Memorial Contract
 American Memorial Contract Please complete all pages of the contract and send it back to Stephens- Matthews with a copy of each state license you choose to appoint in. You are required to submit with the
Non-Financial Change Form
 Non-Financial Change Form Please Print All Information Below Section 1. Contract Owner s Information Administrative Offices: PO BOX 19097 Greenville, SC 29602-9097 Phone number (800) 449-0523 Overnight
Committee on Ways and Means Democrats
 DRAFT Committee on Ways and Means Democrats Representative Sandy Levin - Ranking Member Report November 7, 2013 Millions of Unemployed Americans Will Lose Benefits Unless Congress Acts Over 3 Million Will
Health Insurance Price Index for October-December February 2014
 Health Insurance Price Index for October-December 2013 February 2014 ehealth 2.2014 Table of Contents Introduction... 3 Executive Summary and Highlights... 4 Nationwide Health Insurance Costs National
Final Paycheck Laws by State
 ALABAMA AL No Provision No Provision ALASKA AK 23.05.140(b) ARIZONA AZ Ariz. Rev. Stat. 23-350, 23-353 ARKANSAS AR Ark. Code Ann. 11-4-405 CALIFORNIA CA Cal. Lab. Code 201 to 202, 227.3 COLORADO CO Colo.
Data Note: What if Per Enrollee Medicaid Spending Growth Had Been Limited to CPI-M from ?
 Data Note: What if Per Enrollee Medicaid Spending Growth Had Been Limited to CPI-M from 2001-2011? Rachel Garfield, Robin Rudowitz, and Katherine Young Congress is currently debating the American Health
Highlights. Percent of States with a Decrease in MH Expenditures from Prior Year: FY2001 to 2010
 FY 2010 State Mental Health Revenues and Expenditures Information from the National Association of State Mental Health Program Directors Research Institute, Inc (NRI) Sept 2012 Highlights SMHA Funding
Required Minimum Distribution Election Form for IRA s, 403(b)/TSA and other Qualified Plans
/TSA and other Qualified Plans") Required Minimum Distribution Election Form for IRA s, 403(b)/TSA and other Qualified Plans For Policyholders who have not annuitized their deferred annuity contracts Zurich American Life Insurance Company
Required Minimum Distribution Election Form for IRA s, 403(b)/TSA and other Qualified Plans For Policyholders who have not annuitized their deferred annuity contracts Zurich American Life Insurance Company
Long-Term Care Partnership Overview & Training Requirements Guide
 Long-Term Care Partnership Overview & Training Requirements Guide Version Sept. 12, 2012 M28108 Contents LONG-TERM CARE PARTNERSHIP OVERVIEW & TRAINING REQUIREMENTS GUIDE Long-Term Care Partnership Overview...4
BY THE NUMBERS 2016: Another Lackluster Year for State Tax Revenue
 BY THE NUMBERS 2016: Another Lackluster Year for State Tax Revenue Jim Malatras May 2017 Lucy Dadayan and Donald J. Boyd 2016: Another Lackluster Year for State Tax Revenue Lucy Dadayan and Donald J. Boyd
Long-Term Care Partnership Overview & Training Requirements Guide
 Long-Term Care Insurance Mutual of Omaha Insurance Company SM Long-Term Care Partnership Overview & Training Requirements Guide 75014 Version November 16, 2015 For producer use only. Not for use with the
Update: 50-State Survey of Retiree Health Care Liabilities Most recent data show changes to benefits, funding policies could help manage rising costs
 A fact sheet from Dec 2018 Update: 50-State Survey of Retiree Health Care Liabilities Most recent data show changes to benefits, funding policies could help manage rising costs Getty Images Overview States
Systematic Distribution Form
 Systematic Distribution Form (To be used for all Qualified Plans, IRA s and Non-Qualified Plans) (This form is not applicable to a Required Minimum Distribution ( RMD ). If you are older than 70 ½, refer
kaiser medicaid and the uninsured commission on The Cost and Coverage Implications of the ACA Medicaid Expansion: National and State-by-State Analysis
 kaiser commission on medicaid and the uninsured The Cost and Coverage Implications of the ACA Expansion: National and State-by-State Analysis Executive Summary John Holahan, Matthew Buettgens, Caitlin
LIFE AND ACCIDENT AND HEALTH
 201 FOR THE YEAR ENDED DECEMBER 1, 201 LIFE AND ACCIDENT AND HEALTH 201 Schedule A - Part 1 - Real Estate Owned Schedule A - Part 2 - Real Estate Acquired and Additions Made Schedule A - Part - Real Estate
2017 WORKBOOK. Mandatory LTC Training
 2017 WORKBOOK Mandatory LTC Training ABOUT THE AUTHOR EDUCATION CREDIT AND YOUR CERTIFICATE OF COMPLETION LTC Connection specializes exclusively in LTC insurance training and education and has been working
NASRA Issue Brief: Employee Contributions to Public Pension Plans
 NASRA Issue Brief: Employee Contributions to Public Pension Plans September 2017 Unlike in the private sector, nearly all employees of state and local government are required to share in the cost of their
Insufficient and Negative Equity
 Insufficient and Negative Equity Lack Of Equity Impedes The Real Estate Market Mark Fleming Chief Economist December, 2011 70% 60% 50% 40% 30% Negative Equity Highly Concentrated Negative Equity Share,
Confronting the UI Solvency Crisis
 Confronting the UI Solvency Crisis Andrew Stettner Deputy Director Serious UI Financing i Crisis i UI programs are set up to be self-financing. State funds are deposited in and guarded by the U.S. Treasury,
TThe Supplemental Nutrition Assistance
 STATE SUPPLEMENTAL NUTRITION ASSISTANCE PROGRAM PARTICIPATION RATES IN 2010 TThe Supplemental Nutrition Assistance Program (SNAP) is a central component of American policy to alleviate hunger and poverty.
Frequency and Severity Results by State
 Frequency and Severity Results by State Based on Data Valued as of December 31, 2016 TABLE OF CONTENTS Executive Summary 2 Comparison to Trend Factors Used in Ratemaking 3 Method of Calculation 4 Caveats
Income from U.S. Government Obligations
 Baird s ----------------------------------------------------------------------------------------------------------------------------- --------------- Enclosed is the 2017 Tax Form for your account with
IMPORTANT TAX INFORMATION
 IMPORTANT TAX INFORMATION To set up and maintain your account with WestconGroup, we require you to provide us valid Resale Certificates for all states that you are located in, as well as for any other
FISCAL YEAR 2016 AT A GLANCE Number of Authorized Firms
 FISCAL YEAR 2016 AT A GLANCE Number of Authorized Firms 300,000 275,000 250,000 225,000 200,000 175,000 150,000 125,000 100,000 246,565 252,962 261,150 258,632 260,115 FY 2012 FY 2013 FY 2014 FY 2015 FY
JH Insurance Licensing Guide
 JH Insurance Licensing Guide Insurance policies and/or associated riders and features may not be available in all states. Life insurance is underwritten by John Hancock Life Insurance Company (U.S.A.),
State Postal Abbreviation Codes
 State Postal Areviation Codes State Areviation State Areviation Alaama AL Montana MT Alaska AK Neraska NE Arizona AZ Nevada NV Arkansas AR New Hampshire NH California CA New Jersey NJ Colorado CO New Mexico
Percent Corporate Dividend Received Deduction. Per Share Long-Term Capital Gain Distribution
 First Trust Advisors L.P 120 East Liberty Drive, Suite 400 Wheaton, IL 60187 1-800-621-1675 Fund Name (Ticker Symbol) Ordinary Qualified Corporate Dividend Received Deduction Long-Term Capital Gain Distribution
Financial Transaction Form for IRA and Non-Qualified Contracts Only
 Financial Transaction Form for IRA and Non-Qualified Contracts Only (Note: See Form ZA-8642 dealing with Financial Transactions for 403(b)/TSA s) Please Print All Information Below Zurich American Life
State Retiree Health Care Liabilities: An Update Increased obligations in 2015 mirrored rise in overall health care costs
 A brief from Sept 207 State Retiree Health Care Liabilities: An Update Increased obligations in 205 mirrored rise in overall health care costs Overview States paid a total of $20.8 billion in 205 for nonpension
SURVEY OF STATE FUNDING FOR PUBLIC TRANSPORTATION
 SURVEY OF STATE FUNDING FOR PUBLIC TRANSPORTATION SURVEY OF STATE FUNDING FOR PUBLIC TRANSPORTATION Characteristics of State Funding for Public Transportation The following report provides a summary of
The Puzzling Decline in State Sales Tax Collections
 The Puzzling Decline in State Sales Tax Collections Introduction This is the first of a series of papers that will investigate fiscal problems confronting the states. In spite of low unemployment rates,
Comparative Revenues and Revenue Forecasts Prepared By: Bureau of Legislative Research Fiscal Services Division State of Arkansas
 Comparative Revenues and Revenue Forecasts 2010-2014 Prepared By: Bureau of Legislative Research Fiscal Services Division State of Arkansas Comparative Revenues and Revenue Forecasts This data shows tax
Quality & Nondestructive Testing Industry. Salary Survey Your Path to the Perfect Job Starts Here.
 Quality & Nondestructive Testing Industry Salary Survey 2011 Your Path to the Perfect Job Starts Here. ABOUT PQNDT PQNDT (Personnel for Quality and Nondestructive Testing) is the leading personnel recruitment
STATE MOTOR FUEL TAX INCREASES:
 STATE MOTOR FUEL TAX INCREASES: 2013-2018 Since 2013, 27 states have increased or adjusted taxes on motor fuel to support needed transportation investments. Twenty-four of those states increased their
Motor Vehicle Sales/Use, Tax Reciprocity and Rate Chart-2005
 The following is a Motor Vehicle Sales/Use Tax Reciprocity and Rate Chart which you may find helpful in determining the Sales/Use Tax liability of your customers who either purchase vehicles outside of
MINIMUM WAGE INCREASE GUIDE
 2017-2018 MINIMUM WAGE INCREASE GUIDE The Federal minimum wage has been $7.25 since 2009, but many states and localities have passed their own minimum wage laws. Employers must pay non-exempt employees
University of Wisconsin System SFS Business Process AP /1042s/Tax Bolt-On
 Contents 1099/1042-S Tax Bolt-On Process Overview... 1 Process Detail... 2 I. Search/Update for Existing Value 1099 / 1042 Records on the Bolt-On table... 2 II. Enter a New 1099/1042s records into the
DC Contributions to the DC College Savings Plan of up to $4,000 per year by an individual, and up to $8,000 per year by married taxpayers who each mak
 AK AL AR Summary of State Tax Implications for 529 Plans Current as of 04/25/2018 This information has been compiled for informational purposes only from sources believed to be reliable, however LPL makes
Required Training Completion Date. Asset Protection Reciprocity
 Completion Alabama Alaska Arizona Arkansas California State Certification: must complete initial 16 hours (8 hrs of general LTC CE and 8 hrs of classroom-only CE specifically on the CA for LTC prior to
MINIMUM WAGE INCREASE GUIDE
 2017-2018 MINIMUM WAGE INCREASE GUIDE The Federal minimum wage has been $7.25 since 2009, but many states and localities have passed their own minimum wage laws. Employers must pay non-exempt employees
New Agent Welcome Kit
 New Agent Welcome Kit 4301 Morris Park Drive Mint Hill, NC 28227 (704) 568-9649 (866) 568-9649 messerfinancial.com The Trusted Partner For Talented Agents This is the foundation that MESSER Financial was
Health and Health Coverage in the South: A Data Update
 February 2016 Issue Brief Health and Health Coverage in the South: A Data Update Samantha Artiga and Anthony Damico With its recent adoption of the Affordable Care Act (ACA) Medicaid expansion to adults,
State Estate Taxes BECAUSE YOU ASKED ADVANCED MARKETS
 ADVANCED MARKETS State Estate Taxes In 2001, President George W. Bush signed the Economic Growth and Tax Reconciliation Act (EGTRRA) into law. This legislation began a phaseout of the federal estate tax,
Financial Firsts: When Do People Take Their First Financial Steps? Appendix: Annotated Questionnaire 1
 Financial Firsts: When Do People Take Their First Financial Steps? Appendix: Annotated Questionnaire 1 Conducted for AARP by at the University of Chicago through the Amerispeak Panel Interviews: 946 adults
Annual Costs Cost of Care. Home Health Care
 2017 Cost of Care Home Health Care USA National $18,304 $47,934 $114,400 3% $18,304 $49,192 $125,748 3% Alaska $33,176 $59,488 $73,216 1% $36,608 $63,492 $73,216 2% Alabama $29,744 $38,553 $52,624 1% $29,744
Checkpoint Payroll Sources All Payroll Sources
 Checkpoint Payroll Sources All Payroll Sources Alabama Alaska Announcements Arizona Arkansas California Colorado Connecticut Source Foreign Account Tax Compliance Act ( FATCA ) Under Chapter 4 of the Code
Fundamentals and Best Practices for Handling Multistate Taxation Presented Thursday, April 16, 2015
 1 Fundamentals and Best Practices for Handling Multistate Taxation Presented Thursday, April 16, 2015 2 Housekeeping 3 Credit Questions Today s topic Speaker To earn RCH credit you must 4 Stay on the webinar,
Health Coverage for the Black Population Today and Under the Affordable Care Act
 fact sheet Health Coverage for the Black Population Today and Under the Affordable Care Act July 2013 As of 2011, 37 million individuals living in the United States identified as Black or African American.
Medicaid & CHIP: February 2014 Monthly Applications, Eligibility Determinations, and Enrollment Report April 4, 2014
 DEPARTMENT OF HEALTH & HUMAN SERVICES Centers for Medicare & Medicaid Services 7500 Security Boulevard, Mail Stop S2-26-12 Baltimore, Maryland 21244-1850 Medicaid & CHIP: February 2014 Monthly Applications,
Housing Market Update. September 23, 2013
 Housing Market Update September 23, 2013 Overview Housing market gradually recovering from the deepest and longest downturn since the Great Depression. Excess supply of housing largely worked off. Underlying
Kentucky , ,349 55,446 95,337 91,006 2,427 1, ,349, ,306,236 5,176,360 2,867,000 1,462
 TABLE B MEMBERSHIP AND BENEFIT OPERATIONS OF STATE-ADMINISTERED EMPLOYEE RETIREMENT SYSTEMS, LAST MONTH OF FISCAL YEAR: MARCH 2003 Beneficiaries receiving periodic benefit payments Periodic benefit payments
STATE MOTOR FUEL TAX INCREASES:
 Since 2013, 26 states have increased or adjusted taxes on motor fuel to support needed transportation investments. Twenty-three of those states increased their state gas tax, while three states Kentucky,
Pay Frequency and Final Pay Provisions
 Pay Frequency and Final Pay Provisions State Pay Frequency Minimum Final Pay Resign Final Pay Terminated Alabama Bi-weekly or semi-monthly No Provision No Provision Alaska Semi-monthly or monthly Next
National Vital Statistics Reports
 National Vital Statistics Reports Volume 60, Number 9 September 14, 2012 U.S. Decennial Life Tables for 1999 2001: State Life Tables by Rong Wei, Ph.D., Office of Research and Methodology; Robert N. Anderson,
State Individual Income Taxes: Personal Exemptions/Credits, 2011
 Individual Income Taxes: Personal Exemptions/s, 2011 Elderly Handicapped Blind Deaf Disabled FEDERAL Exemption $3,700 $7,400 $3,700 $7,400 $0 $3,700 $0 $0 $0 $0 Alabama Exemption $1,500 $3,000 $1,500 $3,000
Percent Corporate Dividend Received Deduction. Per Share Long-Term Capital Gain Distribution
 Tax First Trust Exchange-Traded AlphaDEX Fund II First Trust Emerging Markets AlphaDEX Fund (FEM) $0.683600 56.06% --- --- --- $0.063840 100.00% --- --- --- First Trust China AlphaDEX Fund (FCA) $0.683600
Aetna Individual Direct Pay Commissions Schedule
 Aetna Individual Direct Pay Commissions Schedule Cards Issued Broker Rate Broker Tier Per Year 1st Yr 2nd Yr 3+ Yrs Levels 11-Jan 4.00% 4.00% 3.00% Bronze 24-Dec 6.00% 4.00% 3.00% Silver 25-49 8.00% 4.00%
The Economics of Homelessness
 15 The Economics of Homelessness Despite frequent characterization as a psychosocial problem, the problem of homelessness is largely economic. People who become homeless have insufficient financial resources
Motor Vehicle Financial Responsibility Forms
 Alphabetical Index Forms are listed alphabetically by form title. Important Note: The forms shown herein for each state may not be a complete listing of all the financial responsibility forms that are
Federal Rates and Limits
 Federal s and Limits FICA Social Security (OASDI) Base $118,500 Medicare (HI) Base No Limit Social Security (OASDI) Percentage 6.20% Medicare (HI) Percentage Maximum Employee Social Security (OASDI) Withholding
ES Figure 1 Federal Medicaid Spending Under Current Law and the House Budget Plan, % Reduction in Spending $4,591
 I S S U E P A P E R kaiser commission o n medicaid a n d t h e uninsured October 2012 National and State-by-State Impact of the 2012 House Republican Budget Plan for Medicaid John Holahan, Matthew Buettgens,
State Corporate Income Tax Collections Decline Sharply
 Corporate Income Tax Collections Decline Sharply Nicholas W. Jenny and Donald J. Boyd The Rockefeller Institute Fiscal News: Vol. 1, No. 3 July 26, 2001 According to a report from the Congressional Budget
Electronic Supplementary Material for the Article: The Impact of Internet Diffusion on Marriage Rates: Evidence from the Broadband Market
 Electronic Supplementary Material for the Article: The Impact of Internet Diffusion on Marriage Rates: Evidence from the Broadband Market By Andriana Bellou 1 Appendix A. Data Definitions and Sources This
May Complaint snapshot: Debt collection
 May 2018 Complaint snapshot: Debt collection Table of contents Table of contents... 1 1. Complaint volume... 2 1.1 By product... 3 1.2 By state... 8 2. Product spotlight: Debt collection... 11 2.1 Complaints
How is the Affordable Care Act Leading to Changes in Medicaid Today? State Adoption of Five New Options
 P O L I C Y B R I E F kaiser commission on medicaid and the uninsured How is the Affordable Care Act Leading to Changes in Medicaid Today? State Adoption of Five New Options May 2012 One primary goal of
Motor Vehicle Financial Responsibility Forms
 Alphabetical Index Forms are listed alphabetically by form title. Important Note: The forms shown herein for each state may not be a complete listing of all the financial responsibility forms that are
The table below reflects state minimum wages in effect for 2014, as well as future increases. State Wage Tied to Federal Minimum Wage *
 State Minimum Wages The table below reflects state minimum wages in effect for 2014, as well as future increases. Summary: As of Jan. 1, 2014, 21 states and D.C. have minimum wages above the federal minimum
Underwriting Results by State. Based on Data Valued as of December 31, 2016
 Underwriting Results by State Based on Data Valued as of December 31, 2016 TABLE OF CONTENTS Executive Summary 2 Introduction to the Underwriting Results by State 5 Underwriting Results by Component 6
Big Bad Banks? The Winners and Losers from Bank Deregulation in the United States
 Online Internet Appendix Big Bad Banks? The Winners and Losers from Bank Deregulation in the United States THORSTEN BECK, ROSS LEVINE, AND ALEXEY LEVKOV January 2010 In this appendix, we provide additional
Tax Recommendations and Actions in Other States. Joel Michael House Research Department June 9, 2011
 Tax Recommendations and Actions in Other States Joel Michael House Research Department June 9, 2011 Governors FY 2012 Recommendations 12 governors recommend net revenue (tax and fee) increases 12 governors
Impacts of Prepayment Penalties and Balloon Loans on Foreclosure Starts, in Selected States: Supplemental Tables
 THE UNIVERSITY NORTH CAROLINA at CHAPEL HILL T H E F R A N K H A W K I N S K E N A N I N S T I T U T E DR. MICHAEL A. STEGMAN, DIRECTOR T 919-962-8201 OF PRIVATE ENTERPRISE CENTER FOR COMMUNITY CAPITALISM
Union Members in New York and New Jersey 2018
 For Release: Friday, March 29, 2019 19-528-NEW NEW YORK NEW JERSEY INFORMATION OFFICE: New York City, N.Y. Technical information: (646) 264-3600 BLSinfoNY@bls.gov www.bls.gov/regions/new-york-new-jersey
State Income Tax Tables
 ALABAMA 1 st $1,000... 2% Next 5,000... 4% Over 6,000... 5% ALASKA... 0% ARIZONA 1 1 st $10,000... 2.87% Next 15,000... 3.2% Next 25,000... 3.74% Next 100,000... 4.72% Over 150,000... 5.04% ARKANSAS 1
AIG Benefit Solutions Producer Licensing and Appointment Requirements by State
 3600 Route 66, Mail Stop 4J, Neptune, NJ 07754 AIG Benefit Solutions Producer Licensing and Appointment Requirements by State As an industry leader in the group insurance benefits market, AIG is firmly
STATE MINIMUM WAGES 2017 MINIMUM WAGE BY STATE
 STATE MINIMUM WAGES 2017 MINIMUM WAGE BY STATE The table below, created by the National Conference of State Legislatures (NCSL), reflects current state minimum wages in effect as of January 1, 2017, as
State Unemployment Insurance Tax Survey
 444 N. Capitol Street NW, Suite 142, Washington, DC 20001 202-434-8020 fax 202-434-8033 www.workforceatm.org State Unemployment Insurance Tax Survey NATIONAL ASSOCIATION OF STATE WORKFORCE AGENCIES April
Presented Tuesday, April 2, 2015
 1 Presented Tuesday, April 2, 2015 2015 The Payroll Advisor 2 Housekeeping 3 Credit Questions Today s topic Speaker 2015 The Payroll Advisor To earn RCH credit you must 4 Stay on the webinar, online for
Federal Registry. NMLS Federal Registry Quarterly Report Quarter I
 Federal Registry NMLS Federal Registry Quarterly Report 2012 Quarter I Updated June 6, 2012 Conference of State Bank Supervisors 1129 20 th Street, NW, 9 th Floor Washington, D.C. 20036-4307 NMLS Federal
Table PDENT-CH (continued) This measure identifies the percentage of children ages 1 to 20 who are covered by Medicaid or CHIP Medicaid Expansion
 This measure identifies the percentage of children ages 1 to 20 who are covered by Medicaid or CHIP Medicaid Expansion") Table PDENT-CH. Percentage of Eligibles Ages 1 to 20 who Received Preventive Dental Services, as Submitted by States for the FFY 2016 Form CMS-416 Report (n = 50 states) State Denominator Rate State Mean
Table PDENT-CH. Percentage of Eligibles Ages 1 to 20 who Received Preventive Dental Services, as Submitted by States for the FFY 2016 Form CMS-416 Report (n = 50 states) State Denominator Rate State Mean
The Costs and Benefits of Half a Loaf: The Economic Effects of Recent Regulation of Debit Card Interchange Fees. Robert J. Shapiro
 The Costs and Benefits of Half a Loaf: The Economic Effects of Recent Regulation of Debit Card Interchange Fees Robert J. Shapiro October 1, 2013 The Costs and Benefits of Half a Loaf: The Economic Effects
Monthly Complaint Report
 August 2016 Monthly Complaint Report Vol. 14 Table of contents Table of contents... 1 1. Complaint volume... 2 1.1 Complaint volume by product... 3 1.2 Complaint volume by state... 7 1.3 Complaint volume
2012 RUN Powered by ADP Tax Changes
 2012 RUN Powered by ADP Tax Changes Dear Valued ADP Client, Beginning with your first payroll with checks dated in 2012, you and your employees may notice changes in your paychecks due to updated 2012
PAY STATEMENT REQUIREMENTS
 PAY MENT 2017 PAY MENT Alabama Alaska Arizona Arkansas California Colorado Connecticut Delaware District of Columbia Florida Georgia No generally applicable wage payment law for private employers. Rate
Oregon Workers Compensation Premium Rate Ranking
 Oregon Workers Compensation Premium Rate Ranking Calendar Year 2008 Information Management Division Oregon Department of Consumer & Business Services March 2009 Oregon Workers Compensation Premium Rate
NASRA Issue Brief: Public Pension Plan Investment Return Assumptions
 NASRA Issue Brief: Public Pension Plan Investment Return Assumptions Updated February 2017 As of September 30, 2016, state and local government retirement systems held assets of $3.82 trillion. 1 These
Eaton Vance Open-End Funds
 Eaton Vance Eaton Vance Open-End Funds 2016 Additional Tax Information Our Investment Affiliates Eaton Vance Management Contents Income by State 2 Tax-Exempt Income and AMT by Fund 9 Dividends-Received
STATE SMALL BUSINESS CREDIT INITIATIVE: A SUMMARY OF STATES QUARTERLY REPORTS
 STATE SMALL BUSINESS CREDIT INITIATIVE: A SUMMARY OF STATES QUARTERLY REPORTS DECEMBER 31, 2016 Summary Created by the Small Business Jobs Act of 2010 (P.L. 111-240) (the Act), the State Small Business
Termination Final Pay Requirements
 State Involuntary Termination Voluntary Resignation Vacation Payout Requirement Alabama No specific regulations currently exist. No specific regulations currently exist. if the employer s policy provides
SBA s Disaster Assistance Program
 SBA s Disaster Assistance Program Frank Skaggs, Center Director Field Operations Center East Atlanta, GA Florida Governor s Hurricane Conference Orlando, FL May 11-16, 2014 1 Mission To help people recover