Why Should Tanzanians Pay Taxes?
|
|
|
- Barnaby Golden
- 6 years ago
- Views:
Transcription


1 ?dq[xr 3XbR[^bdaT 0dcW^aXiTS?dQ[XR 3XbR[^bdaT 0dcW^aXiTS?dQ[XR 3XbR[^bdaT 0dcW^aXiTS THE WORLD BANK GROUP 05A820 A468>= <02A>42>=><82B 0=3 58B20; <0=064<4=C JULY 2015 ISSUE 7?dQ[XR 3XbR[^bdaT 0dcW^aXiTS The World Bank Group Macroeconomics and Fiscal Management Global Practice Africa Region Why Should Tanzanians Pay Taxes? The unavoidable need to ½ RERGI IGSRSQMG HIZIPSTQIRX

2 TANZANIA ECONOMIC UPDATE JULY 2015, 7 TH EDITION b
3 The World Bank Group Macroeconomics and Fiscal Management Global Practice Africa Region Table of Contents Foreword...v Abbreviations and acronyms... vii Acknowledgment... viii Key Messages... ix PART I: The State of the Economy Recent Developments Outlook: Managing stability in a volatile environment Finding new ways to finance Tanzania s future development...17 PART II: Why Tanzanians should be paying taxes Tanzania needs to collect more tax A brief assessment of Tanzania s tax performance A comprehensive approach...33 Statistical Annexes Key macroeconomic indicators Real GDP growth rates Shares of economic activity in GDP Fiscal framework Balance of payments Monthly imports of goods and services Monthly exports of hoods and services Inflation rates Monthly food crop prices Average wholesale prices Interest rate structures Monetary aggregates National debt developments Poverty by geographic regions Tanzania mainland tax revenue collection `...62 i
4 TANZANIA ECONOMIC UPDATE JULY 2015, 7 TH EDITION List of Figures Figure 1: Tanzania: The fastest growing economy in EAC... 4 Figure 2: Tanzania s sector growth rates in Figure 3: Declining inflation... 5 Figure 4: The Shilling has lost value against almost all major currencies... 5 Figure 5: Accelerated depreciation of the weighted nominal and real effective exchange rates in recent months... 5 Figure 6: Stable international reserves and current account deficit... 7 Figure 7: Stable trade flows but significant shift in their composition between 2013 and Figure 8: Businesses cost structure determines the impact of ower transport and energy costs Figure 9: Stable fiscal deficit...11 Figure 10: Weak tax performance leads to slower execution rate of spending...11 Figure 11: Sustained low monetary growth since 2011, stable nominal interest rates, and rising real interest rates Figure 12: Composition of monetary growth has shifted towards credit growth to government Figure 13: Slowdown in the increase of public expenditures Figure 14: Caused by weaker revenue performance and lower aid inflows Figure 15: Tanzania s revenue collection effort is low even adjusted for its per capita income...24 Figure 16: Average dependence on domestic revenue to finance public spending...24 Figure 17: Slow improvement in tax collection...27 Figure 18: The structure of the Tanzanian tax system differs from other low income countries...27 Figure 19: VAT yields are one of the worst in the world...28 Figure 20: Sector concentration of VAT collection on domestic transactions...29 Figure 21: Yield of import duties is at the bottom of the continent...30 Figure 22: Regional concentration on Dar es Salaam Figure 23: Why Tanzanians do not pay taxes...34 Figure 24: Lower corporate income tax can boost growth...39 ii
5 The World Bank Group Macroeconomics and Fiscal Management Global Practice Africa Region List of Tables Table 1: Nominal price indices, actual and forecasts Table 2: Macroeconomic projections...15 List of Boxes Box 1: The pulse of the economy... 6 Box 2: How can the private sector help deliver public goods...25 Box 3: The cost of a misunderstood VAT...32 Box 4: Psychology is key in tax matters...40 Box 5: Do the benefits from tax incentives outweigh the costs in Tanzania?...42 Box 6: Potential to tax more real property...43 Box 7: Prizes for paying taxes, can a lottery incentivize tax payment?...44 Box 8: Publish what you pay...46 iii
6 TANZANIA ECONOMIC UPDATE JULY 2015, 7 TH EDITION iv
7 The World Bank Group Macroeconomics and Fiscal Management Global Practice Africa Region Foreword Few of us like to pay taxes. Yet, every day we travel on roads funded by the government; we depend on hospitals, on the justice system and on many other services receiving public funds. Of course, we have the right to complain about issues of quality regarding public services. Any Government should be able to guarantee that tax payer money is used efficiently and transparently. While efforts continue to improve quality and efficiency of public services, all of us have to do our share and pay our taxes. public services do not produce the revenue streams that can make the services commercially viable. And establishing public-private partnerships to finance development on a large scale will take time as there are many remaining deficiencies in the legal and regulatory framework. There is also strong resistance related to ideology and political factors. In any case, it is clear that improving the public sector s capacity to deliver will require improved efficiency in public spending, as well as higher tax revenues. This seventh economic update goes to the heart of one of the main challenges faced by Tanzania: how can the country finance its development? This is a fundamental question when aid is coming down as a proportion of a growing GDP, and as access to financial markets remains limited. One option would be to rely more on the private sector to deliver education, health, roads, ports and electricity. This is possible as demonstrated by many such experiences around the world, and therefore this approach needs to be one important part of the solution to finance development. But it cannot be the only answer as many The argument presented in this Economic Update is that higher tax revenues will come only if a comprehensive approach is adopted. The tax system has to be affordable, fair, simple, and transparent. The government also has to be accountable for the money it is receiving. It is only when these basic conditions are met that tax compliance will increase. Because a strong social contract between the State and its citizens is not yet sufficiently in place in Tanzania, a number of suggestions are proposed in the Update, with the objective of stimulating debate on possible approaches to increase tax revenue. v
8 TANZANIA ECONOMIC UPDATE JULY 2015, 7 TH EDITION The question of how to finance Tanzania s economic development has become even more pressing in recent times. Lower than projected tax revenue and reduced aid inflows have forced the government to cut its ambitious spending plans. A large amount of arrears has been accumulated and their payment, partly through bonds, will increase the Government s debt service in the coming years. To address these issues, there is no other option for the Government than to raise domestic revenues. Succeeding in raising revenues will help the authorities to meet their financial responsibilities as well as to find the fiscal space to make productive investments and to address the needs of all Tanzanians. Philippe Dongier Country Director for Tanzania, Uganda and Burundi vi
9 The World Bank Group Macroeconomics and Fiscal Management Global Practice Africa Region Abbreviations and acronyms AfDB ATAF BBC BoT BRELA BRN BTU DAWASCO DRC EAC EFDs EITI FDI GBP GDP HMRC HMT IMF IPTL LGAs LNG MoF NBS PAYE PER PMORALG PPPs PSPF TANESCO TRA TZS UDSM UK US USA USD VAT WITS African Development Bank African Tax Administration Forum British Broadcasting Corporation Bank of Tanzania Business Registrations and Licensing Agency Big Results Now British thermal unit Dar es salaam Water and Sewerage Corporation Democratic Republic of the Congo East African Community Electronic Fiscal Devices Extractives Industries Transparency Initiative Foreign Direct Investment Great British Pound Gross Domestic Product Her Majesty s Revenue and Customs Her Majesty s Treasury International Monetary Fund Independent Power Tanzania Limited Local Government Authority Liquefied Natural Gas Ministry of Finance National Bureau of Statistics Pay As You Earn Public Expenditure Review Prime Minister s Office Regional Administration and Local Government Public-Private Partnerships Public Service Pension Fund Tanzania Electrical Supply Company Tanzania Revenue Authority Tanzanian Shilling University of Dar es Salaam United Kingdom United States United States of America United States Dollars Value Added Tax World Integrated Trade Solutions vii
10 TANZANIA ECONOMIC UPDATE JULY 2015, 7 TH EDITION Acknowledgment This seventh edition of the Tanzania Economic Update was prepared by Mahjabeen Haji (part 1) and Victoria Cunningham (part 2) under the supervision of Jacques Morisset. The authors acknowledge the contributions of Emmanuel A. Mungunasi, Yutaka Yoshino, and Chiara Bronchi; and comments by the IMF Tanzania team, led by Hervé Joly. The report benefited from the insights of Blanca Moreno-Dodson and Marijn Verhoeven. The team received guidance from Albert Zeufack and Philippe Dongier. Irfan Kortschak edited the report, while Justina Kajange provided invaluable assistance during its preparation. viii
11 The World Bank Group Macroeconomics and Fiscal Management Global Practice Africa Region Key messages Paying taxes lies at the heart of the fiscal contract between the State and its citizens. It is an individual decision for each taxpayer who will balance her or his incentives and costs to comply with the law. It is also a collective decision that will ultimately determine the Government s capacity to deliver public goods, including infrastructure and social services. There is no blue print on how to balance these decisions as tax collection efforts and policy vary significantly around the world, even between countries with similar income levels. A set of simple rules, based on common sense, can be used to evaluate the quality of a tax system. First, the system should be perceived as fair, affordable and transparent by taxpayers. Second, the level of tax revenues should be sufficient for the State to satisfy the current and future needs of its citizens. On both of these two counts, Tanzania might not be passing the bar. In spite of progress during the late 2000s, the current level of tax revenues in Tanzania remains extremely low, at the equivalent of approximately 12 percent of GDP. The low level of tax revenue collection reflects systemic issues in policy and administration. It also has serious implications for Tanzania s economic future. Tax revenues are currently too low to finance the country s ambitious, but vitally necessary, public investment program. At the same time, other sources of financing are increasingly limited, particularly with the decline in the value of aid inflows and with the limited availability of loans from the private sector. All countries need to secure a source of funding to finance their economic development. While governments may access a range of different sources of funding, depending on the role of State and the availability of alternative sources of funding in each economy, raising tax revenues is unavoidable for all except, perhaps, a small handful of extremely resource rich states. In light of recent economic developments and in light of the growing demand for infrastructure and social services, it appears that Tanzania must make significantly greater efforts to improve its tax collection performance. ix
12 TANZANIA ECONOMIC UPDATE JULY 2015, 7 TH EDITION Part 1: The State of the Economy The Tanzanian economy continues to remain on a positive trajectory, with a high rate of growth and a low rate of inflation. Over the past year, the rate of economic growth has remained in the range of seven percent, while the rate of inflation has stabilized at around five percent. The overall external balance was maintained in spite of a decline of about 10 percent in the level of reserves, with the Government expecting to limit its fiscal deficit to the equivalent of percent of GDP by the end of the fiscal year Tanzania has maintained a high level of economic stability over the past decade. It has maintained this stability despite the volatile international context, characterized by huge fluctuations in commodity prices and exchange rates. As a net oil importer, the sharp decline in oil prices has reduced the country s energy import bill. This decline initially transmitted into lower local energy prices but the recent depreciation of the local currency has reversed this trend. As of June 2015, electricity tariffs had declined by two percent, while the price of gasoline, kerosene and diesel is about 15 percent less than a year ago. So far, the fluctuations in other commodity prices has had a net neutral effect on the trade balance, with some increases (for example, cashew nuts) being offset by some declines (coffee, tea). While the local currency has lost value, the real depreciation has remained relatively limited so far, partly reversing the trend observed since 2011, proving the resilience of the Tanzanian economy to external shocks. However, domestic fiscal challenges are becoming increasingly significant. Due to Tanzania s worse than expected performance in tax collection, the Government has made the decision to reduce expenditure compared to the approved budget. By this means, it hopes to limit the overall deficit to the equivalent of percent of GDP by the end of the current fiscal year. This reduction in expenditure, by the equivalent of approximately two percent of GDP, still represents a slight increase compared to the level of expenditures reported in 2013/14, but it includes significant cuts to planned investment projects and to transfers to local governments. As in the recent past, arrears with contractors and pension funds may increase. These pressures need to be addressed in a politically charged environment, with national elections scheduled for October The short to medium term prospects for the Tanzanian economy remain positive, pending the absence of further major changes in world commodity prices. It is also necessary for the Government to continue to commit to fiscal sustainability and monetary prudence. If these conditions are met, the economy should continue to grow at approximately its current rate of seven percent per year, with an inflation rate of approximately five percent. In the x
13 The World Bank Group Macroeconomics and Fiscal Management Global Practice Africa Region next two years, the current account deficit is projected to remain at the equivalent of around 9-10 percent of GDP, with no major changes in capital inflows except for the continuing shift from aid to private capital, including a mix of non-concessional borrowing and foreign direct investment. The fiscal deficit is projected to reach a value in the range of 4.2 percent of GDP in 2015/16 and then 3.5 percent of GDP in 2016/17, at which levels debt and debt servicing will remain sustainable. 2012/13. In addition, the Government has accumulated massive arrears over the past few years, including in 2013/14 and in 2014/15. The plan is to pay those arrears through the issuance of domestic bonds. This will clarify the situation but contribute to a large increase in the Government s debt-service, from 14 percent of domestic revenues in 2014/15 to over 22 percent in 2015/16 onwards. This extra-burden on the Government s finances calls for a close monitoring of the fiscal situation. The Tanzanian economy is not immune to external shocks. The wrong combination of variations in world commodity prices could impact negatively on the country s trade balance. For example, given Tanzania s position as a net exporter of gold and a net importer of oil, the economy would doubtless suffer as a result of lower gold prices combined with higher oil prices. Regional instability could also have a negative impact on the recent expansion of the manufacturing export sector to neighboring countries and on the tourism industry. Sustained low energy prices on world markets could affect the decision of multinationals to invest in the natural gas sector. On the domestic front, the Government s commitment to fiscal sustainability may come under further pressure. Already, in the past two years, the authorities have faced difficulties meeting their target for the overall fiscal deficit, with this target being missed by almost one percent in Tanzania s recent fiscal challenges reflect the deep change in the country s public finances over the past few years. During the 2000s, the Government was able to increase the real value of its spending by an average of approximately 13 percent per year, with these increases being made possible by sustained growth in the value of external aid and by improved tax collection. The subsequent deceleration in these two sources of financing has led to a slower rate of increase in public expenditures, with these expenditures increasing by an average annual rate of only three percent in the period from 2010/11 and 2013/14. This is insufficient to sustain the needs of a rapidly expanding population. In addition to measures to improve revenue collection, it is also necessary to improve the efficiency of public expenditures to improve outcomes. Tanzania will ultimately have to find a means to finance its economic development with its own revenues, which means improving xi
14 TANZANIA ECONOMIC UPDATE JULY 2015, 7 TH EDITION tax collection. In spite of recent efforts, Tanzania s record in this regard remains one of the worst in the world. Part 2: Why should Tanzanians pay more Taxes? Tanzania currently collects approximately USD 6 billion in tax revenues per year, a figure equivalent to around 12 percent of its GDP. This covers approximately three quarters of the Government s expenses. This is insufficient, particularly when other sources of funding, such as foreign inflows, are declining, or limited, such as borrowing and private sector finance. Tanzania s need for funds is projected to increase dramatically in the coming years, partly due to its rapidly growing population. To illustrate this, if Tanzania aims to achieve a secondary school registration rate of 60 percent by 2020 and if the current cost of schooling an individual student remains constant, Tanzania s annual secondary school budget will need to double. Thus, Tanzania, like other low-income countries, must intensify its tax revenue collection efforts. Tax collection performance is obviously linked to prosperity, with a strong correlation between tax revenues and GDP per capita. However, even countries with high rates of poverty can improve their performance in this area if a strong fiscal contract exists between the state and citizens. A recent survey indicates that many Tanzanians are reluctant to pay taxes because they see them as burdensome, unfair and lacking in transparency. To meet these three challenges, Tanzania will need to implement bold and innovative actions that go beyond the traditional administrative measures. This adaptation should go in three directions: 1. The system must be affordable. The actual cost of paying taxes is higher than on paper as demonstrated by Tanzania s poor ranking in the ease of paying taxes indicator in the World Bank s Doing Business survey. Here, the solution is to simplify the system. Tanzania should streamline the numerous small taxes, which impose a high burden on businesses without corresponding gains to government revenues. The Government must also reduce the use of tax exemptions. The explosion in the use of mobile devices represents a great opportunity for tax authorities to use accessible, cost-effective systems for taxpayers to make payments. Once transaction costs are reduced, tax compliance should improve resulting in higher revenues. With improved compliance, lowering existing statutory rates could be explored as an option to promote the development of private sector activities and so increase the number of taxpayers in the country. Such a strategy has been adopted by some emerging countries but should be carefully evaluated given the risk for the Tanzanian Government of losing tax revenues in the short-term. xii
15 The World Bank Group Macroeconomics and Fiscal Management Global Practice Africa Region 2. The system must be perceived as fair In particular, it is necessary to broaden the tax base. In Tanzania, close to 90 percent of tax revenues are generated by Dar-es-Salaam, yet the city contributes to less than 20 percent of the national GDP. Almost half of Tanzanian VAT revenues on domestic transactions are collected from three sectors (telecommunications, beverages, and cigarettes). There is a huge imbalance between the taxation on labor and capital income. Tax collection should be diversified to under-taxed sectors and regions. Property taxes should be appropriately used not just to boost government revenues but also to improve land management. Smart innovations can also modify taxpayers behavior. The introduction of a so-called tax lottery, where the tax receipt is also a lottery ticket making the holder eligible for attractive prizes, has been successful in China and Mauritius. Similarly, public recognition of high tax payers can also incentivize payment. Of course, stronger and effective sanctions against tax evaders are also vitally necessary. 3. The system must be transparent. The Government needs to publish comprehensive, accessible reports on its tax collection efforts. In this area, the private sector can play a role. Some major telecom companies in Tanzania have announced that they will voluntarily publish full details of their tax payments. Such a level of transparency should be mandatory for all public enterprises and agencies. The successful Extractive Industries Transparency Initiative could be replicated in other sectors, especially in those dominated by a few operators, such as the tourism, finance and communications sectors. The implementation of these actions may test the Government s political commitment. Without doubt, if the measures described above are implemented appropriately, there will be winners and losers. While these actions will provide gains for Tanzania as a whole, those gains may occur to the detriment of politically powerful vested interests. This may make implementation politically challenging. Political commitment is essential for tax reforms to be implemented and sustained. While securing this commitment will by no means be easy, it is vital if Tanzania is to secure the funds it needs to work with the private sector to finance economic and social development for the benefit of all its citizens. xiii
16 TANZANIA ECONOMIC UPDATE JULY 2015, 7 TH EDITION xiv

17 The World Bank Group Macroeconomics and Fiscal Management Global Practice Africa Region 1 The State of the Economy 1
18 TANZANIA ECONOMIC UPDATE JULY 2015, 7 TH EDITION Part I: The State of the Economy In spite of volatile world commodity prices and increasing fiscal pressures, Tanzania s economy remains strong, with relatively rapid growth (7 percent); low inflation (around 5 percent); and a stable current account deficit. However, the Government has had to reduce its expenditure by the equivalent of approximately two percent of GDP relative to the level approved in its 2014/15 budget. The Government also needs to address significant accumulated arrears with contractors and pension funds. It should aim to achieve this by injecting funds and issuing bonds. Prospects for the economy in the short to medium term remain positive. However, the Government must remain committed to fiscal sustainability and monetary prudence. With the national elections scheduled for October 2015, this may become increasingly challenging. The gradual decline in the value of aid inflows and the weaker tax collection performance have led to a sharp decrease in the expansion of real public expenditure. The growth rate of expenditure has declined from an average of 13 percent per year during the 2000s to 3 percent since 2010/11. The Government must find new ways to finance vitally necessary economic development. One means by which it may achieve this is through improved tax revenue collection. 2
19 The World Bank Group Macroeconomics and Fiscal Management Global Practice Africa Region The primary threat to Tanzania s economy comes not from global turbulence, but from domestic issues. 1.1 Recent Developments These are turbulent times for the global economy. World prices of crude oil perhaps the most important of all traded goods have fallen by about 43 percent since June This volatility has had a dramatic effect on the overall global economy, impacting both oil importers and exporters. Other commodities have also experienced a high level of volatility, although to a lesser extent. Major currencies have fluctuated beyond expectations, with the Euro losing more than a quarter of its value relative to the US Dollar since the start of These changes are having significant effects on developing economies around the world, including those in Sub-Saharan Africa. In particular, the volatility has had a significant impact on the major oil exporting nations in the region, including Nigeria, Gabon and Angola. However, even countries that are less dependent on oil exports have been impacted, albeit to a lesser degree. It has been estimated that approximately 90 percent of the continent s economic activity will be negatively affected by the current commodity price shock. 1 How has the Tanzanian economy fared in this highly volatile context? At least in the short term, it continues to perform relatively well. The stability of the Tanzanian economy has not been significantly impacted by the recent turbulence in world commodity prices, with the rate of growth remaining high and the rate of inflation remaining low. In fact, the decline in oil prices has generally had a positive impact on the local economy. Tanzania is a net importer of oil products, so the decline in prices has resulted in a decline in the cost of its import bill. The magnitude of this impact will largely depend on the manner in which global prices are transmitted to local prices and on the period for which oil prices remain low. In the immediate future, it is expected that the Tanzanian economy will continue to remain on the same positive trajectory as in recent years. However, if long-term investments in natural gas are affected by lower oil prices, the long-term growth prospects for Tanzania may shift course. The primary threat to Tanzania s economy comes not from global turbulence, but from domestic issues. In particular, low levels of revenue, lower than anticipated aid inflows, and the accumulation of arrears with contractors and pension funds have disturbing implications for Tanzania s fiscal stability. With these issues gaining significance since 2012, the Government has had to respond through significant cuts in expenditure, at least compared to the targets indicated 2014/15 budget. This has made it difficult for the Government to implement its ambitious investment plans, despite the urgent need for investments in infrastructure and social services. The factors driving monetary growth have also changed in the recent past, with an 1 World Bank, The State of Africa, April
20 TANZANIA ECONOMIC UPDATE JULY 2015, 7 TH EDITION increase in the level of borrowing by the public sector. In this context, Tanzania urgently needs to find innovative and sustainable ways to finance its economic development. Despite external shocks, Tanzania s economic trajectory remains stable Tanzania s sustained economic growth, which stood at 7 percent in 2014, was higher than that of any other EAC country (see Figure 1). In 2014, the sectors with the highest rate of growth were construction, transport and financial services (see Figure 2). The contribution of the various sectors to growth varied slightly from the year 2013, when the communications and electricity sectors were also amongst the most rapidly expanding sectors. In terms of contribution to GDP, the construction, trade, agriculture and transport sectors remained the most significant contributors in On the demand side, the economy has continued to be driven primarily by growth in private consumption, followed by increases in the level of private investment. By contrast, the level of government consumption has declined substantially. The decrease in the value of the current account deficit in 2014 compared to the previous year also contributed positively to growth. In 2014, the sectors with the highest rate of growth were construction, transport and financial services. Figure 1: Tanzania: The fastest growing economy in EAC Figure 2: Tanzania s sector growth rates in 2014 GDP Growth Source: Ministry of Finance, NBS and World Bank The rate of inflation has declined over the past three years, dropping to 4.3 percent in March 2015 but slightly increasing to 5.3 percent in May This compares favorably to the rate of more than 19 percent at the end of The steady decline in the rate of inflation (Figure 3) is largely due to the combined impact of the implementation of prudent monetary policy and of the recent decreases in global food and energy prices. The recent depreciation of the local currency has however increased the cost of imports and contributed to the slight increase in the inflation rate in recent weeks. 4
21 The World Bank Group Macroeconomics and Fiscal Management Global Practice Africa Region Figure 3: Declining inflation Source: BoT Since early May 2015, the Tanzanian shilling has lost value against all media currencies, resulting in a nominal depreciation rate of approximately 16 percent since March The value of the Tanzanian Shilling has depreciated sharply against the currencies of the country s major trade partners over the past year, except for the Euro (Figure 4). Initially this depreciation reflected the relative strength of the US currency on international markets as well as the decline in aid inflows. The depreciation of the Tanzanian shilling was also partly controlled by the Central Bank, which sold USD 500 million worth of international reserves (about 10 percent of the total value of Tanzania s reserves) in the period Figure 4: The Shilling has lost value against almost all major currencies from January to April Since early May 2015, the Tanzanian shilling has lost value against all media currencies, resulting in a nominal depreciation rate of approximately 16 percent since March 2014 (Figure 5). The real depreciation was about five percent between March 2014 and April 2015, as the inflation differential between Tanzania and its major trade partners partially compensated for the decline in the nominal exchange rate. The recent depreciation of the real exchange rate should help improve the competitiveness of Tanzanians exports. Figure 5: Accelerated depreciation of the weighted nominal and real effective exchange rates in recent months Source: World Bank, BoT 5
22 TANZANIA ECONOMIC UPDATE JULY 2015, 7 TH EDITION Box 1: The pulse of the economy The views of the business managers of the top 100 mid-sized companies in Tanzania have been collected every six months since April This data is collected by KPMG through electronic questionnaires and responses are anonymous. As of May 2015, only one third of managers evaluate that the economy is performing better this year than last year, while up to 43 percent report deterioration. Looking forward, only one-third are optimistic for the economy and their own businesses. How do you believe the Tanzanian economy is performing compared to last year? In May 2015, only 34 percent of managers believed than the economy performed better in the last 12 months that last year. The rate of unfavorable views rose by 9 percent between December 2014 and May How do you expect the Tanzanian economy in the coming year? In May 2015, 34 percent of managers expected the economy to perform better in 2015/16 than in 2014/15, against 55 percent in November As of May 2015, one-third of managers anticipated a deterioration of the economic performance over the next 12 months, up from 10 percent in November How do you think that your own business will perform during the next 12 months compared to its current level of performance? In November 2013, 85 percent of managers expected an improved performance of their company during the next 12 months. This rate fell to only 32 percent by May Source: KPMG/World Bank, November 2013 May
23 The World Bank Group Macroeconomics and Fiscal Management Global Practice Africa Region In spite of the fluctuations in international exchange rates, Tanzania s balance of payments is expected to remain relatively stable, at least in the short-term. The current account deficit is expected to decline to the equivalent of 9.5 percent of GDP in 2014/15, down from 10.9 percent in 2013/14 (see Figure 6), with this decline being the result of result of both stable exports and the low cost of energy imports. At the same time, the value of capital inflows should remain roughly stable, at the equivalent of 12 percent of GDP, largely due to a resumption of budget support after a slowdown in disbursements at the beginning of the fiscal year. 2 As in previous years, the value of aid relative to private capital inflows (FDI and public non-concessional borrowing) has continued to decline. The overall value of Tanzania s international reserves is expected to remain at the level of around USD billion by the end of June 2015, a level sufficient to finance the equivalent of approximately four months of imports. Figure 6: Stable international reserves and current account deficit The change in the composition of imports was largely due to the 15 percent decline in the energy import bill. Source: IMF, BoT However, despite the stability in the current account, there has been a significant shift in the composition of both imports and exports. While the total value of imported goods remained approximately constant from 2013 to 2014, the relative proportion of consumer goods increased, while the proportion of intermediary goods declined. The change in the composition of imports was largely due to the 15 percent decline in the energy import bill (see Figure 7). At the same time, the total value of exports increased slightly by one percent over the same time period. However, the composition of these exports also changed, with the value of the export of agricultural commodities declining by five percent and that of minerals by 18 percent. By contrast, the value of manufacturing exports and other exports increased by 16 percent and 33 percent respectively. 2 While project and basket support was maintained, budget support was temporarily suspended in the context of the corruption scandal that took place in the energy sector. After resolution by the Government, including the resignation of two Ministers and the Attorney General, donors decided to resume budget support in March
24 TANZANIA ECONOMIC UPDATE JULY 2015, 7 TH EDITION Figure 7: Stable trade flows but significant shift in their composition between 2013 and 2014 Change in Exports Change in Imports Source: BoT Note: Other exports include: edible vegetables, oil seeds, cereals, cocoa, raw hides and skins, woods and articles thereof. In this context, the resilience of the Tanzanian economy can be explained by a combination of several factors. First, as stated above, the fluctuations in commodity prices on international markets have offset each other in terms of the impact on the country s trade balance. Second, the decline in oil prices has had only a limited impact on the Government budget. Most taxes imposed on oil are determined by unit quantity rather than by value. 3 On the other hand, lower imported oil prices will reduce the Government s own energy bill, which stands at approximately TZS 11 billion per year. It will also improve TANESCO s financial situation, with fuel imports accounting for approximately 15 percent of this parastatal s total costs. The sharp decline in international oil prices has also been partially compensated for by the accelerated depreciation of the local currency with respect to the US dollar and this has reduced the impact on local prices. 4 The transmission from global to local prices is affected by two main factors: first, there is a lag in the period of transmission from international to local oil prices due to shipping and contracting times. Second, a specific price formula (including a constant term for taxes, levies and a fixed retail mark-up) is applied to imported fuel for the conversion into local prices. The decline in oil prices has had only a limited impact on the Government budget. Most taxes imposed on oil are determined by unit quantity rather than by value. 3 The increase in levies collected on diesel and fuel announced during the Budget Speech on June 11, 2015 will increase revenues for the Government. 4 Local prices of fuel and electricity are regulated by EWURA. 8
25 The World Bank Group Macroeconomics and Fiscal Management Global Practice Africa Region Energy and transport only account for a small proportion of total household expenditures for the majority of households. Less than a quarter of the population has access to electricity, while the share of transportation in the average consumption basket is only 2.6 percent. This mitigates price volatility over time, especially for local operators. As a result, the prices of gasoline and diesel have only declined by 12 and 16 percent respectively in the period from July 2014 to June 2015, while the price of kerosene fell by 21 percent. 5 It should be noted that electricity tariffs declined by only two percent during this period, with regulators determining these tariffs on the basis of a number of considerations, including exchange rate fluctuations, in addition to oil prices. The decline in the local prices of energy-related products, while still significant, has had a relatively limited impact on most Tanzanian households. The main reason for this limited impact is that energy and transport only account for a small proportion of total household expenditures for the majority of households. Less than a quarter of the population has access to electricity, while the share of transportation in the average consumption basket is only 2.6 percent. In fact, the impact of the decline is more likely to be felt by households at both extremes of the economic scale. It may have had a more significant impact on the wealthiest households, who own private cars; as well as the poorest households, who spend up to 10 percent of their monthly budget on kerosene for cooking and lighting. But even in the latter case, the 21 percent reduction in kerosene prices would only have resulted in a decline in total household costs of about two percent. The direct impact of lower energy prices has certainly been more significant for the business sector, at least in the case of businesses with high transportation and electricity costs. For sectors such as horticulture and food processing, in which the cost of transportation is a significant component of total expenditure (see Figure 8), lower fuel prices will result in savings. For example, a decline in fuel prices of 12 percent would lead to a potential reduction of about 8 percent in the costs of operations in the horticulture sector, where the cost of transportation constitutes up to 75 percent of total costs. 6 Industries such as shipping, cement, steel and trucking companies, where fuel is a direct and significant cost, may also benefit from cost reductions. On the other hand, industries such as communications and services are not likely to be significantly affected by lower energy prices. 5 The lowest prices were reported in March 2015 but they rebounded as the result of the depreciation of the local currency and the slight increase in crude oil prices on international markets. The local price of gasoline increased by 19 percent between March and June This assumes that fuel prices account for approximately 90 percent of transport costs. 9
26 TANZANIA ECONOMIC UPDATE JULY 2015, 7 TH EDITION Figure 8: Businesses cost structure determines the impact of lower transport and energy costs Source: World Bank calculations, MIGA Growing challenges in Fiscal and Monetary Policies Over the past few years, Tanzania has increasingly faced challenges in achieving its desired level of fiscal deficit. Concurrently, there has been a marked change in the composition of monetary growth, with a relative increase in the value of credit to government and a relative decline in the value of net foreign assets. Fiscal policy: The Government remains committed to an overall fiscal deficit of the equivalent of percent of GDP for 2014/15. However, it has collected significantly lower values of domestic revenue than initially anticipated in the approved budget. This shortfall in revenues has been exacerbated by the decline in the value of inflows of budget support, with this decline being at least partially the result of the corruption scandal in the energy sector. To meet the fiscal objectives set out in the approved budget, the Government has cut public expenditure by the equivalent of approximately two percent of GDP compared to the approved 2014/15 budget figures. However, the total value of executed expenditures is still projected to be about four percent higher in real terms than it was in 2013/14. The Government has responded by slowing down the execution of public expenditure. This was done by reducing both investment and non-wage recurrent expenditures, including transfers to local governments, who are responsible for the delivery of most social services throughout the country. Although these cuts are necessary, they have reduced the Government s capacity to deliver and expand public and social services and to develop necessary infrastructure. This shortfall in revenues has been exacerbated by the decline in the value of inflows of budget support, with this decline being at least partially the result of the corruption scandal in the energy sector. 10
27 The World Bank Group Macroeconomics and Fiscal Management Global Practice Africa Region The total cost of servicing public debt now accounts for almost 14 percent of domestic revenues, compared to the figure of six percent in 2008/9. The Government has borrowed to compensate for the shortfall in domestic revenues and budget support. Total public debt is projected to reach the equivalent of 33 percent of GDP by the end of the current fiscal year, a slight increase from the figure of approximately 31 percent in 2010/11. 7 The total cost of servicing public debt now accounts for almost 14 percent of domestic revenues, compared to the figure of six percent in 2008/9. While these figures are undeniably increasing, they are still consistent with Tanzania s objective of remaining at low risk for debt distress. The Government has also continued to accumulate arrears. As of June 2014, the Figure 9: Stable fiscal deficit value of arrears to suppliers stood at close to TZS 2 trillion. With pressures resulting from the upcoming scheduled elections, the Government may face pressure to accumulate an even greater value of arrears. The vast majority of arrears have been accumulated with road contractors and pension funds. This situation is not sustainable, with the accumulation of arrears already affecting road construction and leading to financial distress in a major public pension fund (PSPF). To address this issue, the Government has developed an arrears clearance strategy, which will involve a combination of cash injections and the issuance of a series of bonds. Figure 10: Weak tax performance leads to slower execution rate of spending Source: MOF, World Bank Monetary policy: Over the past year, the annual growth rate of extended broad money supply (M3) has remained relatively stable at approximately 13.6 percent in the first quarter of 2015, accelerating slightly from an average rate of 12.9 percent in the first quarter of 2014 (See Figure 11). In December 2014, the Central Bank reduced the reserve requirements for commercial banks from 10 to 8 percent. This created a higher level of liquidity in the financial system. This measure was applied only temporarily, with a reversion to the original requirement in June This figure does not include the expected conversion of arrears into debt through the issuance of bonds. This conversion will increase the public debt level by approximately five percent of GDP. 11
28 TANZANIA ECONOMIC UPDATE JULY 2015, 7 TH EDITION Figure 11: Sustained low monetary growth since 2011, stable nominal interest rates, and rising real interest rates Source: BoT, IMF The composition of monetary growth has changed over the past few months (See Figure 12). While the rate of growth of M3 has remained relatively stable at around 15 percent, this growth is largely the result of a sharp increase in public borrowing, which was partly offset by the sale of international reserves. The total value of credit to the Government increased by approximately 50 percent from the first quarter of 2014 to the first quarter of This compares to an increase of 28 percent in the period between the same points in 2013 and Over the same period, the rate of expansion of credit to the private sector has remained stable, at between 16 to 20 percent. This change in the composition of monetary growth may lead to some crowding out of credit to the private sector in the future. Figure 12: Composition of monetary growth has shifted towards credit growth to government While the rate of growth of M3 has remained relatively stable at around 15 percent, this growth is largely the result of a sharp increase in public borrowing, which was partly offset by the sale of international reserves. Source: BoT, IMF 12
29 The World Bank Group Macroeconomics and Fiscal Management Global Practice Africa Region As a matter of fact, nominal interest rates have remained in the range of percent since 2003, largely due to the limited level of competition between commercial banks, excessive transaction costs, and a high level of risk. With rising real interest rates and stable nominal rates, the cost of credit has steadily increased for the private sector since 2012 (Figure 11). As in many developing countries, nominal lending interest rates in Tanzania appear to be relatively inelastic in the context of changes to monetary growth. As a matter of fact, nominal interest rates have remained in the range of percent since 2003, largely due to the limited level of competition between commercial banks, excessive transaction costs, and a high level of risk. 1.2 Outlook: Managing stability in a volatile environment Tanzania s overall macroeconomic situation is not expected to change dramatically in the short to medium term. Sustained low international energy prices may even stimulate economic activity by reducing pressure on the local currency as a result of a reduction in the current account imbalance. However, the country is not immune to further volatility in the commodity markets and may also be affected by regional instability. Furthermore, the authorities are facing serious fiscal challenges that will be difficult to address in the context of the upcoming elections. Short to medium term prospects The baseline scenario is built on the assumption that world commodity prices will remain at their current levels for the next two years, as forecast by the World Bank (see Table 1). It also assumes that the Government remains committed to fiscal sustainability and monetary prudence. If these assumptions hold true, the Tanzanian economy is forecast to grow at the rate of approximately seven percent per year, with inflation stabilizing at an annual rate of approximately 5 percent (see Table 2). The main drivers of economic growth should continue to be the construction, communication, finance, and transport sectors, with all of these sectors benefiting from increased urbanization and higher average living standards. Sustained low international energy prices will be gradually transmitted to local prices, reducing transport and energy costs for Tanzanian businesses and households. However, the recent depreciation of the local currency with respect to the US dollar has partly offset the initial decline. The announcement by the Government of higher levies on fuel will also increase the price of energy products locally. As a result, as stated in the previous section, these impacts are not likely to be extremely significant. The current account deficit is expected to narrow as a result of low world oil prices. The decline in the cost of imports of petroleum products should compensate for the relative stagnation in total exports, with the decline in the value of traditional exports expected to offset the increased value of manufacturing and services exports. The current account deficit will 13

30 TANZANIA ECONOMIC UPDATE JULY 2015, 7 TH EDITION continue to be financed by a combination of aid and private capital inflows, with the value of the former continuing to decline in proportion to the latter. The overall level of international reserves should remain relatively stable, increasing to approximately USD 5 billion in 2016/17. higher levies on fuel, and a series of administrative reforms aimed at reducing tax exemptions and broadening the tax base. Increased tax revenues should assist the Government to finance the wage bill, which is expected to increase as a result of higher minimum wages and the need to hire more teachers and If the Government maintains fiscal control, the overall fiscal deficit is projected to be approximately 4.2 percent of GDP in 2015/16 and fall to 3.5 percent of GDP in 2016/17. health workers to meet the country s need for basic services. The level of capital expenditures is projected to remain stable in percentage of GDP. The payment of arrears, financed through the This trajectory is consistent with issuance of a series of bonds in 2015/16, the Government s commitment to will increase the deficit in 2015/16 and maintaining fiscal sustainability and contribute to a jump in the Government s stabilizing the debt to GDP ratio over time. The authorities are expected to slightly increase their tax revenues through the implementation of the new VAT Act, debt level and debt servicing costs, which are expected to reach the equivalent of 39 percent of GDP and 23 percent of total revenues by the end of 2016/17. Table 1: Nominal price indices, actual and forecasts (2010=100) The payment of arrears, financed through the issuance of a series of bonds in 2015/16, will increase the deficit in 2015/16 and contribute to a jump in the Government s debt level and debt servicing costs. 14
31 The World Bank Group Macroeconomics and Fiscal Management Global Practice Africa Region Table 2: Macroeconomic projections (% of revised GDP unless otherwise indicated) 2012/ / /15 (p) 2015/16 (p) 2016/17 (p) Real GDP Growth (%) Inflation (CPI, %) Overall fiscal balance Current account balance Gross official reserves (USD million) 4,357 4,634 4,265 4,600 4,950 Source: World Bank Although Tanzania has been relatively isolated from the recent fluctuations in commodity prices, its economy is not fully immune to future fluctuations as illustrated by the recent movements in the exchange rate markets. External risks: Volatile commodity prices and regional instability The above projections assume that external risks remain limited for Tanzania. Although Tanzania has been relatively isolated from the recent fluctuations in commodity prices, its economy is not fully immune to future fluctuations as illustrated by the recent movements in the exchange rate markets. Of course, the increasing diversification of exports, with the increasing significance of manufacturing and services, has provided a welcome buffer. However, the wrong combination of commodity price volatility could result in a severely negative impact. For example, a simultaneous increase in oil prices and a decline in gold prices would result in a serious trade imbalance. Without further diversification, Tanzania s fate to some extent will be determined by luck, since commodity prices are determined exogenously and are almost entirely outside the control of Tanzanian policy makers. On the side of the capital account, uncertainties around future aid inflows might also create tensions, specifically if private capital inflows slowed down as the result of higher borrowing costs on international markets. In the medium to longer term, low oil and mineral prices may have a negative impact on the Tanzanian economy. The country is expecting massive foreign investment in its near-shore gas sector to take place in the medium term future. While a number of international oil companies are currently negotiating with the Government, no final investment decisions are expected to be made before If oil prices remain depressed over the longer term, the investment plans of multinational companies in the nearshore natural gas sector may be affected. While oil and gas prices are not fully linked, there is nonetheless a strong correlation between these two prices, as liquefied natural gas (LNG) contracts are generally heavily indexed to oil prices. It is estimated that the construction of the LNG plant in 15
32 TANZANIA ECONOMIC UPDATE JULY 2015, 7 TH EDITION Tanzania will remain cost effective as long as the price of gas remains above USD 10-12/mm BTU, which is equivalent to an oil price of about USD 70-80/bbl. In the shorter term, the decline in gas prices, and the prospect of lower profits, may complicate the negotiations between the Government and potential investors. In the context of lower commodity prices, a number of mining operators are considering scaling down their activities across the world. Eventually, some mining operations may also be scaled back in Tanzania. A further risk for Tanzania is regional instability. Regional trade has been on the increase, accounting for 40 percent of total exports in 2013, up from only 24 percent in This increase has played an important role in mitigating the impact of lower commodity prices on Tanzania s exports. However, some neighboring countries, such as Burundi, have been suffering from political instability, while others, such as Uganda and DRC, have scheduled national elections. This may negatively impact Tanzania s trade and its current account. Domestic risks: Fiscal slippages The main risk for Tanzania is domestic fiscal challenges. The Government has committed to maintaining its fiscal deficit at the equivalent of approximately three percent of GDP in the coming years. However, to achieve this, the Government will have to control its expenditure during the election campaign and allocate an increasing share of its spending to cover its debt service. Given the history of increased expenditure in preelection periods, this may be very difficult to achieve. Revenue projections also need to be realistic. In the last three approved budgets, the authorities forecast large increases in domestic revenues. In 2013/14 and 2014/15, revenue collection targets were missed by a wide margin. This forced subsequent cuts to public expenditure and led to the increased accumulation of arrears. In order to restore fiscal credibility, the Government must clear arrears accumulated with the private sector and pension funds. While the authorities have acknowledged arrears to contractors amounting to a value of USD400 million and to pension funds to a value of USD700 million, it remains unclear how and when these arrears will be settled. The envisaged solution, which involves a combination of cash injections and debt issuance, will doubtless influence the fiscal framework. These arrears will not only absorb public resources in the short-term, they will also increase the debt servicing costs of the Government into the future. There is a significant degree of uncertainty regarding the value of liabilities and contingent liabilities accumulated by the Government. At this stage, it remains unclear how arrears have accumulated between the Government and contractors since June The Government will have to control its expenditure during the election campaign and allocate an increasing share of its spending to cover its debt service. Given the history of increased expenditure in pre-election periods, this may be very difficult to achieve. 8 World Integrated Trade Solution (WITS) database. 16
33 The World Bank Group Macroeconomics and Fiscal Management Global Practice Africa Region The recent slippage of Tanzania in several international governance indicators suggests that it is by no means unlikely that other corruption scandals will occur in the future, which may accelerate the decline in external aid. The total value of arrears with pension funds and the cost of future payments to pre-1999 pensioners still need to be finalized. There are also a number of contingent liabilities, such as the arrears accumulated by public enterprises. The value of the arrears accumulated by the publicly-owned energy company (TANESCO) increased to USD 260 million in March 2015, after declining to approximately USD 175 million in September The financial situation of the water utility (DAWASCO) and of the Rural Electrification Agency also remain unclear. In addition, there is uncertainty regarding the level of budget support that the Government will receive in the future. For example, the recent IPTL corruption scandal resulted in a decline in this support. While donors have begun to resume support, this episode illustrates that the magnitude of external aid is influenced by the quality of governance in Tanzania. The recent slippage of Tanzania in several international governance indicators 9 suggests that it is by no means unlikely that other corruption scandals will occur in the future, which may accelerate the decline in external aid. So far, the Government has not borrowed excessively on the domestic and international markets. It must continue to resist the temptation to do so. While the stock of public debt is projected to increase from 32 percent of GDP in 2013/14 to 33 percent of GDP in 2014/15, the conversion of existing arrears into debt will add another 6 percent of GDP to this level. The level of debt-service will also jumped from about 14 percent to over 22 percent of Government s revenues. Such a ratio is high and will leave little flexibility in the allocation of public resources within the budget in the coming years. If Tanzania wants to continue to be classified as a low debt distress country by the IMF and the World Bank, fiscal prudence, as well as efficient debt management, will be necessary in the coming years. 1.3 Finding new ways to finance Tanzania s future development The Government has played a critical role in facilitating the growth performance of the economy over the past decade. Using simple growth accounting, the public sector contributed to approximately one third of economic growth during the 2000s. The most visible indicator of this contribution has been the steady increase in the value of government expenditures, which have grown by an average of 13 percent per year in the period from 2000/01 to 2009/10. This expansion has stimulated the economy which can be explained largely in terms of simple Keynesian economics: increased public spending creates additional demand and 9 For example, Tanzania deteriorated from 92th to 119th in the ranking of Transparency International between 2006 and
34 TANZANIA ECONOMIC UPDATE JULY 2015, 7 TH EDITION enhances economic activities through the multiplier effect. Furthermore, the increase in capital expenditure and in expenditure on the social sectors has helped to improve the country s stocks of infrastructure and human capital, creating positive supply-side effects on the local economy. However, in recent years, fiscal policy has been increasingly challenged. The average annual rate of expansion in public expenditure declined to a rate of three percent in the period from 2010/11 to 2013/ Clearly, the public sector has not been as strong an engine of growth as it was in the last decade. Not only has the expansion in real public expenditure declined, but the composition of the expenditure has Figure 13: Slowdown in the increase of public expenditures shifted away from infrastructure and social services. For example, at the end of June 2014, the development budget had an execution rate of 62 percent, with public expenditure on development amounting to the equivalent of only 4.8 percent of GDP, its lowest level in the last five years. This is in clear contradiction to the stated objectives of the Big Results Now initiative, which mandates increased expenditure on capital development. Expenditure cuts have also impacted the LGAs capacity to deliver social services, particularly in the health and education sectors. The decline in expenditure on these sectors reduces the country s capacity to grow in the longer term. 11 Figure 14: Caused by weaker revenue performance and lower aid inflows Clearly, the public sector has not been as strong an engine of growth as it was in the last decade. Not only has the expansion in real public expenditure declined, but the composition of the expenditure has shifted away from infrastructure and social services. Source: IMF and World Bank Calculations 10 While there had been a sharp increase in real expenditures in 2012/13, it was realized at the expense of a larger fiscal deficit (the Government missed its fiscal target by almost one percent of GDP). If targets were met in 2012/13, the real increase in expenditures would have been only 7 percent instead of the reported 17 percent. 11 The share of LGA budgets allocated to non-salary recurrent spending has continued to decline in the 2014/15 budget. Only around 10 percent of the LGAs budget is projected to be spent on non-salary recurrent spending, which is less than half of what was spent in 2009/10 and 2010/11. 18
35 The World Bank Group Macroeconomics and Fiscal Management Global Practice Africa Region Any nation that aims to climb the ladder of economic development must be able to finance a significant share of its public expenditure through the collection of domestic revenue. The decline in the real rate of growth of public expenditure has been caused by a combination of two factors. Firstly, as stated in previous sections, official aid inflows are declining, while the Government s performance in the collection of domestic revenue has weakened over time (See Figure 14). The value of external aid grew at an average annual rate of 20 percent in the period from 2001/02 to 2007/08, but decelerated by an annual rate of five percent from 2008/09 onwards. While the authorities were able to collect a higher level of domestic revenues, with the value of these revenues increasing by an average annual rate of 15 percent in real terms in the period from 2001/02 to 2007/08, this rate of growth has decreased to seven percent per year (to less than half), in the period from 2008/9 to 2012/13. The Government initially attempted to compensate for the decrease in external aid and the deceleration in the rate of increase of domestic revenues by borrowing more on both domestic and foreign markets. The Government actively pursued this approach in the period from 2009/10 to 2012/13, which led to a significant increase in the levels of public debt and debt service. Subsequently, the Government, realizing that it was not able to finance its fiscal gap, opted to reduce its expenditures. In 2013/14, the level of public expenditures was lower, by the equivalent of almost 2.5 percent of GDP, than initially projected in the approved budget. Similar cuts have taken place in the current budget, with the level of expenditure expected to again be significantly lower than initially anticipated. Such adjustments, while necessary to maintain fiscal sustainability over time, have not been cost free for the Tanzanian economy. These adjustments have been implemented in a non-transparent way, without parliamentary supervision, and have led to reduced spending on infrastructure and social services. It has also had a significant impact on planning, with the prioritization of expenditure being difficult when the budget envelope changes within the course of the fiscal year. In this context, the Government must improve both the collection of domestic revenues and the efficiency of public expenditures. Both these measures are vitally necessary in view of the country s existing and future needs. Any nation that aims to climb the ladder of economic development must be able to finance a significant share of its public expenditure through the collection of domestic revenue. The next section of this update will explore in detail why it is now vital for Tanzania to improve its tax collection performance and how this goal can be attained. In addition to the end goal of raising revenues, the process and impact are both key. This goes to the heart of the principles of a good tax system proposed by R. Musgrave 50 years ago. He argued that a good tax system should not only generate enough public revenues but also help to promote private sector development, to ensure the efficient allocation of resources and contribute to reduced inequalities Musgrave, Richard A, The Theory of Public Finance: A Study in Public Economy, Publisher: McGraw-Hill,
36 TANZANIA ECONOMIC UPDATE JULY 2015, 7 TH EDITION 20

37 The World Bank Group Macroeconomics and Fiscal Management Global Practice Africa Region 2 Why Tanzanians should be paying taxes 21
38 TANZANIA ECONOMIC UPDATE JULY 2015, 7 TH EDITION Part II: Why Tanzanians should be paying taxes Tanzania collected approximately USD 6 billion worth of revenues in 2013/14. This covers almost three-quarters of government expenditures. However, this is not enough, particularly when other sources of funding, such as aid, are declining and when the Government has limited access to loans and private sector finance. As the population grows, the demand for public services will only increase. Put simply, Tanzania must collect more taxes. Tanzania s tax system relies on a combination of VAT, income tax, import duties and excise tax. Reliance on these four main taxes is not unusual in low income countries. However, Tanzania s performance in the area of the collection of VAT is one of the worst in the world. Tax collection is very concentrated, with revenues derived primarily from only a few sectors and from the Dar-es-Salaam region. In addition, compliance costs are high. The Government must implement a series of bold and innovative actions, in addition to the traditional administrative measures, to make the current tax system affordable, fair and transparent. Robert does not pay taxes. Why should I give money to the Government? It will only benefit corrupt politicians! Besides, nobody in my village is paying taxes. Why should I? Taxation is an issue that lies at the heart of the fiscal contract between the State and its citizens. As in most countries around the world, many Tanzanians would be prepared to pay taxes if they perceived that their contribution was reasonable, fair and equitable and if they felt that the money would be used efficiently by the Government to provide necessary public services or to redistribute wealth to the poorest. Unfortunately, the Tanzanian state and its citizens have yet to establish a working fiscal contract. The overall value of collected taxes, which reached the equivalent of only 12 percent of GDP in 2013/14, is one of the lowest in the world (see Figure 15). Furthermore, the real tax yield might be closer to six percent of the national income when the informal economy is factored into the equation This figure is illustrative since, by definition, it is hard to estimate the size of the non-official economy. For an estimate of the non-official economy in Tanzania and other developing countries, see, H. Ahumada and F. Alvaredo, The Monetary Method and the Size of the Shadow Economy,: A critical Assessment, Review of Economy and Wealth, Series 53, N. 2, 2007 or F. Schneider and D. Enste, Shadow Economies around the World: Size, Causes, and Consequences, IMF working paper, 00/26. 22
39 The World Bank Group Macroeconomics and Fiscal Management Global Practice Africa Region To the extent that external and private financing remain limited, the Government will have no other option than to rely on its own revenues. To put it simply, the average Tanzanian only pays USD 120 in taxes per year, while the average Senegalese or Kenyan pays more than USD 300. There is no blue-print for the ideal level of taxation. However, it is well accepted that taxes should be sufficient to finance a large proportion of the Government s expenditure on public goods. In Tanzania, the low level of tax collection is problematic because the needs of the country are significant and expanding. The rapid population increase and the increase in living standards have put pressure on the delivery of infrastructure and social services. Several billion US dollars will have to be found to finance expenditures in these areas over the next decade. To the extent that external and private financing remain limited, the Government will have no other option than to rely on its own revenues. This second part of the update explains why Tanzania will need to increase its tax revenues if it is to finance the country s growing needs adequately. It then follows with a diagnostic of the recent performance of the Government in taxes and points to a number of weaknesses in this effort. Lastly, it concludes with an agenda for actions. This agenda is built on the principle that a good tax policy is more the art of the possible rather than the pursuit of the optimal. Nonetheless, bold and innovative actions are essential. 2.1: Tanzania needs to collect more tax What level of public expenditure is desirable for a developing country at any given level of national income? Only when this question has been answered can the next question, which relates to setting the ideal level of tax revenue, be addressed. Unfortunately, the vast literature on optimal tax theory provides little practical guidance on how to integrate the optimal level of tax revenue with the optimal level of government expenditure. 14 Currently, the Tanzanian Government collects approximately USD 6 billion each year in domestic public revenue, of which taxes account for about 90 percent. 15 In 2013/14, collected taxes financed 73 percent of total public expenditure, with the remainder being met by both concessionary and non-concessionary loans, grants and the accumulation of arrears. Tanzania s dependence on domestic revenues for the financing of its public expenditures is about average compared to other African or low income countries, but relatively low in comparison to more developed economies (see Figure 16) Tanzi, V. & Zee, H. Tax policy for developing countries, IMF Economic Issues Paper 27, Non-tax revenues include royalties on mining, a large variety of levies and other licenses. 16 There are a number of empirical studies comparing tax efforts around the world by comparing countries based on their characteristics (GDP level, GDP composition, poverty, monetization, etc.). However, these studies used for Tanzania the old GDP figures and, therefore, cannot be used anymore. See, for example Fenochietto and C. Pessino Understanding Countries Tax Effort, IMF Working paper,
40 TANZANIA ECONOMIC UPDATE JULY 2015, 7 TH EDITION Figure 15: Tanzania s revenue collection effort is low even adjusted for its per capita income, 2011 Figure 16: Average dependence on domestic revenue to finance public spending, 2013/14 Tax / GDP Source: IMF Looking forward, Tanzania s relatively low dependence on its own revenues will be increasingly challenged by the growing demand for infrastructure and social services. Assuming that the ratio of expenses per secondary student remains constant at USD123 per year, the level of spending on secondary education will have to double by 2020 for the country to reach a registration rate of 60 percent. If in addition to measures to increase the enrolment rate, measures to improve the quality of education are enacted, the costs will increase even further. In addition, at the same time, Tanzania will have to spend an estimated USD 2.9 billion annually on roads, electricity and water systems to catch up with the rest of the developing world. 17 To finance the provision of basic services of an adequate quality and of infrastructure, the Government has traditionally relied heavily on donors. However, the contribution of external aid to the total budget has declined from 40 percent to less than 30 percent in the period from 2008/9 to 2013/14. This declining trend is anticipated to continue into the next decade. At the same time, the Government is likely to be constrained in its ability to borrow on domestic and international markets to preserve debt sustainability. One option is for the Government to transfer some of its spending responsibilities to the private sector. This can be done in multiple ways for different sectors as illustrated in Box 2. However, time will be required to promote public private partnerships and to address the remaining weaknesses in local capacity and in the legal and institutional frameworks for the implementation of such partnerships. However, the contribution of external aid to the total budget has declined from 40 percent to less than 30 percent in the period from 2008/9 to 2013/ Shkaratan.M, Tanzania s Infrastructure: A Continental Perspective World Bank Policy Research Working Paper No. 5962, Available at SSRN: 24
41 The World Bank Group Macroeconomics and Fiscal Management Global Practice Africa Region Box 2: How can the private sector help deliver public goods Rished Bade, the TRA Commissioner General, has openly stated that his vision is for the Tanzanian taxpayers to fully fund the national budget within the next five years. There are multiple examples of partnerships between the private and public sectors in the delivery of public goods across the world, including in Tanzania. The balance is not always easy to find as policymakers have to account for both market and government failures as well as a number of factors that are not always easy to identity and quantify, including cultural, political and social ones. Below are three examples where Tanzania could rely more on the private sector to deliver public services to its population: 1) Skills: Tanzania s current system relies almost exclusively on the public sector. Businesses are required to pay an extremely high levy of five percent on the wage of their formal employees that will finance a public system of vocational and technical training, as well as scholarships. This system discourages formal employment as the burden is very high for private enterprises and the Government has not been able to deliver quality services. The alternative would be to provide incentives to businesses to deliver their own training. 2) Secondary Education: The rate of registration in secondary schools has and will continue to increase by approximately 10 percent per year, putting increasing pressure on the public system which does not have the financial and human resources required to respond. The development of private schools has been the answer in many countries and this has started to happen in Tanzania. Of course, the Government and the public have to play a role of regulation and quality control. 3) Transport/energy infrastructure: While not all infrastructure projects can attract private investors, there is sufficient experience in the transport and energy sectors that prove that PPPs can be efficient. The main candidates are ports, airports, and energy generation plants. The key is for Tanzania to get value for money in the delivery of public services both through the Government budget and through private sector provision. Tanzania, in its quest to achieve a higher level of economic development, has no other option than to boost domestic revenues. Rished Bade, the TRA Commissioner General, has openly stated that his vision is for the Tanzanian taxpayers to fully fund the national budget within the next five years. 18 As a matter of basic principle, he is right: there is ample scope for improving Tanzania s current tax collection efforts. Tax revenues from natural gas may also generate additional revenues amounting to a value equivalent to approximately three percent of nongas GDP. However, these revenues will not materialize for 7-10 years, with the actual value of the revenues highly uncertain and with investors yet to make final decisions. The Government has already recognized the need to increase its own revenues during the country s transition towards a gas economy. Boosting revenue generation is one of the priorities of the 18 See: Rished Bade s interview in Citizen, March
42 TANZANIA ECONOMIC UPDATE JULY 2015, 7 TH EDITION President s Big Results Now initiative. However, the Government has missed the ambitious revenue targets incorporated in the approved 2013/14 and 2014/15 budgets by a wide margin. If greater realism regarding revenue collections is required for effective budgetary planning, these recent results also indicate that more needs to be done for Tanzania to really improve its tax performance and to meet its policy makers targets A brief assessment of Tanzania s tax performance Compared to other developing countries, Tanzania performs poorly in domestic revenue collection. While such comparisons depend on the legal framework in place in each country and the structure of each economy, Tanzania is close to the lowest rank among nonoil producers in Sub-Saharan Africa. This places it in the vicinity of countries with fragile economies, such as Burundi, where capacities have been eroded by years of war and political instability. Tanzania was ranked 148th in PWC s paying taxes rankings 19, far below her East African neighbors. The Tanzanian tax system might be the worst of two worlds: on the one hand, taxes are theoretically quite high, which discourages taxpayers from paying. On the other hand, weak collection efforts result in a failure of the State to collect the taxes it needs. However, this general assessment must be qualified. Revenue collection levels increased significantly in the 2000s as a result of the rapid economic growth of a number of formal sectors, including transportation and communication, and of the rapid expansion in imports and local consumption. It is worth emphasizing that the taxation of large mining companies has been a contributing factor since their contribution rose to almost 8 percent of total tax revenues in 2011/12 from zero in the early 2000s. With the expected further development of the extractives sector, its contribution is projected to increase significantly. Overall sectoral growth was accompanied by a number of promising administrative reforms, including the establishment of a large taxpayers department in 2001; the merger of the VAT and income tax departments into one domestic revenue department in 2005; and the introduction of a new tax operations computer system. However, this effort has lost momentum in recent years. The growth of the tax to GDP ratio has slowed down since 2007/8, stabilizing at the equivalent of around percent of GDP (see Figure 17). The recent increase recorded in 2013/14, of the equivalent of 0.6 percent of GDP, is largely derived from the taxation of a onetime capital gains in the oil exploration sector. The most visible deterioration has been in the steady decline in VAT revenues The Tanzanian tax system might be the worst of two worlds: on the one hand, taxes are theoretically quite high, which discourages taxpayers from paying. On the other hand, weak collection efforts result in a failure of the State to collect the taxes it needs This index looks at total cost of taxes borne by the business, the time it takes to comply and the number of tax payments made. 26
43 The World Bank Group Macroeconomics and Fiscal Management Global Practice Africa Region The low VAT contribution in Tanzania is also unusual compare to other low income countries. observed over the past two years, which have declined by the equivalent of almost Figure 17: Slow improvement in tax collection one percent of GDP, partly due to the clearance of old VAT refunds. Figure 18: The structure of the Tanzanian tax system differs from other low income countries, 2013/14 Source: TRA and IMF There is no single, optimal tax structure that applies to all countries around the world. However, it is accepted in the economic literature that a balance has to be found between income and consumption taxes, and between domestic and international transactions. This balance is required for efficiency, equity and competition. The Tanzanian tax system is built around four main categories of taxes. These account for approximately 98 percent of total gross tax revenues collected by the central Government (see Figure 18): Value Added Tax (VAT) contributes to almost 27 percent of total gross tax revenues or 24 percent when adjusted for VAT refunds; Income taxes contributes to more than 40 percent of total gross tax revenues, divided between corporate and individual taxation; Import duties and charges contribute to approximately 16 percent of total gross tax revenues; and Excise taxes contribute to 15 percent of gross tax revenues in Tanzania and are paid when purchases are made on specific domestic and imported goods. Tanzania s dependence on these four main forms of tax is not unusual among low income countries. What is less usual is Tanzania s high reliance on income taxes rather than on consumption taxes. The low VAT contribution in Tanzania is also unusual compare to other low income countries. The high degree of dependence on income tax and the low level of revenue generated from VAT can be explained by the difference in the current performance of the Government to collect each individual tax. Beyond these four main taxes, there are a myriad of small taxes and non-taxes in Tanzania. These range from the levy on labor income to royalties on mining to licenses and permits to operate a business. While their contribution to the central Government s budget remains limited (at 27
44 TANZANIA ECONOMIC UPDATE JULY 2015, 7 TH EDITION approximately 10 percent of total domestic revenues), they finance several public agencies and enterprises. The amount of revenues generated by these other taxes and non-taxes remain hard to estimate because they are not always reported effectively and individual data from each agency is not easy to get. at the border, particularly at the port of Dar es Salaam. The other half comes from domestic transactions, with these transactions being highly concentrated in three sectors - approximately 40 percent of VAT of domestic transactions is collected from telecommunications, beverages and cigarettes. National accounts data shows that economic activity in Tanzania involves A rapid assessment of the four main taxes is proposed below based on a number of detailed analytical studies. 20 transactions in many other sectors beyond these three, suggesting that some sectors are under taxed and many important The Tanzanian government s performance contributors to national GDP are almost in collecting VAT revenues is one of the worst in the world (see Figure 19). Despite the application of a relatively high VAT rate of 18 percent, revenues are equivalent to less than three percent of GDP. Almost half of this figure is collected on international transactions completely left out of the VAT base (see Figure 20). Therefore, a concerted effort must be made to reach sectors which are not pulling their weight in terms of contributing to the total value of collected VAT. Finally, the low VAT collection rate is also explained by the extensive application of exemptions. Figure 19: VAT yields are one of the worst in the world, 2012/13 Therefore, a concerted effort must be made to reach sectors which are not pulling their weight in terms of contributing to the total value of collected VAT. Source: The World Bank, Deloitte. 20 KPMG, 2013/14 Tanzania Fiscal Guide, 2014: Documents/2014%20Fiscal%20Guides/Fiscal%20Guide%20Tanzania.pdf. Deloitte Tanzania Highlights, 2014: pdf.tra,presentation on Tax Administration Reforms in Tanzania experience and challenges, 2011: Policy Forum The one billion dollar question: How can Tanzania stop losing so much tax revenue?, 2012: ONEBILLIONDOLLARQUESTION.pdf;FIAS Sector study of the effective tax burden in Tanzania, 2006: documents.worldbank.org/curated/en/2006/05/ /sector-study-effective-tax-burden-tanzania 28
45 The World Bank Group Macroeconomics and Fiscal Management Global Practice Africa Region Figure 20: Sector concentration of VAT collection on domestic transactions, 2012/13 The average import tariff has declined from 18.3 percent in 1997 to 8.4 percent in However, the yield remains low, at just over half of the theoretical import base in Source: TRA, NBS, World Bank At 15 percent, the contribution of excise taxes to the total value of collected taxes in Tanzania is above average compared to other low income countries. The main excise taxes are collected on imports and domestic sales of cigarettes, fuel and alcoholic drinks. As a result of increased rates, excise revenues have grown by 20 percent per annum in the last couple of years, doubling the rate of growth recorded in the previous three years. Not only does Tanzania apply an unusually high number of excise taxes with relatively high rates, there are multiple rates on sub-categories of products, which make the system very complex. For example, five different rates are applied on cigarettes. Excise taxes can also be specific or ad valorem, which adds to complexity. The contribution of import taxes and charges as a share of total revenue is declining, down to 15.5 percent of total tax revenues. In part, this is a result of the trade liberalization policies implemented by Tanzania over the past decade. This included the adoption of the EAC common external tariff and the option for member states to introduce duty free imports during times of emergency. The average import tariff has declined from 18.3 percent in 1997 to 8.4 percent in However, the yield remains low, at just over half of the theoretical import base in 2012 (see Figure 21). This poor performance is explained by the low share of consumption goods in proportion to total imports and by the extensive application of exemptions and rebates. This ratio does not account for under-reporting and evasion of import duties. Losses due to these causes are simply not included in official statistics, which makes determining the exact value difficult. Revenue from income taxes accounts for 40 percent of total collected tax revenues in Tanzania, which is above the average 29
46 TANZANIA ECONOMIC UPDATE JULY 2015, 7 TH EDITION for low income countries. 21 This relatively high share is largely due to the collection of corporate income tax, which accounts for 37 percent of income tax revenues, and of pay-as-you-earn taxes (PAYE), which is collected from the salary of employees in the formal sector and which accounts for 41 percent of income tax revenues. Figure 21: Yield of import duties is at the bottom of the continent, 2012 In geographical terms, the region of Dar es Salaam accounts for approximately 90 percent of the country s tax revenues, despite the fact that it accounts for only 17 percent of the total value of GDP. Source: World Bank 2012 This rapid description of the Tanzanian tax system reveals the major weakness of the system, which is that the level of compliance is very weak, with low yields in the collection of VAT and import duties. If overall revenue collection is analyzed in terms of region and sector, a second weakness becomes apparent. Tax collection is concentrated in only a few sectors and in one location, Dar es Salaam. Large enterprises (400 companies), primarily based in Dar es Salaam, contribute to almost half of the total value of tax revenues. While this degree of concentration is not unusual for developing countries, efforts need to be made to diversify the tax base. In geographical terms, the region of Dar es Salaam accounts for approximately 90 percent of the country s tax revenues, despite the fact that it accounts for only 17 percent of the total value of GDP (see Figure 22). This means that both important sectors of the economy and regions that contribute significantly to GDP, including secondary cities, have been left out of the tax collection effort. Weak capacity to collect taxes in LGAs may offer a partial explanation for this phenomenon. 21 Income tax ranges from 0-30 percent depending on 5 income level brackets. It is progressive. 30
47 The World Bank Group Macroeconomics and Fiscal Management Global Practice Africa Region Figure 22: Regional concentration on Dar es Salaam, 2013/14 Tax Source: NBS, TRA, World Bank The same complexity also exists in the application of import duties, as valuation methods leave room for interpretation and bargaining. The second weakness is that the Tanzanian tax system is excessively complicated and not adapted to the reality of a low income economy. The 2013 Afrobarometer found that 72 percent of respondents in Tanzania find it difficult to know which taxes and fees they are supposed to pay. 22 Such complexity is found in the rules governing all of the four main categories of taxes described above. The income tax includes several rates, multiple deductions, and complicated rules that are not easy to understand for the standard Tanzanian taxpayer, particularly those not operating under the PAYE system and who therefore need to make their own assessments. The same complexity also exists in the application of import duties, as valuation methods leave room for interpretation and bargaining. For example, there are huge variations in the valuation by customs of basic and homogenous goods such as rice, maize, fertilizer or cement. 23 The VAT is very difficult to apply fairly when almost 90 percent of businesses operate in the informal sector even though many of them remain below the VAT threshold, and so are subject to a presumptive tax on small businesses (see Box 3) Afrobarometer 2013: 23 By using custom data at the HS-8 classification level, the value of imported fertilizers varied between USD 0.4 and USD 5 per kilogram in The value of imported butter ranged from USD 2.5 to 166 per kilogram, while the price of imported cement clinkers fluctuated between USD0.1 and 1180 per kilogram. Several recent studies have demonstrated the under and over-invoicing of import values is the main channel for rent seeking behavior by customs (see Anson, Cadot, and Olarreaga, Tariff Evasion and Customs Corruption: Does Pre-Shipment Inspection Help?, World Bank, 2007). 24 The VAT threshold is TZS 40 million. 31
48 TANZANIA ECONOMIC UPDATE JULY 2015, 7 TH EDITION Box 3: The cost of a misunderstood VAT Let s assume that a medium sized trader sells USD 100 worth of fabric to a successful merchant in Upanga. 25 The payment value would be USD 118 to account for the VAT of 18 percent that will be paid to TRA. Subsequently, the merchant uses the fabric for t-shirts that will be sold at the market for a total value of USD 150 (excluding VAT). Eighteen percent of USD 150 is USD 27, so the final price of these T-shirts will be USD 177. The question is: How much VAT should the merchant pay to TRA? If you respond USD 27, it means that you will be too generous and offer a gift of USD18 to TRA. In fact, you should subtract the earlier payment of USD 18 and pay only the difference of USD 9. VAT is only paid on the value added. The merchant should pay USD 9 to TRA and the trader should pay USD 18 to TRA. In reality, many taxpayers are confused and will pay the total amount to TRA, without claiming the earlier credit. They may also not be able to claim their credit if they do not have a tax invoice for the first transaction. Because the burden becomes very high, many traders might therefore decide not to pay the tax at all, choosing to evade the payment of taxation entirely. Small businesses, with an annual turnover below TZS 40 million, can opt to pay the presumptive tax (a lump sum payment determined by the size of the business) but they will be unable to claim back the VAT on inputs. The complexity of the current tax system is partly embedded in the fragmentation of the policy decision process and management. The complexity of the tax system is further exacerbated by the excessive application of exemptions. In 2013/14, the total value of lost revenue resulting from tax exemptions amounted to TZS 1,834 billion or 2.5 percent of revised GDP. The recent PER study on tax exemptions has identified more than 160 exemptions to current tax laws. This study recommended that half of these should be removed or amended. This will be addressed to some degree by the new VAT Act. 26 However, many businesses continue to receive exemptions. The final layer of complexity lies in the presence of the many small taxes, levies and fees collected by public sector entities which are not clearly reported in the budget. While these charges might be invisible in the Government s accounts, they represent a significant administrative and financial burden for private businesses. For example, the recent lab organized by the Presidential Big Results Now initiative has shown that tour operators are subject to more than 25 charges and levies. The complexity of the current tax system is partly embedded in the fragmentation of the policy decision process and management. As mentioned earlier, many small taxes and non-taxes are created and managed at the sector level by public 25 Both with turnover above the VAT threshold. 26 CRC Sogema, Tanzania PER Tax Exemptions Study, 2014: content&view=article&id=892:per-tax-exemptions-study-final-report-and-briefing-note&catid=78:perreports&itemid=433 32
49 The World Bank Group Macroeconomics and Fiscal Management Global Practice Africa Region The 2015 Doing Business report ranks Tanzania 148th out of 189 countries in terms of the indicator measuring the ease of paying taxes. agencies and enterprises. Exemptions are granted by several agencies that may not always have aligned incentives. Such fragmentation contributes to the proliferation of perhaps well founded individual initiatives that can nonetheless become a heavy burden for the economy when taken altogether. They can sometimes be duplicative or even contradictory (for example the government is subsidizing the use of fertilizers whilst taxing them at the border). The transaction costs associated with the payment of taxes in Tanzania is very high. The 2015 Doing Business report ranks Tanzania 148th out of 189 countries in terms of the indicator measuring the ease of paying taxes.tanzanian businesses are faced with an average of 49 different tax payments a year, significantly higher than the Sub-Saharan African average of 38. On average, businesses spend 181 hours each year in the payment of their taxes. 27 In 2013, 41 percent of firms participating in the World Bank Enterprise Survey stated that the cost of tax administration was a major constraint to doing business. 2.3: A comprehensive approach The collection of taxes is critically important for all countries, and particularly for developing countries. This is true for two main reasons: the collection of taxes enables governments to raise money to deliver public services; and to redistribute resources more fairly. Tax does not create new money. Rather, it transfers money from private to public hands. The goal is to find a level of taxation which facilitates the achievement of the two goals stated above while at the same time being affordable, fair and efficient. Tanzania has received significant external inputs on how to improve its revenue performance. TRA has accepted many of the recommendations and improvements have been made. Over the last couple of years, a particular push has been made through the Big Results Now initiative and the introduction of a modernized and more broad-based VAT Act. However, the Government still needs to exert further efforts. To ensure the implementation of an effective tax system, Tanzania needs to develop a strong fiscal contract between the state and the citizens. The Government should provide basic services to the country s citizens, while citizens should be able to demand accountability from the Government regarding its expenditures. If this contract does not exist, citizens do not feel a moral obligation to pay tax. Instead they will resent paying taxes, feeling that they are not getting anything in return and that the revenues generated from taxation risk being mis-allocated 27 World Bank, Doing Business Survey, 2015: 28 African Development Bank, Domestic Resource Mobilization for Poverty Reduction in East Africa: Tanzania Case Study,
50 TANZANIA ECONOMIC UPDATE JULY 2015, 7 TH EDITION through corruption. 28 This leads to the emergence of a vicious circle, in which the Government doesn t have enough funds to provide public goods, which makes citizens unwilling to pay taxes because they do not benefit from the existence of public goods. In this context, the evidence suggests that there is a link between higher levels of taxation and greater demands for accountability. 29 The fiscal contract must find its foundation in three components: (i) an affordable tax burden and low transaction costs; (ii) equity and fairness; and (iii) transparency and good governance. These three pillars are corroborated by a recent survey conducted in Eastern and Southern Africa (see Figure 22). The main explanatory factors for the low level of tax compliance in Tanzania are: (i) high and unaffordable rates; (ii) unfairness; and (iii) the sub-optimal use of taxes, exemplified by poor public services and corruption. These factors appear more important in terms of increasing levels of revenue collection than the use of sanctions and strict controls. Figure 23: Why Tanzanians do not pay taxes Source: Ali.M, Fjeldstad.O & Sjursen.I, To pay or not to pay? Attitudes towards taxation in Kenya, Tanzania, Uganda and South Africa, World Development, Volume 64. pp , a) Affordable tax burden and lower transaction costs Most taxpayers will fulfill their tax obligations if they consider the tax burden to be reasonable and if the Government makes it easy for them to meet these obligations. Unfortunately, these two basic conditions are not currently met in Tanzania. The tax burden is high for a business or an individual that wants to pay their taxes, both in terms of rates and transaction costs. This diagnosis reveals The tax burden is high for a business or an individual that wants to pay their taxes, both in terms of rates and transaction costs. 29 Baskaran.T & Bigsten.A, Fiscal Capacity and the Quality of Government in Sub-Saharan Africa, World Development 45, ,
51 The World Bank Group Macroeconomics and Fiscal Management Global Practice Africa Region To reduce transaction costs the most obvious action to achieve this would be to streamline the number of small taxes that do not generate much revenue for the State but which are a major nuisance for businesses. nothing new. So far, the Government s response has been principally to streamline administrative procedures, notably through the gradual introduction of a new IT system. However, these efforts have been slow to achieve material results. The exclusive focus on administrative reforms might also be an ineffective means of increasing the collection of taxes. As explained earlier, transaction costs are the result of the complexity of the current system. Therefore, the current framework needs to be simplified and adjusted to the realities of a low income economy. Such adjustments should start with the implementation of changes in tax policy and with administrative reforms. The following actions could be considered by the Tanzanian authorities: The elimination or reduction in the number of small taxes and a simplification of the system for other taxes; A simplification of the system of presumptive taxes for small businesses; A streamlining of tax payments through the use of electronic payment systems, including through the implementation of systems to facilitate all tax payments online, payment by mobile phones and through partnerships with the private sector; Educational and awareness raising activities to ensure people understand their tax obligations; and Analysis of whether a combination of lower statutory rates and a reduction in exemptions could broaden the tax base. Transaction costs must be reduced. To reduce transaction costs the most obvious action to achieve this would be to streamline the number of small taxes that do not generate much revenue for the State but which are a major nuisance for businesses. Experience from other countries suggests that the first principle is to eliminate all redundant charges. For example, tourism operators are subject to more than 20 taxes and fees, many of which overlap. 30 The second principle is to centralize the collection of other taxes. If the majority of taxes are collected by TRA, the transaction costs for taxpayers would be significantly reduced, as they would not receive multiple visits from inspectors from several agencies. Of course, the revenues collected by TRA would have to be allocated to other agencies. However, this would place the burden on the public system, rather than on the private sector. High transaction costs are also embedded in the complexity of the tax system. A simplification of the system would reduce these costs and hence encourage compliance. Tanzania s income tax is characterized by many different rates, deductions and definitions, resulting in a degree of complexity which means that the system can only be understood by experts. Similarly, the application of 30 Big Results Now, Lab Report on Taxation, Multiplicity of Taxes, Levies and Fees,
52 TANZANIA ECONOMIC UPDATE JULY 2015, 7 TH EDITION import duties is based on complicated definitions and values that leave room for interpretation, which opens the door to corruption and bargaining. In general, complexity discourages compliance. While this is true in many countries, including advanced economies such as the UK and the USA, in Tanzania, small businesses and individuals are unlikely to have the financial resources to pay for professional help. Perhaps the most controversial question is how to tax small businesses. The Government is aware of this and has been applying the presumptive income tax system for small businesses (with a threshold turnover of TZS 20 million or USD 12,000 in annual sales). In July 2012, the presumptive income tax system was reformed and a nil band for enterprises with an annual turnover of less than TZS 4 million was introduced. It is estimated that 84 percent of all household enterprises qualifying for the presumptive income tax would be exempted from paying presumptive income tax as a result of the reform. The reform amounted to a significant tax reduction for the average household enterprise, with poorer households benefiting disproportionately. However, although more progressive, the new system is still excessively complicated, with 10 different tax brackets based on annual turnover including five brackets for entrepreneurs keeping records and five for those not keeping records. The difference in the effective tax rates between those who keep records and those who do not, with a higher rate for the latter, is intended to provide incentives to micro-entrepreneurs to start keeping records and to become more formalized. The reality is that the existence of an opportunity to reduce taxes by keeping records is not well understood by micro-entrepreneurs. In fact, even after the introduction of the nil band, a large number of those who are now supposed to be exempted from the presumptive income tax appear to be continuing to pay the tax, either as a result of lack of knowledge of the reform on the side of entrepreneurs; lack of proper implementation of the reform on the side of tax collectors; or both. The Government could choose to simplify the regime by implementing measures adopted by other countries with presumptive tax regimes that have a flat rate for small businesses, such as Belgium, Greece, Bolivia and Angola. 31 The Government needs to actively promote the intensive use of presumptive tax for small businesses. 32 The Government needs to actively promote the intensive use of presumptive tax for small businesses. 31 Bird.R.M and Wallace.S, Is it really so hard to tax the hard to tax?, International Studies Program of the Andrew Young School of Policy Studies Working Paper No 03-16, 2003; UDSM Poverty and Social Impact Analysis of Proposed Presumptive Tax reform in Tanzania, Reducing the costs of transaction for paying taxes as with the use of a simple presumptive tax- will help incentivize small informal business become formal but it might not be enough. The decision by an entrepreneur to become formal is partly linked to the cost of paying taxes but also to the benefits that formalization will bring to him. Today, those benefits are arguably limited in Tanzania as most small businesses, even formal, have difficulties to access banking credit or secure their property rights two of the benefits generally associated with formalization. For a more detailed discussion, see World Bank Country Economic Memorandum, Tanzania: Productive Jobs Wanted,
53 The World Bank Group Macroeconomics and Fiscal Management Global Practice Africa Region A system to facilitate the payment of all taxes using mobile money should be developed and its use encouraged. Actions should also focus on administrative reforms. Again, to be effective, these should be implemented at the same time or immediately following the simplification of the policy framework. Emphasis should be placed on the following measures: Electronic payment of taxes: There have been significant efforts in recent years to develop systems to register and pay VAT online. This should be expanded to other taxes. While Electronic Fiscal Devices (EFDs) have been introduced in Tanzania, the majority of people are not using them. However, of those who do, 61 percent believe they simplify tax compliance. 33 The use of mobile money has been a step forward, with almost 50 percent of the adult population using mobile devices to transfer money. 34 A system to facilitate the payment of all taxes using mobile money should be developed and its use encouraged. The Government is also in the process of implementing a one stop shop program, with the initial step in this process involving the integration of tax and business registration within the BRELA office. Development partners support for the introduction of a new customs system is welcome. Partnerships with the private sector, banks and large taxpayers: To tackle informality, large firms could be made responsible for collecting VAT from all their suppliers. This would improve the collection of VAT from firms at the frontier of informality. Such a mechanism is at the heart of the VAT system but not always applied in reality. Companies have a role to play in supporting the provision of public services by paying tax themselves and encouraging their suppliers, who may fall under the radar, to do so. Ensuring that citizens understand their tax obligations: Knowledge and awareness of tax obligations have been found to be positively correlated with the degree of tax compliance. 35 Surveys show that 55 percent of Tanzanians are unaware of their obligation to pay VAT, although many unknowingly pay. Similarly, 37 percent of those in paid employment are not aware of their obligation to pay income tax. Given the correlation between awareness and compliance, the Government needs to exert greater efforts to raise public awareness of tax obligations. This in turn will strengthen the fiscal contract. The reduction in the transaction costs of paying taxes through the simplification of the system and administrative reforms should encourage tax compliance, and lead to higher revenues for the 33 University of Dar es Salaam, Poverty and Social Impact Analysis of Proposed Presumptive Tax Reform in Tanzania, Finscope Tanzania Ali.M, Fjeldstad.O & Sjursen.I, To pay or not to pay? Attitudes towards taxation in Kenya, Tanzania, Uganda and South Africa, World Development Volume 64 P ,
54 TANZANIA ECONOMIC UPDATE JULY 2015, 7 TH EDITION Government. In this context, and to encourage further private sector activities (see Figure 24), the authorities may want to explore whether it is possible to broaden the tax base by reducing the statutory rates, considering that Tanzania is at the higher end of existing rates in developing countries. For example, the VAT rate of 18 percent means that only 52 countries (out of 169) worldwide and seven countries (out of 47) in Africa have higher VAT rates than Tanzania. 36 The proposed reduction of exemptions will also contribute to increase the effective rates, and possibly provide room for a reduction in statutory rates. The strategy of reducing the statutory rate could become effective if it were combined with stricter sanctions and reduced exemptions. 37 In 2006, Mauritius successfully implemented measures of this sort, simplifying the tax system and applying lower statutory rates, with corporate tax rates being reduced from 25 percent to 15 percent and with income tax rates being reduced from 30 percent to 15 percent. In turn, this resulted in approximately a two percent increase in the tax to GDP ratio. 38 The strategy led to an overall increase in tax revenues and to a boom in private sector activities. 39 This successful initiative proves, if proof is needed, that most citizens and businesses are prepared to pay taxes as long as they see them as reasonable, fair, easy to pay and useful for their country. That said, given the downside short-term risk of this action on revenues, additional analysis needs to be conducted to determine whether this action would set the right set of incentives in Tanzania. The strategy of reducing the statutory rate could become effective if it were combined with stricter sanctions and reduced exemptions. 36 Deloitte Tanzania Highlights, 2014: dttl-tax-tanzaniahighlights-2014.pdf 37 As an indication, WAMU countries in West African cut their average income taxes rates from 35 to 28 percent during the second half of 2000 and still registered an increase of 20 percent in these revenues. Mansour.M & Rota-Graziosi.G, Tax Coordination, Tax Competition, and Revenue Mobilization in the West African Economic and Monetary Union, IMF Working paper, N. 13/163, The current statutory rate of the corporate income tax and the VAT are 15 percent in Mauritius, with limited exemptions. 38

55 The World Bank Group Macroeconomics and Fiscal Management Global Practice Africa Region Figure 24: Lower corporate income tax can boost growth Source: HMRC, HMT Analysis of the dynamic effects of corporation tax reductions, To promote a higher degree of acceptance of the fiscal contract, Tanzanians need to feel that they are required to pay their fair share, but not more. b) Equity and fairness Equity and fairness are elusive concepts to agree on, including for assessing a tax system. For some, taxes should be neutral in the sense that they should minimize interferences on decisions and the allocation of resources and factors of production. 40 For others, the tax system should be used to influence this allocation, for example in favor of vulnerable groups or strategic activities that may contribute to poverty alleviation. Economists have been using different instruments to evaluate if a tax system is fair, but one of the most famous has been to measure its progressivity or if wealthier people are paying proportionally more taxes than poor people. On paper, Tanzania s tax system fairs relatively well: the income tax is progressive with the use of five different revenue brackets, and VAT exempts most agricultural activities where approximately 80 percent of poor households are concentrated. The perception that the current tax system is relatively unfair in Tanzania comes from the low level of compliance by the vast majority of taxpayers. To promote a higher degree of acceptance of the fiscal contract, Tanzanians need to feel that they are required to pay their fair share, but not more. They also want to see that others who should pay are paying. Understandably, nobody wants to feel that they are the only person paying tax. Crowd psychology and peer group pressure can play an important role in promoting compliance (see Box 4). 40 Other instruments, mostly on the expenditure side, should therefore be used to address inequality and poverty challenges. The Government can promote social protection of vulnerable households, including through targeted programs such as cash transfers, food to education programs and so on. 39
56 TANZANIA ECONOMIC UPDATE JULY 2015, 7 TH EDITION Box 4: Psychology is key in tax matters Social norms have a significant impact on behavior. This fact can be leveraged to make tax policy more effective, at little cost. Deciding whether or not to pay taxes is a social issue because individual and group interests are opposed: while each individual may strive to minimize their tax obligations, public goods can only be effectively provided if the majority pay. However, if a critical mass of Tanzanians start to pay taxes, evasion and non-compliance will no longer be socially acceptable. When this occurs, it is likely that peer group pressure will result in a higher level of compliance, with members of the public possibly reporting cases of non-compliance to the authorities and otherwise pressuring non-compliant peers to fulfill their tax obligations. A recent experiment has shown that changing the wording of letters sent to people asking them to pay outstanding taxes can have an impact. People receiving a letter telling them that 90 percent of taxpayers pay their taxes on time were much more likely to respond quickly than those sent a generic letter. If the letter also informed the taxpayer that they were in a minority by not paying on time, they were even more likely to pay. Although this example comes from the UK, it does illustrate that psychology plays a key role in compliance with taxation regimes. Source: HMRC & Behavioral Insights Team, UK Cabinet Office While the strategy to ensure that tax systems are fair is well known, it is often difficult to implement. In summary, this strategy involves broadening the tax base, while lowering the statutory rate. For Tanzania, this would mean going beyond picking on the usual suspects and diversifying tax collection by implementing a series of initiatives that could include the following: Increased tax and non-tax revenue collection efforts in under-fiscalized sectors (such as agriculture, trade, mining and construction) and locations (such as the secondary cities); A reduction in the application of tax exemptions; An increased emphasis on taxation of land through better enforcement of real estate taxes; A modification of taxpayers behavior through the introduction of smart and innovative incentives; The application of sanctions to tax evaders, starting at the top. The most direct way for the Government to broaden the tax base would be to address the excessive concentration on only a few sectors and locations. The current tax burden is highly inequitable, with a few sectors contributing disproportionally, while others appear to be ignored by the tax authorities. At present, the vast majority of VAT is collected from businesses involved in the trade of food, drinks, cigarettes and telephones. Sectors that make a disproportionately low contribution include agriculture, construction, mining, and trade sectors (see Figure 20 for fuller details). While many businesses in these sectors are informal, small enterprises The current tax burden is highly inequitable, with a few sectors contributing disproportionally, while others appear to be ignored by the tax authorities. 40
57 The World Bank Group Macroeconomics and Fiscal Management Global Practice Africa Region In Tanzania, a recent study has shown that the costs of tax incentives for Government do not usually justify the benefits. which are hard to tax, some are not. For example, there are over 7000 construction businesses that report five or more employees and that should therefore be quite visible to the tax authorities. 41 This diagnostic is shared by President Kikwete, who said that there are so many people who earn so much money in the informal sector who are not paying anything; there are big farmers, there are people who have hundreds of cows, and they are selling milk. Others grow a lot of rice! But this is the sector that is not paying any taxes. 42 There is room to improve tax compliance in these sectors. The Government should consider how to reduce VAT exemptions where the benefits do not outweigh the costs. For big farmers, the way forward could be to substitute the infamous cess tax by the VAT as it would be economically more efficient and more consistent with the country s goal to promote commercial agriculture. 43 It should also crack down on evasion. Going forward, the authorities should also consider how best to collect revenues from new, emerging industries, such as the digital economy. The share of Dar es Salaam in the total value of collected taxes is disproportionately high relative to its contribution to the national economy. In fact, the proportion of total tax revenues collected in Dar es Salaam is five times higher than the proportion of its contribution to GDP. By contrast, Mwanza contributes to more than 9 percent of the country s GDP, but to only 1.2 percent of its tax revenues (see Figure 22). The Government must therefore do more to promote compliance in all regions, with a specific focus on larger hubs. Amongst other means, this could be achieved through the establishment of stronger large and medium taxpayers offices in Kilimanjaro, Arusha and Mwanza. Decentralization can also encourage compliance with tax obligations if people believe that the additional services provided by LGAs are the result of improved tax and non-tax revenue collection. However, there is a trade-off with efficiency, as centralized systems tend to be more streamlined than decentralized systems, with little duplication. The capacity of LGAs to collect revenues is also weak and needs to be developed. While tax exemptions can be justified to promote strategically significant economic activities, their excessive use can also result in inequality and a loss of revenue for the Government. In Tanzania, a recent study has shown that the costs of tax incentives for Government do not usually justify the benefits (see Box 5). 44 Over the past few years, the Government has placed the reduction of tax exemptions 41 World Bank Country Economic Memorandum, Tanzania: Productive Jobs Wanted, Interview of President J.Kikwete, World Bank, May The cess tax is collected by local authorities on the value of traded agricultural products. Its rate ranges from 3 to 5 percent. 41
58 TANZANIA ECONOMIC UPDATE JULY 2015, 7 TH EDITION on its agenda, with a target of reducing the value of tax exemptions to the equivalent of one percent of GDP in However, it is unlikely that this will be achieved in the short term. With Tanzania s membership in the EAC, there is an opportunity to revise the system of incentives, such as the generous tax holidays used in the Export Processing Zones and Industrial Zones, to achieve better alignment with international and regional best practice. A number of exemptions should also be eliminated, as these are not in line with the country s priorities and appear to be implemented only to benefit vested interests. The implementation of the recently revised VAT Act should address some of these issues. Box 5: Do the benefits from tax incentives outweigh the costs in Tanzania? The World Bank recently looked at a subset of twenty firms in Tanzania to assess whether tax incentives were beneficial. Despite the small size of the sample, the evidence suggests that overall, tax exemptions are not a key determinant of business investment decisions in Tanzania. For the majority of businesses, tax exemptions also do not appear to influence growth strategies. Furthermore, although the data is limited, it seems many firms have fallen short of their expected targets which they have articulated to obtain tax exemptions. In terms of employment gains, the message is mixed, with some firms generating sufficient employment to justify the exemptions they receive. Unfortunately, the use of complex incentives is prone to abuse. Several studies have showed a positive correlation between complexity and corruption, notably in customs. 1/ In 2013, the Tanzanian Revenue Authority intercepted 200 containers loaded with products different from what was indicated on the pre-arrival declaration forms. The importers had declared that the containers had computer central processing units, mosquito nets, computers, solar panels, and aluminum products, which are tax-free. But on physical inspection, the containers were found to have taxable items like khanga and electronics. 2/ An opaque system offers opportunities for bargaining between importers and custom officials. A number of exemptions should also be eliminated, as these are not in line with the country s priorities and appear to be implemented only to benefit vested interests. 1/ Anson Jose & Cadot Olivier & Olarreaga Marcelo, Tariff Evasion and Customs Corruption: Does Pre- Shipment Inspection Help?, The B.E. Journal of Economic Analysis & Policy, De Gruyter, vol. 5(1), pages 1-26, December. 2/ This story is reported by the East African, July 13, Placing an increased emphasis on the taxation of capital and a decreased emphasis on the taxation of labor would create a greater sense of fairness. Currently, approximately one third of income tax revenue is collected from the salaries of less than two percent of Tanzania s total population. The levy of five percent collected on employees is high by international standards, and discourages formal employment. There is significant scope for local authorities 44 World Bank Tax Exemptions Case Studies,
59 The World Bank Group Macroeconomics and Fiscal Management Global Practice Africa Region A positive example that demonstrates the manner in which local revenues from real estate taxes can be increased involves the recent introduction of IT systems in a number of secondary cities. to improve their revenue collection through taxes on real estate. This could be achieved by better enforcement, improved reporting and higher levels of transparency (Box 6). A positive example that demonstrates the manner in which local revenues from real estate taxes Box 6: Potential to tax more real property can be increased involves the recent introduction of IT systems in a number of secondary cities. 45 Dar es Salaam has also doubled the value of its property tax revenues through the Big Results Now initiative, which adopted a mass valuation method for property tax and land rent. As in most countries, Tanzania taxes capital income from real property in several ways. It imposes 10 or 20 percent on the net gains realized from the disposal of land or buildings, depending on whether the seller is a resident or non-resident; percent on rental income; and 0.15 percent and 0.2 percent real property taxes collected by local governments on residential and commercial properties in Dar es Salaam. However, the level of compliance with these taxes has been very low. Although there are not consolidated figures on the amount of revenues collected from taxes on real property in Tanzania, a ballpark estimate ranges at 0.1 percent of GDP. As a comparison, the level of revenues from such taxes is 2.8 percent and 4.1 percent of GDP, respectively, in the United States and United Kingdom. While Tanzania cannot expect to collect such levels of revenue from real estate, there is ample scope for improvement. This can be illustrated by the following example of the real estate tax in Dar es Salaam, which brought around TZS 10 billion or USD 6 million in 2013/14. By assuming that half of the city s area is potentially taxable (1,590 km2) and an average tax rate of 0.18 percent, this means that the taxable value of properties is only USD 4.1 per square meter, far lower than the market valuation. Expanding the tax base can be achieved by changing the behavior of taxpayers. In turn, this can be implemented through the application of a combination of incentives and sanctions. In 2007, an independent external integrity and transparency review commissioned by TRA concluded that there seemed to be an endemic culture of tax avoidance in Tanzania. 47 Tanzanians are not alone in trying to avoid tax. The gap between what is owed and what is actually paid is nearly USD 400 billion a year in the USA and about GBP 40 billion (USD 70 billion) in the UK. 48 It has been estimated that developing countries collectively lose USD 285 billion per year due to tax evasion in the domestic shadow economy. 49 Tax authorities need to help 45 PMORALG A study on LGAs own source revenue collection, KPMG 2013/14 Tanzania Fiscal Guide, African Development Bank, Domestic Resource Mobilization for Poverty Reduction in East Africa: Tanzania Case Study, Economist Fiscal Blackmail, Cobham.A, Tax Evasion, Tax Avoidance and Development Finance, QEH Working Paper Series 129,
60 TANZANIA ECONOMIC UPDATE JULY 2015, 7 TH EDITION taxpayers understand their obligations and to encourage them to pay by realigning their incentives. Inspiration can be found in successful experiments elsewhere. One possibility is to use carrots to incentivize tax payment. For example, some authorities have introduced tax lotteries as a means of encouraging compliance (see Box 7). Box 7: Prizes for paying taxes, can a lottery incentivize tax payment? Due to asymmetry of information between the Government and the taxpayer, taxpayers may underreport the amount of taxes they owe. To balance this, the Government needs to devote significant resources to monitoring and reporting economic activity. This problem has been examined in detail in China, where it is estimated that the size of the underground economy from was equivalent to approximately 13.4 percent of GDP. As an innovative means to overcome the problem, the Chinese government introduced a system where an official receipt is printed with a public lottery number. The receipt is not only an official receipt, but also a lottery ticket. Evidence suggests that when this system was piloted in China, business tax revenues increased by more than 17 percent, with the real growth rates of business tax and total tax revenues also increasing by 21.5 percent and 10.4 percent respectively in the areas where the system was piloted relative to control areas. Mauritius has recently followed suit with the introduction of a VAT lucky draw scheme in February Under this system, individuals with a VAT invoice have a chance to win up to Rs 50,000. The South African Lottery firm, Murhandziwa, has just won a contract to operate a national lottery in Tanzania for five years. With the granting of this contract, there is a potential opportunity for the Government to collaborate with this new firm to increase compliance with tax requirements. The question is whether the negative social costs of gambling will outweigh the benefits of increased revenues. Source: Junmin.W, The incentive to declare taxes and tax revenues: The lottery receipts experience in China, Osaka University, Rather, they must be accompanied by the strict application of sanctions for evaders, starting from the top and including government officials. For big taxpayers, another incentive might be to grant a high level of recognition to those fulfilling their obligations. When rich people give to private causes, they are lionized for their generosity. The contribution of taxpayers, on the other hand, is often unrecognized, even when their payments go towards highly valued public expenditures. TRA does have a system of giving public recognition to good taxpayers through a public ceremony involving significant press coverage. This approach should be encouraged. One idea might be to celebrate large individual taxpayers by naming schools after them. 50 However, incentives such as these might not be enough in themselves to modify behavior. Rather, they must be accompanied by the strict application of sanctions for evaders, starting from the top and including government officials, to guarantee perceptions that the system 50 See, The Washington Post, O Neil.L, Let s celebrate the people who pay the highest taxes by naming post offices and schools after them, March 30,
61 The World Bank Group Macroeconomics and Fiscal Management Global Practice Africa Region In addition, measures should be taken to improve transparency at the local level in a decentralized context, with LGAs publishing accurate, accessible quarterly reports on revenue collection. is being implemented equitably. This is discussed in greater detail in the next section. c) Transparency and good governance Improving the level of compliance with the obligation to pay tax can be achieved through self-enforcement and voluntary compliance. Citizens comply to the extent that they believe adherence to the law represents the best alternative among different possible outcomes. Those possible outcomes will depend on the extent to which they believe that their tax payments are well utilized by the State and that tax evaders are punished by the law. Tanzanian policy makers must work with a sense of urgency to ensure positive perceptions in both these areas. To promote good governance and transparency, the Government should ensure that the following actions are taken: Quarterly publication of revenue collection data and tax exemptions data by region and source; Verification and full publication of company payments and government revenues from all sectors; and Stronger enforcement of sanctions for non-compliance. To promote transparency, access to accurate information is vitally important. As demonstrated by the TRA, quarterly reports on revenue collection, broken down in terms of the source of payments and geographical locations, should be published. In addition, all information on tax exemptions and the companies that receive them should be made publicly available. Both the Ministry of Finance and the Tanzania Investment Centre should be responsible for publishing this data. The Ministry of Finance has committed to producing reports on tax exemptions on a quarterly basis, which is a great step forward. In addition, measures should be taken to improve transparency at the local level in a decentralized context, with LGAs publishing accurate, accessible quarterly reports on revenue collection. In a highly positive development, efforts are also being made to improve the level of transparency in the extractive industries. Tanzania has signed up to the Extractives Industries Transparency Initiative (EITI), which sets standards for transparency and accountability in extractive industries. By joining this initiative, the country has committed to improving transparency in matters related to the collection of natural resource revenues. The aim is to enable public access to comprehensive, quality information on Government revenues in the natural resources sector, with this improved accessibility leading to greater accountability and to reduced corruption. If successfully implemented, not only will the initiative reduce actual corruption, it will provide a means of demonstrating that corruption is being addressed, which is vitally important for improving public perceptions. Ultimately, according to EITI guidelines, details of all revenues paid by companies in the oil, gas and mining industry to the Government should be published on a voluntary basis. 45
62 TANZANIA ECONOMIC UPDATE JULY 2015, 7 TH EDITION The approach espoused by EITI could be replicated in other sectors, particularly sectors that are dominated by a few large companies. In particular, this could include the tourism sector, but also the telecommunications, electricity, food and beverage sectors. Reconciling tax payments between tax contributors and tax administration through voluntary agreements would be a great step forwards in terms of achieving higher levels of transparency and accountability. Tanzania is gradually taking part in international initiatives that could help the country with transparency and capacity building, notably the exchange of information across countries. Tanzania is member of the Global Forum on Transparency and Exchange of Information for Tax Purposes, but has yet to undergo Box 8: Publish what you pay the peer review process of its current standards. Tanzania is also involved in the African Tax Administration Forum (ATAF). These efforts are not only useful for transparency and capacity building purposes but they will also contribute to address tax evasion challenges through better regional and international cooperation. The recent Mbeki report, albeit controversial, highlights the large amount of tax revenue lost by African countries from illicit capital flows and tax evasion by multinationals. 51 Another complementary approach would be for the Government to publish a list of both major taxpayers and sanctioned evaders. Encouraging private companies to voluntarily publish full details of their tax contributions would be a welcome initiative (see Box 8). Governments across the world are taking measures to improve transparency on tax issues. For example, tax transparency laws passed by the former Australian Labor Party Government required the national tax office to publish details of the taxes paid by approximately 1,600 public and private companies with an annual turnover of USD 100 million or more from July Under the new laws, all details related to total income, taxable income and income tax payable must be reported. In Tanzania, some companies are voluntarily publishing similar details. Vodacom Tanzania announced in February 2015 that it would publish details related to revenue, expenditure, investment, profit statements and operational challenges. This sets a high standard for other Tanzanian companies to follow. It is clear that measures such as these play a strong role in building public perceptions that a particular business is a good corporate citizen, with companies that demonstrate transparency winning trust from the public, including customers and investors. Reconciling tax payments between tax contributors and tax administration through voluntary agreements would be a great step forwards in terms of achieving higher levels of transparency and accountability. Source: BBC/The Citizen 51 UN Economic Commission for Africa, Illicit Financial Flows from Africa,
63 The World Bank Group Macroeconomics and Fiscal Management Global Practice Africa Region Spot checks can be conducted, as tax evaders are more likely to comply if they believe there is a high probability of being caught and sanctioned. Measures to eradicate corruption will promote higher levels of tax compliance. Corruption within Government results in non-compliance with tax obligations, as taxpayers feel that their tax payments will be wasted and that they are under no moral obligation to pay these taxes. In contrast, if corruption is minimal and services are delivered, citizens are likely to feel a responsibility to pay for the services they receive. Studies show that improvements in institutional quality are associated with higher levels of tax compliance. 52 Tax evasion can be fought through specific programs intended to address areas where tax evasion is likely to be highest. For example, since 2007, the Italian government has successfully implemented the Ghost Building program to address the evasion of real estate and property taxes. Spot checks can be conducted, as tax evaders are more likely to comply if they believe there is a high probability of being caught and sanctioned. It should be recognized that measures to reduce tax evasion result in winners and losers: the measures hurt tax evaders, typically a minority of businesses and individuals, while the majority of the population is likely to benefit from additional government expenditures or lower tax rates. Anti-tax evasion policies are thus asymmetric in their concentration of costs and benefits. Due to this asymmetry, fighting tax evasion may either benefit or harm politicians who seek re-election. 53 In addressing tax evasion, a distinction can be drawn between ghosts (those who don t comply) and icebergs (those who only partially fulfill their obligations). In Tanzania, each of these groups should be treated differently, as different solutions may be appropriate. For ghosts, identification and registration of taxpayers is the first critical step. For icebergs, auditing and enforcement are key. Tanzania also needs to manage aggressive tax planning by large foreign owned enterprises. Transfer pricing is used by multinational corporations to shift profits into other jurisdictions. TRA need to ensure that they are closely monitoring transfer pricing and that they have institutions that are empowered to collect their fair share. 54 Finding potential taxpayers is only part of the solution. Sanctions and appropriate enforcement are critically important for ensuring compliance. With limited resources, the revenue collection authorities may choose to pick their battles, targeting larger taxpayers to maximize the use of their resources. In considering the allocation of administrative to successful economic growth, it is necessary to ensure social inclusion and ecological sustainability. As the tourism sector grows, it 52 Frey.S & Torgler.B, Tax morale and conditional cooperation, Journal of Comparative Economics 35 (2007) , Casaburi.L & Troiano.U, Ghost-House Busters: The Electoral Response to a Large Anti Tax Evasion Program, Stanford University,
64 TANZANIA ECONOMIC UPDATE JULY 2015, 7 TH EDITION becomes increatheir tourism. Tax incentives in Tanzania can or example, an entry park fee should be collected by local authorities, if this resources, the decision to focus on the largest taxpayers makes sense. The gain from having a telecoms company pay its taxes on time, rather than delaying by a few days, will far outweigh that from expanding the net of smaller taxpayers or formalizing small businesses. However, tax authorities should not just follow the path of least resistance. The authorities should not forget that the nonparticipation of small and medium size firms can reduce the legitimacy of the tax system by making it seem unfair. This threatens the fiscal contract. The authorities need to consider how best to implement taxpayer segmentation by size and to tailor tax treatment according to capacity and needs. Compliance challenges associated with different taxpayer groups should be targeted at all levels, given the different challenges faced. To improve the level of accountability between the state and the citizen, the use of locally sourced revenues to fund local services may be considered. Such a system may facilitate higher levels of local accountability, more flexible decision making and better local service delivery. The use of earmarking may also work to overcome political hurdles. For example, when Ghana raised VAT from 10 to 15 percent, the additional revenues were earmarked for health and education. However, this approach can limit the optimal use of revenues throughout the economy, as it sets up parallel incentive structures, which invite corruption and reduce budget flexibility. Another, possibly more effective, alternative is for the Government to make greater efforts to clearly demonstrate that it conducts its expenditure responsibly and transparently. In Tanzania, steps have been taken to improve the efficiency of public spending. The Government has developed a public investment management manual to facilitate improved project appraisal and prioritization. To familiarize the use of this manual, the Government is rolling out training to all those who need it. However, more intense efforts to reduce and eradicate corruption are also necessary. By whatever means, Tanzania must make intense efforts to improve its performance in the area of revenue collection. The Government needs to strike the right balance between incentives and sanctions. To some extent, taxpayers evaluate the costs and benefits of paying their taxes. Ultimately, they will pay taxes if they perceive them to be fair, reasonable, and without excessive transaction costs. They need assurance that their contributions will be used efficiently and equitably. However, it is not realistic to rely entirely upon the moral conscience of taxpayers in this regard. Tanzanian citizens and businesses need to be aware that if they fail to meet their tax obligations, they will be punished. Political commitment is essential for tax reforms to be implemented and sustained. While securing this commitment will by no means be easy, it is vital if Tanzania is to secure the funds it needs to finance economic and social development for the benefit of all its citizens. The Government needs to strike the right balance between incentives and sanctions. To some extent, taxpayers evaluate the costs and benefits of paying their taxes. 48

65 The World Bank Group Macroeconomics and Fiscal Management Global Practice Africa Region Statistical Annexes 49
66 TANZANIA ECONOMIC UPDATE JULY 2015, 7 TH EDITION Annex 1: Key macroeconomic indicators (GDP data based revised numbers) Note /1 Fiscal year is used, and it ends June 30th of the mentioned year /2 Calendar year is used, and it ends in mentioned year December 31st. Source: IMF and Tanzania Authorities (MoF, BoT, NBS,). 50
67 The World Bank Group Macroeconomics and Fiscal Management Global Practice Africa Region Annex 2: Real GDP growth rates (percent) Source: NBS, GoT 51
68 TANZANIA ECONOMIC UPDATE JULY 2015, 7 TH EDITION Annex 3: Shares of economic activity in GDP (current market share) (percent) Source: NBS 52
69 The World Bank Group Macroeconomics and Fiscal Management Global Practice Africa Region Annex 4: Fiscal framework as a percentage of GDP Source: Ministry of Finance, IMF, World Bank Note: Budget estimates are calculated using the budget figure over the actual revised GDP figure. Annex 5: Balance of payments (percentage of GDP unless other indicated) 2008/9-2013/14 Source: BoT, IMF, World Bank 53
70 TANZANIA ECONOMIC UPDATE JULY 2015, 7 TH EDITION Annex 6: Monthly imports of goods and services (USD mn) Source: BoT, IMF, World Bank Annex 7: Monthly exports of goods and services (USD mn) Source: BoT 54
71 The World Bank Group Macroeconomics and Fiscal Management Global Practice Africa Region Annex 8: Inflation rates Source: BoT 55
72 TANZANIA ECONOMIC UPDATE JULY 2015, 7 TH EDITION Annex 9: Monthly food crop prices (Wholesale) Tanzania Shillings per 100kg Source: Ministry of Industry, Trade and Marketing, GoT 56
73 The World Bank Group Macroeconomics and Fiscal Management Global Practice Africa Region Annex 10: Average wholesale prices: Tanzania shillings per 100kg Source: Ministry of Industry, Trade and Marketing, GoT 57
74 TA N Z A N I A E C O N O M I C U P D AT E J U LY , 7 T H E D I T I O N Annex 11: Interest rate structures Source: BoT 58
75 The World Bank Group Macroeconomics and Fiscal Management Global Practice Africa Region Annex 12: Monetary aggregates (2007/8 2013/14) Source: BoT, IMF, WB 59
76 TA N Z A N I A E C O N O M I C U P D AT E J U LY , 7 T H E D I T I O N Annex 13: National debt developments Source: BoT 60
77 The World Bank Group Macroeconomics and Fiscal Management Global Practice Africa Region Annex 14: Poverty by geographic regions Source: NBS 1/ Monthly expenditure per adult 61

78 TA N Z A N I A E C O N O M I C U P D AT E J U LY , 7 T H E D I T I O N Annex 15: Tanzania mainland tax revenue collection 1996/7-2013/14 Source: NBS 1/ Monthly expenditure per adult 62
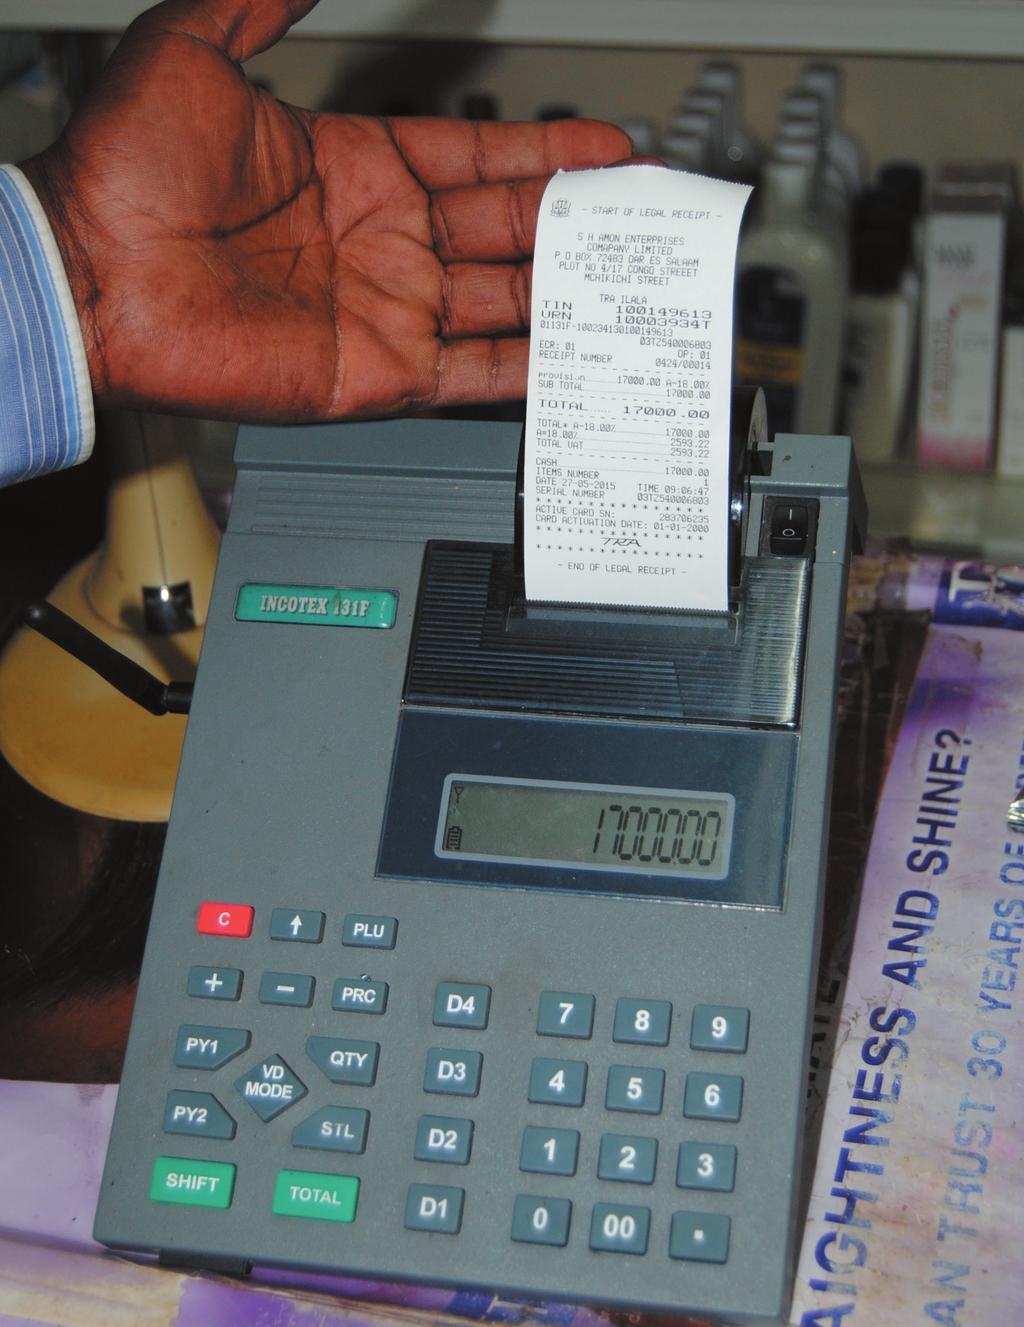
79
THE UNITED REPUBLIC OF TANZANIA MINISTRY OF FINANCE QUARTERLY ECONOMIC REVIEW AND BUDGET EXECUTION REPORT FOR FISCAL YEAR 2013/14 JANUARY MARCH 2014
 THE UNITED REPUBLIC OF TANZANIA MINISTRY OF FINANCE QUARTERLY ECONOMIC REVIEW AND BUDGET EXECUTION REPORT FOR FISCAL YEAR 2013/14 JANUARY MARCH 2014 MAY 2014 SUMMARY In 2013, real GDP grew by 7.0 percent
Monitoring of Graduating Countries from the Least Developed Country Category: Equatorial Guinea
 Monitoring of Graduating Countries from the Least Developed Country Category: Equatorial Guinea Committee for Development Policy UN Headquarters, New York 23 27 March 2015 1 I. Background Equatorial Guinea
Angola - Economic Report
 Angola - Economic Report Index I. Assumptions on National Policy and External Environment... 2 II. Recent Trends... 3 A. Real Sector Developments... 3 B. Monetary and Financial sector developments... 5
PERFORMANCE OF THE ECONOMY REPORT NOVEMBER 2017
 PERFORMANCE OF THE ECONOMY REPORT NOVEMBER 2017 MACROECONOMIC POLICY DEPARTMENT MINISTRY OF FINANCE, PLANNING AND ECONOMIC DEVELOPMENT www.finance.go.ug Table of Contents SUMMARY... 2 REAL SECTOR DEVELOPMENTS...
PERFORMANCE OF ECONOMY REPORT December 2017
 PERFORMANCE OF ECONOMY REPORT December 2017 MACROECONOMIC POLICY DEPARTMENT MINISTRY OF FINANCE PLANNING AND ECONOMIC DEVELOPMENT www.finance.go.ug TABLE OF CONTENTS LIST OF ACRONYMS... 3 HIGHLIGHTS...
Monthly Report PERFORMANCE OF THE ECONOMY. May 2017 MACROECONOMIC POLICY DEPARTMENT MINISTRY OF FINANCE, PLANNING AND ECONOMIC DEVELOPMENT
 Monthly Report PERFORMANCE OF THE ECONOMY May 2017 MACROECONOMIC POLICY DEPARTMENT MINISTRY OF FINANCE, PLANNING AND ECONOMIC DEVELOPMENT www.finance.go.ug Table of Contents SUMMARY:... 1 REAL SECTOR DEVELOPMENTS:...
FOURTH REVIEW UNDER THE POLICY SUPPORT INSTRUMENT DEBT SUSTAINABILITY ANALYSIS
 December 17, 215 FOURTH REVIEW UNDER THE POLICY SUPPORT INSTRUMENT DEBT SUSTAINABILITY ANALYSIS Approved By Roger Nord and Masato Miyazaki (IMF) and John Panzer (IDA) The Debt Sustainability Analysis (DSA)
THE UNITED REPUBLIC OF TANZANIA
 THE UNITED REPUBLIC OF TANZANIA MINISTRY OF FINANCE AND ECONOMIC AFFAIRS BUDGET EXECUTION REPORT FISCAL YEAR 2009/10 JULY DECEMBER 2009 DAR ES SALAM FEBRUARY 2010 SUMMARY The economic performance during
ECONOMIC SURVEY 2013 HIGHLIGHTS. Anne Waiguru, OGW Cabinet Secretary Ministry of Devolution and Planning
 ECONOMIC SURVEY 2013 HIGHLIGHTS Anne Waiguru, OGW Cabinet Secretary Ministry of Devolution and Planning Presentation Outline 1. International scene 2. Highlights of the economic performance in 2012 3.
Chapter two Overview of the Macroeconomic Situation and Outlook for Africa
 002 Chapter two Overview of the Macroeconomic Situation and Outlook for Overview of the Macroeconomic Situation Economic Outlook for and the Role of the Bank Chapter 002 Overview of the Macroeconomic Situation
Vietnam: Joint Bank-Fund Debt Sustainability Analysis 1
 1 November 2006 Vietnam: Joint Bank-Fund Debt Sustainability Analysis 1 Public sector debt sustainability Since the time of the last joint DSA, the most important new signal on the likely direction of
Sub- Saharan Africa and Kenya: risks and opportunities
 Sub- Saharan Africa and Kenya: risks and opportunities This paper has been prepared by: Ivano Gioia, SACE Abstract After the negative record registered in 2016, the economic growth of Sub- Saharan Africa
Economic ProjEctions for
 Economic Projections for 2016-2018 ECONOMIC PROJECTIONS FOR 2016-2018 Outlook for the Maltese economy 1 Economic growth is expected to ease Following three years of strong expansion, the Bank s latest
The Road Less Traveled: Unleashing Public Private Partnerships in Tanzania
 Revised Draft - May 12 2016 Tanzania Economic Update # 8 The Road Less Traveled: Unleashing Public Private Partnerships in Tanzania 0 Table of Contents Abbreviations and acronyms... 5 Acknowledgment...
Economic Survey of Latin America and the Caribbean CHILE. 1. General trends. 2. Economic policy
 Economic Survey of Latin America and the Caribbean 2017 1 CHILE 1. General trends In 2016 the Chilean economy grew at a slower rate (1.6%) than in 2015 (2.3%), as the drop in investment and exports outweighed
Unit 4. Mixed Macroeconomic Performance of Nepal TULA RAJ BASYAL * ABSTRACT
 Unit 4 Mixed Macroeconomic Performance of Nepal TULA RAJ BASYAL * ABSTRACT Nepal continues to remain an Least Developed Country (LDC) with a per capita income of around US $ 300. The structure of the economy
HAITI. 1. General trends
 Economic Survey of Latin America and the Caribbean 2015 1 HAITI 1. General trends The Haitian economy performed considerably less well in fiscal year 2013/2014 than forecast. 1 At 2.8%, GDP growth was
Viet Nam GDP growth by sector Crude oil output Million metric tons 20
 Viet Nam This economy is weathering the global economic crisis relatively well due largely to swift and strong policy responses. The GDP growth forecast for 29 is revised up from that made in March and
Korean Economic Trend and Economic Partnership between Korea and China
 March 16, 2012 Korean Economic Trend and Economic Partnership between Korea and China Byung-Jun Song President, KIET Good evening ladies and gentlemen. It is a great honor to be a part of this interesting
Tranche Release Document. I. Background
 Public Disclosure Authorized Public Disclosure Authorized Public Disclosure Authorized Public Disclosure Authorized I. Background Ethiopia Growth and Competitiveness Development Policy Financing (Credit
Kenya s IMF Standby Facility, & Cytonn Weekly #31/2018
 Kenya s IMF, & Cytonn Weekly #31/2018 Focus of the Week The International Monetary Fund (IMF) recently concluded their visit to Kenya where they were holding discussions with the Kenyan Government on the
Monthly Report PERFORMANCE OF THE ECONOMY SEPTEMBER 2017 MACROECONOMIC POLICY DEPARTMENT MINISTRY OF FINANCE, PLANNING AND ECONOMIC DEVELOPMENT
 Monthly Report PERFORMANCE OF THE ECONOMY SEPTEMBER 2017 MACROECONOMIC POLICY DEPARTMENT MINISTRY OF FINANCE, PLANNING AND ECONOMIC DEVELOPMENT www.finance.go.ug Table of Contents SUMMARY... 1 REAL SECTOR...
Growth in Tanzania: Is it Reducing Poverty?
 Growth in Tanzania: Is it Reducing Poverty? Introduction Tanzania has received wide recognition for steering its economy in the right direction. In its recent publication, Tanzania: the story of an African
Malawi: Joint Bank-Fund Debt Sustainability Analysis Based on Low-Income County Framework 1
 1 December 26 Malawi: Joint Bank-Fund Debt Sustainability Analysis Based on Low-Income County Framework 1 1. Malawi s risk of debt distress after debt relief under the HIPC Initiative and the Multilateral
INTERNATIONAL MONETARY FUND AND INTERNATIONAL DEVELOPMENT ASSOCIATION DEMOCRATIC REPUBLIC OF CONGO
 71 INTERNATIONAL MONETARY FUND AND INTERNATIONAL DEVELOPMENT ASSOCIATION DEMOCRATIC REPUBLIC OF CONGO Joint IMF/World Bank Debt Sustainability Analysis 29 Prepared by the Staffs of the International Monetary
Karnit Flug: Macroeconomic policy and the performance of the Israeli economy
 Karnit Flug: Macroeconomic policy and the performance of the Israeli economy Remarks by Dr Karnit Flug, Governor of the Bank of Israel, to the conference of the Israel Economic Association, Tel Aviv, 18
PROGRAM INFORMATION DOCUMENT (PID) CONCEPT STAGE. First Governance and Competitiveness Development Policy Operation (DPO1) Region
 CONCEPT STAGE. First Governance and Competitiveness Development Policy Operation (DPO1) Region") PROGRAM INFORMATION DOCUMENT (PID) CONCEPT STAGE Report No.: AB6864 Operation Name First Governance and Competitiveness Development Policy Operation (DPO1) Region AFRICA Sector Central government administration
PROGRAM INFORMATION DOCUMENT (PID) CONCEPT STAGE Report No.: AB6864 Operation Name First Governance and Competitiveness Development Policy Operation (DPO1) Region AFRICA Sector Central government administration
Monthly Report PERFORMANCE OF THE ECONOMY JUNE 2018 MACROECONOMIC POLICY DEPARTMENT MINISTRY OF FINANCE, PLANNING AND ECONOMIC DEVELOPMENT
 Monthly Report PERFORMANCE OF THE ECONOMY JUNE 2018 MACROECONOMIC POLICY DEPARTMENT MINISTRY OF FINANCE, PLANNING AND ECONOMIC DEVELOPMENT www.finance.go.ug Table of Contents SUMMARY... 1 REAL SECTOR DEVELOPMENTS...
ECONOMIC SURVEY 2017 HIGHLIGHTS
 ECONOMIC SURVEY 2017 HIGHLIGHTS PRESENTED BY ZACHARY MWANGI DIRECTOR GENERAL KENYA NATIONAL BUREAU OF STATISTICS 19 TH APRIL 2017 ECONOMIC SURVEY 2017 Outline International scene Highlights of the country's
THE UNITED REPUBLIC OF TANZANIA MINISTRY OF FINANCE AND PLANNING
 THE UNITED REPUBLIC OF TANZANIA MINISTRY OF FINANCE AND PLANNING MEDIUM TERM DEBT MANAGEMENT STRATEGY DECEMBER, 2017 1 Table of Contents List of Charts... 3 List of Tables... 3 1.0 INTRODUCTION... 4 2.0
II. Country Economic Profiles: Ethiopia, Tanzania, Zambia, China and Vietnam
 II. Country Economic Profiles: Ethiopia, Tanzania, Zambia, China and Vietnam 50 II.1. Ethiopia II.1.1. Growth and Structure Ethiopia, with a population of 81 million and per capita income (at market prices)
measured by a three-year average of the World Banks Country Policy and Institutional Assessment (CPIA)
") April 1, 2013 KENYA FIFTH REVIEW UNDER THE THREEYEAR ARRANGEMENT UNDER THE EXTENDED CREDIT FACILITY AND REQUEST FOR A WAIVER AND MODIFICATION OF PERFORMANCE CRITERIADEBT SUSTAINABILITY ANALYSIS Approved
April 1, 2013 KENYA FIFTH REVIEW UNDER THE THREEYEAR ARRANGEMENT UNDER THE EXTENDED CREDIT FACILITY AND REQUEST FOR A WAIVER AND MODIFICATION OF PERFORMANCE CRITERIADEBT SUSTAINABILITY ANALYSIS Approved
SOUTH ASIA. Chapter 2. Recent developments
 SOUTH ASIA GLOBAL ECONOMIC PROSPECTS January 2014 Chapter 2 s GDP growth rose to an estimated 4.6 percent in 2013 from 4.2 percent in 2012, but was well below its average in the past decade, reflecting
THE UNITED REPUBLIC OF TANZANIA BUDGET FOR FISCAL YEAR 2009/10 APRIL JUNE 2010 AND FULL YEAR BUDGET PERFORMANCE
 THE UNITED REPUBLIC OF TANZANIA BUDGET FOR FISCAL YEAR 2009/10 APRIL JUNE 2010 AND FULL YEAR BUDGET PERFORMANCE MINISTRY OF FINANCE AND ECONOMIC AFFAIRS AUGUST, 2010 EXECUTIVE SUMMARY The preliminary results
Yemen Socio-Economic Update
 Ministry of Planning & International Cooperation Economic Studies & Forcasting Sector Issue (12) Mar. 2016 Yemen Economy in Lines Public Finance Developments in Yemen INTRODUCTION This edition highlights
El Salvador. 1. General trends. 2. Economic policy. Most macroeconomic indicators for El Salvador worsened in Real GDP increased by
 Economic Survey of Latin America and the Caribbean 2008-2009 173 El Salvador 1. General trends Most macroeconomic indicators for El Salvador worsened in 2008. Real GDP increased by 2.5%, two percentage
STAFF REPORT FOR THE 2014 ARTICLE IV CONSULTATION AND SECOND REVIEW UNDER THE POLICY SUPPORT INSTRUMENT DEBT SUSTAINABILITY ANALYSIS
 November 19, 214 RWANDA STAFF REPORT FOR THE 214 ARTICLE IV CONSULTATION AND SECOND REVIEW UNDER THE POLICY SUPPORT INSTRUMENT DEBT SUSTAINABILITY ANALYSIS Approved By Roger Nord and Dan Ghura (IMF) and
In 2012, the Franc Zone countries posted particularly strong economic growth of 5.8% on average compared
 OVERVIEW In 01, the Franc Zone countries posted particularly strong economic growth of 5.8% on average compared with an average of.9% for Sub-Saharan Africa. The Franc Zone countries benefited from ongoing
Divergent Monetary Policy Implication for sub-saharan African Economies. By Sarah O. Alade Deputy Governor, Economic Policy Central Bank of Nigeria
 Divergent Monetary Policy Implication for sub-saharan African Economies By Sarah O. Alade Deputy Governor, Economic Policy Central Bank of Nigeria Crisis background The recent financial crisis is one of
INTERNATIONAL DEVELOPMENT ASSOCIATION INTERNATIONAL MONETARY FUND NEPAL. Joint Bank-Fund Debt Sustainability Analysis
 Public Disclosure Authorized Public Disclosure Authorized Public Disclosure Authorized INTERNATIONAL DEVELOPMENT ASSOCIATION INTERNATIONAL MONETARY FUND NEPAL Joint Bank-Fund Debt Sustainability Analysis
Jordan Country Brief 2011
 Jordan Country Brief 2011 CONTEXT The Hashemite Kingdom of Jordan is an upper middle income country with a population of 6 million and a per-capita GNI of US $4,390. Jordan s natural resources are potash
OVERVIEW. Key economic indicators (%) GDP growth (%) Inflation (%) *
 GDP growth (%) Inflation (%) *") OVERVIEW In 2007, in the context of once again robust global economic growth, African franc zone countries as a whole posted a slight increase in their growth rate, which rose from 3.1% in 2006 to 3.5%
OVERVIEW In 2007, in the context of once again robust global economic growth, African franc zone countries as a whole posted a slight increase in their growth rate, which rose from 3.1% in 2006 to 3.5%
Ukraine. Systematic Country Diagnostic
 For Discussion Only Ukraine Systematic Country Diagnostic Discussion October 2016 1 2 OUTLINE OUTLINE 1. New WBG Country Engagement Approach: What is an SCD? 2. Growth and Sustainability in Ukraine 3.
THE FEDERAL DEMOCRATIC REPUBLIC OF ETHIOPIA
 August 29, 213 THE FEDERAL DEMOCRATIC REPUBLIC OF ETHIOPIA STAFF REPORT FOR THE 213 ARTICLE IV CONSULTATION DEBT SUSTAINABILITYANALYSIS Approved By Michael Atingi-Ego and Elliott Harris (IMF) and Jeffrey
Ghana: Implications of the Rising Interest Costs to Government
 Fiscal Alert No.4 December 2015 Ghana: Implications of the Rising Interest Costs to Government Introduction One important feature of fiscal management in Ghana in the last few years has been the rapid
Against the backdrop of a slow, fragile and patchwork recovery in global economic growth, Franc Zone
 OVERVIEW Against the backdrop of a slow, fragile and patchwork recovery in global economic growth, Franc Zone countries performed reasonably well in 2014, even compared to the rest of Sub-Saharan Africa
2014/2015 Budget Support in Tanzania
 2014/2015 Budget Support in Tanzania FOREWORD By the Chair of the Development Partners Budget Support Group Budget Support has brought important development results to Tanzania Budget Support is a significant
Bank of Ghana Monetary Policy Committee Press Release
 Bank of Ghana Monetary Policy Committee Press Release November 26, 2018 Ladies and Gentlemen of the Press, welcome to this morning s press conference following the 85th regular meeting of the Monetary
MONETARY AND FINANCIAL TRENDS IN THE FIRST SEMESTER OF 2015
 MONETARY AND FINANCIAL TRENDS IN THE FIRST SEMESTER OF 2015 The purpose of this review is to present the main components that characterize the development of the situation of the external financial position
Integrated Paper on. Recent Economic Developments. in SADC
 Integrated Paper on Recent Economic Developments in DC October 2005 Banco de Moçambique General Index Page I. Introduction... 3 II. Performance of the World and African Economy in 2004... 4 III. Performance
MCCI ECONOMIC OUTLOOK. Novembre 2017
 MCCI ECONOMIC OUTLOOK 2018 Novembre 2017 I. THE INTERNATIONAL CONTEXT The global economy is strengthening According to the IMF, the cyclical turnaround in the global economy observed in 2017 is expected
MONETARY POLICY STATEMENT
 June 2016 a b ISSN 0856-6976 MONETARY POLICY STATEMENT 2016/17 GOVERNOR BANK OF TANZANIA June 2016 c d 7 th June 2016 Hon. Dr. Philip I. Mpango (MP), Minister for Finance and Planning, Dar es Salaam, TANZANIA.
JOINT IMF/WORLD BANK DEBT SUSTAINABILITY
 ZIMBABWE JOINT IMF/WORLD BANK DEBT SUSTAINABILITY May 5, 211 ANALYSIS 1 Approved By Mark Plant and Dominique Desruelle (IMF) Marcelo Giugale and Jeffery Lewis (IDA) Prepared by The International Monetary
Guatemala. 1. General trends. 2. Economic policy. In 2009, the Guatemalan economy faced serious challenges as attempts were made to mitigate
 Economic Survey of Latin America and the Caribbean 2009-2010 161 Guatemala 1. General trends In 2009, the Guatemalan economy faced serious challenges as attempts were made to mitigate the impact of the
MINISTRY OF FINANCE AND ECONOMIC AFFAIRS DEBT SUSTAINABILITY ANALYSIS Directorate of Debt Management and Economic Cooperation
 MINISTRY OF FINANCE AND ECONOMIC AFFAIRS A S D DEBT SUSTAINABILITY ANALYSIS 2015 Directorate of Debt Management and Economic Cooperation Table of Contents LIST OF TABLES... 2 LIST OF FIGURES... 2 LIST
An Assessment of the Investment Climate in Tanzania
 An Assessment of the Investment Climate in Tanzania May 2009 Revised Draft DO NOT CITE OR QUOTE WITHOUT PERMISSION Volume 1: Overview 1 Abbreviations and Acronyms BMK FDI GDP ICA ILO IMF ISO LLC LPI MOID
The Economy. Past Performance 2014/15
 The Economy Highlights based on speeches by the Minister of Finance and Economic Affairs on 11 June 2015 Actual GDP growth of 7.0% in 2014 compared to projected 7.3% for 2015 Average inflation rate in
Business Environment: Russia
 Business Environment: Russia Euromonitor International 13 April 2010 Despite the economic recession of 2009, a recovery is expected in 2010. The business environment remains challenging due to over-regulation,
MONETARY AND FINANCIAL TRENDS IN THE FIRST NINE MONTHS OF 2013
 MONETARY AND FINANCIAL TRENDS IN THE FIRST NINE MONTHS OF 2013 Introduction This note is to analyze the main financial and monetary trends in the first nine months of this year, with a particular focus
INTERNATIONAL DEVELOPMENT ASSOCIATION AND INTERNATIONAL MONETARY FUND RWANDA. Joint IMF/World Bank Debt Sustainability Analysis
 INTERNATIONAL DEVELOPMENT ASSOCIATION AND INTERNATIONAL MONETARY FUND RWANDA Joint IMF/World Bank Debt Sustainability Analysis Prepared by the Staffs of the International Monetary Fund and the International
The Mid-Year Review 2017/18
 The Mid-Year Review 2017/18 February 2018 a b ISSN 0856-6976 MONETARY POLICY STATEMENT The Mid-Year Review 2017/18 GOVERNOR BANK OF TANZANIA February 2018 c d 6 th February 2018 Hon. Dr. Philip I. Mpango
MADAGASCAR ECONOMIC UPDATE: A Transition but Challenges are coming soon
 MADAGASCAR ECONOMIC UPDATE: A Transition but Challenges are coming soon World Bank June 19 2009 So far the dialogue between the main political parties has failed to produce an agreement on the way forward
ECONOMIC PROFILE OF NORWAY
 5/31/2017 ECONOMIC PROFILE OF NORWAY Submitted to Dr. Ahmed Tazmeen Department of Economics North South University Prepared & Submitted by Fatema Zohara ID: 161-2861-085 MPPG 6th Batch North South University
Monetary Policy Report
 CENTRAL BANK OF THE GAMBIA Monetary Policy Report November 20 The Central Bank of The Gambia Monetary Policy Report provides summary of reports presented at the Monetary Policy Committee Meeting. It entails
(January 2016). The fiscal year for Rwanda is from July June; however, this DSA is prepared on a calendar
. The fiscal year for Rwanda is from July June; however, this DSA is prepared on a calendar") May 25, 216 RWANDA FIFTH REVIEW UNDER THE POLICY SUPPORT INSTRUMENT AND REQUEST FOR EXTENSION, AND REQUEST FOR AN ARRANGEMENT UNDER THE STANDBY CREDIT FACILITY DEBT SUSTAINABILITY ANALYSIS Approved By
May 25, 216 RWANDA FIFTH REVIEW UNDER THE POLICY SUPPORT INSTRUMENT AND REQUEST FOR EXTENSION, AND REQUEST FOR AN ARRANGEMENT UNDER THE STANDBY CREDIT FACILITY DEBT SUSTAINABILITY ANALYSIS Approved By
INTERNATIONAL DEVELOPMENT ASSOCIATION AND INTERNATIONAL MONETARY FUND RWANDA. Joint World Bank/IMF Debt Sustainability Analysis
 INTERNATIONAL DEVELOPMENT ASSOCIATION AND INTERNATIONAL MONETARY FUND RWANDA Joint World Bank/IMF Debt Sustainability Analysis Prepared by staffs of the International Development Association and International
Ministerial Conference on the Financial Crisis
 UNECA Ministerial Conference on the Financial Crisis BRIEFING NOTE 1: The Current Financial Crisis: Impact on African Economies Ramada Plaza Hotel, Tunis, Tunisia November 12, 2008 1. Introduction The
AFRICAN DEVELOPMENT BANK GROUP
 AFRICAN DEVELOPMENT BANK GROUP Ministerial Round Table Discussions Africa and the Financial Crisis: An Agenda for Action The 2009 African Development Bank Annual Meetings Ministerial Round Table Discussions
MACROECONOMIC POLICY DEPARTMENT MINISTRY OF FINANCE, PLANNING AND ECONOMIC DEVELOPMENT
 PERFORMANCE OF THE ECONOMY REPORT OCTOBER 2018 MACROECONOMIC POLICY DEPARTMENT MINISTRY OF FINANCE, PLANNING AND ECONOMIC DEVELOPMENT www.finance.go.ug TABLE OF CONTENTS LIST OF TABLES... ii LIST OF FIGURES...
Heads and staffs of the Institute for Fiscal Studies (IFS) and The Natural Resource Governance Institute (NRGI),
 and The Natural Resource Governance Institute (NRGI),") MANAGING NATURAL RESOURCE REVENUE FOR SUSTAINABLE GROWTH & DEVELOPMENT Opening Address by Mr. Alex Ashiagbor, Chairman of the Governing Council, IFS and former Governor of the Bank of Ghana Introduction
MANAGING NATURAL RESOURCE REVENUE FOR SUSTAINABLE GROWTH & DEVELOPMENT Opening Address by Mr. Alex Ashiagbor, Chairman of the Governing Council, IFS and former Governor of the Bank of Ghana Introduction
THE RESOURCES BOOM AND MACROECONOMIC POLICY IN AUSTRALIA
 THE RESOURCES BOOM AND MACROECONOMIC POLICY IN AUSTRALIA Australian Economic Report: Number 1 Bob Gregory Peter Sheehan Centre for Strategic Economic Studies Victoria University Melbourne November 2011
MEDIUM-TERM FORECAST
 MEDIUM-TERM FORECAST Q2 2010 Published by: Národná banka Slovenska Address: Národná banka Slovenska Imricha Karvaša 1 813 25 Bratislava Slovakia Contact: Monetary Policy Department +421 2 5787 2611 +421
/JordanStrategyForumJSF Jordan Strategy Forum. Amman, Jordan T: F:
 The Jordan Strategy Forum (JSF) is a not-for-profit organization, which represents a group of Jordanian private sector companies that are active in corporate and social responsibility (CSR) and in promoting
1 RED June/July 2018 JUNE/JULY 2018
 1 RED June/July 20 JUNE/JULY 20 2 RED June/July 20 MAJOR HIGHLIGHTS Headline consumer inflation grew by 4.9 per cent in June 20 compared to 4.8 per cent recorded in May 20 Inflation rate (% y/y) 4.9 (June)
INTERNATIONAL DEVELOPMENT ASSOCIATION INTERNATIONAL MONETARY FUND KENYA. Joint Bank-Fund Debt Sustainability Analysis - Update
 Public Disclosure Authorized INTERNATIONAL DEVELOPMENT ASSOCIATION INTERNATIONAL MONETARY FUND KENYA Public Disclosure Authorized Joint Bank-Fund Debt Sustainability Analysis - Update Prepared by the Staff
HONDURAS. 1. General trends
 Economic Survey of Latin America and the Caribbean 2016 1 HONDURAS 1. General trends Economic growth in Honduras picked up in 2015, reaching 3.6%, compared with 3.1% in 2014. This performance was mainly
ECONOMY REPORT - CHINESE TAIPEI
 ECONOMY REPORT - CHINESE TAIPEI (Extracted from 2001 Economic Outlook) REAL GROSS DOMESTIC PRODUCT The Chinese Taipei economy grew strongly during the first three quarters of 2000, thanks largely to robust
INTERNATIONAL DEVELOPMENT ASSOCIATION AND INTERNATIONAL MONETARY FUND SUDAN. Joint World Bank/IMF 2009 Debt Sustainability Analysis
 INTERNATIONAL DEVELOPMENT ASSOCIATION AND INTERNATIONAL MONETARY FUND SUDAN Joint World Bank/IMF 29 Debt Sustainability Analysis Prepared by the Staffs of the International Development Association and
INTERNATIONAL MONETARY FUND AND INTERNATIONAL DEVELOPMENT ASSOCIATION SIERRA LEONE. Joint IMF/World Bank Debt Sustainability Analysis 2010
 INTERNATIONAL MONETARY FUND AND INTERNATIONAL DEVELOPMENT ASSOCIATION SIERRA LEONE Joint IMF/World Bank Debt Sustainability Analysis 21 Prepared by the staffs of the International Monetary Fund and the
Ukraine Macroeconomic Situation
 In 2012, industrial production was down by 1.8% yoy as weakening global demand for steel exerted a toll on the Ukrainian metallurgical industry. Last year, harvested 46.2 tons of grains and overseas shipments
ECONOMIC ANALYSIS (SUMMARY) 1
 1") Country Partnership Strategy: SRI, 2012 2016 A. Economic Performance and Outlook ECONOMIC ANALYSIS (SUMMARY) 1 1. Sri Lanka maintained an average rate of growth of 6.4% over the 5 years from 2006 to 2010.
Country Partnership Strategy: SRI, 2012 2016 A. Economic Performance and Outlook ECONOMIC ANALYSIS (SUMMARY) 1 1. Sri Lanka maintained an average rate of growth of 6.4% over the 5 years from 2006 to 2010.
5. Bulgarian National Bank Forecast of Key
 5. Bulgarian National Bank Forecast of Key Macroeconomic Indicators for 2018 2020 The BNB forecast of key macroeconomic indicators is based on data published as of 15 June 2018. ECB, EC and IMF assumptions
INTERNATIONAL DEVELOPMENT ASSOCIATION INTERNATIONAL MONETARY FUND MALI. Joint Bank-Fund Debt Sustainability Analysis Update
 Public Disclosure Authorized INTERNATIONAL DEVELOPMENT ASSOCIATION INTERNATIONAL MONETARY FUND MALI Public Disclosure Authorized Public Disclosure Authorized Joint Bank-Fund Debt Sustainability Analysis
KENYA MACROECONOMIC UPDATE: JULY 2016
 KENYA MACROECONOMIC UPDATE: JULY 2016 18 th July 2016 OUTLOOK: POSITIVE GROWTH EXPECTATIONS DESPITE VOLATILE EXOGENOUS SHOCKS Building on our previous report, Kenya Macroeconomic Outlook: 2016, we maintain
Mauritius Economy Update January 2015
 January 19, 2015 Economics Mauritius Economy Update January 2015 Overview - Mauritian economy has been witnessing a persistent moderation in growth since 2010 due to weak economic activity in Euro Zone,
1.0 BANK OF TANZANIA MONTHLY ECONOMIC REVIEW
 1.0 BANK OF TANZANIA MONTHLY ECONOMIC REVIEW April 2016 Contents 1.0 Inflation and Food Supply Situation... 1 1.1 Inflation Developments... 1 1.2 Food Supply Situation... 1 1.3 Prices of Food Crops...
Afghanistan: Transition to Transformation Update. January 29, 2014 JCMB Meeting. The World Bank
 Afghanistan: Transition to Transformation Update January 29, 2014 JCMB Meeting The World Bank 1 Outline Outline Progress and Challenges Key Messages from Tokyo and Transition Report Recent Economic and
Strengths + and weaknesses
 Chile: economic reality holds back reforms Country Report Ester Barendregt The Bachelet government is facing popular discontent on both the left and the right as well as a deteriorated economic environment,
Nicaragua. 1. General trends. 2. Economic policy. The economy grew by 4.5% in 2010, after shrinking by 1.5% in 2009, indicating that Nicaragua
 Economic Survey of Latin America and the Caribbean 2010-2011 197 Nicaragua 1. General trends The economy grew by 4.5% in 2010, after shrinking by 1.5% in 2009, indicating that Nicaragua has recovered from
4. Economic Outlook. ASSUMPTIONS AND SCENARIOS Condition of the International Economy World economic growth is predicted. to remain strong in 2007,
 Monetary Policy Report - Quarter II-2007 4. Economic Outlook Overall, the accelerated pace of economic growth of 2007-2008 is predicted to carry forward, being accompanied by sustained macroeconomic stability.
STAFF REPORT FOR THE 2018 ARTICLE IV CONSULTATION DEBT SUSTAINABILITY ANALYSIS
 May 1, 218 BANGLADESH STAFF REPORT FOR THE 218 ARTICLE IV CONSULTATION DEBT SUSTAINABILITY ANALYSIS Approved By Kenneth Kang and Kevin Fletcher (IMF) and John Panzer (IDA) Prepared by International Monetary
ECUADOR. 1. General trends
 Economic Survey of Latin America and the Caribbean 2016 1 ECUADOR 1. General trends Ecuador ended 2015 with GDP growth of 0.3%. The slowdown that began in 2014 worsened in 2015, in an external context
Indonesia: Changing patterns of financial intermediation and their implications for central bank policy
 Indonesia: Changing patterns of financial intermediation and their implications for central bank policy Perry Warjiyo 1 Abstract As a bank-based economy, global factors affect financial intermediation
CENTRAL AFRICAN REPUBLIC
 CENTRAL AFRICAN REPUBLIC June 29, 217 SECOND REVIEW UNDER THE EXTENDED CREDIT FACILITY ARRANGEMENT, FINANCING ASSURANCES REVIEW, AND REQUEST FOR AUGMENTATION OF ACCESS DEBT SUSTAINABILITY ANALYSIS 6 Approved
Economic Projections for
 Economic Projections for 2015-2017 Article published in the Quarterly Review 2015:3, pp. 86-91 7. ECONOMIC PROJECTIONS FOR 2015-2017 Outlook for the Maltese economy 1 The Bank s latest macroeconomic projections
Ghana: Promoting Growth, Reducing Poverty
 Findings reports on ongoing operational, economic and sector work carried out by the World Bank and its member governments in the Africa Region. It is published periodically by the Africa Technical Department
PRESENTATION BY PROF. E. TUMUSIIME-MUTEBILE, GOVERNOR, BANK OF UGANDA, TO THE NRM RETREAT, KYANKWANZI, JANUARY
 BANK OF UGANDA PRESENTATION BY PROF. E. TUMUSIIME-MUTEBILE, GOVERNOR, BANK OF UGANDA, TO THE NRM RETREAT, KYANKWANZI, JANUARY 19, 2012 MACROECONOMIC MANAGEMENT IN TURBULENT TIMES Introduction I want to
KEYNOTE SPEECH Deputy Governor of Bank Indonesia, Bp. Perry Warjiyo Ph.D at BNP Paribas Economic Outlook 2016 Jakarta, 23 March 2016
 KEYNOTE SPEECH Deputy Governor of Bank Indonesia, Bp. Perry Warjiyo Ph.D at BNP Paribas Economic Outlook 2016 Jakarta, 23 March 2016 Introduction Following the success of strong macroeconomic policy adjustments
JAPANESE ECONOMY Mixed scenarios regarding corporate earnings... 1
 JAPANESE ECONOMY Mixed scenarios regarding corporate earnings... 1 US ECONOMY The U.S. economy remains steady.... 3 Second quarter current account deficits fell to $19.7 billion.... 3 EUROPEAN ECONOMY
Latest economic developments in Greece and Challenges for the Trade Finance Market
 Latest economic developments in Greece and Challenges for the Trade Finance Market Peter Sanfey Deputy Director, Country Economics and Policy, EBRD 15 September 216, Bank of Greece, Athens The Greek economy: