Transportation Theory and Applications
|
|
|
- Arthur Bryant
- 5 years ago
- Views:
Transcription
1 Fall MTAT Transportation Theory and Applications Lecture V: Modal split A. Hadachi

2 General Overview Idea After trip generation process and creating the new OD-matrix we slice it into number of matrices representing different mode of transportation Car Bus OD-Matrix Ship Train
3 objective Factors affecting mode choice Based on available data choose the right mode choice models Estimating model split direct generation models trip end models trip interchange models logit models
4 Mode choice Process by which the trips between traffic analysis zones in study area are allocated to available modes Factors affecting the choice of mode: characteristics of the trip Distance Travel time Purpose characteristics of the transportation system Time schedule Waiting time Transit time Cost characteristics of the trip maker Financial situation Trip members Vehicles available
5 Mode choice The four most common models applied are: Direct generation models Trip End models Trip Interchange Models Logit Models
6 Method 1 Direct generation model
7 Direct generation models Estimate model trips based on population density Population density Transit Assumption We assume that the systems attributes are not relevant to analysis. (e.g. travel times, cost, etc.)
8 Direct generation model Demonstration Example: Let s determine the number of transit trips per day in a specific zone which has 5000 people living on 50 acres (1 acre = 4046m 2 ). 40% no-auto household and 60% one-auto household Transit trips/day/1000 population no-auto/h 1-auto/H Person/Acre
9 Direct generation model Demonstration Example: Calculate population density = 5000/50 = 100 persons/acre Transit trips/day/1000 population no-auto/h 1-auto/H Person/Acre
10 Direct generation model Demonstration Example: Summary from figure: For no-auto household: 510 transit trips/day/ 1000 population For 1-auto household: 250 transit trips/day/ 1000 population Then total trips: (0.4*510*5)+(0.6*250*5)= 1770 transit/day
11 Method 2 Trip end model


12 Trip end model Allocating transit prior trip distribution using mode split curve. Reminder: Trip generation Trip distribution Modal split Transit Estimation Remarks: Transit estimation are based on land use (e.g. population density) Trip end model does not take into account quality of service
13 Trip end model Process: 1.Generating OD- matrix (total trip production and attractions by trip purpose) 2.Compute urban traffic factor (reflect the relationship between the auto ownership and population density ) 3.Determine % of trips using transit using mode choice curve 4.Apply auto occupancy
14 Trip end model Demonstration via example: Determine the % of residents expected to use transit for a zone with 1.8 household per auto and a residential density of persons/km 2 Urban Traffic Factor 100 Transit Mode Split (%) UTF
15 Trip end model Demonstration via example: UTF= (1/1000)*1.8*15000 = 27 Urban Traffic Factor 100 Transit Mode Split (%) % The expected % of transit mode split is ~45% UTF
16 Method 3 Trip interchange model
17 Trip interchange model This model take into account level of service variables in estimating the transit mode split. such as: Travel time Excess time (e.g. waiting time) Travel costs Financial status of trip maker
18 Trip interchange model To perform trip interchange model, we have to compute promotion of trips between zone and impedance factor using QRS method (quick response system). Formula: MS t MS a I ijx I b ijt I b ija MS auto =[ ; or, Iijt b + ] MS transit =[ Ib ija Iijt b + ] Ib ija MS t =(1 MS a ) 100 : proportion of trips between zone i and j using transit : proportion of trips between zone i and j using auto : a value referred to as the impedance of travel of mode m, between i and j, which is a measure of the total cost of the trip impedance =(travel timein vehicle,min)+[2.5(excess time, min)] + (3 trip cost income earned, min ) x : b : an exponent, which depends on trip purpose t : transit mode a : auto mode
19 Trip interchange model travel time in-vehicle is the time spent travelling in the vehicle. excess time is time spent traveling but not in the vehicle, including waiting for any mean of transportation. The impedance factor is determined for each zone pair (i,j) and it represents a measure of the expenditure required to make the trip by either auto or transit.
20 Trip interchange model Information or data needed to estimate mode choice include: Distance between zones transit fare out-of-pocket cost parking cost highway and transit speed exponent value, b median income excess time
21 Trip interchange model Example. For illustrating the application of QRS method, we assume that the data shown in the table have been developed for travel between a suburban zone S and a downtown zone D. Determine the percent of work trips by auto and transit. An exponent value of 2.0 is used for work travel. Median income is euros per year. Table: Travel data between two zones, S and D Auto Transit Distance 10km 8km Cost per km 0,15euros 0,10euros Ecess time 5 min 8 min Parking Cost 1,5euros(or 0,75/ - Speed 30km/h 20km/h

22 Trip interchange model
23 Method 4 logit model
24 logit model the idea behind this model is to consider the relative utility of each mode as a summation of each model attribute. the choice of a mode is expressed as probability distribution
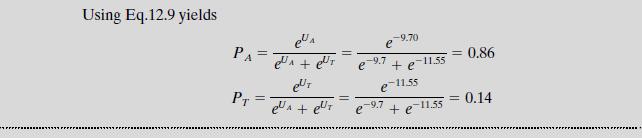
25 logit model in case of two modes: auto (A) and transit (T) are being considered, then the probability pf selecting the auto as a mean of transportation is expressed as follows: P (A) = e U A e U A + e U T Cost for mode A and T out-of-pocket cost Parking cost U x = a 1 t v ij + a 2 t w ij + a 3 t t ij + a 4 t nij + a 5 F ij + a 6 Φ j + δ Travel time in-vehicle Walking time Waiting time Fare charge Parameter for confort
26 logit model

27 logit model
Modal Split. Lecture Notes in Transportation Systems Engineering. Prof. Tom V. Mathew. 1 Overview 1. 2 Mode choice 2
 Modal Split Lecture Notes in Transportation Systems Engineering Prof. Tom V. Mathew Contents 1 Overview 1 2 Mode choice 2 3 Factors influencing the choice of mode 2 4 Types of modal split models 3 4.1
Transportation Theory and Applications
 Fall 2017 - MTAT.08.043 Transportation Theory and Applications Lecture III: Trip Generation Modelling A. Hadachi Definitions Trip or Journey: is a one-way movement from origin to destination. Home-based
P = The model satisfied the Luce s axiom of independence of irrelevant alternatives (IIA) which can be stated as
 which can be stated as") 1.4 Multinomial logit model The multinomial logit model calculates the probability of choosing mode. The multinomial logit model is of the following form and the probability of using mode I, p is given
1.4 Multinomial logit model The multinomial logit model calculates the probability of choosing mode. The multinomial logit model is of the following form and the probability of using mode I, p is given
Aggregated Binary Logit Modal-Split Model Calibration: An Evaluation for Istanbul
 Aggregated Binary Logit Modal-Split Model Calibration: An Evaluation for Istanbul H. B. Celikoglu a,1 and M. Akad a,2 a Technical University of Istanbul Dept. of Transportation, Faculty of Civil Engineering,
Modeling the Response to Parking Policy
 Modeling the Response to Parking Policy Yoram Shiftan Transportation Research Institute Dep. of Civil and Environmental Eng. Technion, Israel Institute of Technology Visiting Professor IVT, ETH IVT, June
PUBLIC TRANSPORT TRIP GENERATION PARAMETERS FOR SOUTH AFRICA
 PUBLIC TRANSPORT TRIP GENERATION PARAMETERS FOR SOUTH AFRICA P Onderwater SMEC South Africa, 2 The Cresent, Westway office park, Westville 3629, Durban Tel: 031 277 6600; Email: pieter.onderwater@smec.com
Elastic demand solution methods
 solution methods CE 392C October 6, 2016 REVIEW We ve added another consistency relationship: Route choices No vehicle left behind Link performance functions Shortest path OD matrix Travel times Demand
Drawbacks of MNL. MNL may not work well in either of the following cases due to its IIA property:
 Nested Logit Model Drawbacks of MNL MNL may not work well in either of the following cases due to its IIA property: When alternatives are not independent i.e., when there are groups of alternatives which
Logit with multiple alternatives
 Logit with multiple alternatives Matthieu de Lapparent matthieu.delapparent@epfl.ch Transport and Mobility Laboratory, School of Architecture, Civil and Environmental Engineering, Ecole Polytechnique Fédérale
Day 3. Other Word Problems. Practice: Direct Variation
 Name: Practice: Direct Variation Date: BLM 5.1.1... 1. Find the constant of variation for each direct variation. a) The cost for a long-distance telephone call varies directly with time. A 12-min phone
Transportation Economics and Decision Making. L e c t u r e - 7
 Transportation Economics and Decision Making L e c t u r e - 7 Pricing and Subsidy Policies One of the most difficult problems in transportation Congestion of motor vehicles in urbanized areas Congestion
The use of logit model for modal split estimation: a case study
 The use of logit model for modal split estimation: a case study Davor Krasić Institute for Tourism, Croatia Abstract One of the possible approaches to classifying the transport demand models is the division
TECHNICAL NOTE. 1 Purpose of This Document. 2 Basic Assessment Specification
 TECHNICAL NOTE Project MetroWest Phase 1 Modelling & Appraisal Date 23 rd July 2014 Subject MetroWest Phase 1 Wider Impacts Assessment Ref 467470.AU.02.00 Prepared by CH2MHILL 1 Purpose of This Document
Puget Sound 4K Model Version Draft Model Documentation
 Puget Sound 4K Model Version 4.0.3 Draft Model Documentation Prepared by: Puget Sound Regional Council Staff June 2015 1 Table of Contents Trip Generation 9 1.0 Introduction 9 Changes made with Puget Sound
Travel Forecasting for Corridor Alternatives Analysis
 Travel Forecasting for Corridor Alternatives Analysis Purple Line Functional Master Plan Advisory Group January 22, 2008 1 Purpose of Travel Forecasting Problem Definition Market Analysis Current Future
UNIT 1: Ratios, Rates, & Proportions
 UNIT 1: Ratios, Rates, & Proportions Review: fractions A fraction allows you to determine two quantities and their proportion to each other as part of a whole. NUMERATOR number on top (part) DENOMINATOR
Appendix C: Modeling Process
 Appendix C: Modeling Process Michiana on the Move C Figure C-1: The MACOG Hybrid Model Design Modeling Process Travel demand forecasting models (TDMs) are a major analysis tool for the development of long-range
Chapter 5. Continuous Random Variables and Probability Distributions. 5.1 Continuous Random Variables
 Chapter 5 Continuous Random Variables and Probability Distributions 5.1 Continuous Random Variables 1 2CHAPTER 5. CONTINUOUS RANDOM VARIABLES AND PROBABILITY DISTRIBUTIONS Probability Distributions Probability
CBA of transport infrastructure projects in Germany
 CBA of transport infrastructure projects in Germany Dr. Catharina Horn Federal Transport Infrastructure Planning, Investment Policy Paris, 27th of February 2014 www.bmvi.de 1. The Federal Transport Infrastructure
Phase 2 Preliminary Business Case. Appendix E Wider Impacts Report
 Phase 2 Preliminary Business Case Appendix E Wider Impacts Report July 2015 MetroWest Phase 2 MetroWest Phase 2 Preliminary (Strategic Outline) Business Case Wider Economic Impacts Prepared for West of
Satisfaction with getting to work 57% 14% 13% 9% Total distance travelled. miles per week
 Page/... Headlines All Organisations Travel to Work Survey March 0 Number of respondents Main modes of travel (%) % Satisfaction with getting to work % % % Satisfaction with getting % % (driver with others/
TSHWANE BRT: Development of a Traffic Model for the BRT Corridor Phase 1A Lines 1 and 2
 TSHWANE BRT: Development of a Traffic Model for the BRT Corridor Phase 1A Lines 1 and 2 L RETIEF, B LORIO, C CAO* and H VAN DER MERWE** TECHSO, P O Box 35, Innovation Hub, 0087 *Mouchel Group, 307-317,
Answer Young People Just Like Old People? Impacts and Consequences of Different Household Travel Survey Methods
 Answer Young People Just Like Old People? Impacts and Consequences of Different Household Travel Survey Methods Dr.-Ing. Martin Kagerbauer 7 March 2013 New Techniques and Technologies for Statistics (NTTS),
CE 561 Lecture Notes. Transportation System Performance. Set 4. -interaction between demand and supply Demand
 CE 561 Lecture Notes Set 4 Transportation System Performance -interaction between demand and supply Demand p, Price p 0 D 3 = α βp p 1 D 2 D 1 0 1, Vol. Short-run change in demand due to change in price
Practical issues with DTA
 Practical issues with DTA CE 392D PREPARING INPUT DATA What do you need to run the basic traffic assignment model? The network itself Parameters for link models (capacities, free-flow speeds, etc.) OD
Calibration of Nested-Logit Mode-Choice Models for Florida
 Final Report Calibration of Nested-Logit Mode-Choice Models for Florida By Mohamed Abdel-Aty, Ph.D., PE Associate Professor and Hassan Abdelwahab Ph.D. Candidate Department of Civil & Environmental Engineering
Interior Health Authority Board Manual 3.6 DIRECTOR RETAINERS, FEES AND EXPENSES
 1. INTRODUCTION (1) The Board of Directors (the Board ) is committed to the responsible use of public funds to support Board operations. This Policy reflects requirements of the Provincial Government,
REPORT TO THE CAPITAL REGIONAL DISTRICT BOARD MEETING OF WEDNESDAY, SEPTEMBER 8, 2010
 REPORT TO THE CAPITAL REGIONAL DISTRICT BOARD MEETING OF WEDNESDAY, SEPTEMBER 8, 2010 SUBJECT City of Victoria Request for General Strategic Priorities Funding Application Support Johnson Street Bridge
Economic Impact Analysis of the Downtown Green Line Vision Plan and Georgia Multi-modal Passenger Terminal
 Economic Impact Analysis of the Downtown Green Line Vision Plan and Georgia Multi-modal Passenger Terminal Summary Released January 2012 Prepared for Central Atlanta Progress/Atlanta Downtown Improvement
HRTPO Strategic Campaign and Vision Plan for Passenger Rail
 Presentation To HRTPO Steering Committee Agenda Item #1 HRTPO Strategic Campaign and Vision Plan for Passenger Rail Presentation By March 17, 2010 Transportation Economics & Management Systems, Inc. Study
Expense Report Guide
 UAW-GM CENTER FOR HUMAN RESOURCES Special Assigned Expense Report Guidelines Expense Report Guide ** This document can be found on the CHR Intranet Financial webpage ** Contents Chapter Page 1. Introduction
Table 7. MMUTIS Detailed Zoning System. Metro Manila (265) Adjoining Areas (51) 78 zones. Source: MMUTIS, 1996
 Adjoining Areas (51) 78 zones. Source: MMUTIS, 1996") 4. DATA ANALYSIS 4.1 Source of Data The Metro Manila Urban Transportation Integration Study (MMUTIS) has been undertaken from 1996 to 1999. A reliable and comprehensive database was established. Most of
4. DATA ANALYSIS 4.1 Source of Data The Metro Manila Urban Transportation Integration Study (MMUTIS) has been undertaken from 1996 to 1999. A reliable and comprehensive database was established. Most of
Car-Rider Segmentation According to Riding Status and Investment in Car Mobility
 Car-Rider Segmentation According to Riding Status and Investment in Car Mobility Alon Elgar and Shlomo Bekhor Population segmentations for mode choice models are investigated. Several researchers have
Transportation Economics and Decision Making. Lecture-11
 Transportation Economics and Decision Making Lecture- Multicriteria Decision Making Decision criteria can have multiple dimensions Dollars Number of crashes Acres of land, etc. All criteria are not of
Departmental Spending. Department for Transport
 Departmental Spending Day-to-day Spending (Resource DEL) DfT spends 1.2% of total Resource DEL Spending Review 2015 The SR planned overall decreases to the Resource DEL Transport Budget over the period
Arithmetic Revision Sheet Questions 1 and 2 of Paper 1
 Arithmetic Revision Sheet Questions and of Paper Basics Factors/ Divisors Numbers that divide evenly into a number. Factors of,,,, 6, Factors of 8,,, 6, 9, 8 Highest Common Factor of and 8 is 6 Multiples
Economics 312: Urban Land Economics University of Victoria Midterm Examination #2 VERSION 1 SOLUTIONS
 Spring 2017 Instructor: Martin Farnham Midterm Exam #2, Page 1 Economics 312: Urban Land Economics University of Victoria Midterm Examination #2 VERSION 1 SOLUTIONS Section 1: Multiple Choice (2 points
INVESTING STRATEGICALLY
 11 INVESTING STRATEGICALLY Federal transportation legislation (Fixing America s Surface Transportation Act FAST Act) requires that the 2040 RTP be based on a financial plan that demonstrates how the program
BAKERY vs PUBLIC GOOD
 BAKERY vs PUBLIC GOOD Clear provider/customer Competition Individual choice Flexibility, bankruptcy -- writedown of assets Technology & innovation Unclear, lumpy customer Public monopoly Complex political
Copyright 2005 Pearson Education, Inc. Slide 6-1
 Copyright 2005 Pearson Education, Inc. Slide 6-1 Chapter 6 Copyright 2005 Pearson Education, Inc. Measures of Center in a Distribution 6-A The mean is what we most commonly call the average value. It is
Public Transport Affordability and Subsidy Policies: A case study of Santiago, Chile. Andrés Gómez-Lobo Transport Forum March 28, 2007
 Public Transport Affordability and Subsidy Policies: A case study of Santiago, Chile Andrés Gómez-Lobo Transport Forum March 28, 2007 Overview Public transport in Santiago Affordability measures and their
Transportation Research Forum
 Transportation Research Forum Modeling the Relationship between Travelers Level of Satisfaction and Their Mode Choice Behavior using Ordinal Models Author(s): Mintesnot Gebeyehu and Shin-ei Takano Source:
Funding Infrastructure to Support Growth. November 2016
 Funding Infrastructure to Support Growth November 2016 Our members Infrastructure spending circa $10 billion per annum Source: Infometrics But lagging growth in residential development Value of all construction
Sec Transportation management special use permits Purpose and intent.
 Sec. 11-700 Transportation management special use permits. 11-701 Purpose and intent. There are certain uses of land which, by their location, nature, size and/or density, or by the accessory uses permitted
Washington Metropolitan Area Transit Authority Metro Budget Overview
 Washington Metropolitan Area Transit Authority Metro Budget Overview February 2011 Metro 10,877 Employees (10,974 budgeted) 1,491 Buses 588 Escalators and 237 Elevators 106 Miles of Track 92 Traction Power
I Quick Review. > A rate is a comparison of two quantities measured in different units. i
 I Quick Review > A rate is a comparison of two quantities measured in different units. i! Leo types 180 words in 3 min. 180 words in 3 min is a rate. This means Leo types 60 words in 1 min. Leo's rate
2013 Household Travel Survey: High Level Overview
 Report for: Infrastructure Services Department 2013 Household Travel Survey: High Level Overview April 14, 2014 Submitted by: Reid 200 1285 West Pender Street Vancouver BC V6E 4B1 www.ipsos.ca Contact:
Wiz. M ath. Slope - intercept Form y = mx + b. Solve and check answers. Practice Problems. 4. y = y = 3x + 7. y = x No. 3.
 Slope - intercept Form y = mx + b Determine the equation of a line with y-intercept 7 and slope. Determine the equation of the horizontal line through (, -5). Determine the equation of a line with y-intercept
UMTA & UTF: NATIONAL WORKSHOP GENERIC V/S CITY SPECIFIC UTF
 UMTA & UTF: NATIONAL WORKSHOP GENERIC V/S CITY SPECIFIC UTF Agenda POTENTIAL SOURCES OF FUNDS PRIORITIZED UTILIZATION OF FUNDS FUND MANAGEMENT DIVISION 2 Common consensus that UMTA would have its own dedicated
FUNDING TRANSPORTATION PROJECTS. Partners in Planning March 8, 2014
 FUNDING TRANSPORTATION PROJECTS Partners in Planning March 8, 2014 Overview Background what guides our decisions? Prioritization how do we decide which projects to build? Funding Sources how do we pay
DRAFT. Relationship of Asset Condition Rating to Transit System Performance. Prepared for. Transportation Research Board
 DRAFT Relationship of Asset Condition Rating to Transit System Performance Prepared for Transportation Research Board Committee for Review of the Federal Transit Administration s Transportation Economic
b) According to the statistics above the graph, the slope is What are the units and meaning of this value?
 According to the statistics above the graph, the slope is What are the units and meaning of this value?") ! Name: Date: Hr: LINEAR MODELS Writing Motion Equations 1) Answer the following questions using the position vs. time graph of a runner in a race shown below. Be sure to show all work (formula, substitution,
! Name: Date: Hr: LINEAR MODELS Writing Motion Equations 1) Answer the following questions using the position vs. time graph of a runner in a race shown below. Be sure to show all work (formula, substitution,
Note about socio-economic calculations
 Downloaded from orbit.dtu.dk on: Dec 16, 2017 Note about socio-economic calculations Landex, Alex; Andersen, Jonas Lohmann Elkjær; Salling, Kim Bang Publication date: 2006 Document Version Publisher's
SUSTAINABLE URBAN MOBILITY PLAN TRAINING WORKSHOP. Module 6 Implementation Plan
 SUSTAINABLE URBAN MOBILITY PLAN TRAINING WORKSHOP Module 6 Implementation Plan Sustainable Urban Mobility Plans: Delivery & Implementation Plans Identifying phased approach to delivery and programming
Appendix G TRAVEL DEMAND MODEL DOCUMENTATION
 Appendix G TRAVEL DEMAND MODEL DOCUMENTATION APPENDIX G - TRAVEL DEMAND MODEL DOCUMENTATION 1.0 INTRODUCTION The Memphis Urban Area MPO is developing the Direction 2040 - Long-Range Transportation Plan
Strategic Performance measures
 Strategic Performance measures 2012 RepoRt background In 2007, the RTA worked with CTA, Pace, and Metra as well as other community stakeholders to develop a Regional Transportation Strategic Plan. This
Downtown Syracuse Transportation Demand Management (TDM) Study. Syracuse Metropolitan Transportation Council
 Study. Syracuse Metropolitan Transportation Council") Downtown Syracuse Transportation Demand Management (TDM) Study Syracuse Metropolitan Transportation Council The TDM Study Product of Downtown Syracuse Parking Study (SIDA, 2008) Reduce employee parking
Downtown Syracuse Transportation Demand Management (TDM) Study Syracuse Metropolitan Transportation Council The TDM Study Product of Downtown Syracuse Parking Study (SIDA, 2008) Reduce employee parking
Chapter ! Bell Shaped
 Chapter 6 6-1 Business Statistics: A First Course 5 th Edition Chapter 7 Continuous Probability Distributions Learning Objectives In this chapter, you learn:! To compute probabilities from the normal distribution!
NATIONAL SENIOR CERTIFICATE GRADE 12
 NATIONAL SENI CERTIICATE GRAE 12 MATHEMATICAL LITERACY P2 NOVEMBER 2016 INAL MARKING GUIELINE MARKS: 150 Symbol M MA CA A C S RT/RG/R S O P R NP AO J Explanation Method Method with accuracy Consistent
ARTA 22 months on. Have we made a difference to transport in Auckland?
 ARTA 22 months on Have we made a difference to transport in Auckland? The starting point > Land Transport Management Act > Local Government (Auckland) Amendment Act > Regional Land Transport Strategy >
Revised. April Travel Policy
 Revised April 2016 Travel Policy Research Foundation for Mental Hygiene, Inc. Travel Policy The Research Foundation for Mental Hygiene, Inc. (Foundation) reimburses most, but not necessarily all, the costs
Government Policy Statement on land transport 2018 release for public engagement
 In Confidence Office of the Minister of Transport Chair, Cabinet Economic Development Committee Government Policy Statement on land transport 2018 release for public engagement Proposal 1. This paper seeks
TYNE AND WEAR CITY REGION CASE STUDY
 SUSTAINABILITY OF LAND USE AND TRANSPORT IN OUTER NEIGHBOURHOODS TYNE AND WEAR CITY REGION CASE STUDY DRAFT REPORT FOR COMMENT A. J. Hargreaves, G. Mitchell, K. Nakamura, A. Namdeo, S. D. Wright June 2009
ECONOMIC ANALYSIS. A. Introduction
 Bridge Replacement for Improved Rural Access Sector Project (RRP PNG 43200) ECONOMIC ANALYSIS A. Introduction 1. The economic analysis of the proposed project has been carried out in accordance with ADB
POLICY AND PROCEDURE STATEMENT
 POLICY AND PROCEDURE STATEMENT SUBJECT: CATEGORY: NO. Travel Allowances: Vehicle, Lodging, Meals and General Expenses Finance 411 PREAMBLE This policy sets out the basic rules that apply to travel paid
Mathematics for Work and Everyday Life, Grade 11
 Mathematics for Work and Everyday Life, Grade 11 Workplace Preparation MEL3E This course enables students to broaden their understanding of mathematics as it is applied in the workplace and daily life.
FUNDING AND FINANCE FEDERAL TRANSPORTATION PROGRAMS STATE FUNDING OPTIONS
 Minnesota Transportation Advisory Committee FUNDING AND FINANCE FEDERAL TRANSPORTATION PROGRAMS STATE FUNDING OPTIONS Jack Basso Director of Program Finance and Management American Association of State
DUBLIN CITY COUNCIL. SUPPLEMENTARY DEVELOPMENT CONTRIBUTION SCHEME (under Section 49, Planning & Development Act, 2000 as amended)
") DUBLIN CITY COUNCIL SUPPLEMENTARY DEVELOPMENT CONTRIBUTION SCHEME (under Section 49, Planning & Development Act, 2000 as amended) LUAS CROSS CITY (ST. STEPHEN S GREEN TO BROOMBRIDGE LINE) 1. Definition
DUBLIN CITY COUNCIL SUPPLEMENTARY DEVELOPMENT CONTRIBUTION SCHEME (under Section 49, Planning & Development Act, 2000 as amended) LUAS CROSS CITY (ST. STEPHEN S GREEN TO BROOMBRIDGE LINE) 1. Definition
Rail and Competition. Workshop Universität Gießen. Guido Friebel Goethe Universität Frankfurt 27 May 2010
 Rail and Competition Workshop Universität Gießen Guido Friebel Goethe Universität Frankfurt 27 May 2010 EU: Heterogeneity in freight traffic Advanced In time Delayed Freight traffic growth rates between
Planning Board Roundtable 12/3/15
 Planning Board Roundtable 12/3/15 1 Study overview Four specific topics: 1. Function and relationship of transportation funding mechanisms (LATR, TPAR, transportation impact taxes) 2. Pro-rata share concept
Coordinating Urban Land Use, Transportation Pricing & Public Policy
 Coordinating Urban Land Use, Transportation Pricing & Public Policy The 2007 CalACT Transportation Summit Transportation at the Speed of Life Martin Wachs, Director Transportation, Space, & Technology
Chapter 9. Chapters 5 8 Review, pages Analysing Graphs of Linear Relations, pages
 1. a) -7 No. Different sets of integers can have the same mean. Eample: {-, -1, 1, -,, -1} and {-, 9, -, 1,, } both have a sum of - and a mean of -7.. a decrease of 31 people per ear 3. 7 s. $7 Chapters
THE COBA 2018 USER MANUAL PART 1 ECONOMIC CONCEPTS IN COBA. Contents. Chapter. 1. The COBA Method. 2. The Do-Minimum and Do-Something Options
 THE COBA 2018 USER MANUAL PART 1 ECONOMIC CONCEPTS IN COBA Contents Chapter 1. The COBA Method 2. The Do-Minimum and Do-Something Options 3. The Fixed Trip Matrix 4. Discounting and the Price Basis 5.
Congestion Charge and Return Schemes on Modal Choice between Road and Railroad
 Congestion Charge and Return Schemes on Modal Choice between Road and Railroad Mitsunori YOSHIMURA Assistant Professor School of Engineering Nippon Bunri University 1727, Ichigi, Oita, 870-0397 Japan Fax:
Peer Agency: King County Metro
 Peer Agency: King County Metro City: Seattle, WA Fare Policy: Service Type Full Fare Reduced Fare Peak: - 1 Zone $2.75 $1.00* or $1.50** - 2 Zones $3.25 $1.00* or $1.50** Off Peak $2.50 $1.00* or $1.50**
2. Does each situation represent direct variation or partial variation? a) Lily is paid $5 per hour for raking leaves.
 Lily is paid $5 per hour for raking leaves.") MPM1D Date: Name: Relating Linear Equations, Graphs and Table of Values 1. Alan works part-time at a gas station. He earns $10/h. His pay varies directly with the time, in hours, he works. a) Choose appropriate
MPM1D Date: Name: Relating Linear Equations, Graphs and Table of Values 1. Alan works part-time at a gas station. He earns $10/h. His pay varies directly with the time, in hours, he works. a) Choose appropriate
2015 Edmonton and Region Household Travel Survey
 2015 Edmonton and Region Household Travel Survey Summary Report April 2018 Prepared by: City of Edmonton R.A. Malatest & Associates Ltd. Acknowledgements The 2015 Edmonton and Region Household Travel Survey
Chapter 32 Exercise 32.1
 Chapter Exercise. Q.. (i) x + y = x = y = y = x = y = x = (,) (,) x + y = (,) (,) 7 (ii) x + y = x = y = y = x = y = x = (,) (,) x + y = 7 (,) (,) Active Maths Strands Ch Solutions (iii) 7x y = x = y =
Grandview Heights NCP Area #4 - Stage One Transportation Study
 Grandview Heights NCP Area 4 Stage One Transportation Study August 20, 2013 Project 116925610 GRANDVIEW HEIGHTS NCP AREA 4 STAGE ONE TRANSPORTATION STUDY Table of Contents 1.0 INTRODUCTION... 1.1 1.1 STUDY
15,790. Bryan Waco Region. Do you own or lease a personal vehicle? What is your primary means of transportation?
 Bryan Waco Region 1 Houston 2 Dallas 3 Fort Worth 4 San Antonio 5 Austin 6 Laredo Pharr 7 Corpus Christi Yoakum 8 Bryan Waco 9 Atlanta Beaumont Lufkin Paris Tyler 10 Amarillo Childress Lubbock Wichita
17,321 13,351. Overall Statewide Results. How was the survey taken? Do you own or lease a personal vehicle?
 10 Overall Statewide Results 3 2 How was the survey taken? 1 Houston 2 Dallas 3 Fort Worth 4 San Antonio 5 Austin 6 Laredo / Pharr 7 Corpus Christi / Yoakum 12 11 5 4 7 8 1 9 Internet Mail Phone 35% 61%
FY 2011 Continuing Appropriations Act. TIGER Discretionary Grant Program
 FY 2011 Continuing Appropriations Act TIGER Discretionary Grant Program Highway 167 Improvement Project Appendices A Benefit Cost Analysis B Federal Wage Rate Certifications Submitted by Arkansas State
The Multinomial Logit Model Revisited: A Semiparametric Approach in Discrete Choice Analysis
 The Multinomial Logit Model Revisited: A Semiparametric Approach in Discrete Choice Analysis Dr. Baibing Li, Loughborough University Wednesday, 02 February 2011-16:00 Location: Room 610, Skempton (Civil
ONBOARD ORIGIN-DESTINATION STUDY
 REPORT ONBOARD ORIGIN-DESTINATION STUDY 12.23.2014 PREPARED FOR: ANCHORAGE METROPOLITAN AREA TRANSPORTATION SYSTEM (AMATS) 55 Railroad Row White River Junction, VT 05001 802.295.4999 www.rsginc.com SUBMITTED
The evaluation of transport public policies on commuters travels environmental consequences
 The evaluation of transport public policies on commuters travels environmental consequences 2 nd EEEN forum Stockholm, 9 th -10 th April 2013 Mihaï TIVADAR (IRSTEA), Odile HEDDEBAUT (IFSTTAR) 9th April
Draft SFMTA Strategic Plan 11/14/2011, San Francisco California
 Draft SFMTA Strategic Plan 11/14/2011, San Francisco California Agenda Development of the Strategic Plan. Draft FY2013-FY2018 Strategic Plan. o Vision. o Mission. o Goals. o Objectives with Indicators
Demand estimation of Personal Rapid Transit (PRT) using stated preference technique and binary logit models
 using stated preference technique and binary logit models") Journal of Transport Literature, 10(2), 5-9, Apr. 2016. ISSN 2238-1031 Demand estimation of Personal Rapid Transit (PRT) using stated preference technique and binary logit models Udit Jain 1,+ ; Pradip
Journal of Transport Literature, 10(2), 5-9, Apr. 2016. ISSN 2238-1031 Demand estimation of Personal Rapid Transit (PRT) using stated preference technique and binary logit models Udit Jain 1,+ ; Pradip
Wonderlic WPT-R. Wonderlic Personnel Test.
 Wonderlic WPT-R Wonderlic Personnel Test http://killexams.com/exam-detail/wpt-r Question: 177 How long will it take for Ron s $37,353 investment to double if he expects 9% returns? A. 5 years B. 8 years
Mini-Lecture 3.1 Measures of Central Tendency
 Mini-Lecture 3.1 Measures of Central Tendency Objectives 1. Determine the arithmetic mean of a variable from raw data 2. Determine the median of a variable from raw data 3. Explain what it means for a
Employee Travel Policy Updates
 Employee Travel Policy Updates Key Changes to AP 7400 August 2018 Content Covered Today Control of Travel Required Approval Summary of Reimbursable Expenses Summary of Non-Reimbursable Expenses Student
Queensland University of Technology Transport Data Analysis and Modeling Methodologies
 1 Queensland University of Technology Transport Data Analysis and Modeling Methodologies Lab Session #11 (Mixed Logit Analysis II) You are given accident, evirnomental, traffic, and roadway geometric data
Six Best Practices for Creating a Comprehensive Plan. Mitchell Silver, FAICP Memphis, TN
 Six Best Practices for Creating a Comprehensive Plan Mitchell Silver, FAICP Memphis, TN 2.1.17 1. Purpose of a comprehensive plan 2. Be clear on the problems you are solving 3. Setting the framework 4.
Public Works and Development Services
 City of Commerce Capital Improvement Program Prioritization Policy Public Works and Development Services SOP 101 Version No. 1.0 Effective 05/19/15 Purpose The City of Commerce s (City) Capital Improvement
Rocky Mountain Rail Authority (RMRA)
") Presentation To Rocky Mountain Rail Authority (RMRA) May 30, 2008 C O N F I D E N T I A L TEMS, Inc. / Quandel Consultants, LLC Study Team RMRA Steering Committee RMRA Project Manager Technical Management
Presentation To Rocky Mountain Rail Authority (RMRA) May 30, 2008 C O N F I D E N T I A L TEMS, Inc. / Quandel Consultants, LLC Study Team RMRA Steering Committee RMRA Project Manager Technical Management
Urban Transportation Planning Model Update - Phase II TASK E DEVELOP STANDARDIZED MODAL SPLIT MODELS
 Urban Transportation Planning Model Update - Phase II TASK E DEVELOP STANDARDIZED MODAL SPLIT MODELS Prepared for: The Florida Department of Transportation Prepared by: COMSIS Corporation Killearn Village
Guide to Planning Mathematics for Work and Everyday Life, Grade 11, Workplace Preparation (MEL3E)
") Guide to Planning Mathematics for Work and Everyday Life, Grade 11, Workplace Preparation (MEL3E) 2006 2007 Targeted Implementation and Planning Supports for Mathematics This is intended to provide an
Guide to Planning Mathematics for Work and Everyday Life, Grade 11, Workplace Preparation (MEL3E) 2006 2007 Targeted Implementation and Planning Supports for Mathematics This is intended to provide an
MEMORANDUM OF AGREEMENT
 MEMORANDUM OF AGREEMENT made as of the 9 th day of June 2006 BETWEEN: HER MAJESTY THE QUEEN, in right of Alberta ( Alberta ), as represented by the Minister of Infrastructure and Transportation ( Minister
Existing Conditions/Studies
 CAMPO Plan and Model Pesentation Presentation June 17, 2008 CAMPO 2035 Plan Timeline September 2008 Network/Modal Environmental Demographic Fiscal/Policy Needs Analysis Existing Conditions/Studies Vision/
Expenses are reimbursable when it is a part of an employee s job function. These expenses include:
 EXPENSES AND ALLOWANCES CFCE Policies And Procedures Page 1 PURPOSE To provide for reasonable and systematic means for properly authorizing expenses incurred while on The Center for Family and Child Enrichment
BRIDGE REHABILITATION PROGRAM WITH ROUTE CHOICE CONSIDERATION
 BRIDGE REHABILITATION PROGRAM WITH ROUTE CHOICE CONSIDERATION Ponlathep LERTWORAWANICH*, Punya CHUPANIT, Yongyuth TAESIRI, Pichit JAMNONGPIPATKUL Bureau of Road Research and Development Department of Highways