THE DISTRICT OF MUSKOKA ASSET MANAGEMENT PLAN FOR ROADS, BRIDGES, WATER AND WASTEWATER ASSETS
|
|
|
- Chastity Lang
- 5 years ago
- Views:
Transcription

1 THE DISTRICT OF MUSKOKA ASSET MANAGEMENT PLAN FOR ROADS, BRIDGES, WATER AND WASTEWATER ASSETS MAY 29, 2014
2
3 EXECUTIVE SUMMARY CONTENTS Page (i) 1. INTRODUCTION 1.1 Overview Plan Development Maintaining the Asset Management Plan Plan Integration STATE OF LOCAL INFRASTRUCTURE 2.1 Scope and Process Capital Asset Overview Asset Age Analysis Asset Condition Data Accuracy and Completeness EXPECTED LEVELS OF SERVICE 3.1 Scope and Process Current Levels of Service vs. Expected Levels of Service Level of Service Performance Measures ASSET MANAGEMENT STRATEGY 4.1 Scope and Process Risk Assessment Priority Identification Long-Term Forecast Procurement Methods FINANCING STRATEGY 5.1 Scope and Process Historical Results Financing Strategy Funding Shortfall RECOMMENDATIONS 6-1
4 APPENDICES CONTENTS Page A DETAILED ASSET INVENTORY A-1 B ASSET MANAGEMENT ASSUMPTIONS B-1 C DATA VERIFICATION AND CONDITION ASSESSMENT POLICY C-1 D SCENARIO ANALYSIS CAPITAL FORECASTS D-1 E TAX SUPPORTED ASSET MANAGEMENT STRATEGY & FINANCING STRATEGY E-1 F WATER ASSET MANAGEMENT STRATEGY & FINANCING STRATEGY F-1 G WASTEWATER ASSET MANAGEMENT STRATEGY & FINANCING STRATEGY G-1
5 EXECUTIVE SUMMARY
6
7 (i) EXECUTIVE SUMMARY This report contains the Asset Management Plan for the District of Muskoka (District) and has been organized as follows: Chapter 1: Introduction; Chapter 2: State of Local Infrastructure; Chapter 3: Expected Levels of Service; Chapter 4: Asset Management Strategy; Chapter 5: Financing Strategy; and Chapter 6: Recommendations. The state of local infrastructure chapter provides an overview of the capital assets owned by the District. This includes detailed information on the District s asset inventory, including asset attributes, accounting valuations, replacement costs, useful life, age and asset condition. This information provides the foundation for other sections of the asset management plan. Expected levels of service compares the current level of service provided by the District to the level of service determined to be expected in each area. This analysis combines both descriptions/comments as well as performance measures in establishing service levels. The asset management strategy provides a long term operating and capital forecast for asset related costs, indicating the requirements for maintaining, rehabilitating, replacing/disposing and expanding the District s assets, while moving towards the specified expected levels of service identified above. The goal of the asset management strategy is to have the District in (or moving towards) a sustainable asset management position over the forecast period. The financing strategy identifies a funding plan for the asset management strategy, including a review of historical results and recommendations with respect to the required amounts and types of funding (revenue) annually. Also, any infrastructure funding deficits/shortfalls are identified and recommendations are made regarding potential approaches to reduce and mitigate the shortfall over the forecast period. Overall, this asset management plan is a tool to be used by District staff for capital and financial decision making. It can be tied to various existing reports (such as the District s budget, official plan and strategic planning reports) to ensure the asset management plan can be updated to reflect any changes in District priorities.
8
9 1. INTRODUCTION
10
11 INTRODUCTION 1.1 Overview The main objective of an asset management plan is to use a municipality s best available information to develop a comprehensive long term plan for capital assets. In addition, the plan should provide sound methodologies and support in order to improve the accuracy of the plan on a go forward basis. (Watson) was retained by the District to prepare an asset management plan. This plan is intended to be a tool for District staff to use during various decision making processes, including the annual budgeting process and capital grant application processes. This plan will serve as a road map for sustainable infrastructure planning going forward. The following assets are included in this asset management plan: Roads; Bridges; Water assets (mains, facilities and hydrants); and Wastewater assets (mains, facilities and manholes). It is recommended that this plan be updated in the near future for other District owned capital assets. The District s goals and objectives with respect to their capital assets relate to the level of service being provided to District residents. Services should be provided at expected levels, as defined within this asset management plan. District infrastructure and other capital assets should be maintained at condition levels that provides a safe and functional environment for its residents. Therefore, the asset management plan and its implementation will be evaluated based on the District s ability to meet these goals and objectives. 1.2 Plan Development The asset management plan process developed a program that leverages the District s asset database information, staff input and asset management principles. The development of the District s asset management plan was based on the steps summarized below:
12 1) Develop a complete listing of capital assets to be included in the plan, including attributes such as size/material type, useful life, age, accounting valuation and current valuation. Update valuation to current dollars, where required, using applicable inflationary indices. 2) Assess current condition of the assets, based on a combination of existing District data/reports and an age analysis. 3) Assess the risk of asset failure for each asset, based on determining the probability of each asset failing, as well as the consequence of the asset failing. This risk analysis identifies priority projects for inclusion in the asset management plan, as well as asset risk levels that require mitigation. 4) Determine and document current levels of service, as well as expected levels of service, based on discussions with District staff. 5) Prepare an asset management strategy (i.e. operating and capital forecast) based on the asset inventory, identified priorities, forecast scenarios, and level of service analysis discussed above. 6) Determine a financing strategy to support asset management strategy, thus determining how the operating and capital related expenditure forecast would be funded over the period. 7) Prepare a comprehensive Asset Management Plan final report Maintaining the Asset Management Plan The asset management plan should be updated as the capital needs and priorities of the District change. This can be accomplished in conjunction with the District s budget process. District staff will have the tools available to perform updates to the plan when needed. When updating the asset management plan, note that the state of local infrastructure, expected levels of service, asset management strategy and financing strategy are integrated and impact each other. Looking at these components in reverse order, the financing strategy outlines how the asset management strategy will be funded. The asset management strategy illustrates the costs required to maintain expected levels of service at a sustainable level. The expected levels of service component summarizes and links each service area to specific assets contained in the state of local infrastructure section and thus determines how these assets will be used to provide expected service levels. While this report covers a forecast period of 10 years, the full lifecycle of the District s assets was considered in the calculations. It is suggested that more focus and attention be put on the first 5 years of the asset management plan, to ensure accurate capital planning in the short term.
13 Plan Integration The municipal environment is a continually changing and demanding environment when it comes to legislation and other responsibilities. Integrating the asset management plan with the District s budget process as well as Public Sector Accounting Board Section 3150 (PSAB 3150) requirements can make updates in all three areas more efficient. With respect to integrating the District s budget process with asset management planning, both require a projection of capital and operating costs of a future period. The budget outlines total operating and capital requirements of the District, while the asset management plan focuses in on specific asset related requirements. With this link to the annual budget, the budget update process can become an asset management plan update process. Both asset management and PSAB 3150 require a complete and accurate asset inventory. The significant difference between the two lies in valuation approaches; PSAB 3150 requires historical cost valuation, while asset management requires future replacement cost valuation. Using a single asset inventory containing both valuation methods is an effective approach to maintaining the District s asset data. Further integration into other District financial/planning documents would assist in ensuring the ongoing accuracy of the asset management plan, as well as the integrated financial/planning documents. The asset management plan has been developed to allow linkages to documents such as: Development Charge Background Study; Official Plan; Water and Wastewater Rate Study; Strategic Planning Reports; Fiscal Impact/Operating Studies; and Insurance valuations and records.
14
15 2. STATE OF LOCAL INFRASTRUCTURE
16
17 STATE OF LOCAL INFRASTRUCTURE 2.1 Scope and Process This section of the plan provides an opportunity to develop a greater understanding of the capital assets owned by the District. The state of local infrastructure analysis includes: An asset database documenting asset types, sub-types including quantities, materials and other similar asset attributes; Financial accounting valuation; Replacement cost valuation; Asset age distribution analysis and asset age as a proportion of expected useful life; Asset condition information; Data Verification and Asset Condition policies; and Documentation of assumptions made in creating the asset inventory. The District has a detailed inventory listing, created for both capital planning and PSAB 3150 purposes. This asset inventory is updated annually and was used as a starting point in fulfilling the requirements of this report. This inventory provides current financial account valuations (i.e. historical cost, accumulated amortization and net book value) as well as attributes such as useful life, age, and replacement cost. Additional discussions with District staff were used to supplement the District s asset inventory during this process. 2.2 Capital Asset Overview The District presently owns and manages road and bridge assets with a 2013 replacement value of approximately $1.17 billion (excluding land assets). Table 2-1 outlines the breakdown of these totals and Figure 2-1 illustrates the breakdown.

18 2-2 Table Tax Supported Assets Roads and Bridges Asset Type Replacement Cost 2013$ Road Sub Surface 417,789,087 Road Surface 626,683,630 Bridges - Structure 85,991,452 Bridges - Deck 36,853,479 Total Road/Bridge Assets $ 1,167,317,648 Asset Type Historical Cost 12/31/2012 Accumulated Amortization 12/31/2012 Net Book Value 12/31/2012 Road Sub Surface 64,130,121 24,149,969 39,980,151 Road Surface 99,273,681 52,950,354 46,323,328 Bridges - Structure 32,774,795 10,491,420 22,283,375 Bridges - Deck 13,882,146 10,117,029 3,765,117 Total Road/Bridge Assets $ 210,060,743 $ 97,708,772 $ 112,351,971 Figure Tax Supported Assets Distribution Roads and Bridges Based on Replacement Cost 7% 3% 36% Road Base Road Surface Bridge Structure Bridge Deck 54% The District presently owns and manages water assets with a 2013 replacement value of approximately $484.7 million (excluding equipment, vehicles, land improvements and land assets). Table 2-2 outlines the breakdown of these totals and Figure 2-2 illustrates the breakdown.

19 2-3 Table Water Assets Asset Type Replacement Cost 2013$ Water Treatment Plants 127,649,187 Water Booster Stations 3,584,482 Reservoir Boosters 23,742,913 Elevated Towers 12,733,462 Watermains 302,241,672 Water Hydrants 14,795,876 Total Water Assets $ 484,747,591 Asset Type Historical Cost 12/31/2012 Structures 62,718,882 14,338,411 48,380,471 Fire Hydrants 3,410,677 1,588,521 1,822,155 Valves 3,089,353 1,783,695 1,305,658 Meters 734, ,092 9,219 Water Service 7,264,301 1,910,229 5,354,071 Watermains 89,529,462 31,329,597 58,199,865 Pump Stn Large 6,626,199 3,144,755 3,481,445 Pump Stn Small 889, ,839 0 Total Water Assets $ 174,263,023 $ 55,710,138 $ 118,552,885 * excluding land, site improvements and equipment Figure Water Assets Distribution Based on Replacement Cost 3% Accumulated Amortization 12/31/2012 Net Book Value 12/31/ % Water Treatment Plants 62% 1% 5% 3% Water Booster Stations Reservoir Boosters Elevated Towers Watermains Water Hydrants

20 The District presently owns and manages wastewater assets with a 2013 replacement value of approximately $613.6 million (excluding equipment, vehicles, land improvements and land assets). Table 2-3 outlines the breakdown of these totals and Figure 2-3 illustrates the breakdown. 2-4 Table Wastewater Assets Asset Type Replacement Cost 2013$ Wastewater Treatment Plants 208,763,255 Sewer Pumping Stations 81,697,281 Sanitary Sewers 292,638,140 Sanitary Maintenance Holes 30,480,257 Total Wastewater Assets $ 613,578,934 Asset Type Historical Cost 12/31/2012 Accumulated Amortization 12/31/2012 Net Book Value 12/31/2012 Structures 81,586,069 15,626,558 65,959,510 Sewer mains 76,558,807 25,347,212 51,211,595 Pump Stn Sm 15,153,973 13,208,213 1,945,760 Pump Stn Lg 18,484,901 10,174,473 8,310,428 Sewer Laterals 6,021,041 1,821,258 4,199,783 Manholes 7,871,907 3,800,199 4,071,709 Total Wastewater Assets $ 205,676,698 $ 69,977,913 $ 135,698,785 * excluding land, site improvements and equipment Figure Wastewater Assets Distribution Based on Replacement Cost 5% 34% 48% Wastewater Treatment Plants Sewer Pumping Stations Sanitary Sewers Sanitary Maintenance Holes 13%
21 2-5 Tables 2-1, 2-2 and 2-3 also shows the District s financial accounting valuation summary by asset type. Since 2009, the District has been required under PSAB 3150 to maintain asset listings complete with historical cost (i.e. the original cost to purchase or construct an asset), accumulated amortization and net book value. These values are reported on the District s audited financial statements each year. The detailed capital asset inventory is contained in Appendix A. Assumptions pertaining to the asset inventory were documented as part of the asset management process and are shown in Appendix B. 2.3 Asset Age Analysis Each asset is tracked based on estimated total useful life and remaining service life. Using this information, an age analysis of the District s assets can assist in identifying potential areas of focus for the asset management plan. Table 2-4 provides an age analysis summary, including the weighted average useful life and weighted average remaining useful life (based on replacement cost) for all of the assets included in this plan. This analysis can assist in identifying potential short-term priorities within specific asset areas. Tax Supported Assets Table 2-4 Asset Age Analysis Weighted Average (rounded) Asset Type Useful Life Remaining Useful Life % Useful Life Remaining Road Sub Surface % Road Surface % Bridges - Structure % Bridges - Deck %
22 2-6 Water Assets Asset Type Useful Life Remaining Useful Life % Useful Life Remaining Water Treatment Plants % Water Booster Stations % Reservoir Boosters % Elevated Towers % Watermains % Water Hydrants % Wastewater Assets Weighted Average (rounded) Asset Type Weighted Average (rounded) Useful Life Remaining Useful Life % Useful Life Remaining Wastewater Treatment Plants % Sewer Pumping Stations % Sanitary Sewers % Sanitary Maintenance Holes % Total useful life and remaining service life for each capital asset is documented in Appendix A. While this analysis can be useful in looking at the overall age characteristics of specific asset areas, asset condition (see below) will assist in providing a more accurate assessment of assets reaching the end of their useful life. 2.4 Asset Condition Including condition assessments in the asset management plan provides for a higher level of accuracy than simply relying on useful life assumptions, especially when it comes to older, highly used or more financially significant assets. Condition assessments can provide more realistic estimates of remaining service life, which can then be used to establish rehabilitation or replacement schedules. Condition ratings were derived from a combination of data provided by staff and an asset age analysis (which involves estimating an asset s condition based on a comparison of age to useful life). Ratings range as follows:
23 2-7 Condition Rating (Age Based) Condition 1 Very Poor 2 Poor 3 Average 4 Good 5 Very Good A high level summary of the weighted average condition in each asset category is as follows: Table 2-5 Weighted Average Condition by Asset Category Tax Supported Assets Asset Type Asset Condition Road Sub Surface 3 Road Surface 3 Bridges - Structure 2 Bridges - Deck 1 Water Assets Asset Type Asset Condition Water Treatment Plants 3 Water Booster Stations 2 Reservoir Boosters 4 Elevated Towers 3 Watermains 3 Water Hydrants 5 Wastewater Assets Asset Type Asset Condition Wastewater Treatment Plants 3 Sewer Pumping Stations 2 Sanitary Sewers 3 Sanitary Maintenance Holes 3
24 Further discussion of condition assessments will take place in Chapter 4 when assessing asset risk and identifying asset priorities. Furthermore, detailed asset conditions are documented in Appendix A to this report. It is recommended that these condition assessments be updated as new information becomes available. Please see section 2.5 for further details. 2.5 Data Accuracy and Completeness 2-8 An important element of this asset management plan is ensuring that tools and procedures are in place to maintain accuracy and completeness of the asset data and calculations moving forward. As time passes, assets are used, maintained, improved, disposed of, and replaced. All of these lifecycle events can trigger changes to the asset database used within the asset management plan. Therefore, tools and procedures are essential to ensure the asset data remains accurate and complete. Please refer to Appendix C to this report for the Data Verification and Condition Assessment Policy for the District. This policy illustrates how the asset data will be updated and verified going forward. This includes the timing of condition assessments for each asset area, as well as what should be included within the condition assessment procedures.
25 3. EXPECTED LEVELS OF SERVICE
26
27 EXPECTED LEVELS OF SERVICE 3.1 Scope and Process A level of service (LOS) analysis, as required under the Provincial asset management guideline, gives the District an opportunity to document the level of service that is currently being provided and compare it to the level of service that is expected. This can be done through a review of current practices and procedures, an examination of trends or issues facing the District, or through an analysis of performance measures and targets that staff can use to measure performance. Expected LOS can be impacted by a number of factors, including: Legislative requirements; Strategic planning goals and objectives; Resident expectations; Council expectations; Staff expectations (based on professional knowledge and experience); and Financial or resource constraints. The previous task of determining the state of the District s local infrastructure establishes the asset inventory and condition, as well as asset management policies and principles to guide the refinement and upkeep of asset infrastructure. The LOS analysis will utilize this information and factor in the impact of asset service level targets. It is important to document an expected LOS that is realistic to the District. It is common to strive for the highest LOS, however these service levels usually come at a cost. It is also helpful to consider the risk associated with a certain LOS. Therefore, expected LOS should be determined in a way that balances both level of investment and associated risk to the District. 3.2 Current Levels of Service versus Expected Levels of Service The District s current LOS has resulted in the current state of infrastructure discussed in chapter 2. The current LOS also relates to the risk assessment discussed in later report sections. Regarding the cost of current LOS, the District has established an operating and capital budget for the current year that includes the cost of providing this LOS to residents. Therefore in moving from the current LOS to an expected LOS, consideration has to be made for the associated cost (or impact on the District s current budget). The table below outlines broad LOS descriptions (both current and expected LOS). This analysis was documented through discussions with District staff.
28 As a starting point for the District asset management plan, the District did not include an increased level of service. Further refinement to the plan will follow incorporating modified risk assessments, impact of betterments, enhanced condition analysis and modified useful lives and level of service analysis. 3-2 Roads Department Transportation Table 3-1 Level of Service Analysis Level of Service Description Current Meets and/or Exceeds "Minimum Maintenance Standards" as defined by Ontario Regulation Same 239/02. Expected Transportation Track, resolve and minimize complaints Same Transportation Proactive maintenance and capital programs. Same Transportation Road inspection and weather monitoring daily. Same Transportation Crack sealing, grade all ditching and mechanical brushing programs. Same Transportation Catch basin cleaning and rehabilitation program. Same Transportation Maintain Surface Adequacy requirements. Same Transportation Guide rail installation program. Same Bridges & Culverts Level of Service Description Department Current Transportation Major culvert installation and/or repair program. Same Expected Transportation Annual bridge washing program. Same Transportation Bi-annual Bridge inspections. Same Transportation GPS location identification for all culverts and catch basins. Same Transportation Maintain adequate condition and load limits. Same
29 3-3 Water Department Water Level of Service Description Current Meets and/or exceeds all regulatory Same requirements. Expected Water Implementing maintenance programs Same Water Ensure Water Supply Bylaws are followed Same Water Collect and map all municipal water works Same Water Water main replacement program Same Water Meter replacement program Same Water Undertake water infrastructure system audits Same Water Track, resolve and minimize complaints (water quality, pressure, supply, etc.) Same Wastewater Department Wastewater Current Level of Service Description Meets and/or exceeds all regulatory requirements Same Expected Wastewater Implementing maintenance programs (flushing, video inspections, etc.) Same Wastewater Ensure wastewater bylaws are followed Same Wastewater Collect and map all municipal wastewater works Same Wastewater Conduct Inflow/ Infiltration studies Same Wastewater Wastewater Wastewater Replacement and/or rehabilitation sewer mains and laterals program Undertake wastewater infrastructure system condition audits Track, resolve and minimize complaints (sewer backups, flooded basements, etc.) Same Same Same 3.3 Level of Service Performance Measures As mentioned above, using performance measures in the LOS review can also be helpful in measuring the District s goals and objectives when it comes to asset management. The District currently tracks specific performance measures as part of the Municipal Performance Measurement Program (MPMP) which the province has in place as part of the annual Financial Information Return (FIR) submission. The FIR provides the annual financial results of the District, while the MPMP provides an evaluation of the District s performance. The following table provides a summary of the specific MPMPs relating to capital asset effectiveness.
30 3-4 Table 3-2 Performance Measures Analysis Department Assets Performance Measure Description Historical Performance Goal Transportation Roads Percentage of paved lane km where condition is rated as good to very good 41.40% 50.00% Not yet available Maximize Transportation Bridges & Culverts Percentage of bridges & culverts where condition is rated as good to very good 74.60% 63.90% Not yet available Maximize Transportation Roads Percentage of winter events where response met or exceeded local service levels % % Not yet available Maximize Wastewater Wastewater Mains Number of wastewater main backups per 100 km of mains Not yet available Minimize Wastewater Buildings Percentage of wastewater estimated to have by-passed treatment 0.00% 0.00% Not yet available Minimize Water Water mains Weighted # days when a boil water advisory was issued - - Not yet available Minimize Water Water mains Number of water main breaks per 100 km of pipe Not yet available Minimize The District will continue to calculate and monitor these performance measures, both for MPMP and asset management purposes. As the District s asset management plan evolves over time, new performance measures can be introduced to further measure the LOS being provided in each service area.
31 4. ASSET MANAGEMENT STRATEGY
32
33 ASSET MANAGEMENT STRATEGY 4.1 Scope and Process The asset management strategy provides the recommended course of actions required to maintain (or move towards) a sustainable asset funding position while delivering the expected levels of service discussed in the previous chapter. The course of actions, when combined together, form a long-term operating and capital forecast that includes: a) Non-infrastructure solutions: reduce costs and/or extend expected useful life estimates; b) Maintenance activities: regularly scheduled activities to maintain existing useful life levels, or repairs needed due to unplanned events; c) Renewal/Rehabilitation: significant repairs or maintenance planned to increase the useful life of assets; d) Replacement/Disposal: complete disposal and replacement of assets, when renewal or rehabilitation is no longer an option; and e) Expansion: given planned growth as outlined in the District s Development Charge Background Study, other expansion or due to the introduction of new services. Priority identification becomes a critical process during the asset management strategy development. Priorities have been determined based on assessment of the overall risk of asset failure, which is determined by looking at both the probability of an asset failing, as well as the consequences of failure. The consequences of the District not meeting desired levels of service must also be considered in determining risk. As discussed in chapter 3, moving to expected levels of service results in both operating and capital budget impacts over the 10 year forecast period. This has to be taken into consideration, with the overall objective of reaching sustainable levels while mitigating risk. 4.2 Risk Assessment The risk of an asset failing is defined by the following calculation: Risk of Asset Failure = Probability of Failure X Consequence of Failure Probability of failure has been linked to the condition assessment for each of the assets, assuming that an asset with a condition rating of 5 would have a rare probability of failure. The following table outlines the probability factor tied to each condition rating:
34 4-2 Table 4-1 Probability of Failure Matrix Probability of Condition Rating Failure 5 Rare 4 Unlikely 3 Possible 2 Likely 1 Almost Certain Consequence of failure has been determined by examining each asset type separately. Consequence refers to the impact on the District if a particular asset were to fail. Types of impacts include the following: Cost Impacts: the cost of failure to the District (i.e. capital replacement, rehabilitation, fines & penalties, damages, etc); Social impacts: potential injury or death to residents or District staff; Environmental impacts: the impact of the asset failure on the environment; Service delivery impacts: the impact of the asset failure on the District s ability to provide services at desired levels; and Location impacts: the varying impact of asset failure based on the asset s location within the District. Each type of consequence was discussed with District staff. Consequence of failure was determined by using the information contained in Table 4-2 for each asset type with the exception of roads and bridges, where considerations were based on traffic counts (AADT). Levels of impact were documented based on a rating ranging from significant to insignificant. With both probability of failure and consequence of failure documented, total risk of asset failure was determined using the matrix contained in Table 4-3. Total risk has been classified under the following categories: Extreme Risk (E): risk well beyond acceptable levels; High Risk (H): risk beyond acceptable levels; Medium Risk (M): risk at acceptable levels, monitoring required to ensure risk does not become high; and Low Risk (L): risk at or below acceptable levels.
35 4-3 Table 4-2 Consequence of Failure Matrix Consequence of Failure Cost Social Environmental Service Delivery Insignificant Negligible or Insignificant Cost No injury No Impact No Interruptions Minor Small/Minor Cost - within Budget Allocations Minor Injury Short-term/Minor Impact - Fixable Minor Interruptions Moderate Considerable Cost - Requires Revisions to Budget Moderate Injury Medium-term Impact - Fixable Moderate Interruptions Major Substantial Cost - Multiyear Budget Impacts Major Injury Long-term Impact - Fixable Significant Interruptions Significant Significant Cost - Difficult to Recover Death, Serious Injury Long-term Impact - Permanent Major Interruptions Table 4-3 Total Risk of Asset Failure Matrix Probability of Failure Consequence of Failure Insignificant Minor Moderate Major Significant Rare L L M M H Unlikely L M M M H Possible L M M H E Likely M M H H E Almost Certain M H H E E Risk levels can be reduced or mitigated through planned maintenance, rehabilitation and/or replacement. An objective of this asset management plan is to reduce risk levels where they are deemed to be too high, as well as ensure assets are maintained in a way that maintains risk at acceptable levels. Please refer to Appendix A for the detailed risk assessment for each of the District s capital assets. It is recommended that this risk assessment be refined further by District staff in the future. 4.3 Priority Identification Through discussions with District staff and review of the asset risk of failure assessment, the following assets/categories were identified as being priorities of the District:
36 4-4 Table 4-4 Priorities Based on Asset Risk Area / Category Description Total Risk Planned Action Roads MR 4 from Shea Rd to MR25 High Roads Roads Roads Roads Roads Bridges Bridges Bridges MR 2 from MR 10 to Riverside School (4.3km) MR 117 from Paint Lk Bridge to Hwy 35 (2.4km) MR 17 from Oakwood Dr to Brydons Bay Rd (2.2km) MR 17 from Ennis Bay Rd to MR 118 (4.5km) MR 117 from Stoneleigh Rd W to Hwy 11 (4.5km) MR 118 Structural Repairs Indian River Bridge MR 169 Rehab CPR Overhead Bridge # MR 169 Rehab CPR Overhead Bridge # High High High High High High High High Wastewater HV Hidden Valley High Wastewater BB Beaumont Dr SPS Controls High Wastewater Wastewater Water Water HV Hodges Lane SPS Expansion HV Twin Hodges PS Forcemain GH Walton from Muskoka Beach to Lofty Pines HV Hideen Valley Area WM Replacement High High High High Water BB Valley Drive High Water MT WTP Modifications High Water BALA WTP Modification Phase III High Included in short-term capital Included in short-term capital Included in short-term capital Included in short-term capital Included in short-term capital Included in short-term capital Included in short-term capital Included in short-term capital Included in short-term capital Included in short-term capital Included in short-term capital Included in short-term capital Included in short-term capital Included in short-term capital Included in short-term capital Included in short-term capital Included in short-term capital Included in short-term capital 4.4 Long-term Forecast For many years, lifecycle costing has been used in the field of maintenance engineering and to evaluate the advantages of using alternative materials in construction or production design. The method has gained wider acceptance and use recently in the management of capital assets. By definition, lifecycle costs are all the costs which are incurred during the lifecycle of a capital asset,
37 from the time it is purchased or constructed, to the time it is taken out of service for disposal. The stages which an asset goes through in its lifecycle are as follows: Figure 4-1 Asset Lifecycle Diagram 4-5 In defining the long-term forecast for the District s asset management strategy, costs incurred through an asset s lifecycle were considered and documented. Asset Replacement Analysis In forecasting the District s asset replacement needs, comparisons were made between the following scenarios: Scenario 1: Replacement forecast based on PSAB 3150 Data o Utilizing the PSAB 3150 inventory, year of installation and estimated service life, the replacement of each asset was projected. Scenario 2: Replacement forecast based on Staff Forecast ; o District staff provided a capital forecast for which identified priorities were taken into account. Scenario 3: Replacement forecast based on Staff Forecast (Revised) ; o In addition to using the staff developed capital forecast, additional suggested works were added based on moving towards sustainable capital investment levels (using available asset characteristics). Results were smoothed over the forecast period.
38 Scenario 1: Capital forecast based on PSAB 3150 Data The replacement forecast based on the PSAB 3150 asset data provides a snapshot of assets at or nearing the end of their useful lives from a purely financial accounting perspective. 4-6 Figures 4-2 to 4-4 below show the forecasts over a 10 year period, where approximately $500.6 million (replacement cost) in roads and bridges capital assets, $49.9 million in water capital assets and $142.2 million in wastewater capital assets are showing as immediate needs. For this scenario, this simply means that these assets have reached the end of their accounting useful lives. Please refer to Appendix D for charts and graphs depicting the 10 year forecast for this scenario. Figure Year Forecast (Inflated) 600,000,000 Tax Supported Assets Roads and Bridges Scenario 1 Based on PSAB 3150 Data Future Replacement Cost (Inflated) 500,000, ,000, ,000, ,000, ,000,000 0 Year of Replacement Roads Bridges
39 4-7 Figure Year Forecast (Inflated) Future Replacement Cost (Inflated) 60,000,000 50,000,000 40,000,000 30,000,000 20,000,000 10,000,000 0 Water Assets Scenario 1 Based on PSAB 3150 Data Year of Replacement Water Treatment Plants Water Booster Stations Reservoir Boosters Elevated Towers Watermains Water Hydrants Figure Year Forecast (Inflated) Future Replacement Cost (Inflated) 160,000, ,000, ,000, ,000,000 80,000,000 60,000,000 40,000,000 20,000,000 0 Wastewater Assets Scenario 1 Based on PSAB 3150 Data Year of Replacement Wastewater Treatment Plants Sewer Pumping Stations Sanitary Sewers Sanitary Maintenance Holes Scenario 2: Capital forecast based on Staff Forecast District staff provided a capital forecast for which identified priorities were taken into account. Some capital needs that had been identified under the previous scenario have been distributed within the forecast period (as well as beyond the forecast period). Figures 4-5 to 4-7 show the 10 year forecast under this scenario. Please refer to Appendix D for charts and graphs depicting the
40 10 year forecast for this scenario. A total of $202.5 million in roads and bridges capital, $40.2 million in water capital and $88.5 million in wastewater capital needs are identified over the 10 year forecast period. While this scenario is feasible and represents the current approved forecast of the District, additional capital needs above and beyond these levels are suggested to move towards sustainable capital investment levels. 4-8 Figure Year Forecast (Inflated) Future Replacement Cost (Inflated) 30,000,000 25,000,000 20,000,000 15,000,000 10,000,000 5,000,000 0 Tax Supported Assets Roads and Bridges Scenario 2 Based on Staff Forecast Year of Replacement Staff Forecast Future Replacement Cost (Inflated) 8,000,000 7,000,000 6,000,000 5,000,000 4,000,000 3,000,000 2,000,000 1,000,000 0 Figure Year Forecast (Inflated) Water Assets Scenario 2 Based on Staff Forecast Year of Replacement Staff Forecast
41 4-9 Figure Year Forecast (Inflated) Future Replacement Cost (Inflated) 16,000,000 14,000,000 12,000,000 10,000,000 8,000,000 6,000,000 4,000,000 2,000,000 0 Wastewater Assets Scenario 2 Based on Staff Forecast Year of Replacement Staff Forecast Scenario 3: Capital forecast based on Staff Forecast (Revised) In addition to the staff forecast provided under Scenario 2, additional capital works have been added in creating Scenario 3. In determining capital needs under this scenario, consideration was made with respect to changes in asset useful life that were used in developing scenario 1 (which was based on PSAB 3150 useful life estimates). Figures 4-8 to 4-10 show the 10 year forecasts under this scenario. A total of $252.7 million in roads and bridges capital, $85.3 million in water capital and $139.3 million in wastewater capital replacement needs are identified over the 10 year forecast period. As the additional capital needs calculated within this scenario are based on the existing District asset data, it is suggested that this asset data be reviewed and refined as needed by staff in order to make this scenario more accurate for capital budgeting purposes. Please refer to Appendix D for charts and graphs depicting the 10 year forecast for this scenario. Maintenance, Non-Infrastructure Solutions, Renewal & Rehabilitation For scenarios 2 and 3 to be feasible, the level of service levels discussed in Chapter 3 are required in order to effectively maintain and rehabilitate the assets as needed. The financing strategy discussed in the next Chapter will incorporate the level of service adjustments into the recommended financing analysis. In addition, expansion related needs will be layered into the forecast to determine total capital needs for each year.
42 4-10 Future Replacement Cost (Inflated) 35,000,000 30,000,000 25,000,000 20,000,000 15,000,000 10,000,000 5,000,000 0 Figure Year Forecast Tax Supported Assets Roads and Bridges Scenario 3 Based on Staff Forecast (Revised) Staff Forecast Year of Replacement Additional Recommended Figure Year Forecast Water Assets Scenario 3 Based on Staff Forecast (Revised) Future Replacement Cost (Inflated) 14,000,000 12,000,000 10,000,000 8,000,000 6,000,000 4,000,000 2,000,000 0 Staff Forecast Year of Replacement Additional Recommended
43 4-11 Figure Year Forecast Wastewater Assets Scenario 3 Based on Staff Forecast (Revised) Future Replacement Cost (Inflated) 18,000,000 16,000,000 14,000,000 12,000,000 10,000,000 8,000,000 6,000,000 4,000,000 2,000,000 0 Staff Forecast Year of Replacement Additional Recommended 4.5 Procurement Methods Section 270(1) of the Municipal Act, S.O. 2001, provides that municipalities (and local boards) shall adopt and maintain policies with respect to its procurement of goods and services. Procurement policies are developed to provide a framework to support open, fair, transparent and accountable purchasing processes, and to ensure procurement processes are consistently managed. Moreover, the establishment of a by-law adopting the procurement policy provides a document which has the approval of Council, which allows an opportunity for public debate. An effective procurement policy assists municipalities in identifying cost-effective options for providing services, while at the same time reducing risk. Innovative project management models such as co-operative purchasing can help bring together expertise, resources and funding opportunities. Where appropriate, bidders can be required to provide lifecycle costing for the products and/or services being tendered. Lifecycle costs can include initial construction/purchase price, plus operating costs for a contracted period of time. Incorporating a lifecycle perspective in the procurement process can encourage effective asset management in the time period following the initial capital investment. The District currently has a procurement by-law and policy in place that includes: Identification of the criteria used to determine the type of competitive process to be followed (i.e. tender, RFP, RFQ); Identification of circumstances when Sole Sourcing, Negotiation, and/or In-House Bids can be used;
44 Description of the methods to be used for advertising a competitive process; Providing direction for purchasing in cases of emergency; Providing direction for purchasing as part of a co-operative purchasing group; Outlining any requirements related to bid deposits or other financial security; 4-12 Inclusion of a non-discrimination clause highlighting positions such as having a no local preference policy; Notification that any bid can be rejected by the District; Identification of reasons for terminating a contract with a supplier/contractor (i.e. poor performance, unethical behaviour); Identification of restrictions on the types and/or amounts of damages to which bidders may be entitled, arising from their responding to a competitive process; and Requirement for bidders to supply proof of insurance and WSIB. As part of the continuous asset management update process, it is recommended that the District s procurement policies and procedures be reviewed and compared against procurement best practices to ensure resources are being allocated in an efficient manner.
45 5. FINANCING STRATEGY
46
47 FINANCING STRATEGY 5.1 Scope and Process The financing strategy outlines the suggested financial approach to funding the recommended asset management strategy outlined in Chapter 4, while utilizing the District s existing budget structure. This section of the asset management plan includes: Annual expenditure forecasts broken down by: o Maintenance/non-infrastructure solutions; o Renewal/rehabilitation activities; o Replacement/disposal activities; and o Expansion activities. Actual expenditures in the above named categories for 2012 and budget expenditures for 2013 and 2014; A breakdown of annual funding/revenue by source; Identification of the funding shortfall, including how the impact will be managed; and All key assumptions are documented within Appendix B. The long-term financing strategy forecast (including both expenditure and revenue sources) was prepared, consistent with the District s departmental budget structure, so that it can be used in conjunction with the annual budget process. Various financing options, including taxation, reserves, reserve funds, debt, user fees and grants were considered and discussed with District staff during the process. Figure 5-1 provides a visual representation of how various financing methods can be used for both initial asset purchases, as well as asset replacements. For asset management strategy scenarios 2 and 3, a detailed ten (10) year plan was generated. The plan identifies specific maintenance & non-infrastructure solutions, renewal & rehabilitation, replacement & disposal, and expansion activities required for the 10 year forecast period as described in Chapter 4.
48 5-2 New Assets Figure 5-1 Financing Methods of Lifecycle Costs Financing Methods Replacement Assets Purchase Install Commission Development Charges (Growth) Reserves/Reserve Funds Debentures Taxation User Fees Grants Other Purchase Install Commission Operate Maintain Monitor (Throughout Life of Assets) (To End of Useful Life) Tax Supported Operating Budget User Fees Operating Budget Operate Maintain Monitor (Throughout Life of Assets) (To End of Useful Life) Removal / Decommission Disposal Proceeds on Disposal Funding of Disposal / Decommissioning Costs Removal / Decommission Disposal 5.2 Historical Results Table 5-1 outlines the historical roads and bridges, water and wastewater maintenance/noninfrastructure costs for 2012, as well as 2013 and 2014 budgeted results. All maintenance for assets was funded through taxation revenue for roads and bridges assets, water rates for water related assets and wastewater rates for wastewater related assets based on the District s budget structure.
49 5-3 Table 5-1 Historical Results Maintenance & Non-Infrastructure Solutions Tax Supported - Roads and Bridges Description Actual 2012 Budget 2013 Budget 2014 Asset Maintenance 5,683,815 6,281,000 6,331,466 Taxation Funding 5,683,815 6,281,000 6,331,466 Net Unfunded Water Description Actual 2012 Budget 2013 Budget 2014 Asset Maintenance 3,878,832 4,174,529 4,102,530 Water Rate Revenue 3,878,832 4,174,529 4,102,530 Net Unfunded Wastewater Description Actual 2012 Budget 2013 Budget 2014 Asset Maintenance 4,635,008 4,864,630 4,912,330 Wastewater Rate Revenue 4,635,008 4,864,630 4,912,330 Net Unfunded Tables 5-2 to 5-4 outline the historical capital results for 2012 and budgeted capital results for 2013 and 2014 including renewal/rehabilitation, replacement/disposal, and expansion. The capital funding includes the use of development charges for growth (expansion) related costs, reserve/reserve funds, gas tax funds, area municipal contributions, sale of asset funds, as well as grants.
50 5-4 Table 5-2 Tax Supported Historical Results Renewal/Rehabilitation, Replacement/Disposal & Expansion Description Actual 2012 Budget 2013 Budget 2014 Capital Expenses Roads - Tangible Capital Assets 12,206,387 15,478,000 16,243,000 Roads - Non Tangilble Capital Assets 565, ,056 - Total Capital Expenditures 12,771,429 15,994,056 16,243,000 Capital Financing Provincial/Federal Grants Reserve Fund: Development Charges (Roads) 1,374,016 1,672,930 1,693,280 DC Shortfall - Taken from Roads Reserve 641, Reserve Fund : Gas Tax Reserve/Reserve Funds: Roads 10,631,190 14,272,126 14,451,720 Other (Area Municipal Contributions) 330,135 49,000 98,000 Gain/(Loss) on Sale 2, Total Capital Financing 12,978,990 15,994,056 16,243,000 Total Capital Expenditures less Capital Financing (207,561) - - Table 5-3 Water Historical Results Renewal/Rehabilitation, Replacement/Disposal & Expansion Description Actual 2012 Budget 2013 Budget 2014 Capital Expenses Water - Tangible Capital Assets 3,487,538 2,940,000 3,585,000 Water - Non Tangible Capital Assets 43, ,000 - Total Capital Expenditures 3,531,416 3,310,000 3,585,000 Capital Financing Provincial/Federal Grants Reserve Fund: Development Charges (All) 8, ,000 - DC Shortfall 34, Reserve Fund : Gas Tax 1,273, Reserves/Reserve Funds: Water Capital 1,668,920 2,362,000 2,031,000 Reserves/Reserve Funds: Corporate 7, Reserves/Reserve Funds: Sustainable Infrastructure - - 1,170,000 Other (Area Municipal Contributions) 838, , ,000 Total Capital Financing 3,831,560 3,310,000 3,585,000 Total Capital Expenditures less Capital Financing (300,144) - -
51 5-5 Table 5-4 Wastewater Historical Results Renewal/Rehabilitation, Replacement/Disposal & Expansion Description Actual 2012 Budget 2013 Budget 2014 Capital Expenses Wastewater - Tangible Capital Assets 2,443,521 7,135,000 7,520,000 Wastewater - Non Tangible Capital Assets 236, ,000 Total Capital Expenditures 2,679,644 7,860,000 7,520,000 Capital Financing Provincial/Federal Grants 257, Reserve Fund: Development Charges (All) 491,932 2,428, ,000 Reserve Fund : Gas Tax 160, Reserves/Reserve Funds: Wastewater Capital 1,765,199 1,948,500 4,325,600 Reserves/Reserve Funds: Environmental (330,272) 3,453, ,000 Reserves/Reserve Funds: Sustainable Infrastructure ,000 Other (Area Municipal Contributions) - 30, ,000 Local Improvements - - 1,134,400 Total Capital Financing 2,344,870 7,860,000 7,520,000 Total Capital Expenditures less Capital Financing 334, Financing Strategy As noted above, a financing strategy has been provided for both scenarios 2 and 3. Scenario 2 represents the current District approved capital forecast (for roads, bridges, water and wastewater assets), while scenario 3 represents suggested increases to the approved capital plan, taking into account the District s current asset inventory characteristics. Through discussions with District staff, it has been determined that further refinements to the asset inventory and level of service analysis (see Chapter 3) is needed to make scenario 3 more accurate, however the current results of this scenario are provided within this report, for future consideration. Tax Supported Roads and Bridges Scenario 2 Table 5-5 shows the tax supported expenditure forecast for maintenance, renewal/rehabilitation, replacement/disposal and expansion for the 10 year forecast period. While this summary only shows high level cost classifications, further detail can be obtained from Appendix E.
52 5-6 Table 5-5 Tax Supported Expenditure Forecast Summary Asset Lifecycle Costs Forecast (Inflated) Maintenance: Current Service Levels 6,458,095 6,458,095 6,458,095 6,458,095 6,458,095 6,458,095 6,458,095 6,458,095 6,458,095 Maintenance: LOS Adjustment Total Asset Maintenance 6,458,095 6,458,095 6,458,095 6,458,095 6,458,095 6,458,095 6,458,095 6,458,095 6,458,095 Renewal/Rehabilitation/Replacement 14,663,671 15,561,394 15,640,696 16,502,228 17,628,515 18,373,228 19,510,503 19,334,107 19,932,476 Renewal/Rehab/Repl.: LOS Adjustment Total Replacement/Disposal 14,663,671 15,561,394 15,640,696 16,502,228 17,628,515 18,373,228 19,510,503 19,334,107 19,932,476 Expansion: DC Related 2,412,699 2,274,457 3,037,833 3,085,002 2,953,817 3,253,447 3,165,912 4,272,154 4,682,070 Expansion: LOS Adjustment Total Expansion 2,412,699 2,274,457 3,037,833 3,085,002 2,953,817 3,253,447 3,165,912 4,272,154 4,682,070 Total 23,534,465 24,293,946 25,136,624 26,045,325 27,040,427 28,084,771 29,134,510 30,064,356 31,072,641 Items in Table 5-5 labelled as LOS Adjustment refer to the level of service analysis discussed in Chapter 3. Expansion related costs labelled as DC related refer to projects identified in the District s Development Charge Background Study (please refer to Appendix E). Please note that, as the District s Development Charge Background Study is currently being updated, it is recommended that the results of the update be inserted into this asset management plan, when available. Table 5-6 summarizes the recommended strategy to finance the asset related costs identified in Table 5-5. Table 5-6 Breakdown of Annual Tax Supported Funding (Revenue) by Source Funding (Revenue) by Source Forecast (Inflated) Taxation 6,458,095 6,458,095 6,458,095 6,458,095 6,458,095 6,458,095 6,458,095 6,458,095 6,458,095 Grants Other Contributions 50,000 30,000 20, , ,000 Debentures ,000 1,600,000 Development Charges Reserve Funds 2,412,699 2,274,457 3,037,833 3,085,002 2,953,817 3,253,447 3,165,912 3,372,154 3,082,070 Gas Tax Reserve Funds Capital Reserve Fund 14,613,671 15,531,394 15,620,696 16,502,228 17,628,515 18,373,228 19,510,503 19,234,107 19,757,476 Total 23,534,465 24,293,946 25,136,624 26,045,325 27,040,427 28,084,771 29,134,510 30,064,356 31,072,641 These lifecycle costs are being recovered through several methods: Taxation funding is suggested for all maintenance costs, as well as level of service adjustment related costs related to operations. Other Contributions include area municipal contributions as indicated in the District s capital forecast. Debt financing is shown as required in years where significant capital needs are identified. The portion of newly acquired or constructed assets that are growth (DC) related are shown as financed by development charges. The District will be dependent upon maintaining healthy capital reserves/reserve funds in order to provide the remainder of the required lifecycle funding over the forecast period.
53 This will require the District to proactively increase amounts being transferred to these capital reserves during the annual budget process. 5-7 While the annual funding requirement may fluctuate, it is important for the District to implement a consistent, yet increasing annual investment in capital so that the excess annual funds can accrue in capital reserve funds. In order to fund the recommended asset requirements over the forecast period using the District s own available funding sources (i.e. using taxation, reserves/reserve funds and debentures), an increase in the District s taxation levy of 3.59% per year would be required for each year of the forecast period. This increase assumes that all departmental operating accounts would increase at 2% annually. Please note that this analysis only incorporates the capital needs for roads and bridge related assets. Also, if other funding sources become available (i.e. grant funding) or if maintenance and rehabilitation practices allow for the deferral of capital works, then the impact on the District s taxation levy would decrease. Scenario 3 Table 5-7 shows the tax supported expenditure forecast for maintenance, renewal/rehabilitation, replacement/disposal and expansion for the 10 year forecast period. While this summary only shows high level cost classifications, further detail can be obtained from Appendix E. Table 5-7 Tax Supported Expenditure Forecast Summary Asset Lifecycle Costs Forecast (Inflated) Maintenance: Current Service Levels 6,458,095 6,587,257 6,719,002 6,853,382 6,990,450 7,130,259 7,272,864 7,418,322 7,566,688 Maintenance: LOS Adjustment Total Asset Maintenance 6,458,095 6,587,257 6,719,002 6,853,382 6,990,450 7,130,259 7,272,864 7,418,322 7,566,688 Renewal/Rehabilitation/Replacement 18,074,220 19,576,097 20,292,733 21,826,225 23,112,232 24,021,457 25,909,946 26,524,754 27,956,040 Renewal/Rehab/Repl.: LOS Adjustment Total Replacement/Disposal 18,074,220 19,576,097 20,292,733 21,826,225 23,112,232 24,021,457 25,909,946 26,524,754 27,956,040 Expansion: DC Related 2,412,699 2,274,457 3,037,833 3,085,002 2,953,817 3,253,447 3,165,912 4,272,154 4,682,070 Expansion: LOS Adjustment Total Expansion 2,412,699 2,274,457 3,037,833 3,085,002 2,953,817 3,253,447 3,165,912 4,272,154 4,682,070 Total 26,945,014 28,437,811 30,049,568 31,764,610 33,056,499 34,405,163 36,348,722 38,215,229 40,204,798 Items in Table 5-7 labelled as LOS Adjustment refer to the level of service analysis discussed in Chapter 3. Expansion related costs labelled as DC related refer to projects identified in the District s Development Charge Background Study (please refer to Appendix E). Please note that, as the District s Development Charge Background Study is currently being updated, it is recommended that the results of the update be inserted into this asset management plan, when available. Table 5-8 summarizes the recommended strategy to finance the asset related costs identified in Table 5-7.
54 5-8 Table 5-8 Breakdown of Annual Tax Supported Funding (Revenue) by Source Funding (Revenue) by Source Forecast (Inflated) Taxation 6,458,095 6,587,257 6,719,002 6,853,382 6,990,450 7,130,259 7,272,864 7,418,322 7,566,688 Grants Other Contributions 50,000 30,000 20, , ,000 Debentures ,000 1,600,000 Development Charges Reserve Funds 2,412,699 2,274,457 3,037,833 3,085,002 2,953,817 3,253,447 3,165,912 3,372,154 3,082,070 Gas Tax Reserve Funds Capital Reserve Fund 18,024,220 19,546,097 20,272,733 21,826,225 23,112,232 24,021,457 25,909,946 26,424,754 27,781,040 Total 26,945,014 28,437,811 30,049,568 31,764,610 33,056,499 34,405,163 36,348,722 38,215,229 40,204,798 These lifecycle costs are being recovered through several methods: Taxation funding is suggested for all maintenance costs, as well as level of service adjustment related costs related to operations. Other Contributions include area municipal contributions as indicated in the District s capital forecast. Debt financing is shown as required in years where significant capital needs are identified. The portion of newly acquired or constructed assets that are growth (DC) related are shown as financed by development charges. The District will be dependent upon maintaining healthy capital reserves/reserve funds in order to provide the remainder of the required lifecycle funding over the forecast period. This will require the District to proactively increase amounts being transferred to these capital reserves during the annual budget process. While the annual funding requirement may fluctuate, it is important for the District to implement a consistent, yet increasing annual investment in capital so that the excess annual funds can accrue in capital reserve funds. In order to fund the recommended asset requirements over the forecast period using the District s own available funding sources (i.e. using taxation, reserves/reserve funds and debentures), an increase in the District s taxation levy of 4.95% per year would be required for each year of the forecast period. This increase assumes that all departmental operating accounts would increase at 2% annually. Please note that this analysis only incorporates the capital needs for roads and bridge related assets. Also, if other funding sources become available (i.e. grant funding) or if maintenance and rehabilitation practices allow for the deferral of capital works, then the impact on the District s taxation levy would decrease.
55 5-9 Water Scenario 2 Table 5-9 shows the water expenditure forecast for maintenance, renewal/rehabilitation, replacement/disposal and expansion for the 10 year forecast period. While this summary only shows high level cost classifications, further detail can be obtained from Appendix F. Table 5-9 Water Expenditure Forecast Summary Asset Lifecycle Costs Forecast (Inflated) Maintenance: Current Service Levels 4,184,581 4,268,272 4,353,638 4,440,710 4,529,525 4,620,115 4,712,517 4,806,768 4,902,903 Maintenance: LOS Adjustment Total Asset Maintenance 4,184,581 4,268,272 4,353,638 4,440,710 4,529,525 4,620,115 4,712,517 4,806,768 4,902,903 Renewal/Rehabilitation/Replacement 3,177,550 1,999,797 2,737,281 2,809,097 1,321,572 3,445,796 2,422,682 3,469,224 5,147,330 Renewal/Rehab/Repl.: LOS Adjustment Total Replacement/Disposal 3,177,550 1,999,797 2,737,281 2,809,097 1,321,572 3,445,796 2,422,682 3,469,224 5,147,330 Expansion: DC Related ,411,561 1,791,078 3,246,867 2,908, ,518 - Expansion: LOS Adjustment Total Expansion ,411,561 1,791,078 3,246,867 2,908, ,518 - Total 7,362,131 6,268,069 7,090,919 8,661,368 7,642,176 11,312,778 10,044,021 8,998,510 10,050,233 Items in Table 5-9 labelled as LOS Adjustment refer to the level of service analysis discussed in Chapter 3. Expansion related costs labelled as DC related refer to projects identified in the District s Development Charge Background Study (please refer to Appendix F). Please note that, as the District s Development Charge Background Study is currently being updated, it is recommended that the results of the update be inserted into this asset management plan, when available. Table 5-10 summarizes the recommended strategy to finance the asset related costs identified in Table 5-9. Table 5-10 Breakdown of Annual Water Funding (Revenue) by Source Funding (Revenue) by Source Forecast (Inflated) Water Rate Revenue 4,184,581 4,268,272 4,353,638 4,440,710 4,529,525 4,620,115 4,712,517 4,806,768 4,902,903 Grants Other Contributions 56, , , , , , , , ,525 Debentures Development Charges Reserve Funds ,411,561 1,791,078 3,246,867 2,908, ,518 - Gas Tax Reserve Funds Capital Reserve Fund 3,120,900 1,871,428 2,248,286 2,148, ,322 2,952,653 2,168,099 3,260,207 5,003,805 Total 7,362,131 6,268,069 7,090,919 8,661,368 7,642,176 11,312,778 10,044,021 8,998,510 10,050,233 These lifecycle costs are being recovered through several methods: Water rate revenue is suggested for all maintenance costs, as well as level of service adjustment related costs related to operations. Other Contributions include area municipal contributions as indicated in the District s capital forecast.
56 5-10 Debt financing is shown as required in years where significant capital needs are identified. The portion of newly acquired or constructed assets that are growth (DC) related are shown as financed by development charges. The District will be dependent upon maintaining healthy capital reserves/reserve funds in order to provide the remainder of the required lifecycle funding over the forecast period. This will require the District to proactively increase amounts being transferred to these capital reserves during the annual budget process. While the annual funding requirement may fluctuate, it is important for the District to implement a consistent, yet increasing annual investment in capital so that the excess annual funds can accrue in capital reserve funds. In order to fund the recommended asset requirements over the forecast period using the District s own available funding sources (i.e. using water rate revenue, reserves/reserve funds and debentures), an increase in revenue (i.e. combination of growth/water consumption and rate increases) of 2.11% per year would be required for each year of the forecast period. This increase assumes that all water operating accounts would increase at 2% annually. However, if other funding sources become available (i.e. grant funding) or if maintenance and rehabilitation practices allow for the deferral of capital works, then the impact on District water rate revenue would decrease. In order to assess the impacts of the water rates specifically, a water rate study would be required. Scenario 3 Table 5-11 shows the water expenditure forecast for maintenance, renewal/rehabilitation, replacement/disposal and expansion for the 10 year forecast period. While this summary only shows high level cost classifications, further detail can be obtained from Appendix F. Table 5-11 Water Expenditure Forecast Summary Asset Lifecycle Costs Forecast (Inflated) Maintenance: Current Service Levels 4,184,581 4,268,272 4,353,638 4,440,710 4,529,525 4,620,115 4,712,517 4,806,768 4,902,903 Maintenance: LOS Adjustment Total Asset Maintenance 4,184,581 4,268,272 4,353,638 4,440,710 4,529,525 4,620,115 4,712,517 4,806,768 4,902,903 Renewal/Rehabilitation/Replacement 5,787,639 5,136,253 6,429,339 7,087,268 6,217,702 8,993,111 8,655,847 10,424,397 12,862,222 Renewal/Rehab/Repl.: LOS Adjustment Total Replacement/Disposal 5,787,639 5,136,253 6,429,339 7,087,268 6,217,702 8,993,111 8,655,847 10,424,397 12,862,222 Expansion: DC Related ,411,561 1,791,078 3,246,867 2,908, ,518 - Expansion: LOS Adjustment Total Expansion ,411,561 1,791,078 3,246,867 2,908, ,518 - Total 9,972,219 9,404,525 10,782,976 12,939,540 12,538,305 16,860,093 16,277,185 15,953,683 17,765,125 Items in Table 5-11 labelled as LOS Adjustment refer to the level of service analysis discussed in Chapter 3. Expansion related costs labelled as DC related refer to projects identified in the District s Development Charge Background Study (please refer to Appendix F). Please note that,
57 5-11 as the District s Development Charge Background Study is currently being updated, it is recommended that the results of the update be inserted into this asset management plan, when available. Table 5-12 summarizes the recommended strategy to finance the asset related costs identified in Table Table 5-12 Breakdown of Annual Water Funding (Revenue) by Source Funding (Revenue) by Source Forecast (Inflated) Water Rate Revenue 4,184,581 4,268,272 4,353,638 4,440,710 4,529,525 4,620,115 4,712,517 4,806,768 4,902,903 Grants Other Contributions 56, , , , , , , , ,525 Debentures 1,000, Development Charges Reserve Funds ,411,561 1,791,078 3,246,867 2,908, ,518 - Gas Tax Reserve Funds Capital Reserve Fund 4,730,989 5,007,884 5,940,343 6,426,595 5,786,452 8,499,967 8,401,263 10,215,380 12,718,697 Total 9,972,219 9,404,525 10,782,976 12,939,540 12,538,305 16,860,093 16,277,185 15,953,683 17,765,125 These lifecycle costs are being recovered through several methods: Water rate revenue is suggested for all maintenance costs, as well as level of service adjustment related costs related to operations. Other Contributions include area municipal contributions as indicated in the District s capital forecast. Debt financing is shown as required in years where significant capital needs are identified. The portion of newly acquired or constructed assets that are growth (DC) related are shown as financed by development charges. The District will be dependent upon maintaining healthy capital reserves/reserve funds in order to provide the remainder of the required lifecycle funding over the forecast period. This will require the District to proactively increase amounts being transferred to these capital reserves during the annual budget process. While the annual funding requirement may fluctuate, it is important for the District to implement a consistent, yet increasing annual investment in capital so that the excess annual funds can accrue in capital reserve funds. In order to fund the recommended asset requirements over the forecast period using the District s own available funding sources (i.e. using water rate revenue, reserves/reserve funds and debentures), an increase in revenue (i.e. combination of growth/water consumption and rate increases) of 8.78% per year would be required for each year of the forecast period. This increase assumes that all water operating accounts would increase at 2% annually. However, if other funding sources become available (i.e. grant funding) or if maintenance and rehabilitation practices allow for the deferral of capital works, then the impact on District water rate revenue would decrease. In order to assess the impacts of the water rates specifically, a water rate study would be required.
58 5-12 Wastewater Scenario 2 Table 5-13 shows the water expenditure forecast for maintenance, renewal/rehabilitation, replacement/disposal and expansion for the 10 year forecast period. While this summary only shows high level cost classifications, further detail can be obtained from Appendix G. Table 5-13 Wastewater Expenditure Forecast Summary Asset Lifecycle Costs Forecast (Inflated) Maintenance: Current Service Levels 5,010,577 5,110,788 5,213,004 5,317,264 5,423,609 5,532,081 5,642,723 5,755,578 5,870,689 Maintenance: LOS Adjustment Total Asset Maintenance 5,010,577 5,110,788 5,213,004 5,317,264 5,423,609 5,532,081 5,642,723 5,755,578 5,870,689 Renewal/Rehabilitation/Replacement 5,361,150 8,412,937 9,184,370 7,296,674 3,613,457 2,435,867 2,742,619 4,725,052 3,411,982 Renewal/Rehab/Repl.: LOS Adjustment Total Replacement/Disposal 5,361,150 8,412,937 9,184,370 7,296,674 3,613,457 2,435,867 2,742,619 4,725,052 3,411,982 Expansion: DC Related 2,647,100 5,919,822 5,682,180 5,937,059 2,527,217 3,707,532 1,844,811 2,533,540 2,968,359 Expansion: LOS Adjustment Total Expansion 2,647,100 5,919,822 5,682,180 5,937,059 2,527,217 3,707,532 1,844,811 2,533,540 2,968,359 Total 13,018,827 19,443,547 20,079,555 18,550,997 11,564,284 11,675,481 10,230,153 13,014,170 12,251,030 Items in Table 5-13 labelled as LOS Adjustment refer to the level of service analysis discussed in Chapter 3. Expansion related costs labelled as DC related refer to projects identified in the District s Development Charge Background Study (please refer to Appendix G). Please note that, as the District s Development Charge Background Study is currently being updated, it is recommended that the results of the update be inserted into this asset management plan, when available. Table 5-14 summarizes the recommended strategy to finance the asset related costs identified in Table Table 5-14 Breakdown of Annual Wastewater Funding (Revenue) by Source Funding (Revenue) by Source Forecast (Inflated) Wastewater Rate Revenue 5,010,577 5,110,788 5,213,004 5,317,264 5,423,609 5,532,081 5,642,723 5,755,578 5,870,689 Grants Other Contributions 313,120 63, , , ,574 Debentures - 3,800,000 7,600,000 5,600, ,000 1,800, ,000 1,100,000 Development Charges Reserve Funds 2,647,100 4,619,822 1,782,180 1,537,059 1,927,217 1,907,532 1,844,811 1,933,540 1,868,359 Gas Tax Reserve Funds Capital Reserve Fund 5,048,030 5,849,283 5,370,727 5,764,649 3,613,457 2,435,867 2,742,619 4,725,052 3,118,408 Total 13,018,827 19,443,547 20,079,555 18,550,997 11,564,284 11,675,481 10,230,153 13,014,170 12,251,030 These lifecycle costs are being recovered through several methods: Wastewater rate revenue is suggested for all maintenance costs, as well as level of service adjustment related costs related to operations. Other Contributions include area municipal contributions as indicated in the District s capital forecast.
59 5-13 Debt financing is shown as required in years where significant capital needs are identified. The portion of newly acquired or constructed assets that are growth (DC) related are shown as financed by development charges. The District will be dependent upon maintaining healthy capital reserves/reserve funds in order to provide the remainder of the required lifecycle funding over the forecast period. This will require the District to proactively increase amounts being transferred to these capital reserves during the annual budget process. While the annual funding requirement may fluctuate, it is important for the District to implement a consistent, yet increasing annual investment in capital so that the excess annual funds can accrue in capital reserve funds. In order to fund the recommended asset requirements over the forecast period using the District s own available funding sources (i.e. using wastewater rate revenue, reserves/reserve funds and debentures), an increase in revenue (i.e. combination of growth/wastewater flows and rate increases) of 4.94% per year would be required for the first 4 years of the forecast period, declining to 2.47% for the remainder of the forecast period. This increase assumes that all wastewater operating accounts would increase at 2% annually. However, if other funding sources become available (i.e. grant funding) or if maintenance and rehabilitation practices allow for the deferral of capital works, then the impact on District wastewater rate revenue would decrease. In order to assess the impacts of the wastewater rates specifically, a wastewater rate study would be required. Scenario 3 Table 5-15 shows the water expenditure forecast for maintenance, renewal/rehabilitation, replacement/disposal and expansion for the 10 year forecast period. While this summary only shows high level cost classifications, further detail can be obtained from Appendix G. Table 5-15 Wastewater Expenditure Forecast Summary Asset Lifecycle Costs Forecast (Inflated) Maintenance: Current Service Levels 5,010,577 5,110,788 5,213,004 5,317,264 5,423,609 5,532,081 5,642,723 5,755,578 5,870,689 Maintenance: LOS Adjustment Total Asset Maintenance 5,010,577 5,110,788 5,213,004 5,317,264 5,423,609 5,532,081 5,642,723 5,755,578 5,870,689 Renewal/Rehabilitation/Replacement 8,234,163 8,412,937 9,184,370 8,866,383 11,966,929 11,317,493 12,176,571 14,442,023 13,420,462 Renewal/Rehab/Repl.: LOS Adjustment Total Replacement/Disposal 8,234,163 8,412,937 9,184,370 8,866,383 11,966,929 11,317,493 12,176,571 14,442,023 13,420,462 Expansion: DC Related 2,647,100 5,919,822 5,682,180 5,937,059 2,527,217 3,707,532 1,844,811 2,533,540 2,968,359 Expansion: LOS Adjustment Total Expansion 2,647,100 5,919,822 5,682,180 5,937,059 2,527,217 3,707,532 1,844,811 2,533,540 2,968,359 Total 15,891,840 19,443,547 20,079,555 20,120,706 19,917,755 20,557,107 19,664,105 22,731,141 22,259,510 Items in Table 5-15 labelled as LOS Adjustment refer to the level of service analysis discussed in Chapter 3. Expansion related costs labelled as DC related refer to projects identified in the District s Development Charge Background Study (please refer to Appendix G). Please note that,
60 5-14 as the District s Development Charge Background Study is currently being updated, it is recommended that the results of the update be inserted into this asset management plan, when available. Table 5-16 summarizes the recommended strategy to finance the asset related costs identified in Table Table 5-16 Breakdown of Annual Wastewater Funding (Revenue) by Source Funding (Revenue) by Source Forecast (Inflated) Wastewater Rate Revenue 5,010,577 5,110,788 5,213,004 5,317,264 5,423,609 5,532,081 5,642,723 5,755,578 5,870,689 Grants Other Contributions 313,120 63, , , ,574 Debentures 1,500,000 3,400,000 5,900,000 4,400, ,000 1,800, ,000 1,100,000 Development Charges Reserve Funds 2,647,100 4,619,822 1,782,180 1,537,059 1,927,217 1,907,532 1,844,811 1,933,540 1,868,359 Gas Tax Reserve Funds Capital Reserve Fund 6,421,043 6,249,283 7,070,727 8,534,358 11,966,929 11,317,493 12,176,571 14,442,023 13,126,888 Total 15,891,840 19,443,547 20,079,555 20,120,706 19,917,755 20,557,107 19,664,105 22,731,141 22,259,510 These lifecycle costs are being recovered through several methods: Wastewater rate revenue is suggested for all maintenance costs, as well as level of service adjustment related costs related to operations. Other Contributions include area municipal contributions as indicated in the District s capital forecast. Debt financing is shown as required in years where significant capital needs are identified. The portion of newly acquired or constructed assets that are growth (DC) related are shown as financed by development charges. The District will be dependent upon maintaining healthy capital reserves/reserve funds in order to provide the remainder of the required lifecycle funding over the forecast period. This will require the District to proactively increase amounts being transferred to these capital reserves during the annual budget process. While the annual funding requirement may fluctuate, it is important for the District to implement a consistent, yet increasing annual investment in capital so that the excess annual funds can accrue in capital reserve funds. In order to fund the recommended asset requirements over the forecast period using the District s own available funding sources (i.e. using wastewater rate revenue, reserves/reserve funds and debentures), an increase in revenue (i.e. combination of growth/wastewater flows and rate increases) of 9.85% per year would be required for each year of the forecast period. This increase assumes that all wastewater operating accounts would increase at 2% annually. However, if other funding sources become available (i.e. grant funding) or if maintenance and rehabilitation practices allow for the deferral of capital works, then the impact on District wastewater rate revenue would decrease. In order to assess the impacts of the wastewater rates specifically, a wastewater rate study would be required.


61 Funding Shortfall Assuming the District maintains adequate capital reserve funds, the asset management strategy for scenarios 2 and 3 will be fully funded. It is believed this can be accomplished through each annual budget process. However, each scenario does defer significant capital replacements. In the event that certain deferred replacements result in increased risks and/or projected asset failures, further funding may be required to address the costs associated with accelerating replacement timelines. A fundamental approach to calculating the cost of using a capital asset and for the provision of the revenue required when the time comes to retire and replace it is the sinking fund method. This method first estimates the future value of the asset at the time of replacement, by inflating the current value of the asset at an assumed annual capital inflation rate. A calculation is then performed to determine annual contributions which, when invested in a reserve fund, will grow with interest to a balance equal to the future replacement cost. The contributions are calculated such that they also increase annually with inflation. Under this approach, an annual capital investment amount is calculated where funds are available for short-term needs while establishing a funding plan for long-term needs. Annual contributions in excess of capital costs in a given year would be transferred to a capital replacement reserve fund for future capital replacement needs. This approach provides for a stable funding base, eliminating variances in annual funding requirements, particularly in years when capital replacement needs exceed typical capital levy funding. Please refer to Figure 5-2 for an illustration of this method. Figure 5-2 Sinking Fund Method Tax Supported Roads and Bridges
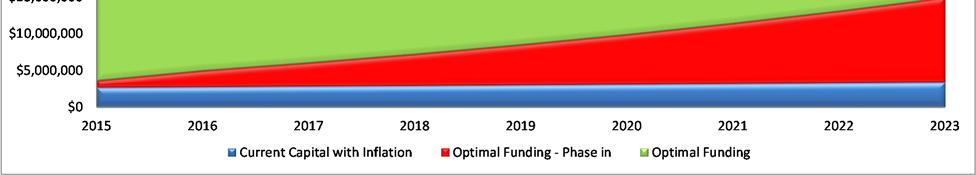
62 5-16 From a roads and bridges asset perspective, the estimated annual sinking fund requirement, based on using the calculations discussed above, is approximately $46.4 million (in 2014 dollars). Based on the District s 2014 budget, current annual capital investment is approximately $14.8 million. This would provide a high level estimate of the District s annual tax supported infrastructure funding deficit at $31.6 million (in 2014 dollars). Water From a water asset base perspective, the estimated annual sinking fund requirement, based on using the calculations discussed above, is approximately $15.6 million (in 2014 dollars). Based on the District s 2014 budget, current annual capital investment is approximately $2.6 million. This would provide a high level estimate of the District s annual water infrastructure funding deficit at $13.0 million (in 2014 dollars). Wastewater From a wastewater asset base perspective, the estimated annual sinking fund requirement, based on using the calculations discussed above, is approximately $25.1 million (in 2014 dollars). Based on the District s 2014 budget, current annual capital investment is approximately $2.3 million. This would provide a high level estimate of the District s annual wastewater infrastructure funding deficit at $22.8 million (in 2014 dollars). Please see Figures 5-3 to 5-5 below for a 10 year forecast of implementing this strategy for tax supported, water and wastewater assets respectively under scenarios 2 and 3. The blue portion of the graph outlines the current capital investment amounts, increasing at inflation. The red portion indicates the result of implementing recommended increases in available funding sources (resulting in increases in capital investment annually). The green represents optimal annual capital investment amounts (calculated as described above). Please note optimal capital investment funding can come from a number of additional sources, such as grants, donations, debt and other contributions.

63 5-17 Figure 5-3 Tax Supported Assets Roads and Bridges


64 5-18 Figure 5-4 Water Assets
65 5-19 Figure 5-5 Wastewater Assets To further mitigate the potential infrastructure funding deficit, the District could consider: Decreasing expected levels of service to make available capital funding; Issuing debt for significant and/or unforeseen capital projects, in addition to the debt recommended within this report, while staying within the District s debt capacity limits (this would have the impact of spreading out the capital repayment over a defined term); Actively seeking out and applying for grants; Consider approaching the development community for funding assistance with respect to growth/expansion related projects; Rate increases, where needed (i.e. taxation, user fees); or Implementing operating efficiencies (i.e. reduced operating costs to allow more capital investment).
66
67 6. RECOMMENDATIONS
68
69 RECOMMENDATIONS The following recommendations have been provided for consideration: That the District of Muskoka Asset Management Plan be received and approved by Council; That consideration of this Asset Management Plan be made as part of the annual budgeting process to ensure sufficient capital funds are available to fund capital requirements; and That this Asset Management plan be updated as needed over time to reflect the current priorities of the District. The current level of funding for asset replacement and renewal at the District will not sufficiently fund capital needs or close the infrastructure funding gap. As such, it is recommended that the following additional recommendations be considered during the annual budget process: Initiation of level of service (LOS) strategies discussed in Chapters 3 and 4. Consider an increase in taxation as part of upcoming budget deliberations, dedicated to capital, to be transferred to capital reserve(s). Water and wastewater revenue increases consistent with the calculations provided in this report. Substantial investment in capital needs will be required over the forecast period. Through the recommendations provided above, proactive steps would be taken to increase capital investment, as well as reduce the annual infrastructure funding gap for these assets. Enhanced level of service will assist in maintaining adequate asset conditions, mitigate asset risk, as well as potentially defer capital needs within the forecast period. In addition, the District should pursue available capital grants, wherever possible, to further reduce the infrastructure funding gap. Through the creation of this plan, District staff have been provided with a model in which amendments and revisions can be made as needed. It is anticipated that the final plan adopted by Council will be monitored and updated frequently by District staff as part of the budget process, with refinements and specific recommendations being provided with respect to the priority of each individual project.
70
71 APPENDIX A DETAILED ASSET INVENTORY
72
73 PLEASE REFER TO TECHNICAL APPENDIX
74
75 APPENDIX B ASSET MANAGEMENT ASSUMPTIONS
76
77 APPENDIX B: ASSET MANAGEMENT PLAN ASSUMPTIONS B-1 The following assumptions were made during the creation of the District s asset management plan. 1. STATE OF LOCAL INFRASTRUCTURE a) Indexing: When inflating an asset value to a 2013 replacement value, the Non-Residential Building Construction Price Index (NRBCPI) was used for Roads, Water and Wastewater related assets. In order to establish an initial condition assessment for some assets, calculations were performed to link condition to asset age. This was done in order to establish condition ratings for this report and it is recommended that the District follow the Condition Assessment Policy shown in Appendix C in the future. 2. ASSET MANAGEMENT STRATEGY a) Capital inflation rate will be assumed to be 3% annually. b) Operating budget inflation rate will be assumed to be 2% annually. c) Regarding operating expenses included in the District s current budget, it is assumed that they will increase at an operating inflation rate annually, unless staff have provided alternative impacts. d) When any existing debenture payments are complete (if applicable), annual budget savings created through removing these payments have been dedicated to capital. 3. FINANCING STRATEGY a) Taxation assessment growth is assumed to be 0.7% annually. b) Development charges rates are assumed to increase at 2% annually. c) Gas tax revenue has been identified as a funding source for the purposes of this analysis (i.e. for asset replacement purposes), and has been assumed to continue throughout the forecast period. d) Interest rate earned on a Capital Replacement Reserve Fund will be 2% annually. e) In the case where debt financing is needed, the model assumed debt terms of 20 years at 5% annual interest. For growth related debt, debt payments are shown as funded directly from the development charge reserve funds.
78
79 APPENDIX C DATA VERIFICATION AND CONDITION ASSESSMENT POLICY
80
81 C-1 APPENDIX C: DATA VERIFICATION AND CONDITION ASSESSMENT POLICY District of Muskoka Data Verification and Condition Assessment Policy Data Verification 1. The main source of asset data updating and editing will be through the District s PSAB 3150 compliance procedures. 2. Asset additions, disposals, betterments, and write-offs will be recorded based on the District s PSAB 3150 Compliance Policies. 3. Verification of the correct treatment of asset revisions will be completed through annual reviews by the District s Treasurer and external auditor as part of the year end process. 4. During years in which condition assessments are not being performed, asset replacement cost will be determined based on a combination of inflating previous current values or through the use of the current year s historical invoice data. Where indices are being used, the Non-Residential Building Construction Price Index (NRBCPI) shall be used for construction related assets (i.e. roads related, storm, water, and facilities) and the Consumer Price Index (CPI) shall be used for all other assets (i.e. machinery & equipment, vehicles and land improvements). Condition Assessment 1. Condition assessments shall be performed as outlined in Table C-1 below. Condition assessments shall be performed by qualified individuals (or companies) and shall include a review of the following: Current asset condition (consistent with the rating format used within this report, unless District staff stipulate a new format); i. Identify any unusual wear from asset use that may hinder asset performance and eventually reduce useful life. ii. Assess asset performance and identify (if any) capital improvements that can be applied to extend the asset s useful life and/or bring the asset back to proper service levels. Current asset replacement cost. This is to be based on replacing the asset under current legislation/requirements using the District s specifications; and Remaining service life, assuming current maintenance and usage levels.
82 C-2 Table C-1 Condition Assessment Time Table Roads Asset Type Bridges and Culverts (greater than 3m) Water, Wastewater, Storm Related Frequency of Condition Assessment Every 5 years, based on Minimum Maintenance Standards Every 2 years, based on applicable legislation Every 5 years, based on applicable legislation
83 APPENDIX D SCENARIO ANALYSIS CAPITAL FORECASTS
84
85 D-1 District of Muskoka 2013 Asset Management Plan Scheduled Capital Replacement (Tax Supported Assets - Roads and Bridges) - Inflated Asset Type Immediate Needs Table D-1 Replacement Year Based on Scenario TOTAL Total Scheduled Capital - Inflated 500,632,446 7,294,541 12,251,490 16,984,170 16,980,878 44,634,627 43,184,921 38,149,034 45,068,564 27,489, ,288, ,958,878 Roads 436,352,451 3,921,517 5,067,216 13,492,220 15,296,929 44,634,627 41,108,209 28,291,060 42,573,290 26,114, ,288, ,140,726 Bridges 64,279,995 3,373,025 7,184,275 3,491,950 1,683,949-2,076,713 9,857,974 2,495,274 1,374,998 - Asset Type Immediate Needs Table D-2 Replacement Year Based on Scenario TOTAL Total Scheduled Capital - Inflated - 16,243,000 17,076,370 17,835,851 18,678,529 19,587,230 20,582,332 21,626,675 22,676,414 23,606,260 24,614, ,527,207 Staff Forecast - 16,243,000 17,076,370 17,835,851 18,678,529 19,587,230 20,582,332 21,626,675 22,676,414 23,606,260 24,614, ,527,207 Asset Type Immediate Needs Table D-3 Replacement Year Based on Scenario TOTAL Total Scheduled Capital - Inflated - 16,243,000 20,486,918 21,850,553 23,330,566 24,911,227 26,066,049 27,274,904 29,075,858 30,796,908 32,638, ,674,094 Staff Forecast - 16,243,000 17,076,370 17,835,851 18,678,529 19,587,230 20,582,332 21,626,675 22,676,414 23,606,260 24,614, ,527,207 Additional Recommended - - 3,410,548 4,014,703 4,652,037 5,323,998 5,483,717 5,648,229 6,399,443 7,190,647 8,023,564 50,146,887 H:\Muskoka District\2013 AM\Muskoka District AM Inventory FINAL.xlsx
86 D-2 District of Muskoka 2013 Asset Management Plan Scheduled Capital Replacement (Tax Supported Assets - Roads and Bridges) - Inflated 600,000, ,000, ,000, ,000, ,000, ,000,000 Future Replacement Cost (Inflated) 0 Figure D 1 Tax Supported Assets Roads and Bridges Scenario 1 Based on PSAB 3150 Data 30,000,000 25,000,000 20,000,000 15,000,000 10,000,000 5,000,000 0 Figure D 2 Tax Supported Assets Roads and Bridges Scenario 2 Based on Staff Forecast Future Replacement Cost (Inflated) Year of Replacement Roads Bridges Year of Replacement Staff Forecast 35,000,000 Figure D 3 Tax Supported Assets Roads and Bridges Scenario 3 Based on Staff Forecast (Revised) 30,000,000 25,000,000 20,000,000 15,000,000 10,000,000 5,000,000 0 Future Replacement Cost (Inflated) Year of Replacement Staff Forecast Additional Recommended H:\Muskoka District\2013 AM\Muskoka District AM Inventory FINAL.xlsx
87 D-3 District of Muskoka 2013 Asset Management Plan Scheduled Capital Replacement (Water Assets) - Inflated Table D-4 Replacement Year Based on Scenario 1 Asset Type Immediate Needs TOTAL Total Scheduled Capital - Inflated 49,897,571 1,631,104 3,659,231 1,098,429 4,170,679 9,538, ,644 8,079,873 6,910,785 4,030,106 17,885, ,252,075 Water Treatment Plants 41,298,174 1,422, ,530 9,232, ,786,335 66,440,550 Water Booster Stations , ,625, ,772-4,509,423 Reservoir Boosters ,444, ,444,419 Elevated Towers Watermains 8,147, ,623 3,379, ,224 3,156, ,505,806 2,722,992 3,371,860 3,886,513 28,173,857 Water Hydrants 451,782 7,756 23, , , , , , ,766 29, ,505 2,683,826 Table D-5 Replacement Year Based on Scenario 2 Asset Type Immediate Needs TOTAL Total Scheduled Capital - Inflated - 3,585,000 3,177,550 1,999,797 2,737,281 4,220,658 3,112,651 6,692,663 5,331,503 4,191,742 5,147,330 40,196,175 Staff Forecast - 3,585,000 3,177,550 1,999,797 2,737,281 4,220,658 3,112,651 6,692,663 5,331,503 4,191,742 5,147,330 40,196,175 Table D-6 Replacement Year Based on Scenario 3 Asset Type Immediate Needs TOTAL Total Scheduled Capital - Inflated - 3,585,000 5,787,639 5,136,253 6,429,339 8,498,830 8,008,781 12,239,978 11,564,668 11,146,915 12,862,222 85,259,624 Staff Forecast - 3,585,000 3,177,550 1,999,797 2,737,281 4,220,658 3,112,651 6,692,663 5,331,503 4,191,742 5,147,330 40,196,175 Additional Recommended - - 2,610,089 3,136,457 3,692,057 4,278,172 4,896,130 5,547,315 6,233,165 6,955,173 7,714,892 45,063,448 H:\Muskoka District\2013 AM\Muskoka District AM Inventory FINAL.xlsx
88 D-4 District of Muskoka 2013 Asset Management Plan Scheduled Capital Replacement (Water Assets) - Inflated 60,000,000 50,000,000 40,000,000 30,000,000 20,000,000 10,000,000 0 Figure D 4 Water Assets Scenario 1 Based on PSAB 3150 Data 8,000,000 7,000,000 6,000,000 5,000,000 4,000,000 3,000,000 2,000,000 1,000,000 Future Replacement Cost (Inflated) Future Replacement Cost (Inflated) 0 Figure D 5 Water Assets Scenario 2 Based on Staff Forecast Year of Replacement Water Treatment Plants Water Booster Stations Reservoir Boosters Elevated Towers Watermains Water Hydrants Year of Replacement Staff Forecast 14,000,000 12,000,000 10,000,000 8,000,000 6,000,000 4,000,000 2,000,000 Future Replacement Cost (Inflated) 0 Table D 6 Water Assets Scenario 3 Based on Staff Forecast (Revised) Year of Replacement Staff Forecast Additional Recommended H:\Muskoka District\2013 AM\Muskoka District AM Inventory FINAL.xlsx
89 D-5 District of Muskoka 2013 Asset Management Plan Scheduled Capital Replacement (Wastewater Assets) - Inflated Table D-7 Replacement Year Based on Scenario 1 Asset Type Immediate Needs TOTAL Total Scheduled Capital - Inflated 142,217,374 3,033,494 8,084,584 1,686,504 8,493,369 6,343,489 4,542,247 2,609,674 5,003,435 2,433,125 50,738, ,185,537 Wastewater Treatment Plants 78,039,616-3,417, ,177 4,215,765 3,686, ,229, ,402,640 Sewer Pumping Stations 52,792,486 2,692,248 2,003,858 1,346,416 4,990,871 1,522, ,617 4,871,991-37,947, ,975,727 Sanitary Sewers 9,678, ,933 1,678,583 42,419 2,433, ,353 14,514,952 Sanitary Maintenance Holes 1,706, ,246 2,662, ,087 2,689, , , ,475 89, ,863 9,292,218 Table D-8 Replacement Year Based on Scenario 2 Asset Type Immediate Needs TOTAL Total Scheduled Capital - Inflated - 7,520,000 8,008,250 14,332,759 14,866,551 13,233,733 6,140,675 6,143,399 4,587,430 7,258,593 6,380,341 88,471,729 Staff Forecast - 7,520,000 8,008,250 14,332,759 14,866,551 13,233,733 6,140,675 6,143,399 4,587,430 7,258,593 6,380,341 88,471,729 Table D-9 Replacement Year Based on Scenario 3 Asset Type Immediate Needs TOTAL Total Scheduled Capital - Inflated - 7,520,000 10,881,263 14,332,759 14,866,551 14,803,442 14,494,146 15,025,025 14,021,382 16,975,564 16,388, ,308,954 Staff Forecast - 7,520,000 8,008,250 14,332,759 14,866,551 13,233,733 6,140,675 6,143,399 4,587,430 7,258,593 6,380,341 88,471,729 Additional Recommended - - 2,873, ,569,710 8,353,471 8,881,626 9,433,952 9,716,971 10,008,480 50,837,224 H:\Muskoka District\2013 AM\Muskoka District AM Inventory FINAL.xlsx
90 D-6 District of Muskoka 2013 Asset Management Plan Scheduled Capital Replacement (Wastewater Assets) - Inflated 160,000,000 Figure D 7 Wastewater Assets Scenario 1 Based on PSAB 3150 Data 16,000,000 Figure D 8 Wastewater Assets Scenario 2 Based on Staff Forecast 140,000, ,000, ,000,000 80,000,000 60,000,000 40,000,000 20,000, ,000,000 12,000,000 10,000,000 8,000,000 6,000,000 4,000,000 2,000,000 0 Future Replacement Cost (Inflated) Future Replacement Cost (Inflated) Year of Replacement Wastewater Treatment Plants Sewer Pumping Stations Sanitary Sewers Sanitary Maintenance Holes Year of Replacement Staff Forecast 18,000,000 16,000,000 14,000,000 12,000,000 10,000,000 8,000,000 6,000,000 4,000,000 2,000,000 0 Figure D 9 Wastewater Assets Scenario 3 Based on Staff Forecast (Revised) Future Replacement Cost (Inflated) Year of Replacement Staff Forecast Additional Recommended H:\Muskoka District\2013 AM\Muskoka District AM Inventory FINAL.xlsx
91 APPENDIX E TAX SUPPORTED ASSET MANAGEMENT STRATEGY & FINANCING STRATEGY
92
93 E-1 The District of Muskoka 2013 Asset Management Plan Financing Strategy - Scenario 2 Description Actual 2012 Budget 2013 Budget 2014 Table E-1A Tax Supported Capital Forecast Forecast Prior Capital Expenses Roads 12,771,429 15,994,056 16,243, Capital Forecast - Staff Roads - Non-Growth 14,663,671 15,561,394 15,640,696 16,502,228 17,628,515 18,373,228 19,510,503 19,334,107 19,932,476 Roads - Growth 2,412,699 2,274,457 3,037,833 3,085,002 2,953,817 3,253,447 3,165,912 4,272,154 4,682,070 Subtotal Capital Forecast - Staff 17,076,370 17,835,851 18,678,529 19,587,230 20,582,332 21,626,675 22,676,414 23,606,260 24,614,546 Level of Service Adjustments Rehabiliation and Renewal Works Total Expenditures 12,771,429 15,994,056 16,243,000 17,076,370 17,835,851 18,678,529 19,587,230 20,582,332 21,626,675 22,676,414 23,606,260 24,614,546 Capital Financing Provincial/Federal Grants Non-Growth Related Debentures Growth Related Debentures ,000 1,600,000 Reserve Fund: Development Charges 1,374,016 1,672,930 1,693,280 2,412,699 2,274,457 3,037,833 3,085,002 2,953,817 3,253,447 3,165,912 3,372,154 3,082,070 Reserve Fund: Gas Tax Reserve/Reserve Fund: Other 11,272,340 14,272,126 14,451, Other (Area Municipal Contribution) 330,135 49,000 98,000 50,000 30,000 20, , ,000 Gain/(Loss) on Sale 2, Transfer from Operating Tax Supported Capital Reserve Fund(s) ,613,671 15,531,394 15,620,696 16,502,228 17,628,515 18,373,228 19,510,503 19,234,107 19,757,476 Total Capital Financing 12,978,990 15,994,056 16,243,000 17,076,370 17,835,851 18,678,529 19,587,230 20,582,332 21,626,675 22,676,414 23,606,260 24,614,546 Total Capital Expenses less Capital Financing (207,561) H:\Muskoka District\2013 AM\Muskoka District AM Model FINAL v2.xlsx
94 E-2 The District of Muskoka 2013 Asset Management Plan Financing Strategy - Scenario 2 Table E-2A Debt Requirements Non-Growth Related Debt Principal Forecast Year (Inflated) Budget Budget Total Annual Non-Growth Related Debt Charges Growth Related Debt Principal Forecast Year (Inflated) Budget Budget ,000 72,218 72, ,600,000 Total Annual Growth Related Debt Charges 2,500, ,218 72,218 Table E-3A Reserve and Reserve Fund Continuity Schedules Development Charges Reserve Fund Forecast (Roads) Opening Balance 2,148,293 2,611,398 2,392,904 2,354,851 1,582, , , , ,115 10,994 Development Charge Proceeds 2,105,181 2,147,285 2,190,231 2,234,035 2,278,716 2,912,752 2,971,007 3,030,427 3,091,035 3,152,856 Transfer to Capital 1,693,280 2,412,699 2,274,457 3,037,833 3,085,002 2,953,817 3,253,447 3,165,912 3,372,154 3,082,070 Transfer to Operating (Debenture Payments) ,218 72,218 Interest Earned 51,204 46,920 46,174 31,021 15,516 15,005 9,656 7, Closing Balance 2,611,398 2,392,904 2,354,851 1,582, , , , ,115 10,994 9,752 Required from Development Charges 1,693,280 2,412,699 2,274,457 3,037,833 3,085,002 2,953,817 3,253,447 3,165,912 4,272,154 4,682,070 Required Debenture Funding 900,000 1,600,000 Capital Reserve/Reserve Funds Forecast (Roads) Opening Balance 5,385,847 20,538,563 24,210,334 28,964,081 35,773,525 43,984,085 53,491,627 64,834,356 77,777,653 93,930,453 Transfers From Operating/Capital 14,750,000 17,810,729 19,717,218 21,728,699 23,850,355 26,087,201 28,444,695 30,928,748 33,545,133 36,300,000 Transfer to Capital - 14,613,671 15,531,394 15,620,696 16,502,228 17,628,515 18,373,228 19,510,503 19,234,107 19,757,476 Transfer to Operating Interest Earned 402, , , , ,433 1,048,855 1,271,262 1,525,052 1,841,774 2,209,460 Closing Balance 20,538,563 24,210,334 28,964,081 35,773,525 43,984,085 53,491,627 64,834,356 77,777,653 93,930, ,682,436 Note: Closing reserve fund balance as a percentage of capital asset balance (inflated) 1.71% 1.95% 2.27% 2.72% 3.25% 3.84% 4.52% 5.26% 6.17% 7.18% H:\Muskoka District\2013 AM\Muskoka District AM Model FINAL v2.xlsx
 40,949,186 40,034,889 40,700,506 41,514,500 42,344,800 43,191,700 44,055,500 44,936,600")
95 E-3 The District of Muskoka 2013 Asset Management Plan Financing Strategy - Scenario 2 Description Actual 2012 Budget 2013 Budget 2014 Table E-4A Tax Supported Operating Budget Forecast Summary Forecast Net Expenditures All Other Departments (excluding Roads) 40,949,186 40,034,889 40,700,506 41,514,500 42,344,800 43,191,700 44,055,500 44,936,600 45,835,300 46,752,000 47,687,000 48,640,700 Transportation - Roads 7,606,934 8,597,000 8,692,167 7,586,400 7,738,100 7,892,900 8,050,700 8,211,700 8,376,000 8,543,400 8,714,200 8,888,500 Transfers to Current Roads Reserve Funds (Capital Related) 13,911,770 14,360,000 14,750, Sub-total Transportation - Roads 21,518,704 22,957,000 23,442,167 7,586,400 7,738,100 7,892,900 8,050,700 8,211,700 8,376,000 8,543,400 8,714,200 8,888,500 Net Expenditures due to Level of Service Adjustments Transfer to Roads Tax Supported Capital Reserve Fund(s) ,810,729 19,717,218 21,728,699 23,850,355 26,087,201 28,444,695 30,928,748 33,545,133 36,300,000 New Debentures Payments New Debt - Growth Related ,218 72,218 New Debt - Non-Growth Related Transfer from Reserve Fund: Development Charges (Debt) (72,218) (72,218) Surplus/(Deficit) Adjustment (949,622) Total Taxation Levy 61,518,268 62,991,889 64,142,673 66,911,629 69,800,118 72,813,299 75,956,555 79,235,501 82,655,995 86,224,148 89,946,333 93,829,200 Taxation Levy Analysis Prior Year Taxation Levy 60,217,571 61,518,268 62,991,889 64,142,673 66,911,629 69,800,118 72,813,299 75,956,555 79,235,501 82,655,995 86,224,148 89,946,333 Add: Provision for Assessment Growth (see below) , , , , , , , , ,624 Current Year Taxation Levy at 0.0% Increase 60,217,571 61,518,268 62,991,889 64,591,672 67,380,010 70,288,719 73,322,992 76,488,251 79,790,150 83,234,587 86,827,717 90,575,957 Additional Increase in Taxation Levy for the year 1,300,697 1,473,621 1,150,784 2,319,957 2,420,108 2,524,580 2,633,563 2,747,250 2,865,845 2,989,561 3,118,616 3,253,243 Total Taxation Levy 61,518,268 62,991,889 64,142,673 66,911,629 69,800,118 72,813,299 75,956,555 79,235,501 82,655,995 86,224,148 89,946,333 93,829,200 Percentage Increase (Factoring in Assessment Growth) 3.59% 3.59% 3.59% 3.59% 3.59% 3.59% 3.59% 3.59% 3.59% Forecast Assessment Growth Estimate (%) 0.7% 0.7% 0.7% 0.7% 0.7% 0.7% 0.7% 0.7% 0.7% Scenario 2 Roads and Bridges Annual Infrastructure Funding Gap Analysis (Inflated) $70,000,000 $60,000,000 $50,000,000 $40,000,000 $30,000,000 $20,000,000 $10,000,000 $ Current Capital with Inflation Optimal Funding Phase in Optimal Funding H:\Muskoka District\2013 AM\Muskoka District AM Model FINAL v2.xlsx
96 E-4 The District of Muskoka 2013 Asset Management Plan Financing Strategy - Scenario 3 Description Actual 2012 Budget 2013 Budget 2014 Table E-1B Tax Supported Capital Forecast Forecast Prior Capital Expenses Roads 12,771,429 15,994,056 16,243, Capital Forecast - Staff Roads - Non-Growth 14,663,671 15,561,394 15,640,696 16,502,228 17,628,515 18,373,228 19,510,503 19,334,107 19,932,476 Roads - Growth 2,412,699 2,274,457 3,037,833 3,085,002 2,953,817 3,253,447 3,165,912 4,272,154 4,682,070 Subtotal Capital Forecast - Staff 17,076,370 17,835,851 18,678,529 19,587,230 20,582,332 21,626,675 22,676,414 23,606,260 24,614,546 Capital Forecast - Recommended Revisions Roads - Non-Growth 3,410,548 4,014,703 4,652,037 5,323,998 5,483,717 5,648,229 6,399,443 7,190,647 8,023,564 Level of Service Adjustments Rehabiliation and Renewal Works Total Expenditures 12,771,429 15,994,056 16,243,000 20,486,918 21,850,553 23,330,566 24,911,227 26,066,049 27,274,904 29,075,858 30,796,908 32,638,110 Capital Financing Provincial/Federal Grants Non-Growth Related Debentures Growth Related Debentures ,000 1,600,000 Reserve Fund: Development Charges 1,374,016 1,672,930 1,693,280 2,412,699 2,274,457 3,037,833 3,085,002 2,953,817 3,253,447 3,165,912 3,372,154 3,082,070 Reserve Fund: Gas Tax Reserve/Reserve Fund: Other 11,272,340 14,272,126 14,451, Other (Area Municipal Contribution) 330,135 49,000 98,000 50,000 30,000 20, , ,000 Gain/(Loss) on Sale 2, Transfer from Operating Tax Supported Capital Reserve Fund(s) ,024,220 19,546,097 20,272,733 21,826,225 23,112,232 24,021,457 25,909,946 26,424,754 27,781,040 Total Capital Financing 12,978,990 15,994,056 16,243,000 20,486,918 21,850,553 23,330,566 24,911,227 26,066,049 27,274,904 29,075,858 30,796,908 32,638,110 Total Capital Expenses less Capital Financing (207,561) H:\Muskoka District\2013 AM\Muskoka District AM Model FINAL v2.xlsx
97 E-5 The District of Muskoka 2013 Asset Management Plan Financing Strategy - Scenario 3 Non-Growth Related Debt Year Table E-2B Debt Requirements Principal Forecast (Inflated) Budget Budget Total Annual Non-Growth Related Debt Charges Growth Related Debt Year Principal Forecast (Inflated) Budget Budget ,000 72,218 72, ,600,000 Total Annual Growth Related Debt Charges 2,500, ,218 72,218 Table E-3B Reserve and Reserve Fund Continuity Schedules Development Charges Reserve Fund Forecast (Roads) Opening Balance 2,148,293 2,611,398 2,392,904 2,354,851 1,582, , , , ,115 10,994 Development Charge Proceeds 2,105,181 2,147,285 2,190,231 2,234,035 2,278,716 2,912,752 2,971,007 3,030,427 3,091,035 3,152,856 Transfer to Capital 1,693,280 2,412,699 2,274,457 3,037,833 3,085,002 2,953,817 3,253,447 3,165,912 3,372,154 3,082,070 Transfer to Operating (Debenture Payments) ,218 72,218 Interest Earned 51,204 46,920 46,174 31,021 15,516 15,005 9,656 7, Closing Balance 2,611,398 2,392,904 2,354,851 1,582, , , , ,115 10,994 9,752 Required from Development Charges 1,693,280 2,412,699 2,274,457 3,037,833 3,085,002 2,953,817 3,253,447 3,165,912 4,272,154 4,682,070 Required Debenture Funding 900,000 1,600,000 Capital Reserve/Reserve Funds Forecast (Roads) Opening Balance 5,385,847 20,538,563 21,628,545 24,119,340 29,053,719 35,853,287 45,057,144 57,340,461 72,023,563 90,828,447 Transfers From Operating/Capital 14,750,000 18,690,112 21,563,964 24,637,431 27,922,787 31,432,616 35,180,452 39,180,821 43,448,688 48,000,000 Transfer to Capital - 18,024,220 19,546,097 20,272,733 21,826,225 23,112,232 24,021,457 25,909,946 26,424,754 27,781,040 Transfer to Operating Interest Earned 402, , , , , ,473 1,124,323 1,412,227 1,780,950 2,220,948 Closing Balance 20,538,563 21,628,545 24,119,340 29,053,719 35,853,287 45,057,144 57,340,461 72,023,563 90,828, ,268,355 Note: Closing reserve fund balance as a percentage of capital asset balance (inflated) 1.71% 1.75% 1.89% 2.21% 2.65% 3.23% 3.99% 4.87% 5.96% 7.22% H:\Muskoka District\2013 AM\Muskoka District AM Model FINAL v2.xlsx
98 E-6 The District of Muskoka 2013 Asset Management Plan Financing Strategy - Scenario 3 Description Actual 2012 Budget 2013 Budget 2014 Table E-4B Tax Supported Operating Budget Forecast Summary Forecast Net Expenditures All Other Departments (excluding Roads) 40,949,186 40,034,889 40,700,506 41,514,500 42,344,800 43,191,700 44,055,500 44,936,600 45,835,300 46,752,000 47,687,000 48,640,700 Transportation - Roads 7,606,934 8,597,000 8,692,167 7,586,400 7,738,100 7,892,900 8,050,700 8,211,700 8,376,000 8,543,400 8,714,200 8,888,500 Transfers to Current Roads Reserve Funds (Capital Related) 13,911,770 14,360,000 14,750, Sub-total Transportation - Roads 21,518,704 22,957,000 23,442,167 7,586,400 7,738,100 7,892,900 8,050,700 8,211,700 8,376,000 8,543,400 8,714,200 8,888,500 Net Expenditures due to Level of Service Adjustments Transfer to Roads Tax Supported Capital Reserve Fund(s) ,690,112 21,563,964 24,637,431 27,922,787 31,432,616 35,180,452 39,180,821 43,448,688 48,000,000 New Debentures Payments New Debt - Growth Related ,218 72,218 New Debt - Non-Growth Related Transfer from Reserve Fund: Development Charges (Debt) (72,218) (72,218) Surplus/(Deficit) Adjustment (949,622) Total Taxation Levy 61,518,268 62,991,889 64,142,673 67,791,012 71,646,864 75,722,031 80,028,987 84,580,916 89,391,752 94,476,221 99,849, ,529,200 Taxation Levy Analysis Prior Year Taxation Levy 60,217,571 61,518,268 62,991,889 64,142,673 67,791,012 71,646,864 75,722,031 80,028,987 84,580,916 89,391,752 94,476,221 99,849,888 Add: Provision for Assessment Growth (see below) , , , , , , , , ,949 Current Year Taxation Levy at 0.0% Increase 60,217,571 61,518,268 62,991,889 64,591,672 68,265,549 72,148,392 76,252,085 80,589,190 85,172,982 90,017,494 95,137, ,548,837 Additional Increase in Taxation Levy for the year 1,300,697 1,473,621 1,150,784 3,199,340 3,381,315 3,573,639 3,776,902 3,991,726 4,218,770 4,458,727 4,712,333 4,980,363 Total Taxation Levy 61,518,268 62,991,889 64,142,673 67,791,012 71,646,864 75,722,031 80,028,987 84,580,916 89,391,752 94,476,221 99,849, ,529,200 Percentage Increase (Factoring in Assessment Growth) 4.95% 4.95% 4.95% 4.95% 4.95% 4.95% 4.95% 4.95% 4.95% Assessment Growth Estimate (%) 0.7% 0.7% 0.7% 0.7% 0.7% 0.7% 0.7% 0.7% 0.7% Forecast Scenario 3 Roads and Bridges Annual Infrastructure Funding Gap Analysis (Inflated) $70,000,000 $60,000,000 $50,000,000 $40,000,000 $30,000,000 $20,000,000 $10,000,000 $ Current Capital with Inflation Optimal Funding Phase in Optimal Funding H:\Muskoka District\2013 AM\Muskoka District AM Model FINAL v2.xlsx
99 APPENDIX F WATER ASSET MANAGEMENT STRATEGY & FINANCING STRATEGY
100
101 F-1 The District of Muskoka 2013 Asset Management Plan Financing Strategy - Scenario 2 Description Actual 2012 Budget 2013 Budget 2014 Table F-1A Water Capital Forecast Forecast Prior Capital Expenses Water 3,531,416 3,310,000 3,585, Capital Forecast - Staff Water - Non-Growth 3,177,550 1,999,797 2,737,281 2,809,097 1,321,572 3,445,796 2,422,682 3,469,224 5,147,330 Water - Growth ,411,561 1,791,078 3,246,867 2,908, ,518 - Subtotal Capital Forecast - Staff 3,177,550 1,999,797 2,737,281 4,220,658 3,112,651 6,692,663 5,331,503 4,191,742 5,147,330 Level of Service Adjustments Rehabiliation and Renewal Works Total Expenditures 3,531,416 3,310,000 3,585,000 3,177,550 1,999,797 2,737,281 4,220,658 3,112,651 6,692,663 5,331,503 4,191,742 5,147,330 Capital Financing Provincial/Federal Grants Non-Growth Related Debentures Growth Related Debentures Reserve Fund: Development Charges 8, , ,411,561 1,791,078 3,246,867 2,908, ,518 - Reserve Fund: Gas Tax 1,273, Reserve/Reserve Fund: Other 1,710,679 2,362,000 3,201, Other (Area Municipal Contributions) 838, , ,000 56, , , , , , , , ,525 Transfer from Operating Reserve Fund: New Capital ,120,900 1,871,428 2,248,286 2,148, ,322 2,952,653 2,168,099 3,260,207 5,003,805 Total Capital Financing 3,831,560 3,310,000 3,585,000 3,177,550 1,999,797 2,737,281 4,220,658 3,112,651 6,692,663 5,331,503 4,191,742 5,147,330 Total Capital Expenses less Capital Financing (300,144) H:\Muskoka District\2013 AM\Muskoka District AM Model FINAL v2.xlsx
102 F-2 The District of Muskoka 2013 Asset Management Plan Financing Strategy - Scenario 2 Table F-2A Debt Requirements Non-Growth Related Debt Principal Forecast Year (Inflated) Budget Budget Total Annual Non-Growth Related Debt Charges Growth Related Debt Principal Forecast Year (Inflated) Budget Budget Total Annual Growth Related Debt Charges Development Charges Reserve Fund Table F-3A Reserve and Reserve Fund Continuity Schedules (All Water Rate Supported Funds) Opening Balance 2,409,377 4,154,048 5,967,543 7,851,915 9,809,276 10,401,998 11,400,523 10,986,463 10,962,323 13,222,191 Development Charge Proceeds 1,663,219 1,696,484 1,730,413 1,765,022 1,800,322 2,566,064 2,617,386 2,669,733 2,723,128 2,777,591 Transfer to Capital ,411,561 1,791,078 3,246,867 2,908, ,518 - Transfer to Operating (Debenture Payments) Interest Earned 81, , , , , , , , , ,996 Closing Balance 4,154,048 5,967,543 7,851,915 9,809,276 10,401,998 11,400,523 10,986,463 10,962,323 13,222,191 16,319,777 Required from Development Charges ,411,561 1,791,078 3,246,867 2,908, ,518 - Required Debenture Funding Forecast Capital Reserve/Reserve Funds Forecast (Water) Opening Balance 2,410,238 1,845,422 1,609,128 3,278,926 4,752,029 6,513,530 9,754,852 11,119,493 13,480,000 14,943,426 Transfers From Operating/Capital 2,600,000 2,853,054 3,476,933 3,628,212 3,782,208 3,940,373 4,099,264 4,264,292 4,430,624 4,600,000 Transfer to Capital 3,201,000 3,120,900 1,871,428 2,248,286 2,148, ,322 2,952,653 2,168,099 3,260,207 5,003,805 Transfer to Operating Interest Earned 36,185 31,552 64,293 93, , , , , , ,792 Closing Balance 1,845,422 1,609,128 3,278,926 4,752,029 6,513,530 9,754,852 11,119,493 13,480,000 14,943,426 14,830,413 Note: Closing reserve fund balance as a percentage of capital asset balance 0.37% 0.31% 0.62% 0.87% 1.16% 1.69% 1.87% 2.20% 2.36% 2.28% H:\Muskoka District\2013 AM\Muskoka District AM Model FINAL v2.xlsx
103 F-3 The District of Muskoka 2013 Asset Management Plan Financing Strategy - Scenario 2 Description Actual 2012 Budget 2013 Table F-4A Water Operating Budget Forecast Summary Budget 2014 Forecast Net Expenditures Operating Expenditures 4,140,461 4,433,579 4,380,180 4,467,800 4,557,200 4,648,300 4,741,300 4,836,100 4,932,800 5,031,500 5,132,100 5,234,700 Net Internal Charges 1,371,888 1,447,171 1,456,369 1,485,500 1,515,200 1,545,500 1,576,400 1,607,900 1,640,100 1,672,900 1,706,400 1,740,500 Other Revenue (191,173) (199,180) (169,820) (173,200) (176,700) (180,200) (183,800) (187,500) (191,200) (195,000) (198,800) (202,800) Net Expenditures due to Level of Service Adjustments Transfer to Capital Transfers to Reserve Funds Transfers to Current Reserve Funds (Capital Related) 2,655,618 2,300,000 2,600, Transfer to Water Capital Reserve Fund(s) ,853,054 3,476,933 3,628,212 3,782,208 3,940,373 4,099,264 4,264,292 4,430,624 4,600,000 Debenture Payments Existing Debt 3,221,917 3,265,958 2,964,723 2,834,887 2,336,980 2,314,461 2,292,022 2,268,419 2,246,907 2,222,289 2,199,415 2,176,864 New Debt - Growth Related New Debt - Non-Growth Related Transfer from Reserve Fund: Development Charges (Debt) Surplus/(Deficit) Adjustment Water Service Revenue (User Fees and Levy) 11,198,711 11,247,528 11,231,452 11,468,041 11,709,613 11,956,273 12,208,130 12,465,292 12,727,871 12,995,981 13,269,739 13,549,264 Percentage Increase 2.11% 2.11% 2.11% 2.11% 2.11% 2.11% 2.11% 2.11% 2.11% $25,000,000 Scenario 2 Water Annual Infrastructure Funding Gap Analysis (Inflated) $20,000,000 $15,000,000 $10,000,000 $5,000,000 $ Current Capital with Inflation Optimal Funding Phase in Optimal Funding H:\Muskoka District\2013 AM\Muskoka District AM Model FINAL v2.xlsx
104 F-4 The District of Muskoka 2013 Asset Management Plan Financing Strategy - Scenario 3 Description Actual 2012 Budget 2013 Budget 2014 Table F-1B Water Capital Forecast Forecast Prior Capital Expenses Water 3,531,416 3,310,000 3,585, Capital Forecast - Staff Water - Non-Growth 3,177,550 1,999,797 2,737,281 2,809,097 1,321,572 3,445,796 2,422,682 3,469,224 5,147,330 Water - Growth ,411,561 1,791,078 3,246,867 2,908, ,518 - Subtotal Capital Forecast - Staff 3,177,550 1,999,797 2,737,281 4,220,658 3,112,651 6,692,663 5,331,503 4,191,742 5,147,330 Capital Forecast - Recommended Revisions Water - Non-Growth 2,610,089 3,136,457 3,692,057 4,278,172 4,896,130 5,547,315 6,233,165 6,955,173 7,714,892 Level of Service Adjustments Rehabiliation and Renewal Works Total Expenditures 3,531,416 3,310,000 3,585,000 5,787,639 5,136,253 6,429,339 8,498,830 8,008,781 12,239,978 11,564,668 11,146,915 12,862,222 Capital Financing Provincial/Federal Grants Non-Growth Related Debentures ,000, Growth Related Debentures Reserve Fund: Development Charges 8, , ,411,561 1,791,078 3,246,867 2,908, ,518 - Reserve Fund: Gas Tax 1,273, Reserve/Reserve Fund: Other 1,710,679 2,362,000 3,201, Other (Area Municipal Contributions) 838, , ,000 56, , , , , , , , ,525 Transfer from Operating Reserve Fund: New Capital ,730,989 5,007,884 5,940,343 6,426,595 5,786,452 8,499,967 8,401,263 10,215,380 12,718,697 Total Capital Financing 3,831,560 3,310,000 3,585,000 5,787,639 5,136,253 6,429,339 8,498,830 8,008,781 12,239,978 11,564,668 11,146,915 12,862,222 Total Capital Expenses less Capital Financing (300,144) H:\Muskoka District\2013 AM\Muskoka District AM Model FINAL v2.xlsx
105 F-5 The District of Muskoka 2013 Asset Management Plan Financing Strategy - Scenario 3 Non-Growth Related Debt Year Table F-2B Debt Requirements Principal Forecast (Inflated) Budget Budget ,000,000 80,243 80,243 80,243 80,243 80,243 80,243 80,243 80, Total Annual Non-Growth Related Debt Charges 1,000, ,243 80,243 80,243 80,243 80,243 80,243 80,243 80,243 Growth Related Debt Year Principal Forecast (Inflated) Budget Budget Total Annual Growth Related Debt Charges Development Charges Reserve Fund Table F-3B Reserve and Reserve Fund Continuity Schedules (All Water Rate Supported Funds) Opening Balance 2,409,377 4,154,048 5,967,543 7,851,915 9,809,276 10,401,998 11,400,523 10,986,463 10,962,323 13,222,191 Development Charge Proceeds 1,663,219 1,696,484 1,730,413 1,765,022 1,800,322 2,566,064 2,617,386 2,669,733 2,723,128 2,777,591 Transfer to Capital ,411,561 1,791,078 3,246,867 2,908, ,518 - Transfer to Operating (Debenture Payments) Interest Earned 81, , , , , , , , , ,996 Closing Balance 4,154,048 5,967,543 7,851,915 9,809,276 10,401,998 11,400,523 10,986,463 10,962,323 13,222,191 16,319,777 Required from Development Charges ,411,561 1,791,078 3,246,867 2,908, ,518 - Required Debenture Funding Forecast Capital Reserve/Reserve Funds (Water) Opening Balance 2,410,238 1,845, , , ,979 1,662,957 4,464,301 5,979,606 9,186,658 12,310,012 Transfers From Operating/Capital 2,600,000 3,602,320 4,976,774 6,047,913 7,218,966 8,500,261 9,898,025 11,428,185 13,097,361 14,919,757 Transfer to Capital 3,201,000 4,730,989 5,007,884 5,940,343 6,426,595 5,786,452 8,499,967 8,401,263 10,215,380 12,718,697 Transfer to Operating Interest Earned 36,185 14,335 14,000 16,431 32,607 87, , , , ,221 Closing Balance 1,845, , , ,979 1,662,957 4,464,301 5,979,606 9,186,658 12,310,012 14,801,294 Note: Closing reserve fund balance as a percentage of capital asset balance 0.37% 0.14% 0.13% 0.15% 0.30% 0.77% 1.00% 1.50% 1.95% 2.27% Forecast H:\Muskoka District\2013 AM\Muskoka District AM Model FINAL v2.xlsx
106 F-6 The District of Muskoka 2013 Asset Management Plan Financing Strategy - Scenario 3 Description Actual 2012 Budget 2013 Table F-4B Water Operating Budget Forecast Summary Budget 2014 Forecast Net Expenditures Operating Expenditures 4,140,461 4,433,579 4,380,180 4,467,800 4,557,200 4,648,300 4,741,300 4,836,100 4,932,800 5,031,500 5,132,100 5,234,700 Net Internal Charges 1,371,888 1,447,171 1,456,369 1,485,500 1,515,200 1,545,500 1,576,400 1,607,900 1,640,100 1,672,900 1,706,400 1,740,500 Other Revenue (191,173) (199,180) (169,820) (173,200) (176,700) (180,200) (183,800) (187,500) (191,200) (195,000) (198,800) (202,800) Net Expenditures due to Level of Service Adjustments Transfer to Capital Transfers to Reserve Funds Transfers to Current Reserve Funds (Capital Related) 2,655,618 2,300,000 2,600, Transfer to Water Capital Reserve Fund(s) ,602,320 4,976,774 6,047,913 7,218,966 8,500,261 9,898,025 11,428,185 13,097,361 14,919,757 Debenture Payments Existing Debt 3,221,917 3,265,958 2,964,723 2,834,887 2,336,980 2,314,461 2,292,022 2,268,419 2,246,907 2,222,289 2,199,415 2,176,864 New Debt - Growth Related New Debt - Non-Growth Related ,243 80,243 80,243 80,243 80,243 80,243 80,243 80,243 Transfer from Reserve Fund: Development Charges (Debt) Surplus/(Deficit) Adjustment Water Service Revenue (User Fees and Levy) 11,198,711 11,247,528 11,231,452 12,217,307 13,289,697 14,456,217 15,725,130 17,105,423 18,606,874 20,240,117 22,016,719 23,949,264 Percentage Increase 8.78% 8.78% 8.78% 8.78% 8.78% 8.78% 8.78% 8.78% 8.78% $25,000,000 Scenario 3 Water Annual Infrastructure Funding Gap Analysis (Inflated) $20,000,000 $15,000,000 $10,000,000 $5,000,000 $ Current Capital with Inflation Optimal Funding Phase in Optimal Funding H:\Muskoka District\2013 AM\Muskoka District AM Model FINAL v2.xlsx
107 APPENDIX G WASTEWATER ASSET MANAGEMENT STRATEGY & FINANCING STRATEGY
108
109 G-1 The District of Muskoka 2013 Asset Management Plan Financing Strategy - Scenario 2 Description Actual 2012 Budget 2013 Budget 2014 Table G-1A Wastewater Capital Forecast Forecast Prior Capital Expenses Wastewater 2,679,644 7,860,000 7,520, Capital Forecast - Staff Wastewater - Non-Growth 5,361,150 8,412,937 9,184,370 7,296,674 3,613,457 2,435,867 2,742,619 4,725,052 3,411,982 Wastewater - Growth 2,647,100 5,919,822 5,682,180 5,937,059 2,527,217 3,707,532 1,844,811 2,533,540 2,968,359 Subtotal Capital Forecast - Staff 8,008,250 14,332,759 14,866,551 13,233,733 6,140,675 6,143,399 4,587,430 7,258,593 6,380,341 Level of Service Adjustments Rehabiliation and Renewal Works Total Expenditures 2,679,644 7,860,000 7,520,000 8,008,250 14,332,759 14,866,551 13,233,733 6,140,675 6,143,399 4,587,430 7,258,593 6,380,341 Capital Financing Provincial/Federal Grants 257, Non-Growth Related Debentures ,500,000 3,700,000 1,200, Growth Related Debentures ,300,000 3,900,000 4,400, ,000 1,800, ,000 1,100,000 Reserve Fund: Development Charges 491,932 2,428, ,000 2,647,100 4,619,822 1,782,180 1,537,059 1,927,217 1,907,532 1,844,811 1,933,540 1,868,359 Reserve Fund: Gas Tax 160, Reserve/Reserve Fund: Other 1,434,927 5,402,000 5,389, Other (Area Municipal Contributions) - 30, , ,120 63, , , ,574 Other (Local Improvements) - - 1,134, Transfer from Operating Reserve Fund: New Capital ,048,030 5,849,283 5,370,727 5,764,649 3,613,457 2,435,867 2,742,619 4,725,052 3,118,408 Total Capital Financing 2,344,870 7,860,000 7,520,000 8,008,250 14,332,759 14,866,551 13,233,733 6,140,675 6,143,399 4,587,430 7,258,593 6,380,341 Total Capital Expenses less Capital Financing 334, H:\Muskoka District\2013 AM\Muskoka District AM Model FINAL v2.xlsx
110 G-2 The District of Muskoka 2013 Asset Management Plan Financing Strategy - Scenario 2 Table G-3A Debt Requirements Non-Growth Related Debt Principal Forecast Year (Inflated) Budget Budget ,500,000 2,500, , , , , , , , ,700,000 3,700, , , , , , , ,200,000 1,200,000 96,291 96,291 96,291 96,291 96, Total Annual Non-Growth Related Debt Charges 7,400,000 7,400, , , , , , , ,795 Growth Related Debt Principal Forecast Year (Inflated) Budget Budget ,300,000 1,300, , , , , , , , ,900,000 3,900, , , , , , , ,400,000 4,400, , , , , , , ,000 48,146 48,146 48,146 48, ,800,000 1,800, , , , , ,000 48,146 48, ,100,000 1,100,000 Total Annual Growth Related Debt Charges 13,700,000 13,700, , , , , ,911 1,011,057 1,011,057 Development Charges Reserve Fund Table G-4A Reserve and Reserve Fund Continuity Schedules (All Wastewater Rate Supported Funds) Opening Balance 1,783,027 3,570,546 2,801,650 42,394 53,884 35,121 44,370 79,976 89,250 16,527 Development Charge Proceeds 1,787,519 1,823,270 1,859,735 1,896,930 1,934,868 2,705,926 2,760,044 2,815,245 2,871,550 2,928,981 Transfer to Capital - 2,647,100 4,619,822 1,782,180 1,537,059 1,927,217 1,907,532 1,844,811 1,933,540 1,868,359 Transfer to Operating (Debenture Payments) , , , , ,911 1,011,057 1,011,057 Interest Earned - 54, , ,568 1, ,322 Closing Balance 3,570,546 2,801,650 42,394 53,884 35,121 44,370 79,976 89,250 16,527 67,415 Required from Development Charges 186,000 2,647,100 5,919,822 5,682,180 5,937,059 2,527,217 3,707,532 1,844,811 2,533,540 2,968,359 Required Debenture Funding 1,300,000 3,900,000 4,400, ,000 1,800, ,000 1,100,000 Forecast Capital Reserve/Reserve Funds Forecast (Wastewater) Opening Balance 5,955,183 2,865,583 1,061, , , ,354 2,539,880 6,664,188 10,870,578 13,630,656 Transfers From Operating/Capital 2,300,000 3,223,107 4,933,892 5,373,286 5,753,539 5,957,182 6,429,504 6,735,860 7,217,863 7,512,374 Transfer to Capital 5,389,600 5,048,030 5,849,283 5,370,727 5,764,649 3,613,457 2,435,867 2,742,619 4,725,052 3,118,408 Transfer to Operating Interest Earned - 20,813 2,922 3,031 2,870 49, , , , ,492 Closing Balance 2,865,583 1,061, , , ,354 2,539,880 6,664,188 10,870,578 13,630,656 18,385,115 Note: Closing reserve fund balance as a percentage of capital asset balance 0.16% 0.02% 0.02% 0.02% 0.35% 0.88% 1.40% 1.70% 2.23% H:\Muskoka District\2013 AM\Muskoka District AM Model FINAL v2.xlsx

111 G-3 The District of Muskoka 2013 Asset Management Plan Financing Strategy - Scenario 2 Description Actual 2012 Budget 2013 Budget 2014 Table G-5A Wastewater Operating Budget Forecast Summary Forecast Net Expenditures Operating Expenditures 4,880,646 5,050,980 5,175,680 5,279,200 5,384,800 5,492,500 5,602,400 5,714,400 5,828,700 5,945,300 6,064,200 6,185,500 Net Internal Charges 1,426,831 1,531,449 1,483,506 1,513,200 1,543,500 1,574,400 1,605,900 1,638,000 1,670,800 1,704,200 1,738,300 1,773,100 Other Revenue (548,462) (488,360) (428,520) (437,100) (445,800) (454,700) (463,800) (473,000) (482,500) (492,200) (502,100) (512,100) Net Expenditures due to Level of Service Adjustments Transfer to Capital Transfers to Reserve Funds Transfers to Current Reserve Funds (Capital Related) 2,153,278 1,900,000 2,300, Transfer to Wastewater Capital Reserve Fund(s) ,223,107 4,933,892 5,373,286 5,753,539 5,957,182 6,429,504 6,735,860 7,217,863 7,512,374 Debenture Payments Existing Debt 5,610,112 5,513,963 5,299,364 4,934,256 3,812,599 3,794,582 3,773,918 3,752,944 3,567,096 3,554,979 3,375,141 3,390,782 New Debt - Growth Related , , , , ,911 1,011,057 1,011,057 New Debt - Non-Growth Related , , , , , , ,795 Transfer from Reserve Fund: Development Charges (Debt) (104,315) (417,261) (770,329) (818,474) (962,911) (1,011,057) (1,011,057) Surplus/(Deficit) Adjustment Wastewater Service Revenue (User Fees and Levy) 13,522,405 13,508,032 13,830,030 14,512,663 15,228,991 15,980,675 16,769,461 17,183,321 17,607,395 18,041,934 18,487,199 18,943,451 Percentage Increase 4.94% 4.94% 4.94% 4.94% 2.47% 2.47% 2.47% 2.47% 2.47% Scenario 2 Wastewater Annual Infrastructure Funding Gap Analysis (Inflated) $35,000,000 $30,000,000 $25,000,000 $20,000,000 $15,000,000 $10,000,000 $5,000,000 $ Current Capital with Inflation Optimal Funding Phase in Optimal Funding H:\Muskoka District\2013 AM\Muskoka District AM Model FINAL v2.xlsx
CORPORATE AND EMERGENCY SERVICES
 CORPORATE AND EMERGENCY SERVICES Asset Management Plan April 19, 2018 EXECUTIVE SUMMARY CONTENTS Page (i) 1. INTRODUCTION 1.1 Overview 1-1 1.2 Plan Development 1-1 1.3 Maintaining the Asset Management
TOWN OF COLLINGWOOD ASSET MANAGEMENT PLAN
 TOWN OF COLLINGWOOD ASSET MANAGEMENT PLAN JUNE 24, 2014 EXECUTIVE SUMMARY CONTENTS Page (i) 1. INTRODUCTION 1.1 Overview 1-1 1.2 Plan Development 1-1 1.3 Maintaining the Asset Management Plan 1-2 1.4
The Corporation of the Municipality of Central Elgin ORDER OF THE DAY
 Page The Corporation of the Municipality of Central Elgin ORDER OF THE DAY FOR THE REGULAR MEETING OF COUNCIL ON MONDAY, DECEMBER 23rd, 2013 @ 1:00 PM IN THE COUNCIL CHAMBERS Roll Call Disclosure of Pecuniary
Township of Centre Wellington Asset Management Plan
 Township of Centre Wellington 2016 Asset Management Plan November 16, 2016 Contents Page Executive Summary... i 1. Introduction... 1-1 1.1 Overview... 1-1 1.2 Plan Development... 1-1 1.3 Maintaining the
City of Welland. Comprehensive Asset Management Plan. GMBP File: January 13, Prepared By:
 Prepared By: City of Welland Comprehensive Asset Management Plan GMBP File: 614013 January 13, 2015 GUELPH OWEN SOUND LISTOWEL KITCHENER EXETER HAMILTON GTA 650 WOODLAWN RD. W., BLOCK C, UNIT 2, GUELPH
The City of Owen Sound Asset Management Plan
 The City of Owen Sound Asset Management Plan December 013 Adopted by Council March 4, 014 TABLE OF CONTENTS 1 EXECUTIVE SUMMARY... 1 INTRODUCTION....1 Vision.... What is Asset Management?....3 Link to
Town of Smiths Falls. Asset Management Plan & Long Term Financial Sustainability Plan. In Association with: AND
 Town of Smiths Falls Asset Management Plan & Long Term Financial Sustainability Plan In Association with: AND Updated September 14, 2016 Contents Page Executive Summary... i 1. Introduction... 1-1 1.1
Municipal Asset Management Plans
 Municipal Asset Management Plans AMCTO Webinar October 12, 2012 Agenda Introduction Municipal Infrastructure Investment Initiative Asset Management Scoping Asset Management Approaches State of Local Infrastructure
County of Prince Edward. Water and Wastewater Rate and Study and Connection Charges Update
 County of Prince Edward Water and Wastewater Rate and Study and Connection Charges Update December 16, 2015 Contents Page 1. Introduction... 1-1 1.1 Background... 1-1 1.2 Update Study Process... 1-5 1.3
MUNICIPALITY OF MISSISSIPPI MILLS. plan. December, 2016
 MUNICIPALITY OF MISSISSIPPI MILLS plan December, 2016 PREFACE This Asset Management Plan is intended to describe the infrastructure owned, operated and maintained by the Municipality of Mississippi Mills
p Local governments in Canada moved from a modified accrual to a full accrual accounting approach.
 PSAB 3150 p Local governments in Canada moved from a modified accrual to a full accrual accounting approach. p The primary change for local governments was the accounting treatment for tangible capital
THE ASSET MANAGEMENT PLAN FOR THE CITY OF NIAGARA FALLS
 THE ASSET MANAGEMENT PLAN FOR THE CITY OF NIAGARA FALLS 2013 THE CITY OF NIAGARA FALLS 4310 QUEEN STREET NIAGARA FALLS, ONTARIO, L2E 6X5 SUBMITTED DECEMBER 2013 BY PUBLIC SECTOR DIGEST 148 FULLARTON STREET,
Asset Management Plan The Corporation of the Town of Wasaga Beach
 Asset Management Plan The Corporation of the Town of Wasaga Beach Council Approved Nov-2016 Table of Contents Executive Summary... 2 Introduction... 4 Mission and Goals... 6 State of Local Infrastructure...
Township of Melancthon Asset Management Plan
 Township of Melancthon Asset Management Plan R.J. Burnside & Associates Limited 15 Townline Orangeville ON L9W 3R4 CANADA 300038690.2016 Township of Melancthon i Table of Contents Executive Summary 1.0
RATE STUDY. Town of Midland. HEMSON C o n s u l t i n g L t d.
 WATER AND WASTEWATER RATE STUDY Town of Midland C o n s u l t i n g L t d. December 2010 TABLE OF CONTENTS EXECUTIVE SUMMARY.........1 I BACKGROUND AND STUDY OBJECTIVES.........9 ll ASSOCIATED LEGISLATION.........13
MUNICIPALITY OF CHATHAM-KENT CORPORATE SERVICES
 MUNICIPALITY OF CHATHAM-KENT CORPORATE SERVICES TO: FROM: Mayor and Members of Council Gerry Wolting, B. Math, CPA, CA General Manager, Corporate Services DATE: January 13, 2014 SUBJECT: 2013 Asset Management
Asset Management Plan 2016 Township of King
 Asset Management Plan 206 Township of King GHD Allstate Parkway Suite 30 Markham Ontario L3R 9T8 T 905 752 4300 F 905 752 430 5432 Table of Contents. 2. 3. 4. 5. 6. Executive Summary. Introduction.2 State
TOWNSHIP OF RUSSELL ASSET MANAGEMENT PLAN WATER / WASTEWATER JUNE WSP 100 Commerce Valley Drive West Thornhill, ON L3T 0A1
 TOWNSHIP OF RUSSELL ASSET MANAGEMENT PLAN WATER / WASTEWATER JUNE 2017 WSP 100 Commerce Valley Drive West Thornhill, ON L3T 0A1 Contact: Kevin Morawski Email: kevin.morawski@wspgroup.com Phone +1 905-882-1100
TOWNSHIP OF WEST LINCOLN
 TOWNSHIP OF WEST LINCOLN April 18, 2016 dfa DFA Infrastructure International Inc. dfa DFA Infrastructure International Inc. 664-B Vine Street St. Catharines Ontario Canada L2M 7L8 Telephone: (905) 938-0965
2014 Development Charges Reserve Fund Statutory Annual Report. THAT the 2014 Development Charges Reserve Fund Statutory Annual Report BE RECEIVED.
 TO: FROM: Chair and Members Corporate and Emergency Services Committee Laurie Bissonette Director of Finance DATE: August 27, 2015 SUBJECT: Development Charges Reserve Fund Statutory Annual Report REPORT
Chair and Members Engineering and Public Works Committee. Sharon Donald Director of Budgets and Financial Planning. DATE: June 18, 2014
 TO: FROM: Chair and Members Engineering and Public Works Committee Sharon Donald Director of s and Financial Planning DATE: June 18, SUBJECT: of Tax Supported Capital March 31, REPORT NO: PW-7--1 RECOMMENDATION
AMP2016. i t r i g e s t. c o w w w. p u b l i c s e c t o r d i g e s t. c o m. The 2016 Asset Management Plan for the Township of Hamilton
 AMP2016 i t r i g e s t. c o w w w. p u b l i c s e c t o r d i g e s t. c o m The 2016 Asset Management Plan for the Township of Hamilton SUBMITTED BY THE PUBLIC SECTOR DIGEST INC. (PSD) WWW.PUBLICSECTORDIGEST.COM
2011 Draft Rate Supported Operating & Capital Budgets
 2011 Draft Rate Supported Operating & Capital Budgets Joint meeting of the Engineering & Public Works Committee (PW 2 2011) and Corporate & Emergency Service Committee (CES 2 2011) February 2, 2011 The
Municipality of Port Hope. Water Ontario Regulation 453/07 Financial Plan. Financial Plan #
 Municipality of Port Hope Water Ontario Regulation 453/07 Financial Plan Financial Plan # 146-301 February 10, 2015 Contents Page 1. Introduction 1-1 1.1 Study Purpose... 1-1 1.2 Background... 1-1 1.2.1
The Corporation of the County of Prince Edward
 Prepared for: Prepared by: The Corporation of the County of Prince Edward KPMG LLP Shire Hall, 332 Main Street 863 Princess Street, Suite 400 Picton, ON K0K 2T0 Kingston, ON K7L 5C8 Tel: 613.476.2148 Tel:
Town of Huntsville Municipal Asset Management Plan
 Town of Huntsville Municipal Asset Management Plan Adopted by Council (Resolution 470-13) December 20, 2013 1 P a g e Table of Contents Executive Summary... 3 Introduction... 4 State of Local Infrastructure...
Asset Management Investment Plan
 Asset Management Plan Prepared for the City of Kimberley 304-1353 Ellis Street Kelowna, BC, V1Y 1Z9 T: 250.762.2517 F: 250.763.5266 June 2016 File: 1162.0014.01 A s s e t M a n a g e m e n t I n v e s
Strategic Asset Management Policy
 Strategic Asset Management Policy Submission Date: 2018-04-24 Approved by: Council Approval Date: 2018-04-24 Effective Date: 2018-04-24 Resolution Number: Enter policy number. Next Revision Due: Enter
CITY OF WATERLOO Water & Sanitary Sewer Rate Design Study Final Report & Financial Plan No
 CITY OF WATERLOO Water & Sanitary Sewer Rate Design Study Final Report & Financial Plan No. 112301 April 1st 2016 DFA Infrastructure International Inc. dfa DFA Infrastructure International Inc. 33 Raymond
MUNICIPALITY OF ARRAN-ELDERSLIE CHESLEY DRINKING WATER SYSTEM FINANCIAL PLAN
 MUNICIPALITY OF ARRAN-ELDERSLIE CHESLEY DRINKING WATER SYSTEM FINANCIAL PLAN 15-013 GSS Engineering Consultants Ltd. Unit 104D 1010 9 th Avenue West Owen Sound ON N4K 5R7 519.372.4828 TABLE OF CONTENTS
Asset Management Plan
 2016 Asset Management Plan United Counties of Prescott and Russell 6/1/2016 Preface This Asset Management Plan is intended to describe the infrastructure owned, operated, and maintained by the United Counties
Toronto Water Budget BU Recommended Operating Budget Recommended Capital Plan 2017 Recommended Water Rate
 2017 BU25.1 Toronto Water Budget 2017 Recommended Operating Budget 2017 2026 Recommended Capital Plan 2017 Recommended Water Rate Lou Di Gironimo, General Manager, Toronto Water Budget Committee, November
Township of Amaranth Council Agenda Wednesday, July 25, :00 p.m.
 Township of Amaranth Council Agenda Wednesday, July 25, 2018 6:00 p.m. 1. Opening of Meeting 2. Late Submissions (to be in the office prior to the meeting) 3. Approval of Agenda 4. Disclosure of Pecuniary
City of Markham Asset Management Plan
 2016 City of Markham Asset Management Plan Table of Content 1. Executive Summary...4 2. Introduction...7 2.1 Provincial Guidelines on Asset Management Plans...7 2.2 City of Markham Goals / Strategic Plan...7
City of Barrie Water and Wastewater Ontario Regulation 453/07 Financial Plans. Financial Plan # A
 City of Barrie Water and Wastewater Ontario Regulation 453/07 Financial Plans Financial Plan # 014-301A October 7, 2015 Contents Page 1. Introduction... 1-1 1.1 Study Purpose... 1-1 1.2 Background...
The Three Planning Windows of Asset Management John Murray City of Hamilton May 9 th, 2012 CNAM - Montreal. Hamilton Asset Management Plan
 The Three Planning Windows of Asset Management John Murray City of Hamilton May 9 th, 2012 CNAM - Montreal 1 City of Hamilton Amalgamated - 2001 7 Area Municipalities Population 500,000 The City of Waterfalls
Asset Management Plan Contract No. ES-13-2
 Asset Management Plan Contract No. ES-13-2 Prepared For: Prepared By: Robinson Consultants Inc. In association with BMA Management Inc. Our Project No. 13030 November 2013 Acknowledgements Robinson Consultants
Water Service Asset Management Plan
 Water Service Asset Management Plan November 2016 Joel Shaw, P.Eng. 1435 Water Street Kelowna, BC V1Y 1J4 TEL (250) 469-8739 jshaw@kelowna.ca kelowna.ca Document Control Rev No Date Revision Details Author
ASSET MANAGEMENT PLAN. HEMSON C o n s u l t i n g L t d. 30 Saint Patrick Street, Suite 1000 Toronto, ON, M5T 3A3
 ASSET MANAGEMENT PLAN C o n s u l t i n g L t d. 30 Saint Patrick Street, Suite 1000 Toronto, ON, M5T 3A3 March 2017 TABLE OF CONTENTS EXECUTIVE SUMMARY... 1 A. STATE OF THE LOCAL INFRASTRUCTURE... 1 B.
Town of Perth Water Ontario Regulation 453/07 Financial Plan. Financial Plan #
 Town of Perth Water Ontario Regulation 453/07 Financial Plan Financial Plan # 160-301 January 28, 2016 Contents Page 1. Introduction... 1-1 1.1 Study Purpose... 1-1 1.2 Background... 1-1 1.2.1 Financial
That the report from the Director of Finance regarding the Strategic Asset Management Policy, dated June 20, 2018, be received; and
 Staff Report To: From: Mayor and Council Jeff Schmidt, Director of Finance Date: June 20, 2018 Subject: Strategic Asset Management Policy Report Highlights Provincial regulation (O.Reg. 588/17 - Asset
Report to Committee of the Whole
 Report to Committee of the Whole To: Mayor Linton and Members of Council Prepared By: Dan Wilson, Managing Director of Corporate Services / Treasurer Report: COR2018-10 Date: 19 Mar 2018 RE: Asset Management
TIP SHEET 1: REPORTING TO COUNCIL ON ASSET MANAGEMENT PLANS
 TIP SHEET 1: REPORTING TO COUNCIL ON ASSET MANAGEMENT PLANS Introduction Municipal staff are tasked with keeping their councils and the public informed about infrastructure related activities. Getting
August 22, Scott McLeod Water and Sewer Foreman Municipality of Arran-Elderslie P.O.Box 70, 1925 Bruce Rd 10 Chesley, ON N0G 1L0
 101-16183-00 August 22, 2011 Scott McLeod Water and Sewer Foreman Municipality of Arran-Elderslie P.O.Box 70, 1925 Bruce Rd 10 Chesley, ON N0G 1L0 Re: Chesley Drinking Water System Financial Plan Dear
City of Cornwall Water and Wastewater Ontario Regulation 453/07 Financial Plans. Financial Plan #
 City of Cornwall Water and Wastewater Ontario Regulation 453/07 Financial Plans Financial Plan # 176-301 November 3, 2015 Contents Page 1. Introduction 1.1 Study Purpose... 1-1 1.2 Background... 1-1 1.2.1
Toronto Water Budget. Toronto Water Budget. Water. Recommended. Lou Di Gironimo General Managou Di Gironi. Budget Committee.
 2016 Toronto Water Budget Toronto Water Budget 2016 2016 Recommended Recommended Ope Opearting 2016 Recommned2016 Budget Operating 2016 2025 2016-2025 Budget Recommended rating Recommended Budget Capital
Asset Management Planning: Legislation & Integration
 Asset Management Planning: Legislation & Integration AMCTO Conference Dan Wilson, Director Watson & Associates Economists Ltd. Val Sequeira, Director of Corporate Services/Treasurer Town of Gravenhurst
RE:EX Toronto Water CAPITAL BUDGET NOTES CONTENTS CONTACTS CAPITAL BUDGET AND PLAN OVERVIEW. Overview
 RE:EX29.18 CAPITAL BUDGET NOTES CONTENTS Overview 1: Recommended 10-Year Capital Plan 5 2: Issues for Discussion 22 Appendices: 1. 2017 Performance 30 2. Recommended 10-Year Capital Plan Summary 32 Toronto
Update on Municipal Asset Management Planning
 Update on Municipal Asset Management Planning Municipal Finance Officers Association Conference Ontario Ministry of Infrastructure September 20, 2017 Overview Municipal asset management planning in Ontario
Norfolk County Asset Management Plan Roads
 Norfolk County Asset Management Plan Roads An overview of the County s Asset Management Practices based on the Ontario Ministry of Infrastructure s Building Together Initiative Prepared for: Norfolk County
2017 ENTERPRISE ASSET MANAGEMENT PLAN
 Corporate Asset Management 2017 ENTERPRISE ASSET MANAGEMENT PLAN Investments in Peel s Infrastructure We are all asset managers! Executive Summary The Region s infrastructure is a public investment with
AMP2016. County of Grey. The 2016 Asset Management Plan for the. w w w. p u b l i c s e c t o r d i g e s t. c o m
 AMP2016 w w w. p u b l i c s e c t o r d i g e s t. c o m The 2016 Asset Management Plan for the County of Grey SUBMITTED BY THE PUBLIC SECTOR DIGEST INC. (PSD) WWW.PUBLICSECTORDIGEST.COM JULY 2017 Contents
Asset Management Plan
 Asset Management Plan NOW.. AND BEYOND Sustainable Good stewardship Locally influenced Prepared for the Corporation of the Township of Evanturel By: Amy Vickery-Menard, CMO Clerk-Treasurer Township of
Proud Heritage, Exciting Future ASSET MANAGEMENT PLAN
 Proud Heritage, Exciting Future ASSET MANAGEMENT PLAN TABLE OF CONTENTS PAGE 3 OVERVIEW 8 FACILITIES 12 FLEET 16 PLAYGROUND EQUIPMENT 19 ROADWAYS 23 BRIDGES 26 WATER RELATED ASSETS One of the goals outlined
LAMBTON AREA WATER SUPPLY SYSTEM WATER ONTARIO REGULATION 453/07 FINANCIAL PLAN FINANCIAL PLAN #
 LAMBTON AREA WATER SUPPLY SYSTEM WATER ONTARIO REGULATION 453/07 FINANCIAL PLAN FINANCIAL PLAN # 020-301 DECEMBER 17, 2014 CONTENTS Page 1. INTRODUCTION 1.1 Study Purpose 1-1 1.2 Background 1-1 1.2.1
Using Reserves and Reserve Fund Strategies to meet your challenging needs ahead!
 Using Reserves and Reserve Fund Strategies to meet your challenging needs ahead! MFOA, ON September 22, 2016 Dean Decaire, CPA, CA Audit Client Service Partner Joe Filippelli Advisory Services Senior Manager
Statement of Policy. Milwaukee Metropolitan Sewerage District s Private Property Inflow and Infiltration Reduction Program.
 Milwaukee Metropolitan Sewerage District s 2011-2020 Private Property Inflow and Infiltration Reduction Program Introduction Infiltration is the quantity of water entering a sewer system through such sources
WATER AND WASTEWATER FUND REVENUES
 WATER AND WASTEWATER FUND REVENUES Water revenues comprise $12.11 million, or 70.6% of total revenues of the fund, while wastewater (sewer) charges comprise $4.25 million, or 24.7% of total revenues. Water
WATER ASSET MANAGEMENT PLAN
 WATER ASSET MANAGEMENT PLAN Georgetown Charter Township Ottawa County, Michigan November 2017 Where we re going: System Goals INTRODUCTION About this Document This document is our Water Asset Management
ASSET MANAGEMENT PLAN EXECUTIVE SUMMARY
 ASSET MANAGEMENT PLAN EXECUTIVE SUMMARY To ensure our municipal assets are maintained and renewed INDEX in a responsible and financially sustainable manner. 2016 INTRODUCTION Our first Asset Management
South Huron Asset Management Program. Spending the right amount of money, on the right assets, at the right time
 South Huron Asset Management Program Spending the right amount of money, on the right assets, at the right time Current Asset Management Plan Identifies all asset classes with condition data mainly for
Asset Management. Linking Levels of Service and Lifecycle Management Strategies Andrew Grunda Peter Simcisko
 Asset Management Linking Levels of Service and Lifecycle Management Strategies Andrew Grunda Peter Simcisko 1 Introduction Topics that we will address today Review of Ontario Regulation 588/17 Defining
The regulation proposes that municipalities must prepare asset management plans which would meet the requirements of the regulation, such as:
 PROPOSED ASSET MANAGEMENT PLANNING REGULATION BACKGROUND On May 25, 2017, the Ministry of Infrastructure released a proposed regulation under the Infrastructure for Jobs and Prosperity Act, 2015. The proposed
SUBJECT/REPORT NO: Ontario Ministry of Infrastructure Asset Management Plan Requirements (FCS13077/PW13077) (City Wide)
 (City Wide)") TO: Mayor and Members General Issues Committee WARD(S) AFFECTED: CITY WIDE COMMITTEE DATE: October 16, 2013 SUBJECT/REPORT NO: Ontario Ministry of Infrastructure Asset Management Plan Requirements (FCS13077/PW13077)
TO: Mayor and Members General Issues Committee WARD(S) AFFECTED: CITY WIDE COMMITTEE DATE: October 16, 2013 SUBJECT/REPORT NO: Ontario Ministry of Infrastructure Asset Management Plan Requirements (FCS13077/PW13077)
City of Mississauga Municipal Performance Measurements Program (MPMP) Results. For the period ending December 31, 2013
 Results. For the period ending December 31, 2013") City of Mississauga Municipal Performance Measurements Program (MPMP) For the period ending December 31, Prepared by: Finance Division, Corporate Services Department City of Mississauga CITY OF MISSISSAUGA
City of Mississauga Municipal Performance Measurements Program (MPMP) For the period ending December 31, Prepared by: Finance Division, Corporate Services Department City of Mississauga CITY OF MISSISSAUGA
Asset Management Plan
 Town of Unity Water Network Asset Management Plan Scenario 2 Version 1 October 2015 Document Control Document ID: 59 299 140531 nams plus3 amp template v3.1 Rev No Date Revision Details Author Reviewer
District of Clearwater Utility Rate Review
 District of Clearwater 2018 Utility Rate Review Janice Aver May 2018 Table of Contents BACKGROUND... 1 FULL COST OF SERVICE... 2 OPERATIONS... 3 CAPITAL... 5 RESERVES... 10 RATES... 12 RECOMMENDATIONS...
Header Tile ATTACHMENT 2. City of Saskatoon
 Header Tile ATTACHMENT 2 2 Building Better Infrastructure The Administration evaluates the condition of the City s assets in order to develop annual programs to maintain the assets at a minimum cost. Where
Province of Nova Scotia Service Nova Scotia and Municipal Relations
 v214-215.1.1 Province of Nova Scotia Service Nova Scotia and Municipal Relations FINANCIAL INFORMATION RETURN ( as prescribed by the Minister of Service Nova Scotia and Municipal Relations) FOR Municipality
M A N I T O B A ) Order No. 93/09 ) THE PUBLIC UTILITIES BOARD ACT ) June 9, 2009
 Order No. 93/09 ) THE PUBLIC UTILITIES BOARD ACT ) June 9, 2009") M A N I T O B A ) ) THE PUBLIC UTILITIES BOARD ACT ) June 9, 2009 BEFORE: Graham Lane, CA, Chairman Susan Proven, P.H.Ec., Member Monica Girouard, C.G.A., Member REGULATORY REQUIREMENTS - RATE SETTING,
M A N I T O B A ) ) THE PUBLIC UTILITIES BOARD ACT ) June 9, 2009 BEFORE: Graham Lane, CA, Chairman Susan Proven, P.H.Ec., Member Monica Girouard, C.G.A., Member REGULATORY REQUIREMENTS - RATE SETTING,
DRAFT MULTI-YEAR Water and Wastewater & Treatment Budget December 17, ANNUAL UPDATE INVESTING IN OUR FUTURE. london.
 6 MULTI-YEAR BUDGET FOR THE 2019 ANNUAL UPDATE INVESTING IN OUR FUTURE london.ca/budget DRAFT 2019 Water and Wastewater & Treatment Budget December 17, 2018 Table of Contents Recommendations... 1 WATER
70 PINE STREET, BRACEBRIDGE, ONTARIO P1L 1N3 Telephone (705) / Fax (705) / (705 area code)
 / Fax (705) / (705 area code)") 70 PINE STREET, BRACEBRIDGE, ONTARIO P1L 1N3 Telephone (705) 645-2231 / Fax (705) 645-5319 / 1-800-461-4210 (705 area code) www.muskoka.on.ca To: From: Chair and Members Corporate and Emergency Services
70 PINE STREET, BRACEBRIDGE, ONTARIO P1L 1N3 Telephone (705) 645-2231 / Fax (705) 645-5319 / 1-800-461-4210 (705 area code) www.muskoka.on.ca To: From: Chair and Members Corporate and Emergency Services
Capital and Debt. Capital Expenditures 2017 to 2021 Capital Plan. Capital Plan Introduction. PSAB Tangible Capital Asset Five year Capital Plan
 Capital and Debt CAPITAL AND DEBT Capital Expenditures 2017 to 2021 Capital Plan Capital Plan Introduction Asset Management Plans Bringing it all Together The City of Regina is building an asset management
CITY OF GREATER SUDBURY
 CITY OF GREATER SUDBURY WATER & WASTEWATER ASSET MANAGEMENT PLAN City Council Presentation No.4 April 11 th, 2017 PURPOSE WATER AND WASTEWATER ASSET MANAGEMENT PLAN Strategic document to: Guide City s
perthcounty_amp2_d The Asset Management Plan for the County of Perth October 2016
 The Asset Management Plan for the County of Perth October 2016 1 Content Executive Summary... 8 I. Introduction & Context... 9 II. Asset Management...10 III. AMP Objectives and Content...11 IV. Data and
THE FEDERAL GAS TAX FUND
 THE FEDERAL GAS TAX FUND Program Update Eastern Ontario Treasurers Association December 2016 ALL ABOUT THE FEDERAL GAS TAX FUND Page 2 FEDERAL GAS TAX FUND WHICH INFRASTRUCTURE PROJECT CATEGORY IS NOT
Fire. Service Area Asset Management Plan. Town of Whitby. Town of Whitby Fire Service Area Asset Management Plan DECEMBER 2017 ASSET HEALTH GRADE
 Town of Whitby Service Area Asset Management Plan Fire DECEMBER 2017 ASSET HEALTH GRADE A FINANCIAL CAPACITY GRADE D KEY PERFORMANCE INDICATOR = Contents Executive Summary 6 1. Introduction 8 1.1 What
AMP2016. w w w. p u b lii c s e ctt orr di igg ee sst t.. cco o m. The 2016 Asset Management Plan for the Municipality of Grey Highlands
 AMP2016 w w w. p u b lii c s e ctt orr di igg ee sst t.. cco o m The 2016 Asset Management Plan for the Municipality of Grey Highlands SUBMITTED BY THE PUBLIC SECTOR DIGEST INC. (PSD) WWW.PUBLICSECTORDIGEST.COM
WORKSHOP 1: LONG-RANGE FINANCIAL PLANNING
 WORKSHOP 1: LONG-RANGE FINANCIAL PLANNING Tuesday, September 19, 2017 Overview of Today s Session Timeframe Topic/Discussion 20 min What is long-range financial planning and why is it important? 10 min
Grinder Pump Policy Approved by County Council May 11, 2011
 1.0 BACKGROUND Grinder Pump Policy Approved by County Council May 11, 2011 Oxford County (the County ) is responsible for municipally owned water and wastewater services for communities within the County.
Integrated Capital Planning Manual
 0 Integrated Capital Planning Manual August 2017 0 Contents Introduction... 1 Annual Integrated Capital Planning Cycle... 3 Integrated Capital Plan Submission... 8 Business Case Guide and Template... 11
2019 Draft Rate Supported Operating Budget and 2019 Draft Capital Budget and Forecast
 2019 Draft Rate Supported Operating Budget and 2019 Draft Capital Budget and Forecast Joint meeting of the Engineering and Public Works Committee (PW-3-2019) and Finance and Corporate Services Committee
Village of Point Edward Asset Management Plan Page 1
 The existing infrastructure in the Village of Point Edward is aging and deteriorating. Over the next 50 years, much of the infrastructure will require replacement or rehabilitation. The Asset Management
Asset Management Plan - Introduction
 Asset Management Plan - Introduction In 2008 the Town of Oakville made a choice to leverage the PSAB 3150 initiative with a comprehensive Asset Management plan. The Town of Oakville has been integrating
ENGINEERING AND OPERATIONS COMMITTEE. November 27, :30 PM Greenspot Road, Highland CA AGENDA
 ENGINEERING AND OPERATIONS COMMITTEE November 27, 2017-2:30 PM 31111 Greenspot Road, Highland CA 92346 CALL TO ORDER PLEDGE OF ALLEGIANCE PUBLIC COMMENTS NEW BUSINESS AGENDA 1. Approve the September 25,
Water & Sewer Budget Highlights
 2018-2022 Water & Sewer Budget Highlights PRESENTED BY CITY STAFF February 05, 2018 Council Meeting 2018 Water and Sewer Budgets: Background May 2017 Council approves utility rates for water and sewer
The purpose of this report is to present the Oshawa Asset Management Plan for Council endorsement.
 Public Report To: From: Report Number: Council in Committee of the Whole Jag Sharma, City Manager, Office of the City Manager CM-16-35 Date of Report: December 2, 2016 Date of Meeting: December 9, 2016
Request for Proposals Drainage Master Plan
 Request for Proposals 201-15 Drainage Master Plan The City of Dawson Creek invites proposals from qualified professionals or firms to undertake a drainage master plan. This master plan will include an
PIPE / PEDESTRIAN BRIDGE
 PIPE / PEDESTRIAN BRIDGE Public Information CITY OF TRAIL September 14, 2015 Authored by: David Perehudoff, CPA, CGA PIPE / PEDESTRIAN BRIDGE Public Information INTRODUCTION The purpose of this public
C o st - b e n e fi t A n a l ys i s I n n o vat i ve F u n d i n g a n d D e l i v e r y C o s t M a n a g e m e n t
 Honour Roll We w o u l d l i ke t o r e c o g n i z e 9 m u n i c i p a l i t i e s w h o s e a s s e t m a n a g e m e n t w o r k s e t a n e w b a r f o r c a p i t a l p l a n n i n g i n O n t a r
8 th Concession Road Sanitary Sewer Outlet
 Oldcastle Hamlet Sanitary Sewer Servicing 8 th Concession Road Sanitary Sewer Outlet Cost Recovery By-Law Presentation Outline Background Project Cost Recovery Method Terminology North Talbot Road Sanitary
M A N I T O B A ) Order No. 151/08 ) THE PUBLIC UTILITIES BOARD ACT ) November 7, 2008 WATER AND/OR SEWER UTILITIES FINANCIAL REPORTING REQUIREMENTS
 Order No. 151/08 ) THE PUBLIC UTILITIES BOARD ACT ) November 7, 2008 WATER AND/OR SEWER UTILITIES FINANCIAL REPORTING REQUIREMENTS") M A N I T O B A ) ) THE PUBLIC UTILITIES BOARD ACT ) November 7, 2008 BEFORE: Graham Lane, CA, Chairman Monica Girouard, CGA, Member Susan Proven, P.H.Ec., Member WATER AND/OR SEWER UTILITIES FINANCIAL
M A N I T O B A ) ) THE PUBLIC UTILITIES BOARD ACT ) November 7, 2008 BEFORE: Graham Lane, CA, Chairman Monica Girouard, CGA, Member Susan Proven, P.H.Ec., Member WATER AND/OR SEWER UTILITIES FINANCIAL
TERMS OF REFERENCE FOR CONSULTING SERVICES FOR A STORMWATER FUNDING STUDY
 TERMS OF REFERENCE FOR CONSULTING SERVICES FOR A STORMWATER FUNDING STUDY PROJECT OVERVIEW The City of Guelph (City) wishes to retain a consulting engineering firm to complete a Stormwater Funding Study.
ORDINANCE ESTABLISHING STANDARDS FOR REDUCTION OF INFLOW AND INFILTRATION. January, Western Lake Superior Sanitary District Duluth, Minnesota
 ORDINANCE ESTABLISHING STANDARDS FOR REDUCTION OF INFLOW AND INFILTRATION January, 2009 Western Lake Superior Sanitary District Duluth, Minnesota WESTERN LAKE SUPERIOR SANITARY DISTRICT ORDINANCE ESTABLISHING
City Policy & Procedure
 City Policy & Procedure Subject: PUBLIC-PRIVATE PARTNERSHIP (P3) POLICY Policy Number: #1011 Effective: September 3rd, 2014 Purpose: The City of Brandon Public-Private Partnership (P3) Policy intends to
Order No. 49/18 THE CITY OF THOMPSON WATER AND WASTEWATER UTILITY WATER AND WASTEWATER RATES. April 12, 2018
 THE CITY OF THOMPSON WATER AND WASTEWATER UTILITY WATER AND WASTEWATER RATES BEFORE: Irene A. Hamilton, Panel Chair Michael Watson, Member Room 400 330 Portage Avenue Winnipeg, MB R3C 0C4 www.pubmanitoba.ca
CHAPTER 11. CAPITAL FACILITIES PLAN ELEMENT
 CHAPTER 11. CAPITAL FACILITIES PLAN ELEMENT 11.1 INTRODUCTION A is one of eight elements required by the Growth Management Act (GMA) to be included in Yakima County s comprehensive plan. The reason for
Asset Management Program. Background
 Asset Management Program Background The City is responsible for the maintenance and operation of assets valuing $2.8 billion. These assets are critical for the delivery of service levels expected by the
Budget and Financial Controls Policy
 Approved via Resolution 2015-139 Budget and Financial Controls Policy Scope 1. This policy applies to all Town departments, boards, committees, and other organizations falling within the reporting requirements
THE CORPORATION OF THE CITY OF WINDSOR POLICY
 THE CORPORATION OF THE CITY OF WINDSOR POLICY Service Area: Office of the Chief Administrative Officer Policy No.: CR252/2014 Department: Approval Date: October 6, 2014 Division: Corporate Initiatives