MUNICIPALITY OF CHATHAM-KENT CORPORATE SERVICES
|
|
|
- Reynold Briggs
- 6 years ago
- Views:
Transcription
1 MUNICIPALITY OF CHATHAM-KENT CORPORATE SERVICES TO: FROM: Mayor and Members of Council Gerry Wolting, B. Math, CPA, CA General Manager, Corporate Services DATE: January 13, 2014 SUBJECT: 2013 Asset Management Plan RECOMMENDATIONS It is recommended that: 1. Council adopt, in principle, the 2013 Asset Management Plan as outlined in and attached to this report. 2. The financial recommendations in the 2013 Asset Management Plan be referred to the 2014 Budget Process. 3. Other applicable recommendations in the 2013 Asset Management Plan be referred to the respective departments for the development of detailed implementation reports for Council and / or PUC consideration. 4. Council continue to work with senior governments to encourage the implementation of long-term, sustainable infrastructure programs that will lessen the financial burden of asset management on municipalities. BACKGROUND For a number of years now, the Province, the City of Toronto and the Association of Municipalities of Ontario (AMO) have been in discussions regarding the state of municipal infrastructure. A number of working groups were formed to quantify the issue and formulate recommendations for solutions to the challenges of a growing infrastructure deficit. Chatham-Kent had representation on those working groups. Part of the long term solution was the recommendation that all municipalities be required to develop Asset Management Plans (AMP s) in order to document a disciplined and rigorous approach to managing municipal infrastructure. In a competitive infrastructure grant environment, monitoring of AMP s would enable the
2 2013 Asset Management Plan 2 Province, among many other benefits, to avoid penalizing those municipalities that are proactively managing their assets. As a result, the Province of Ontario has mandated that all municipalities have AMP s in place effective January 10, 2014 (the deadline for application to their latest infrastructure grant program). Council approval of the AMP must be in place prior to Provincial approval of the grant application. The AMP s must be made public by May 30, COMMENTS The purpose of this AMP is to meet Provincial requirements and provide a high level view to Council and our community of the state of Chatham-Kent s infrastructure. Detailed implementation reports will still be required in a number of areas to determine specific strategies and approaches to some of the challenges and opportunities identified in this AMP. The first round of AMP s must include the following assets: a) Roads (excluding gravel) b) Bridges and Culverts (with a span of 3 metres or more) c) Social Housing d) Water e) Wastewater Chatham-Kent s 2013 AMP includes the above 5 asset categories. Future AMP s will include the 25 other asset categories that we manage. It should be noted that, although we have significant information on our assets, the information will continue to evolve and this evolution will shape future recommendations. As stated in the AMP, only 2 of the 5 asset categories have actual physical condition data. The other 3 asset categories condition is based on age. Over time, it is imperative that all assets be evaluated based on physical condition rather than age. The attached AMP comprehensively evaluates the five asset categories above by way of answering the following questions: 1) What do we own and where is it? (inventory) 2) What is it worth? (valuation / replacement cost) 3) What is its condition / remaining service life? (function & performance) 4) What needs to be done? (maintain, rehabilitate, replace) 5) When do we need to do it? (useful life analysis) 6) How much will it cost? (investment requirements) 7) How do we ensure sustainability? (long-term financial plan)
3 2013 Asset Management Plan 3 The AMP report is made up of the following sections: a) Executive Summary and Introduction b) State of the Current Infrastructure c) Desired Levels of Service d) Asset Management Strategy e) Financial Strategy Rather than attempt to encapsulate the AMP in this report to Council, readers are encouraged to review the AMP itself. A summary of the AMP recommendations is as follow: Recommendations for the road network: 1. The condition assessment data, along with risk management strategies, continue to be used together to aid in prioritizing overall needs for rehabilitation and replacement. 2. A tailored lifecycle activity framework continue to be evolved as outlined further within the Asset Management Strategy section of this AMP. 3. As approximately 50% of Chatham-Kent s road network is gravel roads, a detailed study be undertaken periodically to assess the overall maintenance costs of gravel roads and whether there is benefit to converting some gravel roads to paved or surface treated roads, thereby reducing future costs. This is further outlined within the Asset Management Strategy section of this AMP. 4. The Infrastructure Report Card be updated on a regular basis. Recommendations for bridges and culverts with a span of 3 metres or more: 1. Over time, the aged based condition assessment data be replaced by actual condition assessments with any associated costs becoming part of the overall requirements. 2. The condition assessment data, along with risk management strategies, continue to be used together to aid in prioritizing overall needs for rehabilitation and replacement. 3. The Infrastructure Report Card be updated on a regular basis. Recommendations for social housing: 1. Continuing to obtain periodic, detailed studies which define the current condition of the social housing facilities and their components (structural, architectural, electrical, mechanical, site, etc.), as described further within the Asset Management Strategy section of this AMP with any associated costs becoming part of the overall requirements. 2. After each study is completed, a new performance age be applied to each asset and an updated current state of the infrastructure analysis be generated. 3. The Infrastructure Report Card be updated on a regular basis. Recommendations for the water network: 1. Over time, the aged based condition assessment data be replaced by actual condition assessments with any associated costs becoming part of the overall requirements.
4 2013 Asset Management Plan 4 2. Once the above work is complete, a new performance age be applied to each water network asset and an updated current state of the infrastructure analysis be generated. 3. The condition assessment data, along with risk management strategies, continue to be used together to aid in prioritizing overall needs for rehabilitation and replacement. 4. The Infrastructure Report Card be updated on a regular basis. Recommendations for the sanitary network: 1. Over time, the aged based condition assessment data be replaced by actual condition assessments with any associated costs becoming part of the overall requirements. 2. Once the above work is complete, a new performance age be applied to each water network asset and an updated current state of the infrastructure analysis be generated. 3. The condition assessment data, along with risk management strategies, continue to be used together to aid in prioritizing overall needs for rehabilitation and replacement. 4. The Infrastructure Report Card be updated on a regular basis. Financial recommendations for tax funded asset categories (roads, bridges & large culverts, social housing): Over time, full funding requires a combination of tax increases and cost reductions equivalent to a 3.3% increase in taxes. We recommend this be achieved over 10 years by: 1. When realized, reallocating the debt cost reductions of $2,875,000 to the infrastructure deficit. 2. Allocating $633,000 of the 2014 assessment growth revenue to offset the decrease in gas tax revenue of $633, Increasing tax revenues by 0.33% each year for the next 10 years solely for the purpose of phasing in full funding to the asset categories covered in this section of the AMP. 4. Continuing to allocate 25% of the gas tax revenue to the paved roads category and 75% to bridges. 5. Increasing existing and future infrastructure budgets by the applicable inflation index on an annual basis in addition to the deficit phase-in. Financial recommendations for rate funded asset categories (water, sanitary): Over time, full funding requires a combination of rate increases and cost reductions equivalent to a 52.7% increase in sanitary rates and a 59.4% increase to water rates. We recommend this be achieved over 15 years by: 1. Increasing rate revenues by 3.5% for sanitary services and 4.0% for water services each year for the next 15 years solely for the purpose of phasing in full funding to the asset categories covered in this section of the AMP. 2. Increasing existing and future infrastructure budgets by the applicable inflation index on an annual basis in addition to the deficit phase-in.
5 2013 Asset Management Plan 5 How does Chatham-Kent compare to other municipalities? When reviewing Chatham-Kent s AMP, an obvious question becomes How do Chatham-Kent s AMP results compare to other municipalities? We have been able to gain access to a significant amount of information in this regard and will be presenting it at the Council meeting that this report is scheduled for. What is the bottom line in terms of service and affordability to Chatham-Kent of these 5 asset categories? As detailed in the AMP, the following scorecard applies to these 5 asset categories: 2013 Asset Management Plan Grading Results Entity Asset Categories Covered Condition vs Performance Score Funding vs Need Score Combined Score Roads B+ C C+ Chatham-Kent Bridges & Large Culverts C C C Social Housing C+ C C Chatham-Kent Overall C+ C C Chatham-Kent PUC Water Network Sewer Network PUC Overall C C C F F F F F F COMBINED All 5 listed above C+ F D+ In terms of service, as outlined in the AMP, the only asset category that currently requires divestment unless significant, immediate funding decisions are made is the bridge & large culvert category. As outlined in the AMP, if this category s infrastructure gap is not addressed immediately, the inventory will have to be reduced as follows: a) If funding remains at present levels, 44 (of 827) structures would have to be divested over the next 10 years. b) If the equivalent of 1% tax increases per year for 5 years is applied to the deficit (approximately $1.3M), 29 structures would have to be divested over the next 10 years. c) If the equivalent of 0.33% tax increases per year for 5 years is applied to the deficit, 39 structures would have to be divested over the next 10 years. d) If there s no desire for divestment of bridge & large culvert inventory, as of 2013 there is a one-time $26.5M accumulated funding deficit that must be addressed. In terms of affordability, the above divestment overview will grow to other asset categories if Chatham-Kent and Chatham-Kent PUC do not or cannot implement, over the near future, a combination of revenue increases and cost saving measures to eliminate the infrastructure deficits identified in the AMP. COUNCIL STRATEGIC DIRECTIONS The recommendation in this report supports the following Council Directions: Healthy, Active Citizens Growth Through Variety of Post-Secondary Institutions
6 2013 Asset Management Plan 6 High Quality Environment Through Innovation Destination Chatham-Kent! Magnet for Sustainable Growth Prosperous and Thriving Community Has the potential to support all Council Directions Neutral issues (does not support negatively or positively) CONSULTATION The AMP was developed by internal staff. Senior staff from Infrastructure & Engineering Services, Social Housing, PUC, Finance and Budget were involved in developing the AMP. Significant information was obtained through recent reports to Council on infrastructure matters and through existing, detailed consultant reports on the assets covered by the AMP. FINANCIAL IMPLICATIONS The financial implications are outlined in detail on page 4 and 5 of this report. For the PUC, full funding requires a combination of rate increases and cost reductions equivalent to a 52.7% increase in sanitary rates and a 59.4% increase in water rates. We are recommending that the PUC phase this in over 15 years. The PUC will be considering these recommendations at one of their future meetings. For the municipality, full funding for the 3 asset categories covered by the AMP requires a combination of tax increases and cost reductions equivalent to a 3.3% increase in taxes. We are recommending this be phased in over 10 years. Future AMP s will incorporate the remaining 25 asset categories that the municipality manages. Initial estimates are that full funding for those additional categories will require a combination of tax increases and cost reductions equivalent to a further 6.0% increase in taxes phased in over time. The 2014 budget will include recommendations for Council to consider. Service impacts of not closing the infrastructure gap are summarized on page 5 of this report and detailed in the AMP. Although the need to achieve full funding is required by the Province s AMP guidelines, it is unclear as to how this goal will be measured or utilized. This information should become clearer over the near future. Prepared by: Gerry Wolting, B. Math, CPA, CA General Manager Corporate Services
7 2013 Asset Management Plan 7 Attachment: Municipality of Chatham-Kent 2013 Asset Management Plan P:\RTC\Corp Services - Admin\2014\2013 Asset Management Plan.doc
8 Municipality of Chatham-Kent 2013 Asset Management Plan Roads, Bridges (with span of 3 metres or more), Social Housing, Water & Wastewater
9 Table of Contents Contents Table of Contents Executive Summary Introduction Importance of Infrastructure Asset Management Plan (AMP) - Relationship to Strategic Plan AMP - Relationship to other Plans Purpose and Methodology State of the Infrastructure (SOTI) Objective and Scope Approach Base Data Asset Deterioration Review Identify Sustainable Investment Requirements Asset Rating Criteria Infrastructure Report Card General Methodology and Reporting Approach Road Network Infrastructure Road Network What do we own? What is it worth? What condition is it in? What do we need to do to it? When do we need to do it? How much money do we need? How do we reach sustainability? Recommendations Gravel Roads Maintenance Requirements Introduction Maintaining a Good Cross Section Grading Operations Good Surface Gravel Dust Abatement and stabilization The Cost of Maintaining Gravel Roads Minnesota Study (2005) South Dakota study (2004) Ontario Municipal Benchmarking Initiative (OMBI) Conclusion Note re new gravel: Bridges & Culverts Bridges & Culverts 3 metres or more
10 3.5.1 What do we own? What is it worth? What condition is it in? What do we need to do to it? When do we need to do it? How much money do we need? How do we reach sustainability? Recommendations Social Housing Social Housing What do we own? What is it worth? What condition is it in? What do we need to do to it? When do we need to do it? How much money do we need? How do we reach sustainability? Recommendations Water Network Water Network What do we own? What is it worth? What condition is it in? What do we need to do to it? When do we need to do it? How much money do we need? How do we reach sustainability? Recommendations Sanitary network Sanitary Network What do we own? What is it worth? What condition is it in? What do we need to do to it? When do we need to do it? How much money do we need? How do we reach sustainability? Recommendations Infrastructure Report Card Desired Levels of Service Key factors that influence a level of service: Strategic and Corporate Goals Legislative Requirements Expected Asset Performance Community Expectations Availability of Finances
11 5.2 Key Performance Indicators Transportation Services Service Description Scope of Services Performance Indicators Social Housing Service Description Scope of Services Performance Indicators Water / Sanitary Networks Service Description Scope of services Performance Indicators Asset Management Strategy Objective Non-Infrastructure Solutions and Requirements Condition Assessment Programs Pavement Network Inspections Bridges & Culverts (span of 3 metres or more) Inspections Facility Inspections (Housing) Sanitary Network Inspections Water network inspections AM Strategy Lifecycle Analysis Framework Paved Roads Gravel Roads Sanitary Network Bridges & Culverts (span of 3 metres or more) Housing Water Network Growth and Demand Project Prioritization Risk Matrix and Scoring Methodology Financial Strategy General overview of financial plan requirements Financial information relating to Chatham-Kent s AMP Funding objective Tax funded assets Current funding position Recommendations for full funding Rate funded assets Current funding position Recommendations for full funding Use of debt Use of reserves Available reserves Recommendation
12 8.0 Report Card Calculations Appendices
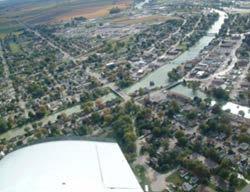
13 1.0 Executive Summary The performance of a community s infrastructure provides the foundation for its economic development, competitiveness, prosperity, reputation and the overall quality of life for its residents. Reliable and wellmaintained infrastructure assets are essential for the delivery of critical core services for the citizens of a municipality. A technically precise and financially rigorous asset management plan, diligently implemented, will mean that sufficient investments are made to ensure delivery of sustainable infrastructure services to current and future residents. The plan will also indicate the respective financial obligations required to maintain this delivery at established levels of service. This Asset Management Plan (AMP) for Chatham-Kent meets all requirements as outlined within the provincial Building Together Guide for Municipal Asset Management Plans. It should serve as a strategic, tactical and financial document, ensuring the management of municipal infrastructure follows sound asset management practices and principles, while optimizing available resources and establishing desired levels of service. Given the expansive financial and social impact of asset management on both a municipality and its citizens, it is critical that senior decision-makers are strategically involved. This AMP covers the five asset categories currently required by the Province, namely: 1. Roads (excluding gravel) 2. Bridges & large culverts (span of 3 metres or more) 3. Social housing 4. Water network 5. Wastewater network Measured in 2012 dollars, the replacement value of the asset classes analyzed total almost $3 billion. Future plans will incorporate the 25+ other categories of assets that Chatham-Kent manages Replacement Value by Asset Class Total: $2,920,207,000 Sanitary Sewer Network $482,046,000 16% Social Housing $84,176,000 3% Road Network $1,197,934,000 41% Water Network $556,051,000 19% Bridges & Large Culverts $600,000,000 21% 6
 analysis was conducted for each of the asset classes to determine the financial obligation of each household in sharing the replacement cost of Chatham-Kent s")
14 While Chatham-Kent is responsible for the strategic direction, it is the taxpayer in Chatham-Kent who ultimately bears the financial burden. As such, a cost per household (CPH) analysis was conducted for each of the asset classes to determine the financial obligation of each household in sharing the replacement cost of Chatham-Kent s assets. Such a measurement can serve as an excellent communication tool for both administration and Council in communicating the importance of asset management to citizens. The diagram below illustrates the total CPH, as well as the CPH for individual asset classes. In assessing Chatham-Kent s state of the infrastructure, we examined, and graded, both the current condition (Condition vs. Performance) of the asset classes as well as Chatham-Kent s current financial Infrastructure Replacement Cost Per Household Total: $72,500 per household Road Network (excludes gravel) Total Replacement Cost: $1,197,934,000 Cost Per Household: $25,400 Sanitary network Total Replacement Cost: $482,046,000 Cost Per Household: $16,900 Social Housing Total Replacement Cost: $84,176,000 Cost Per Household: $1,800 Water Network Total Replacement Cost: $556,051,000 Cost Per Household: $15,700 Bridges & Culverts Total Replacement Cost: $600,000,000 Cost Per Household: $12,700 commitment to fund the assets average annual requirement for sustainability (Funding vs. Need). We then generated Chatham-Kent s infrastructure report card as summarized by the following table (see section 4.0 for details) Asset Management Plan Grading Results Entity Asset Categories Covered Condition vs Performance Score Funding vs Need Score Combined Score Roads B+ C C+ Chatham-Kent Bridges & Large Culverts C C C Social Housing C+ C C Chatham-Kent Overall C+ C C Chatham-Kent PUC Water Network Sewer Network PUC Overall C C C F F F F F F Combined All 5 listed above C+ F D+ In order for an AMP to be effectively put into action, it must be integrated with financial planning and longterm budgeting. We have developed scenarios that would enable Chatham-Kent and Chatham-Kent PUC to achieve full funding within 5, 10 or 15 years. 7
15 Municipality of Chatham-Kent: The average annual investment requirement for paved roads, bridges & large culverts and social housing is $26,106,000. Annual revenue currently allocated to these assets is $18,904,000 leaving an annual deficit of $7,202,000. To put it another way, these infrastructure categories are currently funded at 72% of their longterm requirements. Chatham-Kent has annual tax revenues of $132,000,000 in Over the next 10 years, debt costs for these three asset categories will be decreasing by $2,875,000. Net of this cost decrease being allocated to the deficit, full funding would require an increase in tax revenue of 3.3% over time. We recommend, with key qualifications (see the Financial Strategy section for a full discussion) the 10 year option which involves full funding being achieved over 10 years by: a) when realized, reallocating the debt cost reductions of $2,875,000 to the infrastructure deficit as outlined above. b) allocating $633,000 of the 2014 assessment growth revenue to offset the decrease in gas tax revenue of $633,000. c) increasing tax revenues by 0.33% each year for the next 10 years solely for the purpose of phasing in full funding to the asset categories covered in this section of the AMP. d) continuing to allocate 25% of the gas tax revenue to the paved roads category and 75% to bridges. e) increasing existing and future infrastructure budgets by the applicable inflation index on an annual basis in addition to the deficit phase-in. In terms of service, as outlined in this report, the only asset category that currently requires divestment unless significant, immediate funding decisions are made is the bridge & large culvert category. If this category s infrastructure gap is not addressed immediately, the inventory will have to be reduced as follows: a) if funding remains at present levels, 44 (of 827) structures would have to be divested over the next 10 years. b) if the equivalent of 1% tax increases per year for 5 years are applied to the deficit (approximately $1.3M), 29 structures would have to be divested over the next 10 years. c) if the equivalent of 0.33% tax increases per year for 5 years are applied to the deficit, 39 structures would have to be divested over the next 10 years. d) if there s no desire for divestment of bridge & large culvert inventory, as of 2013 there is a one-time $26.5M accumulated funding deficit that must be addressed. Chatham-Kent PUC: The average annual investment requirement for the water network and sanitary network is $22,452,000. Annual revenue currently allocated to these assets is $4,660,000 leaving an annual deficit of $17,792,000. To put it another way, these infrastructure categories are currently funded at 21% of their long-term requirements. Chatham-Kent PUC has annual sanitary revenues of $9,418,000 and annual water revenues of $13,034,000 in Full funding would require an increase in sanitary revenues of 52.7% over time and for water revenues, 59.4% over time. We recommend, with key qualifications (see the Financial Strategy section for a full discussion) the 15 year option which involves full funding being achieved over 15 years by: a) increasing rate revenues by 3.5% for sanitary services and 4.0% for water services each year for the next 15 years solely for the purpose of phasing in full funding to the asset categories covered in this section of the AMP. b) increasing existing and future infrastructure budgets by the applicable inflation index on an annual basis in addition to the deficit phase-in. Municipality of Chatham-Kent and Chatham-Kent PUC: As outlined in this report, physical condition data is presently available for roads and social housing. For bridges & large culverts, the water network and sanitary network, age based condition data was used. Due to the significant benefits of physical condition data, over time Chatham-Kent and Chatham-Kent PUC should accumulate this data for all of their asset categories. 8
16 2.0 Introduction This Asset Management Plan meets all provincial requirements as outlined within the Ontario Building Together Guide for Municipal Asset Management Plans. As such, the following key sections and content are included: 1. Executive Summary and Introduction 2. State of the Current Infrastructure 3. Desired Levels of Service 4. Asset Management Strategy 5. Financial Strategy The following asset classes are addressed: 1. Road Network: Paved roads. As noted in this report, gravel roads are considered a perpetual maintenance asset category and, as such, are not included 2. Bridges & Culverts: Bridges and large culverts with a span of 3 metres or more 3. Social Housing: Facilities structure, interior, exterior, mechanical / electrical and site components 4. Water Network: Water mains, hydrants and valves, facilities 5. Sanitary network: Sanitary sewer mains, manholes, facilities The Province is encouraging municipalities to cover all asset classes in future iterations of their AMP s. In Chatham-Kent s case, an additional 25 asset categories will have to be incorporated into future AMP s. This asset management plan should serve as a strategic, tactical, and financial document ensuring the management of the municipal infrastructure follows sound asset management practices and principles, while optimizing available resources and establishing desired levels of service. At a strategic level, within the State of the Current Infrastructure section, it will identify current and future challenges that should be addressed in order to maintain sustainable infrastructure services on a long-term, lifecycle basis. It will outline a Desired Level of Service (LOS) Framework for each asset category to assist the development and tracking of LOS through performance measures across strategic, financial, tactical, operational, and maintenance activities within the organization. At a tactical level, within the Asset Management Strategy section, it will develop an implementation process to be applied to the needs-identification and prioritization of renewal, rehabilitation, and maintenance activities, resulting in a 10 year plan that will include growth projections. At a financial level, within the Financial Strategy section, a strategy will be developed that fully integrates with other sections of this asset management plan, to ensure delivery and optimization of the long term infrastructure budget. Future work should allow for continuous improvement of the plan and its projections. It is therefore recommended that the plan be revisited and updated on a regular basis (recommended to be once per term of Council), particularly as more detailed information becomes available. 2.1 Importance of Infrastructure Municipalities throughout Ontario, large and small, own a diverse portfolio of infrastructure assets that in turn provide a varied number of services to their citizens. The infrastructure, in essence, is a conduit for the various public services Chatham-Kent provides, e.g., the roads supply a transportation network service; the water infrastructure supplies a clean drinking water service. A community s prosperity, economic development, competitiveness, image, and overall quality of life are inherently and explicitly tied to the performance of its infrastructure. 9
17 2.2 Asset Management Plan (AMP) - Relationship to Strategic Plan The major benefit of strategic planning is the promotion of strategic thought and action. A strategic plan spells out where an organization wants to go, how it s going to get there, and helps decide how and where to allocate resources, ensuring alignment to the strategic priorities and objectives. It will help identify priorities and guide how municipal tax dollars and revenues are spent into the future. The strategic plan usually includes a vision and mission statement, and key organizational priorities with alignment to objectives and action plans. Given the growing economic and political significance of infrastructure, the asset management plan will become a significant component of most municipal strategic plans, influencing corporate priorities, objectives, and actions. 2.3 AMP - Relationship to other Plans An asset management plan is a key component of Chatham-Kent s planning process linking with multiple other corporate plans and documents. For example: The Official Plan The AMP should utilize and influence the land use policy directions for long-term growth and development as provided through the Official Plan. Long Term Financial Plan The AMP should both utilize and conversely influence the financial forecasts within the longterm financial plan. Capital Budget The decision framework and infrastructure needs identified in the AMP form the basis on which future capital budgets are prepared. Infrastructure Master Plans The AMP will utilize goals and projections from infrastructure master plans and in turn will influence future master plan recommendations. By-Laws, standards, and policies The AMP will influence and utilize policies and by-laws related to infrastructure management practices and standards. Regulations The AMP must recognize and abide by industry and senior government regulations. Business Plans The service levels, policies, processes, and budgets defined in the AMP are incorporated into business plans as activity budgets, management strategies, and performance measures. 10
18 2.4 Purpose and Methodology The following diagram depicts the approach and methodology, including the key components and links between those components that embody this asset management plan: INFRASTRUCTURE STRATEGIC PLAN Strategic Plan Goals, Asset Performance & Community Expectations, Legislated Requirements Are levels of service achievable? STATE OF THE CURRENT INFRASTRUCTURE REPORTS Asset Inventory, Valuation, Current Condition/Performance, Sustainable Funding Analysis EXPECTED LEVELS OF SERVICE Key Performance Indicators, Performance Measures, Public Engagement ASSET MANAGEMENT STRATEGY Lifecycle Analysis, Growth Requirements, Risk Management, Project Prioritization Methodologies FINANCING STRATEGY Available Revenue Analysis, Develop Optional Scenarios, Define Optimal Budget & Financial Plan AMP PERFORMANCE REPORTING Project Implementation, Key Performance Measures Tracked, Progress Reported to Senior Management & Council It can be seen from the above that a municipality s infrastructure planning starts at the corporate level with ties to the strategic plan, alignment to the community s expectations, and compliance with industry and government regulations. Then, through the State of the Infrastructure analysis, overall asset inventory, valuation, condition and performance are reported. In this initial AMP, due to a lack of current condition data for the majority of asset classes, present performance and condition are sometimes estimated by using the current age of the asset in comparison to its overall useful design life. The exception in Chatham-Kent s case is its roads and social housing infrastructure for which assessed condition data is used for further analysis. In future updates to this AMP, accuracy of reporting will be significantly increased through the use of holistically captured condition data. Also, a lifecycle analysis of needs for each infrastructure class is conducted. This analysis yields the sustainable funding level, compared against actual current funding levels, and determines whether there is a funding surplus or deficit for each infrastructure program. The overall measure of condition and available funding is finally scored for each asset class and presented as a star rating (similar to the hotel star rating) and a letter grade (A-F) within the Infrastructure Report card. 11
19 From the lifecycle analysis above, Chatham-Kent gains an understanding of the level of service provided today for each infrastructure class and the projected level of service for the future. The next section of the AMP provides a framework for a municipality to develop a Desired Level of Service (or target service level) and develop performance measures to track the year-to-year progress towards this established target level of service. The Asset Management Strategy then provides a detailed analysis for each infrastructure class. Included in this analysis are best practices and methodologies from within the industry which can guide the overall management of the infrastructure in order to achieve the desired level of service. This section also provides an overview of condition assessment techniques for each asset class; lifecycle interventions required, including those interventions that yield the best return on investment; and prioritization techniques, including risk quantification, to determine which priority projects should move forward into the budget first. The Financing Strategy then fully integrates with the asset management strategy and asset management plan, and provides a financial analysis that optimizes the 10 year infrastructure budget. All revenue sources available are reviewed, such as the tax levy, debt allocations, rates, reserves, grants, gas tax, development charges, etc., and necessary budget allocations are analysed to inform and deliver the infrastructure programs. Finally, in subsequent updates to this AMP, actual project implementation will be reviewed and measured through the established performance metrics to quantify whether the desired level of service is achieved or achievable for each infrastructure class. If shortfalls in performance are observed, these will be discussed and alternate financial models or service level target adjustments will be presented. 12
20 3.0 State of the Infrastructure (SOTI) 3.1 Objective and Scope Objective: To identify the state of Chatham-Kent s infrastructure today and the projected state in the future if current funding levels and management practices remain status quo. The analysis and subsequent communication tools will outline future asset requirements, will start the development of tactical implementation plans, and ultimately assist the organization to provide cost effective sustainable services to the current and future community. The approach was based on the following key industry state of the infrastructure documents: Canadian Infrastructure Report Card Municipality of Hamilton s State of the Infrastructure reports Other Ontario Municipal State of the Infrastructure reports The above reports are themselves based on established principles found within key, industry best practices documents such as: The National Guide for Sustainable Municipal Infrastructure (Canada) The International Infrastructure Management Manual (Australia / New Zealand) American Society of Civil Engineering Manuals (U.S.A.) Scope: Within this State of the Infrastructure report, a high level review will be undertaken for the following asset classes: 1. Road Network: Paved and surface treated roads. As noted in the AMP, gravel roads are considered a perpetual maintenance asset category and, as such, are not included 2. Bridges & Culverts: Bridges and large culverts with a span of 3 metres or more 3. Social Housing: Facilities structure, interior, exterior, mechanical / electrical and site components 4. Water Network: Water mains, hydrants and valves, facilities 5. Sanitary network: Sanitary sewer mains, manholes, facilities 3.2 Approach The asset classes above were reviewed at a very high level due to the nature of data and information available. Subsequent detailed reviews of this analysis are recommended on a regular basis, as more detailed conditions assessment information becomes available for each infrastructure program Base Data In order to understand the full inventory of infrastructure assets within Chatham-Kent, all tangible capital asset data, as collected to meet the PSAB 3150 accounting standard, was reviewed. Over time, this data base will provide a detailed and summarized inventory of assets as used throughout the analysis within this report and the entire Asset Management Plan Asset Deterioration Review Chatham-Kent can supply actual condition data for the entire paved road network and its social housing infrastructure. Actual condition data recalculates a more accurate performance age for each individual asset and, as such, an accurate prediction of future replacement can be established and applied to the future investment requirements within this AMP report. 13
21 For those assets without condition data, the deterioration review will rely on the straight line amortization schedule approach provided from the accounting data. Although this approach is based on age data and useful life projections, and is not as accurate as the use of detailed condition data, it does provide a relatively reliable benchmark of future requirements Identify Sustainable Investment Requirements A gap analysis was performed to identify sustainable investment requirements for each asset category. Information on current spending levels and budgets was acquired, future investment requirements were calculated, and the gap between the two was identified Asset Rating Criteria Each asset category will be rated on two key dimensions: Condition vs. Performance: Based on the condition of the asset today and how well it performs its function. Funding vs. Need: Based on the actual investment requirements to ensure replacement of the asset at the right time, versus current spending levels for each asset group Infrastructure Report Card The dimensions above will be based on a simple 1 5 star rating system, which will be converted into a letter grading system ranging from A-F. An average of the two ratings will be used to calculate the combined rating for each asset class. Grading Scale: Condition vs. Performance What is the condition of the asset today and how well does it perform its function? Star Rating Letter Grade Color Indicator Description A Excellent: No noticeable defects B Good: Minor deterioration C Fair: Deterioration evident, function is affected D Poor: Serious deterioration. Function is inadequate F Critical: No longer functional. General or complete failure Grading Scale: Funding vs. Need Based on the actual investment requirements to ensure replacement of the asset at the right time, versus current spending levels for each asset group. Star Rating Letter Grade Description A Excellent: 91 to 100% of need B Good: 76 to 90% of need C Fair: 61 to 75% of need D Poor: 46 60% of need F Critical: under 45% of need 14
22 3.2.6 General Methodology and Reporting Approach The report will be based on the seven key questions of asset management as outlined within the National Guide for Sustainable Municipal Infrastructure: What do you own and where is it? (inventory) What is it worth? (valuation / replacement cost) What is its condition / remaining service life? (function & performance) What needs to be done? (maintain, rehabilitate, replace) When do you need to do it? (useful life analysis) How much will it cost? (investment requirements) How do you ensure sustainability? (long-term financial plan) The above questions will be answered for each individual asset category in the following report sections. 15

23 3.3 Road Network 3.3 Road Network Infrastructure C+ INFRASTRUCTURE REPORT CARD GRADE 16
24 3.3 Road Network Note: The financial analysis in this section includes paved and surface treated roads. Gravel roads are excluded from the capital replacement analysis as, by their nature, they require perpetual maintenance activities and funding. Chatham-Kent uses Road Analytic s pavement management system. The condition of all roads is evaluated at least every 3 years and uploaded into the system What do we own? As shown in the table in section 3.3.3, the entire network comprises 2,930 lane km of paved roads and 426 lane km of surface treated roads for a total of 3,356 lane km of roads. The table below breaks the road network into its component parts Replacement Cost Valuation Method Useful Life In Years Asset Category Roadways Curbs 19,617,943 NRBCPI 40 Road Surface 343,406,978 NRBCPI 15 Roadway - Collector 460,099,374 NRBCPI 30 Roadway- Arterial 153,459,042 NRBCPI 40 Roadway-Local 221,350,608 NRBCPI 50 1,197,933, What is it worth? The estimated replacement value of the road network, in 2012 dollars, is approximately $1.198 billion. As noted previously, this does not include gravel roads. The replacement cost per household for the road network is $25,400 based on 47,200 households What condition is it in? As mentioned above, Chatham-Kent uses Road Analytic s pavement management system to evaluate and manage the conditions of all roads (excluding gravel). Roads are evaluated at least every 3 years and uploaded into the system. Road performance is measured using a surface distress index rating (SDI). The rating given is from a range of 0 to 10 with 10 being the best. To optimize costs, industry standards say that the average SDI rating of a road network should be Chatham-Kent s goal is an average SDI rating of
25 The following chart summarizes the present condition of the road system covered by this AMP: Number of KM's in SDI Category Asphalt ASPHALT Road Class Total kms % by km Avg SDI Rural asphalt arterial % 8.1 collector % 7.8 local % 7.8 Rural asphalt total , % 7.9 Urban asphalt alley % 6.6 arterial % 7.4 collector % 7.6 local % 7.6 Urban asphalt total % 7.6 Grand Total Asphalt lane kms , , % 7.8 % by SDI (rural & urban asphalt) 0.0% 0.0% 0.0% 0.3% 4.8% 14.2% 16.2% 11.4% 17.1% 36.0% 0.0% Number of KM's in SDI Category BST SURFACE TREATED Road Class Total kms % by km Avg SDI Rural surface treated arterial % 7.0 collector % 6.9 local % 7.1 Rural surface treated total % 7.0 Urban surface treated alley % 5.9 arterial % 5.5 collector % 6.6 local % 6.9 Urban surface treated total % 6.8 Grand Total Surface Treated lane kms % 7.0 % by SDI (rural & urban ST roads) 0.0% 0.0% 0.0% 0.0% 3.7% 17.7% 21.5% 43.5% 13.6% 0.0% 0.0% System Grand Total kms (asphalt + ST) , , % 7.7 System %SDI (asphalt + ST) 0.0% 0.0% 0.0% 0.2% 4.6% 14.7% 16.9% 15.4% 16.6% 31.5% 0.0% asphalt = 87% of System Total ST = 13% of System Total As illustrated above, the current average SDI rating for Chatham-Kent s road network is 7.7. Based on the SDI target of 7.0, 64% of roads are in excellent condition, 31% in good condition, 5% in fair condition and 0% in poor or critical condition. At the current funding level, the average SDI rating will decrease from 7.7 to 5.8 over 10 years. It should be noted that in 2000, Chatham-Kent s average SDI rating was 8.0. Based on the above ratings, the obvious question becomes How are Chatham-Kent s roads achieving a 7.7 SDI rating when the road network is underfunded? The reason for this is prior years use of one-time funds by way of reserves, grants and debt. Going forward, remaining road reserves are minimal, grant possibilities are being prioritized on the bridge network and, since 2009, we have committed to a pay as you go philosophy wherever possible. Based on the above, Chatham-Kent scores a Condition vs. Performance rating of B What do we need to do to it? There are generally four distinct phases in an asset s lifecycle that require specific types of attention and lifecycle activity. These are presented at a high level for the road network below. Further detail is provided in the Asset Management Strategy section of this AMP. Addressing Asset Needs Phase Lifecycle Activity Asset Life Stage Minor maintenance Major maintenance Rehabilitation Activities such as inspections, monitoring, sweeping, winter control, etc. Activities such as repairing pot holes, grinding out roadway rutting, and patching sections of road. Rehabilitation activities such as asphalt overlays, mill and paves, etc. 1 st Qtr & ongoing 2 nd Qtr 3 rd Qtr Replacement Full road reconstruction 4 th Qtr 18
26 3.3.5 When do we need to do it? For the purpose of this report, useful life data for each asset class is outlined in section above. A combination of this useful life and actual asset condition is used to determine replacement needs of individual assets. These needs are calculated and quantified as part of the overall financial requirements How much money do we need? The analysis completed to determine capital revenue requirements was based on the following constraints and assumptions: 1. Replacement costs are based upon the unit costs identified within the What is it worth section. 2. The timing for individual road replacement was defined by the condition rating as described in the What condition is it in? section. 3. All values are presented in (2012) dollars How do we reach sustainability? Based upon the above parameters, the average annual investment required to sustain Chatham-Kent s road network is approximately $13,000,000. Based on the current annual funding of $9,451,000, there is an annual deficit of $3,549,000. As such, Chatham-Kent received a Funding vs. Need rating of C. In conclusion, based on field condition data, on average the road network meets service level targets. As such, there is no backlog of needs that must be addressed immediately. As stated above, the obvious question becomes How are Chatham-Kent s roads achieving a 7.7 SDI rating when the road network is underfunded? The reason for this is prior years use of one time funds by way of reserves, grants and debt. Going forward, remaining road reserves are minimal, grant opportunities are being prioritized on the bridge network and, since 2009, we have committed to a pay as you go philosophy wherever possible. The condition assessment data, along with risk management strategies, should continue to be reviewed together to aid in prioritizing overall needs for rehabilitation and replacement and assist with optimizing the long and short term budgets. Further detail is outlined within the asset management strategy section of this AMP Recommendations Chatham-Kent received an overall rating of C+ for its road network, calculated from the Condition vs. Performance and the Funding vs. Need ratings. Accordingly, we recommend the following: 1. The condition assessment data, along with risk management strategies, continue to be used together to aid in prioritizing overall needs for rehabilitation and replacement. 2. A tailored lifecycle activity framework continue to be evolved as outlined further within the Asset Management Strategy section of this AMP. 3. As approximately 50% of Chatham-Kent s road network is gravel roads, a detailed study be undertaken periodically to assess the overall maintenance costs of gravel roads and whether there is benefit to converting some gravel roads to paved or surface treated roads, thereby reducing future costs. This is further outlined within the Asset Management Strategy section of this AMP. 4. The Infrastructure Report Card be updated on a regular basis. 19
27 3.4 Gravel Roads Maintenance Requirements Introduction Paved roads are usually designed and constructed with careful consideration given to the correct shape of the cross section. Once paving is complete, the roadway will keep its general shape for the duration of its useful life. Gravel roads are quite different. Some have poor base construction, will be prone to wheel track rutting in wet weather and traffic will continually displace gravel from the surface to the shoulder area, even the ditch, during wet and dry weather. Maintaining the shape of the road surface and shoulder is essential to ensure proper performance and to provide a sufficient level of service for the public. Therefore, the management of gravel roads is not through major rehabilitation and replacement, but rather through good perpetual maintenance and some minor rehabilitation which depends on a few basic principles: proper techniques and cycles for grading; the use and upkeep of good surface gravel; and dust abatement and stabilization Maintaining a Good Cross Section In order to maintain a gravel road properly, a good cross section is required consisting of a crowned driving surface, a shoulder with correct slope, and a ditch. The crown of the road is essential for good drainage. A road with no crown, or insufficient crown, will cause water to collect on the surface during a rainfall, will soften the crust and ultimately lead to rutting which will become severe if the subgrade also softens. Even if the subgrade remains firm, traffic will cause depressions in the road where water collects and the road will develop potholes. It is a generally accepted industry standard that 1.25cm per 12cm (one foot), approximately 4%, on the cross slope is ideal for road crown. The road shoulder serves some key functions. It supports the edge of the travelled portion of the roadway, provides a safe area for drivers to regain control of vehicles if they are forced to leave the road, and finally, carries water further away from the road surface. The shoulder should ideally meet the edge of the roadway at the same elevation and then slope away gradually towards the ditch. The ditch is the most important and common drainage structure for gravel roads. Every effort should be made to maintain a minimal ditch. The ditch should be kept free of obstructions such as eroded soil, vegetation or debris Grading Operations Routine grading is the activity that ensures gravel roadways maintain a good cross section or proper profile. The three key components to good grading are: operating speed, blade angle, and blade pitch. Excessive operating speed can cause many problems such as inconsistent profile, and blade movement or bouncing that can cut depressions and leave ridges in the road surface. It is generally accepted that grader speed should not exceed 8km per hour. The angle of the blade is also critical for good maintenance and industry standards suggest the optimal angle is between 30 and 45 degrees. Finally, the correct pitch or tilt of the blade is very important. If the blade is pitched back too far, the material will tend to build up in front of the blade and will not fall forward, which mixes the materials, and will move along and discharge at the end of the blade Good Surface Gravel Once the correct shape is established on a roadway and drainage matters are taken care of, attention must be given to the placement of good gravel. Good surface gravel requires a percentage of stone which gives strength to support loads, particularly in wet weather. It also requires a percentage of sand size particles to fill the voids between the stones which provide stability. And finally, a percentage of plastic fines are needed to bind the material together which allows a gravel road to form a crust and shed water. Typical municipal maintenance routines will include activities to ensure a good gravel surface through both spot repairs (often annually) and also re-graveling of roadways (approximately every three years) Dust Abatement and stabilization A typical maintenance activity for gravel roads also includes dust abatement and stabilization. All gravel roads will give off dust at some point, although the amount of dust can vary greatly from region to region. 20
28 The most common treatment to reduce dust is the application of Calcium Chloride, in flake or liquid form, or Magnesium Chloride, generally just in liquid form. Of course, there are other products on the market as well. Calcium and Magnesium Chloride can be very effective if used properly. They are hygroscopic products which draw moisture from the air and keep the road surface constantly damp. In addition to alleviating dust issues, the continual dampness also serves to maintain the loss of fine materials within the gravel surface, which in turn helps maintain road binding and stabilization. A good dust abatement program can actually help waterproof and bind the road, in doing so can reduce gravel loss, and therefore, reduce the frequency of grading The Cost of Maintaining Gravel Roads No industry standard exists for either the cost of maintenance or for the frequency at which the maintenance activities should be completed for gravel roads. Presented below, as a guideline only, are two studies on the maintenance costs for gravel roads: Minnesota Study (2005) The first study is from the Minnesota Department of Transportation (MnDOT) Local Road Research Board (LRRB), where the researchers looked at historical and estimated cost data from multiple counties in Minnesota. The study team found that the typical maintenance schedule consisted of routine grading and regraveling with two inches of new gravel every five years. They found that a typical road needed to be graded 21 times a year or three times a month from April October, and the upper bound for re-graveling was five years for any road over 100 ADT; lower volume roads could possibly go longer. The calculated costs including materials, labour, and hauling totaled $1,400 per year or $67 per visit for the grading activity and $13,800 for the re-gravel activity every five years. The re-gravel included an estimate gravel cost of $7.00 per cubic yard and a 2.5 thick lift of gravel (to be compacted down to 2 ). Therefore, they developed an average estimated annual maintenance cost for gravel roads at $4,160 per mile. This converts to $2,600 per km of roadway and if adjusted for inflation into 2012 dollars, using the Non- Residential Building Construction Price Index (NRBCPI), it would be $3,500. Reference: Jahren, Charles T. et. al. Economics of Upgrading an Aggregate Road, Minnesota Department of Transportation, St. Paul, Mn, January South Dakota study (2004) This second study was conducted by South Dakota s Department of Transportation (SDDOT). The default maintenance program for gravel roads from SDDOT s report includes grading 50 times per year, regraveling once every six years, and spot graveling once per year. The unit cost for grading was very similar to Minnesota at $65 per mile, re-gravel at $7,036 per mile and spot graveling or pothole repair at $2,420 per mile, totaling to an average annual maintenance cost of $6,843 per mile. Due to the frequency of the grading activity and the addition of the spot gravel maintenance, the SDDOT number is higher than Minnesota reported even though the re-gravel activity is reported at about half of the price in Minnesota. This converts to $4,277 per km of roadway and if adjusted for inflation into 2012 dollars, using the NRBCPI, it would be $5,758. Reference: Zimmerman, K.A. and A.S. Wolters. Local Road Surfacing Criteria, South Dakota Department of Transportation, Pierre, SD, June Ontario Municipal Benchmarking Initiative (OMBI) One of the many metrics tracked through the Ontario Municipal Benchmarking Initiative is the Operating costs for Unpaved (Loose top) Roads per lane Km. As referenced from the OMBI data dictionary; this includes maintenance activities such as dust suppression, loose top grading, loose top gravelling, spot base repair and wash out repair. Of the six Ontario municipalities that included 2012 costs for this category, there is a wide variation in the reporting. The highest cost per lane km was $14,900 while the lowest cost was $397. The average cost was $6,300 per lane km. Assuming two lanes per gravel road to match the studies above, the Ontario OMBI average becomes $12,600 per km of roadway. 21
29 Summary of Costs Source 2012 Maintenance Cost per km (adjusted for inflation using NRBCPI) Minnesota Study $3,500 South Dakota Study $5,758 OMBI Average (six municipalities) $12, Conclusion As discussed above, there are currently no industry standards in regards to the cost of gravel road maintenance and the frequency at which the maintenance activities should be completed. Also, there is no established benchmark cost for the maintenance of a km of gravel road and the numbers presented above will vary significantly due to the level of service or maintenance that s provided (i.e., frequency of grading cycles and re-gravel cycles). As noted below, Chatham-Kent currently spends $7,362,000 (based on 2012 numbers) annually on gravel road maintenance. Based on 1,619 km s of gravel roads, this works out to $4,500 per km. Summary of Chatham-Kent Gravel Maintenance Costs Service 2012 Cost New gravel (see note below) $3,100,000 Dust control $1,000,000 Grading $850,000 Winter control $406,000 All other $2,006,000 Total Maintenance Cost $7,362,000 Note re new gravel: We estimate that the requirement for new gravel should be an annual investment of $3,300,000. The deficit of $200,000 is not addressed in this AMP. 22
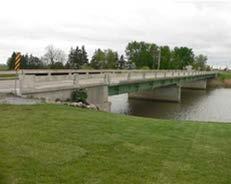
30 3.4 & Culverts 3.5 Bridges & Culverts C INFRASTRUCTURE REPORT CARD GRADE 23
31 3.5 Bridges & Large Culverts (span of 3 metres or more) Chatham-Kent has engaged Engineered Management Systems Inc. (EMSI) to evaluate its bridge and culvert inventory that have a span of 3 metres or more. Their full 2011 report is attached as appendix 1 to this report. This AMP does not include bridges & culverts that have less than a 3 metre span What do we own? As shown in the summary table below, Chatham-Kent owns 199 bridges and 628 large culverts for a total of 827 structures that have a span of 3 metres or more. To put this into perspective, Chatham-Kent has 0.8% of the population of Ontario yet 5% of the bridge and culvert structures with a span of 3 metres or more. Bridges & Large Culverts Inventory Asset Type Quantity Range of Value Total Replacement Cost (2012 $ s) Bridges > 3 metres 199 $375K to $26.1M $400M Culverts > 3 metres 628 $60K to $1.8M $200M Total 827 $600M What is it worth? As outlined in the table above, the estimated replacement value of Chatham-Kent s bridges & large culverts, in 2012 dollars, is approximately $600 million. The replacement cost per household for bridges & large culverts is $12,700 based on 47,200 households What condition is it in? Although Chatham-Kent conforms to all Provincial inspection requirements, for modeling purposes we have not completed the process of moving from age based condition assessment to actual condition evaluation. The life expectancy for a typical bridge or culvert is 75 years. The average age of our inventory is 44 years. A weighted average based on value is also 44 years. 24
32 The following table outlines the age of the bridge & culvert inventory in 5 year increments: Year Built % Age % % % % % % % % % % % % % prior 6.7% % In terms of condition assessment and, assuming that, on average, replacement costs are equal, the above table has been interpreted as follows: Condition Age (Years) % Excellent % Good % Fair % Poor % Critical % 100.0% The majority, 66% of Chatham-Kent s bridges & large culverts are in fair to excellent condition. As such, Chatham-Kent received a Condition vs. Performance rating of C What do we need to do to it? There are generally four distinct phases in an asset s lifecycle. These are presented at a high level in the table below for the bridge and culvert structures. Further detail is provided in the Asset Management Strategy section of this AMP. 25
33 Addressing Asset Needs Phase Lifecycle Activity Asset Life Stage Minor Maintenance Major Maintenance Rehabilitation Activities such as inspections, monitoring, sweeping, winter control, etc. Activities such as repairs to cracked or spalled concrete, damaged expansion joints, bent or damaged railings, etc. Rehabilitation events such as structural reinforcement of structural elements, deck replacements, etc. 1 st Qtr & ongoing 2 nd Qtr 3 rd Qtr Replacement Full structure reconstruction 4 th Qtr When do we need to do it? For the purpose of this report, useful life data for each asset class is outlined in the following table. This proposed useful life is used to determine replacement needs of individual assets, which are calculated in the system as part of the overall financial requirements. Asset Useful Life in Years Asset Type Bridges & Large Culverts Asset Component # of Structures Useful Life in Years Hydraulics 1 30 Bridges & Large Culverts Bridges & Large Culverts 8 60 Bridges & Large Culverts How much money do we need? The analysis completed to determine capital revenue requirements was based on the following constraints and assumptions: 1. Replacement costs are based upon the What is it worth section above. 2. The timing for individual structure replacement was defined by the replacement year as described in the When do you need to do it? section above. 3. All values are presented in 2012 dollars How do we reach sustainability? Based upon the above assumptions, the average annual investment required to sustain Chatham-Kent s bridges & large culverts is $10,965,000. This requirement is net of a 15% savings target for future investments. Based on Chatham-Kent s current annual funding of $7,874,000, there is an annual deficit of $3,091,000. As such, Chatham-Kent received a Funding vs. Need rating of C. If the above infrastructure gap is not addressed, the bridge inventory will have to be reduced over time. For example, if funding remains at present levels, 44 structures would have to be divested over the next 10 years. If 1% tax increases per year for 5 years are applied to the deficit (approximately $1.3M increases), 29 structures would have to be divested over the next 10 years. In conclusion, based on aged based condition data, the majority of bridges and large culvert structures are in good condition. However, if there s no desire for divestment of bridge inventory, as of 2013 there is a one-time $26.5M accumulated funding deficit. 26
34 Having said the above, in a perfect world that was fully funded from day one, Chatham-Kent should have $352M in reserves (average age of 44 years / average life expectancy of 75 years X $600M replacement value). Our actual reserve balance for bridges & large culverts is $1,668,000. Chatham-Kent is not alone with this reserve challenge. The condition assessment data, along with risk management strategies, are used together to aid in prioritizing overall needs for rehabilitation and replacement and assist with optimizing the long and short term budgets. Further detail is outlined within the asset management strategy section of this AMP Recommendations Chatham-Kent received an overall rating of C for its bridges & large culverts, calculated from the Condition vs. Performance and the Funding vs. Need ratings. Accordingly, we recommend the following: 1. Over time, the aged based condition assessment data be replaced by actual condition assessments with any associated costs becoming part of the overall requirements. 2. The condition assessment data, along with risk management strategies, continue to be used together to aid in prioritizing overall needs for rehabilitation and replacement. 3. The Infrastructure Report Card be updated on a regular basis. 27
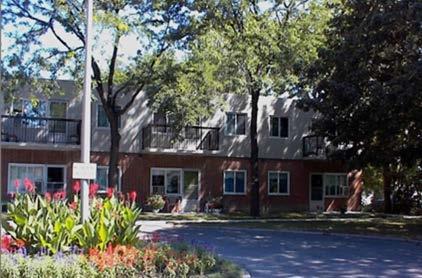
35 3.6 Social Housing 3.5 Social Housing C INFRASTRUCTURE REPORT CARD GRADE 28
36 3.6 Social Housing Chatham-Kent has engaged IRC Building Sciences Group Inc. to evaluate its social housing inventory. Their full 2011 report, as well as applicable schedules, is attached as appendix 2 to this report What do we own? Chatham-Kent owns and operates 55 social housing buildings and all the accompanying appliances, equipment, HVAC units, etc. This represents 698 units. In addition to the above, Chatham-Kent partners with Social Housing providers that own and manage an additional 171 buildings representing 774 units What is it worth? The total social housing inventory owned by Chatham-Kent has a 2012 replacement value of $84.2 million. The replacement cost per household for this inventory is $1,800 based on 47,200 households. The social housing inventory owned and operated by our Social Housing providers has a 2012 replacement value of $60.1 million What condition is it in? As detailed on page 6 of the detailed report in appendix 2, the social housing stock is in the following condition: 1. Chatham-Kent Public Housing Good condition overall. 2. Chatham-Kent Social Housing Providers (excluding Chatham Hope): Good condition overall. 3. Chatham-Kent Social Housing Providers Chatham Hope: Varied between good and fair condition overall. Based on the above, Chatham-Kent received a Condition vs. Performance rating of C What do we need to do to it? There are generally four distinct phases in an asset s lifecycle. These are presented at a high level in the table below for Social Housing. Further detail is provided in the Asset Management Strategy section of this AMP. Addressing Asset Needs Phase Lifecycle Activity Asset Age Minor Maintenance Planned activities such as inspections, monitoring, etc. 1st Qtr & ongoing Maintenance and repair activities, generally unplanned, however, Major Maintenance anticipated activities that are included in the annual operating budget. 2nd Qtr Rehabilitation Major activities such as the upgrade or replacement of smaller individual facility components (e.g. windows) 3rd Qtr Replacement Complete replacement of asset components or a facility itself. 4th Qtr When do we need to do it? For the purpose of this report useful life data for each asset class is listed in section above. This proposed useful life is used, in conjunction with condition data, to determine replacement needs of individual assets, which are calculated as part of the overall financial requirements. 29
37 As field condition information becomes more accurate over time, the data should be reworked in order to increasingly have a more accurate picture of current asset age and condition, and therefore, more accurate future replacement requirements How much money do we need? The analysis completed to determine capital revenue requirements was based on the detailed IRC report attached as appendix How do we reach sustainability? Based upon the above information, the average annual investment required to sustain Chatham-Kent s social housing is approximately $2,141,000 (see note below). Based on Chatham-Kent s current annual funding of $1,579,000, there is a deficit of $562,000. As such, Chatham-Kent received a Funding vs. Need rating of C. Note re annual requirement: This amount is made up of $879,000 for housing owned by Chatham-Kent and $1,262,000 for housing owned by social housing partners. In conclusion, Chatham-Kent s social housing facilities and associated components are generally in fair to good condition. As such, on average there is no backlog of needs that must be addressed immediately. It will be important for Chatham-Kent to continue evolving its condition assessment program to better understand and prioritize actual needs for rehabilitation and replacement and to assist with optimizing the long and short term budgets. Further detail is outlined within the asset management strategy section of this AMP Recommendations Chatham-Kent received an overall rating of C for its Social Housing, calculated from the Condition vs. Performance and the Funding vs. Need ratings. Accordingly, we recommend the following: 1. Continuing to obtain periodic, detailed studies which define the current condition of the social housing facilities and their components (structural, architectural, electrical, mechanical, site, etc.), as described further within the Asset Management Strategy section of this AMP, with any associated costs becoming part of the overall requirements. 2. After each study is completed, a new performance age be applied to each asset and an updated current state of the infrastructure analysis be generated. 3. The Infrastructure Report Card be updated on a regular basis. 30
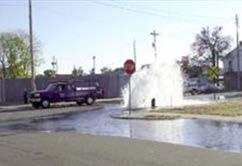
38 3.7 Water Network 3.5 Water Network F INFRASTRUCTURE REPORT CARD GRADE 31
39 3.7 Water Network The Chatham-Kent water network is owned and operated by the Chatham-Kent Public Utilities Commission. The PUC has engaged Watson & Associates Economists Ltd to evaluate its water network asset inventory. Their full 2011 report is attached as appendix 3 to this report What do we own? Chatham-Kent PUC is responsible for the following water network inventory: 2012 Replacement Cost Valuation Method Useful Life In Years Asset Category Quantity Water Network Hydrants ,014,149 NRBCPI 50 Waterlines - concrete m 38,033,009 NRBCPI 50 Waterlines - Metal m 111,048,143 NRBCPI 30 Waterlines - PVC m 155,728,574 NRBCPI 75 Water Services - Metal ,103,306 NRBCPI 30 Water Services - PVC ,232,516 NRBCPI 75 Water Valve ,693,586 NRBCPI 50 Water Supply Facility - Buildings 19 65,302,528 NRBCPI 40 Water Supply Facility - Reservoirs 4 12,827,276 NRBCPI 40 Water Supply Facility - Generators 9 931,315 CPI ( Monthly) 20 Water Supply Facility - Generators 3 788,072 CPI ( Monthly) 30 Water Supply Facility - Structures 6 3,608,223 NRBCPI 40 Water Supply Facility - Processing Equipment ,126 CPI ( Monthly) 15 Water Supply Facility - Processing Equipment 28 34,931,453 CPI ( Monthly) 20 Water Towers 14 30,331,980 NRBCPI 40 Bulk Water Stations ,228 CPI ( Monthly) ,051, What is it worth? As illustrated above, the estimated replacement cost of the water network, in 2012 dollars, is approximately $556 million. The cost per household for the water network is $15,700 based on 35,500 households being serviced What condition is it in? The Chatham-Kent PUC has no physical condition data on its water network assets. Until such time as physical condition data is in place, condition has been based on age. The following table demonstrates the average age of the water network infrastructure and compares it to its life expectancy. 32
40 Asset Category Remaining Useful Life in Years 2012 Replacement Cost Expired Total Buildings 65,801,000 33% 12% 15% 40% 100% Equipment 37,630,000 16% 6% 20% 58% 100% Linear 405,853,000 37% 7% 1% 55% 100% Structures 46,767,000 13% 14% 9% 64% 100% 556,051,000 Corresponding Value Expired Total Buildings 21,714,000 7,896,000 9,870,000 26,320,000 65,800,000 Equipment 6,021,000 2,258,000 7,526,000 21,825,000 37,630,000 Linear 150,166,000 28,410,000 4,059, ,219, ,854,000 Structures 6,080,000 6,547,000 4,209,000 29,931,000 46,767, ,981,000 45,111,000 25,664, ,295, ,051,000 Resulting % 33% 8% 5% 54% 100% As illustrated above, based on age, 54% of the water network is in good to excellent condition, 5% is in fair condition, 8% is in poor condition and 33% is in critical condition. As such, the water network received a Condition vs. Performance rating of C. It must be emphasized that the results of a future physical condition assessment may produce completely different results What do we need to do to it? There are generally four distinct phases in an asset s lifecycle. These are presented at a high level below for the water network. Further detail is provided in the Asset Management Strategy section of this AMP. Addressing Asset Needs Phase Lifecycle Activity Asset Age Minor Maintenance Major Maintenance Rehabilitation Activities such as inspections, monitoring, cleaning and flushing, hydrant flushing, pressure tests, visual inspections, etc. Such events as repairing water main breaks, repairing valves, replacing individual small sections of pipe etc. Rehabilitation events such as structural lining of pipes and a cathodic protection program to slow the rate of pipe deterioration. 1st Qtr & ongoing 2nd Qtr 3rd Qtr Replacement Full Replacement 4th Qtr When do we need to do it? For the purpose of this report useful life data for each asset class is outlined in section above. This proposed useful life is used to determine replacement needs of individual assets, which are calculated as part of the overall financial requirements. As field condition information becomes available in time, the data should be used to recalculate requirements in order to increasingly have a more accurate picture of current asset age and condition, and therefore, future replacement requirements How much money do we need? The analysis completed to determine capital revenue requirements was based on the following assumptions: 33
41 1. Replacement costs are based upon the unit costs identified within the What is it worth section above. 2. The timing for asset replacement was defined by the replacement year as described in the When do you need to do it? section above. 3. All values are presented in 2012 dollars How do we reach sustainability? Based upon the above assumptions, the average annual investment required to sustain Chatham-Kent PUC s water network is approximately $13,034,000. Based on the current annual funding of $2,481,000, there is a deficit of $10,553,000. As such, the water network received a Funding vs. Need rating of F. In conclusion, as stated above, 59% of the water network is in fair to excellent condition based on aged condition data. As there are no assets currently failing and no current need to divest of any of the asset inventory, it could be said that there is no pent up demand for critical investment. However, as shown in section above, based on age based data there is a backlog of needs totaling approximately $184 million. The aged condition assessment data, along with risk management strategies, should continue to be reviewed together to aid in prioritizing overall needs for rehabilitation and replacement and assist with optimizing the long and short term budgets. Further detail is outlined within the asset management strategy section of this AMP Recommendations Chatham-Kent PUC received an overall rating of F for its water network, calculated from the Condition vs. Performance and the Funding vs. Need ratings. Accordingly, we recommend the following: 1. Over time, the aged based condition assessment data be replaced by actual condition assessments with any associated costs becoming part of the overall requirements. 2. Once the above work is complete, a new performance age be applied to each water network asset and an updated current state of the infrastructure analysis be generated. 3. The condition assessment data, along with risk management strategies, continue to be used together to aid in prioritizing overall needs for rehabilitation and replacement. 4. The Infrastructure Report Card be updated on a regular basis. 34

42 3.6 network 3.8 Sanitary Network F INFRASTRUCTURE REPORT CARD GRADE 35
43 3.8 Sanitary Network The Chatham-Kent sanitary network is owned and operated by the Chatham-Kent Public Utilities Commission. The PUC has engaged Watson & Associates Economists Ltd to evaluate its sanitary network asset inventory. Their full 2011 report is attached as appendix 3 to this report What do we own? Chatham-Kent PUC is responsible for the following sanitary network inventory: 2012 Replacement Cost Valuation Method Useful Life In Years Asset Category Quantity Sanitary Sewer Network Sanitary Laterals ,376,978 NRBCPI 50 Manholes ,244,078 NRBCPI 50 Sewermains - Metal m 1,214,864 NRBCPI 30 Sewermains - Concrete m 126,102,510 NRBCPI 50 Sewermains - PVC m 48,341,337 NRBCPI 75 Sewermains - CIPP (Lined) m 1,377,474 NRBCPI 75 Wastewater Facility - Buildings 51 67,815,871 NRBCPI 40 Wastewater Facility - Generator 25 2,090,820 CPI ( Monthly) 20 Wastewater Facility - Generator 6 694,182 CPI ( Monthly) 30 Wastewater Facility - Processing Equipment 24 2,493,751 CPI ( Monthly) 15 Wastewater Facility - Processing Equipment ,068,230 CPI ( Monthly) 20 Wastewater Facility - Processing Structure 8 9,954,820 NRBCPI 40 Wastewater Facility - Lagoons 5 23,194,500 NRBCPI 20 SCADA Monitoring System 14 1,076,142 CPI ( Monthly) ,045, What is it worth? As illustrated above, the estimated replacement value of the sanitary network, in 2012 dollars, is approximately $482 million. The cost per household for the sanitary network is $16,900 based on 28,500 households being serviced What condition is it in? The Chatham-Kent PUC has no physical condition data on its sanitary network assets. Until such time as physical condition data is in place, condition has been based on age. The following table demonstrates the average age of the sanitary network infrastructure and compares it to its life expectancy. 36
44 Asset Category Remaining Useful Life in Years 2012 Replacement Cost Expired Total Buildings 67,816,000 16% 14% 8% 62% 100% Equipment 121,423,000 20% 24% 22% 34% 100% Linear 259,657,000 12% 10% 0% 78% 100% Structures 33,149,000 50% 0% 17% 33% 100% 482,045,000 Corresponding Value Expired Total Buildings 10,851,000 9,494,000 5,425,000 42,046,000 67,816,000 Equipment 24,285,000 29,142,000 26,713,000 41,284, ,424,000 Linear 31,159,000 25,966, ,532, ,657,000 Structures 16,575, ,635,000 10,939,000 33,149,000 82,870,000 64,602,000 37,773, ,801, ,046,000 Resulting % 17% 13% 8% 62% 100% As illustrated above, based on age, 62% of the sanitary network is in good to excellent condition, 8% is in fair condition, 13% is in poor condition and 17% is in critical condition. As such, the sanitary network received a Condition vs. Performance rating of C. It must be emphasized that the results of a future physical condition assessment may produce completely different results What do we need to do to it? There are generally four distinct phases in an assets lifecycle. These are presented at a high level in the table below for the sanitary network. Further detail is provided in the Asset Management Strategy section of this AMP. Addressing Asset Needs Phase Lifecycle Activity Asset Life Stage Minor Maintenance Major Maintenance Rehabilitation Activities such as inspections, monitoring, cleaning and flushing, zoom camera and CCTV inspections, etc. Activities such as repairing manholes and replacing individual small sections of pipe. Rehabilitation events such as structural lining of pipes are extremely cost effective and provide an additional 75 plus years of life. 1 st Qtr & ongoing 2 nd Qtr 3 rd Qtr Replacement Full replacement 4 th Qtr When do we need to do it? For the purpose of this report useful life data for each asset class is listed in section above. This proposed useful life is used to determine replacement needs of individual assets, which are calculated as part of the overall financial requirements. As field condition information becomes available in time, the data should be used to recalculate requirements in order to increasingly have a more accurate picture of current asset age and performance, and therefore, future replacement requirements. 37
45 3.8.6 How much money do we need? The analysis completed to determine capital investment requirements was based on the following assumptions: 1. Replacement costs are based upon the unit costs identified within the What is it worth section above. 2. The timing for individual asset replacement was defined by the replacement year as described in the When do you need to do it? section above. 3. All values are presented in 2012 dollars How do we reach sustainability? Based upon the above assumptions, the average annual investment required to sustain Chatham-Kent PUC s sanitary network is approximately $9,418,000. Based on the current annual funding of $2,179,000, there is an annual deficit of $7,239,000. As such, the sewer network received a Funding vs. Need rating of F. In conclusion, as stated above, 70% of the sanitary network is in fair to excellent condition based on aged condition data. As there are no assets currently failing and no current need to divest of any of the asset inventory, it could be said that there is no pent up demand for critical investment. However, as shown in section above, based on age based data there is a backlog of needs totaling approximately $83 million. A condition assessment program should be established to aid in prioritizing overall needs for rehabilitation and replacement and to assist with optimizing the long and short term budgets. Further detail is outlined within the asset management strategy section of this AMP Recommendations Chatham-Kent PUC received an overall rating of F for its sanitary network, calculated from the Condition vs. Performance and the Funding vs. Need ratings. Accordingly, we recommend the following: 1. Over time, the aged based condition assessment data be replaced by actual condition assessments with any associated costs becoming part of the overall requirements. 2. Once the above work is complete, a new performance age be applied to each water network asset and an updated current state of the infrastructure analysis be generated. 3. The condition assessment data, along with risk management strategies, continue to be used together to aid in prioritizing overall needs for rehabilitation and replacement. 4. The Infrastructure Report Card be updated on a regular basis. 38
46 4.0 Infrastructure Report Card CUMULATIVE GPA D+ Infrastructure Report Card Municipality of Chatham-Kent 1. Each asset category was rated on two key, equally weighted (50/50) dimensions: Condition vs. Performance, and Funding vs. Need. 2. See the What condition is it in? section for details on the grade of each asset category on the Condition vs. Performance dimension. 3. See the How do we reach sustainability? section for details on the grade of each asset category on the Funding vs. Need dimension. 4. The Overall Rating below is the average of the two ratings. Asset Category Condition vs. Performance Funding vs. Need Overall Grade Comments Road Network B+ C C+ 100% of Chatham-Kent s road network is in fair to excellent condition. The average annual investment required to sustain Chatham-Kent s paved road network is $13,000,000. Based on Chatham-Kent s current annual funding of $9,451,000, there is an annual deficit of $3,549,000. Bridges & Large Culverts C C C The majority, 66% of Chatham-Kent s bridges & large culverts are in fair to excellent condition. The average annual investment required to sustain Chatham-Kent s bridges & large culverts is $10,965,000. Based on Chatham-Kent s current annual funding of $7,874,000, there is an annual deficit of $3,091,000. Social Housing C+ C C While 90% of Chatham-Kent s social housing assets are in fair to excellent condition, the remaining 10% are in poor to critical condition. The average annual investment required to sustain Chatham-Kent s social housing is approximately $2,141,000. Based on Chatham-Kent s current annual funding of $1,579,000, there is an annual deficit of $562,000. Water Network C F F Sanitary Network C F F The majority, 59% of Chatham-Kent PUC s water network is in fair to excellent condition, with the remaining in poor to critical condition. The average annual investment required to sustain Chatham-Kent PUC s water network is approximately $13,034,000. Based on Chatham-Kent PUC s current annual funding of $2,481,000, there is an annual deficit of $10,553,000. Approximately 70% of Chatham-Kent PUC s sanitary sewer assets are in fair to excellent condition. The average annual investment required to sustain Chatham-Kent PUC s sanitary network is approximately $9,418,000. Based on Chatham-Kent s current annual funding of $2,179,000, there is an annual deficit of $7,239,
47 5.0 Desired Levels of Service Desired levels of service are high level indicators, comprising many factors, as listed below that establish defined quality thresholds at which municipal services should be supplied to the community. They support the organization s strategic goals and are based on customer expectations, statutory requirements, standards and the financial capacity of a municipality to deliver those levels of service. Levels of Service are used: to inform customers of the proposed type and level of service to be offered to identify the costs and benefits of the services offered to assess suitability, affordability and equity of the services offered as a measure of the effectiveness of the asset management plan as a focus for the AM strategies developed to deliver the required level of service In order for a municipality to establish a desired level of service, it is important to review the key factors involved in the delivery of that service, and the interactions between those factors. In addition, it is important to establish some key performance metrics and track them over an appropriate cycle to gain a better understanding of the current level of service supplied. Within this first Asset Management Plan, key factors affecting level of service will be outlined below and some key performance indicators for each asset type will be outlined for further review. This will provide a framework and starting point from which Chatham-Kent can determine future desired levels of service for each infrastructure class. 5.1 Key factors that influence a level of service: Strategic and Corporate Goals Legislative Requirements Expected Asset Performance Community Expectations Availability of Finances Strategic and Corporate Goals Infrastructure levels of service can be influenced by strategic and corporate goals. Strategic plans spell out where an organization wants to go, how it s going to get there, and helps decide how and where to allocate resources, ensuring alignment to the strategic priorities and objectives. It will help identify priorities and guide how municipal tax dollars and revenues are spent into the future. The level of importance that a community s vision is dependent upon infrastructure, will ultimately affect the levels of service provided or those levels that it ultimately aspires to deliver Legislative Requirements Infrastructure levels of service are directly influenced by many legislative and regulatory requirements. For instance, the Safe Drinking Water Act, the Minimum Maintenance Standards for municipal highways, building codes, and the Accessibility for Ontarians with Disabilities Act are all legislative requirements that prevent levels of service from declining below a certain standard Expected Asset Performance A level of service will be affected by current asset condition, and performance and limitations in regards to safety, capacity, and the ability to meet regulatory and environmental requirements. In addition, the design life of the asset, the maintenance items required, the rehabilitation or replacement schedule of the asset, and the total costs, are all critical factors that will affect the level of service that can be provided Community Expectations Levels of services are directly related to the expectations that the general public has from the infrastructure. For example, the public will have a qualitative opinion on what an acceptable road looks like, and a quantitative one on how long it should take to travel between two locations. Infrastructure costs are projected to increase dramatically in the future, therefore it is essential that the public is not only 40
48 consulted, but also be educated, and ultimately make choices with respect to the service levels that they wish to pay for Availability of Finances Availability of finances will ultimately control all aspects of a desired level of service. Ideally, these funds must be sufficient to achieve corporate goals, meet legislative requirements, address an asset s lifecycle needs, and meet community expectations. Levels of service will be dictated by availability of funds or elected officials ability to increase funds, or the community s willingness to pay. 5.2 Key Performance Indicators Performance measures or key performance indicators (KPIs) that track levels of service should be specific, measurable, achievable, relevant, and timebound (SMART). In this way, results can be reviewed on an regular basis and adjustments can be made to the overall asset management plan, including the desired level of service targets. In establishing measures, a good rule of thumb to remember is that maintenance activities ensure the performance of an asset and prevent premature aging, whereas rehab activities extend the life of an asset. Replacement activities, by definition, renew the life of an asset. In addition, these activities are constrained by resource availability (in particular, finances) and strategic plan objectives. Therefore, performance measures should not just be established for operating and maintenance activities, but also for the strategic, financial, and tactical levels of the asset management program. This will assist all levels of program delivery to review their performance as part of the overall level of service provided. This is a very similar approach to the balanced score card methodology, in which financial and nonfinancial measures are established and reviewed to determine whether current performance meets expectations. The balanced score card, by design, links day to day operations activities to tactical and strategic priorities in order to achieve an overall goal, or in this case, a desired level of service. The structure of accountability and level of indicator with this type of process is represented in the following table, modified from the InfraGuide s best practice document, Developing Indicators and Benchmarks published in April
49 LEVEL OF INDICATOR MUNICIPAL STRUCTURE COUNCIL STRATEGIC CAO TACTICAL SENIOR MANAGER TACTICAL & OPERATIONAL WATER MANAGER ROAD MANAGER OPERATIONAL WATER DEPARTMENT ROAD DEPARTMENT As a note, a caution should be raised over developing too many performance indicators that may result in data overload and lack of clarity. It is better to develop a select few that focus in on the targets of the asset management plan. Outlined below for each infrastructure class is a suggested service description, suggested service scope, and suggested performance indicators. These should be reviewed and updated in each iteration of the AMP. 5.3 Transportation Services Service Description Chatham-Kent s transportation network comprises approximately 3,000 lane km of paved road, 400 lane km of surface treated roads, 199 bridges, 628 large culverts and the associated sidewalks, curbs, lane markings, traffic signals, signs and street lights. Together, the above infrastructure enables Chatham-Kent to deliver transportation and pedestrian facility services and give people a range of options for moving about in a safe and efficient manner Scope of Services Movement providing for the movement of people and goods. Access providing access to residential, farm, commercial and industrial properties and other community amenities. Recreation providing for recreational use, such as walking, cycling or special events such as parades. 42
50 5.3.3 Performance Indicators (reported periodically) Potential Performance Indicators Strategic Indicators percentage of total reinvestment compared to asset replacement value completion of strategic plan objectives (related to transportation) Financial Indicators annual revenues compared to annual expenditures annual replacement value depreciation compared to annual expenditures total cost of borrowing compared to total cost of service revenue required to maintain annual network growth Tactical Indicators percentage of road network rehabilitated / reconstructed value of bridge / large culvert structures rehabilitated or reconstructed overall road condition index as a percentage of desired condition index overall bridge condition index as a percentage of desired condition index regular adjustment in condition indexes annual percentage of network growth percent of paved road lane km where the condition is rated poor or critical number of bridge / large culvert structures where the condition is rated poor or critical percentage of road network replacement value spent on operations and maintenance percentage of bridge / large culvert structures replacement value spent on operations and maintenance Operational Indicators percentage of road network inspected within last 5 years percentage of bridge / large culvert structures inspected within last two years operating costs for paved roads per lane km operating costs for gravel roads per lane km operating costs for bridge / large culvert structures per square metre number of customer requests received annually percentage of customer requests responded to within 24 hours 5.4 Social Housing Service Description Chatham-Kent s social housing infrastructure includes 55 buildings representing 698 units. In addition to the above, Chatham-Kent partners with Social Housing providers that own and manage an additional 171 buildings representing 774 units. This infrastructure enables the municipality to provide subsidized housing to the members of the community who demonstrate financial or other special needs Scope of Services Housing providing an adequate quality of life for residents 43
51 5.4.3 Performance Indicators (reported periodically) Potential Performance Indicators Strategic Indicators percentage of total reinvestment compared to asset replacement value completion of strategic plan objectives (related to housing) Financial Indicators annual revenues compared to annual expenditures annual replacement value depreciation compared to annual expenditures cost per capita for supplying housing service repair and maintenance cost per square metre Energy, utility and water cost per square metre Tactical Indicators percentage of component value replaced overall facility condition index as a percentage of desired condition index regular adjustment in condition indexes annual percentage of new housing units percent of housing units (or facilities) rated poor or critical percentage of housing replacement value spent on operations and maintenance housing units per capita Operational Indicators percentage of facilities inspected within the last 5 years number of applicants on wait-list time of applicants on wait-list number/type of service requests percentage of customer requests responded to within 24 hours 5.5 Water / Sanitary Networks Service Description Chatham-Kent PUC s water distribution network comprises 6 treatment facilities, 12 water towers, 10 pumping stations, 1,500 km of water main, 3,100 hydrants and all the other applicable facilities and equipment. The waste water network comprises 9 treatment facilities, 54 pumping stations, 500 km of sanitary sewer main, 6,200 manholes and all the other applicable facilities and equipment. Together, the above infrastructure enables Chatham-Kent PUC to deliver a potable water distribution service and a waste water collection service to the residents of Chatham-Kent Scope of Services The provision of clean safe drinking water through a distribution network of water mains and pumps. The removal and treatment of waste water through a collection network of sanitary sewer mains. 44
52 5.5.3 Performance Indicators (reported periodically) Potential Performance Indicators Strategic Indicators Financial Indicators Tactical Indicators Operational Indicators Percentage of total reinvestment compared to asset replacement value Completion of strategic plan objectives (related water / sanitary) Annual revenues compared to annual expenditures Annual replacement value depreciation compared to annual expenditures Total cost of borrowing compared to total cost of service Revenue required to maintain annual network growth Lost revenue from system outages Percentage of water / sanitary network rehabilitated / reconstructed Overall water / sanitary network condition index as a percentage of desired condition index Regular adjustment in condition indexes Annual percentage of growth in water / sanitary network Percentage of mains where the condition is rated poor or critical for each network Percentage of water / sanitary network replacement value spent on operations and maintenance Percentage of water / sanitary network inspected Operating costs for the collection of wastewater per kilometre of main Number of wastewater main backups per 100 kilometres of main Operating costs for the distribution/ transmission of drinking water per kilometre of water distribution pipe Number of days when a boil water advisory issued by the Medical Officer of Health, applicable to a municipal water supply, was in effect Number of water main breaks per 100 kilometres of water distribution pipe in a year Number of customer requests received annually per water / sanitary networks Percentage of customer requests responded to within 24 hours per water / sanitary network 45
53 6.0 Asset Management Strategy 6.1 Objective To outline and establish a set of planned actions, based on best practice, that will enable the assets to provide a desired and sustainable level of service, while managing risk, at the lowest lifecycle cost. The Asset Management Strategy will develop an implementation process that can be applied to the needs identification and prioritization of renewal, rehabilitation, and maintenance activities. This will assist in the production of a 10 year plan, including growth projections, to ensure the best overall health and performance of Chatham-Kent s infrastructure. This section includes an overview of condition assessment techniques for each asset class; the lifecycle interventions required, including interventions with the best ROI; and prioritization techniques, including risk, to determine which priority projects should move forward into the budget first. 6.2 Non-Infrastructure Solutions and Requirements Chatham-Kent should continue to explore, as requested through the provincial requirements, which noninfrastructure solutions should be incorporated into the budgets for the road, bridges & large culverts, social housing, water and sewer programs. Non- Infrastructure solutions are such items as studies, policies, condition assessments, consultation exercises, etc., that could potentially extend the life of assets or lower total asset program costs in the future. Typical solutions for a municipality include linking the asset management plan to the strategic plan, growth and demand management studies, infrastructure master plans, better integrated infrastructure and land use planning, public consultation on levels of service and condition assessment programs. As part of future asset management plans, a review of these requirements should take place. Chatham-Kent should implement holistic condition assessment programs for their bridges & large culverts, water and sanitary networks. This will lead to a higher understanding of infrastructure needs, enhanced budget prioritization methodologies and a clearer path of what is required to achieve sustainable infrastructure programs. 6.3 Condition Assessment Programs The foundation of good asset management practice is based on having comprehensive and reliable information on the current condition of the infrastructure. Municipalities need to have a clear understanding regarding performance and condition of their assets, as all management decisions regarding future expenditures and field activities should be based on this knowledge. An incomplete understanding about an asset may lead to its premature failure or premature replacement. Some benefits of holistic condition assessment programs within the overall asset management process are listed below: Understanding of overall network condition leads to better management practices Allows for the establishment of rehabilitation programs Prevents future failures and provides liability protection Potential reduction in operation / maintenance costs Accurate current asset valuation Allows for the establishment of risk assessment programs Establishes proactive repair schedules and preventive maintenance programs Avoids unnecessary expenditures Extends asset service life therefore improving level of service 46
54 Improves financial transparency and accountability Enables accurate asset reporting which, in turn, enables better decision making Condition assessment can involve different forms of analysis such as subjective opinion, mathematical models, or variations thereof, and can be completed through a very detailed or very cursory approach. When establishing the condition assessment of an entire asset class, the cursory approach (metrics such as good, fair, poor, critical) is used. This will be a less expensive approach when applied to thousands of assets, yet will still provide up to date information, and will allow for detailed assessment or follow up inspections on those assets captured as poor or critical condition later. The following section outlines condition assessment programs available for road, bridge, social housing, sewer and water networks that would be useful for Chatham-Kent Pavement Network Inspections Typical industry pavement inspections are performed by consulting firms using specialised assessment vehicles equipped with various electronic sensors and data capture equipment. The vehicles will drive the entire road network and typically collect two different types of inspection data surface distress data and roughness data. Surface distress data involves the collection of multiple industry standard surface distresses, which are captured either electronically, using sensing detection equipment mounted on the van, or visually, by the van's inspection crew. Examples of surface distresses are: For asphalt surfaces alligator cracking; distortion; excessive crown; flushing; longitudinal cracking; map cracking; patching; edge cracking; potholes; ravelling; rippling; transverse cracking; wheel track rutting For concrete surfaces coarse aggregate loss; corner 'C' and 'D' cracking; distortion; joint faulting; joint sealant loss; joint spalling; linear cracking; patching; polishing; potholes; ravelling; scaling; transverse cracking Roughness data capture involves the measurement of the roughness of the road, measured by lasers that are mounted on the inspection van's bumper, calibrated to an international roughness index. Most firms will deliver this data to the client in a database format complete with engineering algorithms and weighting factors to produce an overall condition index for each segment of roadway. The above process is an excellent way to capture road condition as the inspection trucks will provide detailed surface and roughness data for each road segment, and often include video or street imagery. As noted in this report, Chatham-Kent currently has access to this type of testing Bridges & Culverts (span of 3 metres or more) Inspections Ontario municipalities are mandated by the Ministry of Transportation to inspect all structures that have a span of 3 metres or more, according to the OSIM (Ontario Structure Inspection Manual). At present, in Chatham-Kent, there are 827 structures that meet this criterion. Structure inspections must be performed by, or under the guidance of, a structural engineer, must be performed on a biennial basis (once every two years), and include such information as structure type, number of spans, span lengths, other key attribute data, detailed photo images, and structure element by element inspection, rating and recommendations for repair, rehabilitation, and replacement. The best approach to develop a 10 year needs list for Chatham-Kent s structure portfolio would be to have the structural engineer who performs the inspections to develop a maintenance requirements report, and rehabilitation and replacement requirements report as part of the overall assignment. In addition to refining the overall needs requirements, the structural engineer should identify those structures that will require more detailed investigations and non-destructive testing techniques. Examples of these investigations are: 47
55 Detailed deck condition survey Non-destructive delamination survey of asphalt covered decks Substructure condition survey Detailed coating condition survey Underwater investigation Fatigue investigation Structure evaluation Through the OSIM recommendations and additional detailed investigations, a 10 year needs list is developed for Chatham-Kent s bridges. The 10 year needs list developed is further prioritized using risk management techniques to better allocate resources. As noted in this report, Chatham-Kent currently engages a consultant to do this work. Next steps are to incorporate the inspection data into the AMP in order to move from aged based condition analysis to actual condition analysis Facility Inspections (Housing) The most popular and practical type of facility assessment involves qualified groups of trained industry professionals (engineers or architects) performing an analysis of the condition of a group of facilities, and their components, that may vary in terms of age, design, construction methods, and materials. This analysis can be done by walk-through inspection, mathematical modeling, or a combination of both. But the most accurate way of determining the condition requires a walk-through to collect baseline data. The following 5 asset classifications are typically inspected: Site Components property around the facility and includes the outdoor components such as utilities, signs, stairways, walkways, parking lots, fencing, courtyards and landscaping. Structural Components physical components such as the foundations, walls, doors, windows, roofs. Electrical Components all components that use or conduct electricity such as wiring, lighting, electric heaters, and fire alarm systems Mechanical Components components that convey and utilize all non-electrical utilities within a facility such as gas pipes, furnaces, boilers, plumbing, ventilation, and fire extinguishing systems Vertical movement components used for moving people between floors of buildings such as elevators, escalators and stair lifts. The data collection on the above components typically includes: type and category of component; estimated age; current condition; estimated repair, rehabilitation or replacement date; and estimated cost for the repair, rehabilitation or replacement. In addition, reports can be generated for each facility that accumulate all current repair, rehabilitation and replacement requirements and generate a facility condition index (FCI) for the overall facility. This allows senior management to assess the overall state of the housing portfolio and determine which facilities have the greatest overall needs. The FCI of a facility is represented as a percentage and is calculated by taking the total renewal costs of components in a given year and dividing that figure by the total replacement value of the facility itself. A high FCI value reflects a high renewal requirement and therefore a poor condition facility. A facility with an FCI of less than 5% is in good condition, between 5% and 10% is in fair condition, between 10% and 30% poor condition, and over 30% is considered critical condition. FCI = Renewal Requirement in a Given Year Replacement Value of an Asset 48
56 As noted in this report, Chatham-Kent currently engages a consultant to do this type of work Sanitary Network Inspections The most popular and practical type of sanitary sewer assessment is the use of Closed Circuit Television Video (CCTV). The process involves a small robotic crawler vehicle with a CCTV camera attached that is lowered down a maintenance hole into the sewer main to be inspected. The vehicle and camera then travels the length of the pipe providing a live video feed to a truck on the road above where a technician / inspector records defects and information regarding the pipe. A wide range of construction or deterioration problems can be captured including open/displaced joints, presence of roots, infiltration & inflow, cracking, fracturing, exfiltration, collapse, deformation of pipe and more. Therefore, sewer CCTV inspection is a very good tool for locating and evaluating structural defects and general condition of underground pipes. Even though CCTV is an excellent option for inspection of sewers it is a fairly costly process and does take significant time to inspect a large volume of pipes. Another option in the industry today is the use of Zoom Camera equipment. This is very similar to traditional CCTV, however, a crawler vehicle is not used but in its place a camera is lowered down a maintenance hole attached to a pole like piece of equipment. The camera is then rotated towards each connecting pipe and the operator above progressively zooms in to record all defects and information about each pipe. The downside to this technique is the further down the pipe the image is zoomed, the less clarity is available to accurately record defects and measurement. The upside is the process is far quicker and significantly less expensive and an assessment of the manhole can be provided as well. Also, it is important to note that 80% of pipe deficiencies generally occur within 20 metres of each manhole. The following is a list of advantages of utilizing Zoom Camera technology: A time and cost efficient way of examining sewer systems Problem areas can be quickly targeted Can be complemented by a conventional camera (CCTV), if required afterwards In a normal environment, 20 to 30 manholes can be inspected in a single day, covering more than 1,500 meters of pipe Contrary to the conventional camera approach, cleaning and upstream flow control is not required prior to inspection Normally detects 80% of pipe deficiencies, as most deficiencies generally occur within 20 meters of manholes The following table is based on general industry costs for traditional CCTV inspection and Zoom Camera inspection; however, costs should be verified through local contractors. It is for illustrative purposes only but supplies a general idea of the cost to inspect Chatham-Kent PUC s entire sanitary networks. Sanitary Inspection Cost Estimates Sewer Network Assessment Activity Cost Metres of Main / # of Manholes Total Sanitary Full CCTV $10 (per m) 500,000 m $5,000,000 Zoom $300 (per mh) 6,200 manholes $1,860,000 It can be seen from the above table that there is a significant cost savings achieved through the use of Zoom Camera technology. A good industry trend and best practice is to inspect the entire network using Zoom Camera technology and follow up on the poor and critical rated pipes with more detail using a full CCTV inspection. In this way, inspection expenditures are kept to a minimum, however, an accurate assessment on whether to rehabilitate or replace pipes will be provided for those with the greatest need. In addition to receiving a video and defect report of each pipe s CCTV or Zoom camera inspection, many companies can now provide a database of the inspection results, complete with scoring matrixes that provide an overall general condition score for each pipe segment that has been assessed. Typically pipes are scored from 1 5, with 1 being a relatively new pipe and 5 being a pipe at the end of its design life. Chatham-Kent PUC currently carries out this type of inspection over 5 to 7 year cycles. It is recommended that this sewer condition assessment program continue. 49
57 6.3.5 Water network inspections Unlike sewer mains, it is very difficult to inspect water mains from the inside due to the high pressure flow of water constantly underway within the water network. Physical inspections require a disruption of service to residents, can be an expensive exercise, and are time consuming to set up. It is recommended practice that physical inspection of water mains typically only occurs for high risk, large transmission mains within the system, and only when there is a requirement. There are a number of high tech inspection techniques in the industry for large diameter pipes but these should be researched first for applicability as they are quite expensive. Examples are: Remote field eddy current (RFEC) Ultrasonic and acoustic techniques Impact echo (IE) Georadar For the majority of pipes within the distribution network gathering key information in regards to the main and its environment can supply the best method to determine a general condition. Key data that could be used, along with weighting factors, to determine an overall condition score are listed below. Age Material Type Breaks Hydrant Flow Inspections Soil Condition Understanding the age of the pipe will determine useful life remaining, however, water mains fail for many other reasons than just age. The pipe material is important to know as different pipe types have different design lives and different deterioration profiles. Keeping a water main break history is one of the best analysis tools to predict future pipe failures and to assist with programming rehabilitation and replacement schedules. Also, most municipalities perform hydrant flow tests for fire flow prevention purposes. The readings from these tests can also help determine condition of the associated water main. If a hydrant has a relatively poor flow condition it could be indicative of a high degree of encrustation within the attached water main, which could then be flagged as a candidate for cleaning or possibly lining. Finally, soil condition is important to understand as certain soil types can be very aggressive at causing deterioration on certain pipe types. Chatham-Kent PUC currently inspects its water towers, reservoirs and clear wells using this technology. It is recommended that Chatham-Kent PUC develop a rating system for the mains within the distribution network based on the availability of key data, and that funds are budgeted for this development. 50

, Chatham- Kent could gain the best overall asset condition while expending the lowest total cost for those programs. 6.4.")
58 6.4 AMP Strategy Lifecycle Analysis Framework An industry review was conducted to determine which lifecycle activities can be applied at the appropriate time in an asset s life, to provide the greatest additional life at the lowest cost. In the asset management industry, this is simply put as doing the right thing to the right asset at the right time. If these techniques are applied across entire asset networks or portfolios (e.g., the entire road network), Chatham- Kent could gain the best overall asset condition while expending the lowest total cost for those programs Paved Roads The following analysis has been conducted at a fairly high level, using industry standard activities and costs for paved roads. With future updates of this Asset Management Strategy, Chatham-Kent may wish to run the same analysis with a detailed review of municipal activities used for roads and the associated local costs for those work activities. The following diagram depicts a general deterioration profile of a road with a 30 year life. As shown above, during the road s lifecycle there are various windows available for work activity that will maintain or extend the life of the asset. These windows are: maintenance; preventative maintenance; rehabilitation; and replacement or reconstruction. 51
59 The windows or thresholds for when certain work activities should be applied to also coincide approximately with the condition state of the asset as shown below: Asset Condition and Related Work Activity: Paved Roads Condition Condition Range Work Activity excellent condition (Maintenance only phase) maintenance only good Condition (Preventative maintenance phase) fair Condition (Rehabilitation phase) poor Condition (Reconstruction phase) crack sealing emulsions resurface - mill & pave resurface - asphalt overlay single & double surface treatment (for rural roads) reconstruct - pulverize and pave reconstruct - full surface and base reconstruction critical Condition (Reconstruction phase) 0 critical includes assets beyond their useful lives which make up the backlog. They require the same interventions as the poor category above. With future updates of this Asset Management Strategy, Chatham-Kent may wish to review the above condition ranges and thresholds for when certain types of work activity occur, and adjust to better suit Chatham-Kent s work program. Also note: when adjusting these thresholds, it actually adjusts the level of service provided and ultimately changes the amount of money required. These adjustments will be an important component of future Asset Management Plans as the Province requires each municipality to present various management options within the financing plan. Based on industry standards, the table below outlines the costs for various road activities, the added life obtained for each, the condition range at which they should be applied, and the cost of 1 year added life for each (cost of activity / added life) in order to present an apples to apples comparison. Road Lifecycle Activity Options Treatment Average Unit Cost (per sq. m) Added Life (Years) Condition Range Cost Of Activity/Added Life Urban Reconstruction $ $6.83 Urban Resurfacing $ $5.60 Rural Reconstruction $ $4.50 Rural Resurfacing $ $2.67 Double Surface Treatment $ $2.50 Routing & Crack Sealing (P.M) $ $0.67 As can be seen in the table above, preventative maintenance activities such as routing and crack sealing have the lowest associated cost (per sq. m) in order to obtain one year of added life. Of course, 52
60 preventative maintenance activities can only be applied to a road at a relatively early point in the lifecycle. It is recommended that Chatham-Kent continue to engage in an active preventative maintenance program for all paved roads and that a portion of the maintenance budget is allocated to this. Also, rehabilitation activities, such as urban and rural resurfacing or double surface treatments (tar and chip) for rural roads have a lower cost to obtain each year of added life than full reconstruction activities. It is recommended that Chatham-Kent continue to engage in an active rehabilitation program for urban and rural paved roads and that a portion of the capital budget is dedicated to this. Of course, in order to implement the above programs it will be important to also establish a general condition score for each road segment, established through standard condition assessment protocols as previously described. It is important to note that a worst first budget approach, whereby no lifecycle activities other than reconstruction at the end of a roads life are applied, will result in the most costly method of managing a road network overall Gravel Roads The lifecycle activities required for these roads are quite different from paved roads. Gravel roads require a cycle of perpetual maintenance, including general re-grading, reshaping of the crown and cross section, gravel spot and section replacement, dust abatement and ditch clearing and cleaning. Gravel roads can require frequent maintenance, especially after wet periods and when accommodating increased traffic. Wheel motion shoves material to the outside (as well as in-between travelled lanes), leading to rutting, reduced water-runoff, and eventual road destruction if unchecked. This deterioration process is prevented if interrupted early enough, simple re-grading is sufficient, with material being pushed back into the proper profile. As a high proportion of gravel roads can have a significant impact on the maintenance budget, it is recommended that with further updates of this asset management plan Chatham-Kent study the traffic volumes and maintenance requirements in more detail for its gravel road network. Similar studies elsewhere have found converting certain roadways to paved roads can be very cost beneficial especially if frequent maintenance is required due to higher traffic volumes. Roads within the gravel network should be ranked and rated using the following criteria: Usage - traffic volumes and type of traffic Functional importance of the roadway Known safety issues Frequency of maintenance and overall expenditures required Through the above type of analysis, a program could be introduced to convert certain gravel roadways into paved roads, reducing overall costs, and be brought forward into the long range budget Sanitary Network The following analysis has been conducted at a fairly high level, using industry standard activities and costs for sanitary sewer rehabilitation and replacement. With future updates of this asset management strategy, Chatham-Kent PUC may wish to run the same analysis with a detailed review of PUC activities used for the sewer network and the associated local costs for those work activities. 53
61 The following diagram depicts a general deterioration profile of a sewer main with a 100 year life. As shown above, during the sewer main s lifecycle there are various windows available for work activity that will maintain or extend the life of the asset. These windows are: maintenance; major maintenance; rehabilitation; and replacement or reconstruction. The windows or thresholds for when certain work activities should be applied also coincide approximately with the condition state of the asset as shown below: Asset Condition and Related Work Activity: Sewer Main Condition Condition Range Work Activity excellent condition (Maintenance only phase) maintenance only (cleaning & flushing etc.) good Condition (Preventative maintenance phase) manhole repairs small pipe section repairs fair Condition (Rehabilitation phase) structural relining poor Condition (Reconstruction phase) 25-1 pipe replacement critical Condition (Reconstruction phase) 0 critical includes assets beyond their useful lives which make up the backlog. They require the same interventions as the poor category above. With future updates of this Asset Management Strategy, Chatham-Kent PUC may wish to review the above condition ranges and thresholds for when certain types of work activity occur, and adjust to better suit its work program. Also note: when adjusting these thresholds, it actually adjusts the level of service provided and ultimately changes the amount of money required. These adjustments will be an important component of future Asset Management Plans as the Province requires each municipality to present various management options within the financing plan. Based on industry standards, the table below outlines the costs, by pipe diameter, for various sewer main rehabilitation (lining) and replacement activities. The columns display the added life obtained for each 54
62 activity, the condition range at which they should be applied, and the cost of 1 year added life for each (cost of activity / added life) in order to present an apples to apples comparison. Sewer Main Lifecycle Activity Options Category Cost (per m) Added Life Condition Range 1 year Added Life Cost (Cost / Added Life) Structural Rehab (m) 0-325mm $ $ mm $ $ mm $1, $24.76 > 925mm $1, $23.62 Replacement (m) $ $ mm $ $ mm $ $9.00 > 925mm $1, $14.75 As can be seen in the above table, structural rehabilitation or lining of sewer mains is an extremely cost effective industry activity and solution for pipes with a diameter less than 625mm. The unit cost of lining is approximately one third of replacement and the cost to obtain one year of added life is half the cost. Typically this diameter range would account for over 95% of sanitary sewer mains. Structural lining has been proven through industry testing to have a design life (useful life) of 75 years; however, it is believed that liners will probably obtain 100 years of life (the same as a new pipe). For sewer mains with diameters greater than 625mm specialized liners are required and therefore the costs are no longer effective. It should be noted, however, that the industry is continually expanding its technology in this area and therefore future costs should be further reviewed for change and possible price reductions. It is recommended that Chatham-Kent PUC continue to engage in an active structural lining program for sanitary sewer mains and that a portion of the capital budget be dedicated to this. In order to implement the above, it will be important to also establish a condition assessment program to establish a condition score for each sewer main within the sanitary collection network, and therefore identify which pipes are good candidates for structural lining Bridges & Culverts (span of 3 metres or more) The best approach to develop a 10 year needs list for Chatham-Kent s bridge structure portfolio would be to have the structural engineer who performs the inspections to develop a maintenance requirements report, a rehabilitation and replacement requirements report and identify additional detailed inspections as required. This approach is described in more detail within the Bridges & Culverts (span of 3 metres or more) Inspections section above Housing The best approach to develop a 10 year needs list for Chatham-Kent s housing portfolio would be to have the engineers or architects who perform the facility inspections to also develop a complete portfolio maintenance requirements report and rehabilitation and replacement requirements report, and also identify additional detailed inspections and follow up studies as required. This may be performed as a separate assignment once all individual facility audits / inspections are complete. The above reports could be considered the beginning of a 10 year maintenance and capital plan, however, within the facilities industry there are other key factors that should be considered to determine over all priorities and future expenditures. Some examples would be functional / legislative requirements, energy conservation programs and upgrades, customer complaints and health and safety concerns. 55
63 Legislative Requirements The most influential piece of legislation is the Housing Services Act (HSA) which came into effect on January 1, 2012, and replaced the Social Housing Reform Act (SHRA). The Housing Services Act provides a new legislative framework for the delivery of housing programs in Ontario. Other acts to consider as part of the 10 year plan would be: Accessibility for Ontarians with Disabilities Act By January 2012, all non-profit housing providers in Ontario were required to comply with the customer service standard under the Accessibility for Ontarians with Disabilities Act, 2005 (AODA). This means that each organization will have to establish policies, practices and procedures on providing goods and services to people with disabilities. The Building Code Act (BCA) and the Ontario Building Code (OBC) govern the construction, demolition, and renovation of buildings by setting certain minimum performance and safety standards. Requirements listings produced from the facility audits / inspections should continue to be reviewed to ensure capital replacements and upgrades are compliant with industry standards and legislation and project prioritizations and estimates should be adjusted accordingly. Energy Conservation There are significant savings to be achieved by housing providers through the implementation of energy conservation programs and the associated industry incentives available upon the market. Some examples would be: Mechanical & Structural components Improve mechanical systems by replacing old inefficient systems (e.g. HVAC, boilers) with new high efficiency systems; investigate if incentives for these improvements are available from utilities, federal government, etc. Investigate the tightness and insulation of the building envelope in all properties and develop programs for improvement Reduce solar gain through windows with awnings or landscaping Replace/upgrade all toilets with high efficiency toilets Electrical components Install occupancy sensors Implement energy efficiency lighting using compact fluorescent light bulbs and install timers where appropriate to control outside lights Install fully programmable thermostats within all housing units Energy conservation should be studied in detail for the entire housing portfolio and upgrade and replacement programs should be implemented through the capital program as part of the 10 year plan. Customer expectation and affordability or willingness to pay As discussed within the Desired Levels of Service section of this AMP, levels of service are directly related to the expectations of the customer and also their ability to pay for a level of service. Housing is one infrastructure service where customer surveys can be conducted to gain a better sense of what customer expectations are and to assist in the establishment of a standard level of provision or service. Information could be collected on: safety; security; esthetics; environment; comfort; affordability; cleanliness; functional use of space; etc. This would require a much more detailed review, however, the establishment of a level of service based on customer needs and expectations, while still balancing affordability, would directly affect the prioritization of programs and projects brought forward into the 10 year facility budget. It is recommended that Chatham-Kent continue to develop a lifecycle framework for the facility portfolio based on a detailed review of the above factors and that the results are brought forward into future iterations of this AMP Water Network As with roads and sewers above, the following analysis has been conducted at a fairly high level, using industry standard activities and costs for water main rehabilitation and replacement. The following diagram depicts a general deterioration profile of a water main with an 80 year life. 56
64 As shown above, during the water main s lifecycle there are various windows available for work activity that will maintain or extend the life of the asset. These windows are: maintenance; major maintenance; rehabilitation; and replacement or reconstruction. The windows or thresholds for when certain work activities should be applied also coincide approximately with the condition state of the asset as shown below: Asset Condition and Related Work Activity: Water Main Condition Condition Range Work Activity excellent condition (Maintenance only phase) maintenance only (cleaning & flushing etc.) good Condition (Preventative maintenance phase) water main break repairs small pipe section repairs fair Condition (Rehabilitation phase) structural water main relining poor Condition (Reconstruction phase) 25-1 pipe replacement critical Condition (Reconstruction phase) 0 critical includes assets beyond their useful lives which make up the backlog. They require the same interventions as the poor category above. 57
65 Water Main Lifecycle Activity Option Category Cost Added Life Condition Range Cost of Activity / Added Life Structural Rehab (m) m $ $ m $ $ m $ $ m $1, $ m - & + $2, $40.00 Replacement (m) m $ $ m $ $ m $ $ m $1, $ m - & + $2, $25.00 Water rehab technologies still require some digging (known as low dig technologies, due to lack of access) and are actually more expensive on a lifecycle basis. However, if the road above the water main is in good condition lining avoids the cost of road reconstruction still resulting in a cost effective solution. It should be noted, that the industry is continually expanding its technology in this area and therefore future costs should be further reviewed for change and possible price reductions. At this time, it is recommended that Chatham-Kent continue to only utilize water main structural lining when the road above requires rehab or no work. 58
66 6.5 Growth and Demand Typically a municipality will have specific plans associated with population growth. It is essential that the asset management strategy should address not only the existing infrastructure, as above, but must include the impact of projected growth on defined project schedules and funding requirements. Projects would include the funding of the construction of new infrastructure, and/or the expansion of existing infrastructure to meet new demands. Chatham-Kent s recent work on the comprehensive review of the Official Plan is a good example of proactive planning. 6.6 Project Prioritization The above techniques and processes when established for the assets covered by this AMP, will supply a significant listing of potential projects. Typically the infrastructure needs will exceed available resources and therefore project prioritization parameters must be developed to ensure the right projects come forward into the short and long range budgets. An important method of project prioritization is to rank each project, or each piece of infrastructure, on the basis of how much risk it represents to the organization Risk Matrix and Scoring Methodology Risk within the infrastructure industry is often defined as the probability (likelihood) of failure multiplied by the consequence of that failure. RISK = LIKELIHOOD OF FAILURE x CONSEQUENCE OF FAILURE The likelihood of failure relates to the current condition state of each asset, whether they are in excellent, good, fair, poor or critical condition, as this is a good indicator regarding their future risk of failure. The consequence of failure relates to the magnitude, or overall effect, that an asset s failure will cause. For instance, a small diameter water main break in a sub division may cause a few customers to have no water service for a few hours, whereby a large trunk water main break outside a hospital could have disastrous effects and would be a front page news item. It is recommended that Chatham-Kent develop a more tailored suite of risk scores, particularly in regards to the consequence of failure. An example of scores that can determine budget prioritization are as follows: All assets: The Likelihood of Failure score is based on the condition of the assets: Likelihood of Failure: All Assets Asset Condition Likelihood of Failure Excellent condition score of 1 Good condition score of 2 Fair condition score of 3 Poor condition score of 4 Critical condition score of 5 Bridges (based on valuation): The consequence of failure score for this initial AMP is based upon the replacement value of the structure. The higher the value, probably the larger the structure and therefore probably the higher the consequential risk of failure: 59
67 Consequence of Failure: Bridges Replacement Value Consequence of Failure Up to $100k Score of 1 $101 to $500k Score of 2 $501 to $1 million Score of 3 $1 million to $4 million Score of 4 $4 million and over Score of 5 Roads (based on classification): The consequence of failure score for this initial AMP is based upon the road classification as this will reflect traffic volumes and number of people affected. Road Classification Consequence of Failure: Roads Consequence of Failure Gravel score of 1 Paved score of 3 Social Housing (based on component valuation): The consequence of failure score for this initial AMP is based upon the replacement value of the facility component. The higher the value, probably the larger and more important the component to the overall function of the facility and therefore probably the higher the consequential risk of failure: Consequence of Failure: Social Housing Replacement Value Consequence of Failure Up to $50k Score of 1 $51k to $100k Score of 2 $101k to $500k Score of 3 $501k to $2 million Score of 4 Over $2 million Score of 5 Sanitary Sewer (based on diameter): The consequence of failure score for this initial AMP is based upon pipe diameter as this will reflect potential upstream service area affected. Consequence of Failure: Sanitary Sewer Pipe Diameter Consequence of Failure Less than 150mm Score of mm Score of mm Score of mm Score of 4 601mm and over Score of 5 Water (based on diameter): The consequence of failure score for this initial AMP is based upon pipe diameter as this will reflect potential service area affected. 60
68 Consequence of Failure: Water Pipe Diameter Consequence of Failure Less than 100mm Score of mm Score of mm Score of mm Score of and over Score of 5 61

69 7.0 Financial Strategy 7.1 General overview of financial plan requirements In order for an AMP to be effectively put into action, it must be integrated with financial planning and longterm budgeting. The development of a comprehensive financial plan will allow Chatham-Kent to identify the financial resources required for sustainable asset management based on existing asset inventories, desired levels of service and projected growth requirements. The following pyramid depicts the various cost elements and resulting funding levels that should be incorporated into AMP s that are based on best practices. This report develops such a financial plan by presenting several scenarios for consideration and culminating with final recommendations. As outlined below, the scenarios presented model different combinations of the following components: a) the financial requirements (as documented in the SOTI section of this report) for: existing assets existing service levels requirements of contemplated changes in service levels (none identified for this plan) requirements of anticipated growth (none identified for this plan) b) use of traditional sources of municipal funds: tax levies user fees reserves debt (no additional debt required for this AMP) development charges (not applicable) 62
70 c) use of non-traditional sources of municipal funds: reallocated budgets (not required for this AMP) partnerships (not applicable) procurement methods (no changes recommended) d) use of senior government funds: gas tax grants (not included in this plan due to Provincial requirements for firm commitments) If the financial plan component of an AMP results in a funding shortfall, the Province requires the inclusion of a specific plan as to how the impact of the shortfall will be managed. In determining the legitimacy of a funding shortfall, the Province may evaluate a municipality s approach to the following: a) in order to reduce financial requirements, consideration has been given to revising service levels downward b) all asset management and financial strategies have been considered. For example: if a zero debt policy is in place, is it warranted? If not, the use of debt should be considered. do user fees reflect the cost of the applicable service? If not, increased user fees should be considered. This AMP includes recommendations that avoid long-term funding deficits. 7.2 Financial information relating to Chatham-Kent s AMP Funding objective We have developed scenarios that would enable Chatham-Kent to achieve full funding within 5 to 10 years for the following assets: a) Tax funded assets: Road Network; Bridges & Culverts with a span of 3 metres or more; Social Housing b) Rate funded assets: Sanitary Sewer Network; Water Network Note: For the purposes of this AMP, we have excluded the category of gravel roads since gravel roads are a perpetual maintenance asset and end of life replacement calculations do not normally apply. If gravel roads are maintained properly, they, in essence, could last forever. For each scenario developed we have included strategies, where applicable, regarding the use of tax revenues, user fees, reserves and debt. 7.3 Tax funded assets Current funding position Tables 1 and 2 outline, by asset category, Chatham-Kent s average annual asset investment requirements, current funding positions, and funding increases required to achieve full funding on assets funded by taxes. Table 1. Summary of Infrastructure Requirements & Current Funding Available Asset Category Average Annual Investment Required 2013 Annual Funding Available Taxes Gas Tax Other Total Funding Available Annual Deficit/Surplus Road Network 13,000,000 7,792,000 1,659, ,451,000 3,549,000 Bridges & Culverts > 3m 10,965,000 2,896,000 4,978, ,874,000 3,091,000 Social Housing 2,141,000 1,579, ,579, ,000 Total 26,106,000 12,267,000 6,637, ,904,000 7,202,000 63
71 7.3.2 Recommendations for full funding The average annual investment requirement for paved roads, bridges & large culverts, and social housing is $26,106,000. Annual revenue currently allocated to these assets for capital purposes is $18,904,000 leaving an annual deficit of $7,202,000. To put it another way, these infrastructure categories are currently funded at 72% of their long-term requirements. In 2013, Chatham-Kent has annual tax revenues of $132,000,000. As illustrated in table 2, without consideration of any other sources of revenue, full funding would require the following tax increase over time: Table 2. Tax Increases Required for Full Funding Asset Category Tax Increase Required for Full Funding Road Network 2.7% Bridges & Culverts > 3m 2.3% Social Housing 0.4% Total 5.4% The 2014 federal gas tax allocation was recently announced. This revenue is allocated based on population. Due to the combination of shifting populations between provinces and Chatham-Kent s declining population, this revenue is decreasing from $6,637,000 to $6,004,000, a decrease of $633,000. On a positive note, we have been estimating 2014 assessment growth at $1.1M. We have recently been able to determine that the actual assessment growth is $1.8M. The 2014 budget will be recommending that part of the increased assessment growth be used to offset the decrease in gas tax funding so that our already challenged infrastructure program is not impacted. As illustrated in table 9, Chatham-Kent s debt payments for these asset categories will be decreasing by $1,174,000 from 2013 to 2017 (5 years). Although not illustrated, debt payments will decrease by $2,875,000 from 2013 to 2022 (10 years). Our recommendations include capturing those decreases in cost and allocating them to the infrastructure deficit outlined above. Table 3 outlines these two concepts and presents a number of options: Table 3. Effect of Reallocating Assessment Growth to Offset Decrease in Gas Tax Revenues and Incorporating Decreases in Debt Costs Without Reallocation of Assessment Growth With Reallocation of Assessment Growth 5 Years 10 Years 5 Years 10 Years Infrastructure Deficit as Outlined in Table 1 7,202,000 7,202,000 7,202,000 7,202,000 Decrease in Gas Tax Revenue 633, , , ,000 Reallocation of Assessment Growth to Compensate for Decrease in Gas Tax Revenue , ,000 Change in Debt Costs -1,174,000-2,875,000-1,174,000-2,875,000 Resulting Infrastructure Deficit 6,661,000 4,960,000 6,028,000 4,327,000 Resulting Tax Increase Required: Total Over Time 5.0% 3.8% 4.6% 3.3% Annually 1.0% 0.4% 0.9% 0.3% 64
72 Considering all of the above information, we recommend the 10 year option in table 3 that includes the reallocations. This involves full funding being achieved over 10 years by: a) when realized, reallocating the debt cost reductions of $2,875,000 to the infrastructure deficit as outlined above. b) Allocating $633,000 of the 2014 assessment growth revenue to offset the decrease in gas tax revenue of $633,000. c) increasing tax revenues by 0.33% each year for the next 10 years solely for the purpose of phasing in full funding to the asset categories covered in this section of the AMP. d) continuing to allocate 25% of the gas tax revenue to the paved roads category and 75% to bridges. e) increasing existing and future infrastructure budgets by the applicable inflation index on an annual basis in addition to the deficit phase-in. Notes: 1. As in the past, periodic senior government infrastructure funding will most likely be available during the phase-in period. By Provincial AMP rules, this funding cannot be incorporated into the AMP unless there are firm commitments in place. 2. We realize that raising tax revenues by the amounts recommended above for infrastructure purposes will be very difficult to do. However, considering a longer phase-in window may have even greater consequences in terms of infrastructure failure. Although this option achieves full funding on an annual basis in 10 years and provides financial sustainability over the period modeled (to 2050), the recommendations do require prioritizing capital projects to fit the resulting annual funding available. As of 2013, age based data shows a pent up investment demand of $0 for paved roads, $26,500,000 for bridges & large culverts, and $0 for social housing. Prioritizing future projects will require the age based data to be replaced by condition based data. Although our recommendations include no further use of debt, the results of the condition based analysis may require otherwise. 7.4 Rate funded assets Current funding position Tables 4 and 5 outline, by asset category, Chatham-Kent PUC s average annual asset investment requirements, current funding positions and funding increases required to achieve full funding on assets funded by rates. Table 4. Summary of Infrastructure Requirements & Current Funding Available Asset Category Average Annual Investment Required Rates 2013 Annual Funding Available Less: Allocated to Operations Other Total Funding Available Annual Deficit/Surplus Sanitary Network 9,418,000 13,724,000-11,545, ,179,000 7,239,000 Water Network 13,034,000 17,775,000-15,294, ,481,000 10,553,000 Total 22,452,000 31,499,000-26,839, ,660,000 17,792, Recommendations for full funding The average annual investment requirement for sanitary services and water services is $22,452,000. Annual revenue currently allocated to these assets for capital purposes is $4,660,000 leaving an annual deficit of $17,792,000. To put it another way, these infrastructure categories are currently funded at 21% of their longterm requirements. In 2013, Chatham-Kent PUC has annual sanitary revenues of $9,418,000 and annual water revenues of $13,034,000. As illustrated in table 5, without consideration of any other sources of revenue, full funding would require the following increases over time: 65
73 Table 5. Rate Increases Required for Full Funding Asset Category Rate Increase Required for Full Funding Sanitary Network 52.7% Water Network 59.4% As illustrated in table 9, Chatham-Kent PUC s debt payments for sanitary services will be decreasing by $0 from 2013 to 2017 (5 years). Although not illustrated, debt payments for sanitary services will be decreasing by $0 over the next 10 years, $1,948,000 over the next 15 years and $3,346,000 over the next 20 years. For water services, the amounts are $0, $0, $2,389,000 and $3,114,000 respectively. Normally, our recommendations include capturing those decreases in cost and allocating them to the applicable infrastructure deficit. However, Chatham-Kent PUC has indicated that, due to their large infrastructure deficit, they will be debt financing other infrastructure investments as existing debt payment costs are freed up. As a result, these decreases in cost are not available as an offset to the infrastructure deficit. Tables 6a and 6b outline the above concept and present a number of options: Table 6a. Without Change in Debt Costs Sanitary Network Water Network Infrastructure Deficit as Outlined in Table 4 Change in Debt Costs Resulting Infrastructure Deficit 5 Years 10 Years 15 Years 20 Years 5 Years 10 Years 15 Years 20 Years 7,239,000 7,239,000 7,239,000 7,239,000 10,553,000 10,553,000 10,553,000 10,553,000 N/A N/A N/A N/A N/A N/A N/A N/A 7,239,000 7,239,000 7,239,000 7,239,000 10,553,000 10,553,000 10,553,000 10,553,000 Resulting Rate Increase Required: Total Over Time 52.7% 52.7% 52.7% 52.7% 59.4% 59.4% 59.4% 59.4% Annually 10.5% 5.3% 3.5% 2.6% 11.9% 5.9% 4.0% 3.0% 66
74 Table 6b. With Change in Debt Costs Sanitary Network Water Network Infrastructure Deficit as Outlined in Table 4 Change in Debt Costs Resulting Infrastructure Deficit 5 Years 10 Years 15 Years 20 Years 5 Years 10 Years 15 Years 20 Years 7,239,000 7,239,000 7,239,000 7,239,000 10,553,000 10,553,000 10,553,000 10,553, ,948,000-3,346, ,389,000-3,114,000 7,239,000 7,239,000 5,291,000 3,893,000 10,553,000 10,553,000 8,164,000 7,439,000 Resulting Rate Increase Required: Total Over Time 52.7% 52.7% 38.6% 28.4% 59.4% 59.4% 45.9% 41.8% Annually 10.5% 5.3% 2.6% 1.4% 11.9% 5.9% 3.1% 2.1% Considering the above information, we recommend the 15 year option in table 6a that does not include the reallocations. This involves full funding being achieved over 15 years by: a) increasing rate revenues by 3.5% for sanitary services and 4.0% for water services each year for the next 15 years solely for the purpose of phasing in full funding to the asset categories covered in this section of the AMP. b) increasing existing and future infrastructure budgets by the applicable inflation index on an annual basis in addition to the deficit phase-in. Notes: 1. As in the past, periodic senior government infrastructure funding will most likely be available during the phase-in period. By Provincial AMP rules, this funding cannot be incorporated into an AMP unless there are firm commitments in place. 2. We realize that raising rate revenues by the amounts recommended above for infrastructure purposes will be very difficult to do. However, considering a longer phase-in window may have even greater consequences in terms of infrastructure failure. 3. Any increase in rates required for operations would be in addition to the above recommendations. Although this option achieves full funding on an annual basis in 15 years and provides financial sustainability over the period modeled (to 2050), the recommendations do require prioritizing capital projects to fit the resulting annual funding available. As of 2013, age based data shows a pent up investment demand of $0 for sanitary services and $0 for water services. Prioritizing future projects will require the age based data to be replaced by condition based data. 7.5 Use of debt For reference purposes, table 7 outlines the premium paid on a project if financed by debt. For example, a $1M project financed at 3.0% 1 over 15 years would result in a 26% premium or $260,000 of increased costs due to interest payments. For simplicity, the table does not take into account the time value of money or the effect of inflation on delayed projects. 1 Current municipal Infrastructure Ontario rates for 15 year money is 3.2%. 67
75 Table 7. Total Interest Paid as a % of Project Costs Interest Rate Number of Years Financed % 22% 42% 65% 89% 115% 142% 6.5% 20% 39% 60% 82% 105% 130% 6.0% 19% 36% 54% 74% 96% 118% 5.5% 17% 33% 49% 67% 86% 106% 5.0% 15% 30% 45% 60% 77% 95% 4.5% 14% 26% 40% 54% 69% 84% 4.0% 12% 23% 35% 47% 60% 73% 3.5% 11% 20% 30% 41% 52% 63% 3.0% 9% 17% 26% 34% 44% 53% 2.5% 8% 14% 21% 28% 36% 43% 2.0% 6% 11% 17% 22% 28% 34% 1.5% 5% 8% 12% 16% 21% 25% 1.0% 3% 6% 8% 11% 14% 16% 0.5% 2% 3% 4% 5% 7% 8% 0.0% 0% 0% 0% 0% 0% 0% It should be noted that current interest rates are near all-time lows. Sustainable funding models that include debt need to incorporate the risk of rising interest rates. The following graph shows where historical lending rates have been: 16.00% 14.00% 12.00% 10.00% 8.00% 6.00% 4.00% 2.00% Historical Prime Business Interest Rate 0.00% Year As illustrated in table 7, a change in 15 year rates from 3% to 6% would change the premium from 26% to 54%. Such a change would have a significant impact on a financial plan. Tables 8 and 9 outline how Chatham-Kent has historically used debt for investing in the asset categories as listed. There is currently $70,738,000 of debt outstanding for the assets covered by this AMP. In terms of overall debt capacity, Chatham-Kent currently has $132,197,000 of total outstanding debt and $17,933,000 68
76 of total annual principal and interest payment commitments. These principal and interest payments are well within its provincially prescribed annual maximum of $48,090,000. Asset Category Table 8. Overview of Use of Debt Current Debt Outstanding Use Of Debt in the Last Five Years Road Network 2,271, ,700, Bridges & Culverts > 3m 10,936, ,533, Social Housing 9,688, ,000 Total Tax Funded 22,895, ,233, ,000 Sanitary Network 36,920, ,045, Water Network 33,818, ,200, Total rate Funded 70,738, ,245, Total AMP Debt 93,633, ,478, ,000 Non AMP Debt 38,564, Overall Total 132,197, ,478, ,000 Table 9. Overview of Debt Costs Principal & Interest Payments in the Next Five Years Asset Category Road Network 703, , , , ,000 Bridges & Culverts > 3m 2,000,000 2,000,000 2,000,000 2,000,000 1,302,000 Social Housing 1,125,000 1,149,000 1,149,000 1,149,000 1,142,000 Total Tax Funded 3,828,000 3,852,000 3,359,000 3,359,000 2,654,000 Sanitary Network 3,346,000 3,346,000 3,346,000 3,346,000 3,346,000 Water Network 3,114,000 3,114,000 3,114,000 3,114,000 3,114,000 Total Rate Funded 6,460,000 6,460,000 6,460,000 6,460,000 6,460,000 Total Amp Debt 10,288,000 10,312,000 9,819,000 9,819,000 9,114,000 Non Amp Debt 7,645,000 7,636,000 4,000,000 4,000,000 4,000,000 Overall Total 17,933,000 17,948,000 13,819,000 13,819,000 13,114,000 The revenue options outlined in this plan allow Chatham-Kent to fully fund its long-term infrastructure requirements without further use of debt. However, as explained in sections and 7.4.2, the recommended condition rating analysis may require otherwise. As outlined in section 7.4.2, Chatham-Kent PUC will require the use of debt in the future until such time as the infrastructure deficit is decreased to a lower level. 69
77 7.6 Use of reserves Available reserves Reserves play a critical role in long-term financial planning. The benefits of having reserves available for infrastructure planning include: the ability to stabilize tax rates when dealing with variable and sometimes uncontrollable factors financing one-time or short-term investments accumulating the funding for significant future infrastructure investments managing the use of debt normalizing infrastructure funding requirements By infrastructure category, table 10 outlines the details of the reserves currently available to Chatham-Kent. Table 10. Summary of Reserves Available Asset Category Balance at December 31, 2012 Road Network 3,013,000 Bridges & Culverts > 3m 1,668,000 Social Housing 5,821,000 Total Tax Funded 10,502,000 Water Network -1,445,000 Sanitary Network 444,000 Total Rate Funded -1,001,000 There is considerable debate in the municipal sector as to the appropriate level of reserves that a municipality should have on hand. There is no clear guideline that has gained wide acceptance. Factors that municipalities should take into account when determining their capital reserve requirements include: breadth of services provided age and condition of infrastructure use and level of debt economic conditions and outlook internal reserve and debt policies The reserves in table 10 are available for use by applicable asset categories during the phase-in period to full funding. This, coupled with Chatham-Kent s judicious use of debt in the past, allows the scenarios to assume that, if required, available reserves and debt capacity can be used for high priority and emergency infrastructure investments in the short to medium-term. The deficit in the water services reserve will have to be addressed by future operating budgets Recommendation As Chatham-Kent updates its AMP and expands it to include other asset categories, we recommend that future planning should include determining what its long-term reserve balance requirements are and a plan to achieve such balances. 70
 x (% of total replacement value) 3. Overall Rating (Condition vs. Performance star rating) + (Funding vs.")
78 8.0 Report Card Calculations Key Calculations 1. Weighted, unadjusted star rating : (% of assets in given condition) x (potential star rating) 2. Adjusted star rating (weighted, unadjsted star rating) x (% of total replacement value) 3. Overall Rating (Condition vs. Performance star rating) + (Funding vs. Need star rating) 2 71
THE ASSET MANAGEMENT PLAN FOR THE CITY OF NIAGARA FALLS
 THE ASSET MANAGEMENT PLAN FOR THE CITY OF NIAGARA FALLS 2013 THE CITY OF NIAGARA FALLS 4310 QUEEN STREET NIAGARA FALLS, ONTARIO, L2E 6X5 SUBMITTED DECEMBER 2013 BY PUBLIC SECTOR DIGEST 148 FULLARTON STREET,
The City of Owen Sound Asset Management Plan
 The City of Owen Sound Asset Management Plan December 013 Adopted by Council March 4, 014 TABLE OF CONTENTS 1 EXECUTIVE SUMMARY... 1 INTRODUCTION....1 Vision.... What is Asset Management?....3 Link to
SUBMITTED MARCH 2014 BY PUBLIC SECTOR DIGEST 148 FULLARTON STREET, SUITE 1410 LONDON, ONTARIO, N6A 5P3
 THE ASSET MANAGEMENT PLAN FOR THE MUNICIPALITY OF LAMBTON SHORES 2014 THE MUNICIPALITY OF LAMBTON SHORES 7883 AMTELECOM PARKWAY FOREST, ONTARIO, N0N IJ0 SUBMITTED MARCH 2014 BY PUBLIC SECTOR DIGEST 148
AMP2016. i t r i g e s t. c o w w w. p u b l i c s e c t o r d i g e s t. c o m. The 2016 Asset Management Plan for the Township of Hamilton
 AMP2016 i t r i g e s t. c o w w w. p u b l i c s e c t o r d i g e s t. c o m The 2016 Asset Management Plan for the Township of Hamilton SUBMITTED BY THE PUBLIC SECTOR DIGEST INC. (PSD) WWW.PUBLICSECTORDIGEST.COM
AMP2016. County of Grey. The 2016 Asset Management Plan for the. w w w. p u b l i c s e c t o r d i g e s t. c o m
 AMP2016 w w w. p u b l i c s e c t o r d i g e s t. c o m The 2016 Asset Management Plan for the County of Grey SUBMITTED BY THE PUBLIC SECTOR DIGEST INC. (PSD) WWW.PUBLICSECTORDIGEST.COM JULY 2017 Contents
SUBMITTED DECEMBER 2013 BY PUBLIC SECTOR DIGEST 148 FULLARTON STREET, SUITE 1410 LONDON, ONTARIO, N6A 5P3
 THE ASSET MANAGEMENT PLAN FOR THE LOCAL SERVICES BOARD OF ROSSPORT 2013 THE LOCAL SERVICES BOARD OF ROSSPORT 215 LLOYD LANE NICOL ISLAND, ONTARIO, P0T 2S0 SUBMITTED DECEMBER 2013 BY PUBLIC SECTOR DIGEST
THE ASSET MANAGEMENT PLAN FOR THE MUNICIPALITY OF LEAMINGTON
 THE ASSET MANAGEMENT PLAN FOR THE MUNICIPALITY OF LEAMINGTON 2013 THE MUNICIPALITY OF LEAMINGTON 111 ERIE STREET NORTH LEAMINGTON, ONTARIO, N8H 2Z9 SUBMITTED DECEMBER 2013 BY PUBLIC SECTOR DIGEST 148 FULLARTON
THE ASSET MANAGEMENT PLAN FOR THE TOWN OF CALEDON
 THE ASSET MANAGEMENT PLAN FOR THE TOWN OF CALEDON 2013 THE TOWN OF CALEDON 6311 OLD CHURCH ROAD, CALEDON, ONTARIO, L7C 1J6 SUBMITTED DECEMBER 2013 BY PUBLIC SECTOR DIGEST 148 FULLARTON STREET, SUITE 1410
Asset Management. Linking Levels of Service and Lifecycle Management Strategies Andrew Grunda Peter Simcisko
 Asset Management Linking Levels of Service and Lifecycle Management Strategies Andrew Grunda Peter Simcisko 1 Introduction Topics that we will address today Review of Ontario Regulation 588/17 Defining
City of Welland. Comprehensive Asset Management Plan. GMBP File: January 13, Prepared By:
 Prepared By: City of Welland Comprehensive Asset Management Plan GMBP File: 614013 January 13, 2015 GUELPH OWEN SOUND LISTOWEL KITCHENER EXETER HAMILTON GTA 650 WOODLAWN RD. W., BLOCK C, UNIT 2, GUELPH
THE TOWNSHIP OF DOURO-DUMMER 894 SOUTH STREET WARSAW, ONTARIO, K0L 3A0
 THE ASSET MANAGEMENT PL AN FOR TH E TOWNSHI P OF DOURO-DUMMER Phase I I : Facilities, Land I mprovements, C omputer Hardware & Software, Eq uipment, Vehicles 2015 THE TOWNSHIP OF DOURO-DUMMER 894 SOUTH
THE ASSET MANAGEMENT PLAN FOR THE TOWNSHIP OF CENTRAL FRONTENAC
 THE ASSET MANAGEMENT PLAN FOR THE TOWNSHIP OF CENTRAL FRONTENAC 2014 THE TOWNSHIP OF CENTRAL FRONTENAC 1084 ELIZABETH ST, PO BOX 89 SHARBOT LAKE, ONTARIO, K0H 2P0 SUBMITTED OCTOBER 2014 BY PUBLIC SECTOR
Strategic Asset Management Policy
 Strategic Asset Management Policy Submission Date: 2018-04-24 Approved by: Council Approval Date: 2018-04-24 Effective Date: 2018-04-24 Resolution Number: Enter policy number. Next Revision Due: Enter
AMP2016. w w w. p u b lii c s e ctt orr di igg ee sst t.. cco o m. The 2016 Asset Management Plan for the Municipality of Grey Highlands
 AMP2016 w w w. p u b lii c s e ctt orr di igg ee sst t.. cco o m The 2016 Asset Management Plan for the Municipality of Grey Highlands SUBMITTED BY THE PUBLIC SECTOR DIGEST INC. (PSD) WWW.PUBLICSECTORDIGEST.COM
perthcounty_amp2_d The Asset Management Plan for the County of Perth October 2016
 The Asset Management Plan for the County of Perth October 2016 1 Content Executive Summary... 8 I. Introduction & Context... 9 II. Asset Management...10 III. AMP Objectives and Content...11 IV. Data and
ASSET MANAGEMENT PLAN EXECUTIVE SUMMARY
 ASSET MANAGEMENT PLAN EXECUTIVE SUMMARY To ensure our municipal assets are maintained and renewed INDEX in a responsible and financially sustainable manner. 2016 INTRODUCTION Our first Asset Management
Asset Management Plan
 2016 Asset Management Plan United Counties of Prescott and Russell 6/1/2016 Preface This Asset Management Plan is intended to describe the infrastructure owned, operated, and maintained by the United Counties
MUNICIPALITY OF MISSISSIPPI MILLS. plan. December, 2016
 MUNICIPALITY OF MISSISSIPPI MILLS plan December, 2016 PREFACE This Asset Management Plan is intended to describe the infrastructure owned, operated and maintained by the Municipality of Mississippi Mills
Asset Management Investment Plan
 Asset Management Plan Prepared for the City of Kimberley 304-1353 Ellis Street Kelowna, BC, V1Y 1Z9 T: 250.762.2517 F: 250.763.5266 June 2016 File: 1162.0014.01 A s s e t M a n a g e m e n t I n v e s
Municipal Asset Management Plans
 Municipal Asset Management Plans AMCTO Webinar October 12, 2012 Agenda Introduction Municipal Infrastructure Investment Initiative Asset Management Scoping Asset Management Approaches State of Local Infrastructure
South Huron Asset Management Program. Spending the right amount of money, on the right assets, at the right time
 South Huron Asset Management Program Spending the right amount of money, on the right assets, at the right time Current Asset Management Plan Identifies all asset classes with condition data mainly for
SUBJECT/REPORT NO: Ontario Ministry of Infrastructure Asset Management Plan Requirements (FCS13077/PW13077) (City Wide)
 (City Wide)") TO: Mayor and Members General Issues Committee WARD(S) AFFECTED: CITY WIDE COMMITTEE DATE: October 16, 2013 SUBJECT/REPORT NO: Ontario Ministry of Infrastructure Asset Management Plan Requirements (FCS13077/PW13077)
TO: Mayor and Members General Issues Committee WARD(S) AFFECTED: CITY WIDE COMMITTEE DATE: October 16, 2013 SUBJECT/REPORT NO: Ontario Ministry of Infrastructure Asset Management Plan Requirements (FCS13077/PW13077)
COUNTY OF LAMBTON ASSET MANAGEMENT PLAN 2013
 COUNTY OF LAMBTON ASSET MANAGEMENT PLAN 2013 Pictures Key Front Cover Top Row 1) Administration Building Second Row, left to right 2) Brigden EMS Station 3) Judith & Norman Alix Art Gallery Third row,
MONETARY PERFORMANCE APPLIED TO PAVEMENT OPTIMIZATION DECISION MANAGEMENT
 MONETARY PERFORMANCE APPLIED TO PAVEMENT OPTIMIZATION DECISION MANAGEMENT Gordon Molnar, M.A.Sc., P.Eng. UMA Engineering Ltd., 17007 107 Avenue, Edmonton, AB, T5S 1G3 gordon.molnar@uma.aecom.com Paper
Norfolk County Asset Management Plan Roads
 Norfolk County Asset Management Plan Roads An overview of the County s Asset Management Practices based on the Ontario Ministry of Infrastructure s Building Together Initiative Prepared for: Norfolk County
That the report from the Director of Finance regarding the Strategic Asset Management Policy, dated June 20, 2018, be received; and
 Staff Report To: From: Mayor and Council Jeff Schmidt, Director of Finance Date: June 20, 2018 Subject: Strategic Asset Management Policy Report Highlights Provincial regulation (O.Reg. 588/17 - Asset
An Inclusive and Data-Rich Approach to Infrastructure Development
 Network-Level Analysis An Inclusive and Data-Rich Approach to Infrastructure Development By Israr Ahmad and John Murray The state of a community s capital infrastructure is inextricably linked with its
Asset Management Plan 2016 Township of King
 Asset Management Plan 206 Township of King GHD Allstate Parkway Suite 30 Markham Ontario L3R 9T8 T 905 752 4300 F 905 752 430 5432 Table of Contents. 2. 3. 4. 5. 6. Executive Summary. Introduction.2 State
Asset Management Plan Contract No. ES-13-2
 Asset Management Plan Contract No. ES-13-2 Prepared For: Prepared By: Robinson Consultants Inc. In association with BMA Management Inc. Our Project No. 13030 November 2013 Acknowledgements Robinson Consultants
The Corporation of the County of Prince Edward
 Prepared for: Prepared by: The Corporation of the County of Prince Edward KPMG LLP Shire Hall, 332 Main Street 863 Princess Street, Suite 400 Picton, ON K0K 2T0 Kingston, ON K7L 5C8 Tel: 613.476.2148 Tel:
CORPORATE AND EMERGENCY SERVICES
 CORPORATE AND EMERGENCY SERVICES Asset Management Plan April 19, 2018 EXECUTIVE SUMMARY CONTENTS Page (i) 1. INTRODUCTION 1.1 Overview 1-1 1.2 Plan Development 1-1 1.3 Maintaining the Asset Management
Asset Management Plan
 Asset Management Plan NOW.. AND BEYOND Sustainable Good stewardship Locally influenced Prepared for the Corporation of the Township of Evanturel By: Amy Vickery-Menard, CMO Clerk-Treasurer Township of
Fire. Service Area Asset Management Plan. Town of Whitby. Town of Whitby Fire Service Area Asset Management Plan DECEMBER 2017 ASSET HEALTH GRADE
 Town of Whitby Service Area Asset Management Plan Fire DECEMBER 2017 ASSET HEALTH GRADE A FINANCIAL CAPACITY GRADE D KEY PERFORMANCE INDICATOR = Contents Executive Summary 6 1. Introduction 8 1.1 What
THE STATE OF ONTARIO S ROADS AND BRIDGES AN ANALYSIS OF 93 MUNICIPALITIES
 THE STATE OF ONTARIO S ROADS AND BRIDGES AN ANALYSIS OF 93 MUNICIPALITIES 2015 Prepared for the Association of Municipalities of Ontario IN TE LLIGE NCE FOR THE PUB LIC SEC TOR. About The Public Sector
Asset Management Plan Prepared by the Town of Halton Hills
 ASSET MANAGEMENT PLAN FEBRUARY 2014 Asset Management Plan 2014-2023 Prepared by the Town of Halton Hills February 2014 Community Vision Halton Hills is a vibrant and distinctive small Town in the Greater
City of Markham Asset Management Plan
 2016 City of Markham Asset Management Plan Table of Content 1. Executive Summary...4 2. Introduction...7 2.1 Provincial Guidelines on Asset Management Plans...7 2.2 City of Markham Goals / Strategic Plan...7
TIP SHEET 1: REPORTING TO COUNCIL ON ASSET MANAGEMENT PLANS
 TIP SHEET 1: REPORTING TO COUNCIL ON ASSET MANAGEMENT PLANS Introduction Municipal staff are tasked with keeping their councils and the public informed about infrastructure related activities. Getting
THE DISTRICT OF MUSKOKA ASSET MANAGEMENT PLAN FOR ROADS, BRIDGES, WATER AND WASTEWATER ASSETS
 THE DISTRICT OF MUSKOKA ASSET MANAGEMENT PLAN FOR ROADS, BRIDGES, WATER AND WASTEWATER ASSETS MAY 29, 2014 EXECUTIVE SUMMARY CONTENTS Page (i) 1. INTRODUCTION 1.1 Overview 1-1 1.2 Plan Development 1-1
ASSET MANAGEMENT PLAN. HEMSON C o n s u l t i n g L t d. 30 Saint Patrick Street, Suite 1000 Toronto, ON, M5T 3A3
 ASSET MANAGEMENT PLAN C o n s u l t i n g L t d. 30 Saint Patrick Street, Suite 1000 Toronto, ON, M5T 3A3 March 2017 TABLE OF CONTENTS EXECUTIVE SUMMARY... 1 A. STATE OF THE LOCAL INFRASTRUCTURE... 1 B.
Chapter 8: Lifecycle Planning
 Chapter 8: Lifecycle Planning Objectives of lifecycle planning Identify long-term investment for highway infrastructure assets and develop an appropriate maintenance strategy Predict future performance
Asset Management Planning: Legislation & Integration
 Asset Management Planning: Legislation & Integration AMCTO Conference Dan Wilson, Director Watson & Associates Economists Ltd. Val Sequeira, Director of Corporate Services/Treasurer Town of Gravenhurst
CITY OF WATERLOO Water & Sanitary Sewer Rate Design Study Final Report & Financial Plan No
 CITY OF WATERLOO Water & Sanitary Sewer Rate Design Study Final Report & Financial Plan No. 112301 April 1st 2016 DFA Infrastructure International Inc. dfa DFA Infrastructure International Inc. 33 Raymond
Report to Committee of the Whole
 Report to Committee of the Whole To: Mayor Linton and Members of Council Prepared By: Dan Wilson, Managing Director of Corporate Services / Treasurer Report: COR2018-10 Date: 19 Mar 2018 RE: Asset Management
Asset Management Plan Public Works, Social Housing, Parks and Recreation Infrastructure City of Brantford, Ontario
 2017 Asset Management Plan Public Works, Parks and Recreation and Social Housing Infrastructure Asset Management Plan Public Works, Social Housing, Parks and Recreation Infrastructure City of Brantford,
Residential Street Improvement Plan
 Residential Street Improvement Plan Introduction Aging infrastructure, including streets, is a nationwide problem and it is one of the biggest challenges facing many cities and counties throughout the
City of Greater Sudbury. Municipal Asset Management Plan
 City of Greater Sudbury Municipal Asset Management Plan Presentation to City Council December 13 th, 2016 Why Asset Management Planning Matters Both the Federal and Provincial governments have established
MPO Staff Report Technical Advisory Committee: April 8, 2015 MPO Executive Board: April 15, 2015
 MPO Staff Report Technical Advisory Committee: April 8, 2015 MPO Executive Board: April 15, 2015 RECOMMENDED ACTION: Approve the Final. RECOMMENDED ACTION from TAC: Accept the Final and include the NDDOT
The Corporation of the Municipality of Central Elgin ORDER OF THE DAY
 Page The Corporation of the Municipality of Central Elgin ORDER OF THE DAY FOR THE REGULAR MEETING OF COUNCIL ON MONDAY, DECEMBER 23rd, 2013 @ 1:00 PM IN THE COUNCIL CHAMBERS Roll Call Disclosure of Pecuniary
The purpose of this report is to present the Oshawa Asset Management Plan for Council endorsement.
 Public Report To: From: Report Number: Council in Committee of the Whole Jag Sharma, City Manager, Office of the City Manager CM-16-35 Date of Report: December 2, 2016 Date of Meeting: December 9, 2016
Using Asset Management Planning to Make Roadway Improvements
 Using Asset Management Planning to Make Roadway Improvements 1 Presentation Overview Status of Municipal Infrastructure Asset Management 101 15+ Year Pavement Life cycle Data, M,R&R, Prediction Models,
Town of Huntsville Municipal Asset Management Plan
 Town of Huntsville Municipal Asset Management Plan Adopted by Council (Resolution 470-13) December 20, 2013 1 P a g e Table of Contents Executive Summary... 3 Introduction... 4 State of Local Infrastructure...
Multisector Asset Management Case Studies CHAPTER 5 THE PORTLAND, OREGON, EXPERIENCE
 56 Multisector Asset Management Case Studies CHAPTER 5 THE PORTLAND, OREGON, EXPERIENCE The City of Portland (City) with a population of 568,000 comprises an area of approximately 145 square miles in north-western
JUNE 2015 STRATEGIC PLAN
 JUNE 2015 STRATEGIC PLAN LOOKING TOWARDS 2025 INDEX 1. Introduction 2. Strategic Plan Process a. Strategic Plan Workshop b. Strategic Plan Alignment c. Strategic Plan Process d. Strategic Initiatives Report
CITY OF GREATER SUDBURY
 CITY OF GREATER SUDBURY WATER & WASTEWATER ASSET MANAGEMENT PLAN City Council Presentation No.4 April 11 th, 2017 PURPOSE WATER AND WASTEWATER ASSET MANAGEMENT PLAN Strategic document to: Guide City s
Using Reserves and Reserve Fund Strategies to meet your challenging needs ahead!
 Using Reserves and Reserve Fund Strategies to meet your challenging needs ahead! MFOA, ON September 22, 2016 Dean Decaire, CPA, CA Audit Client Service Partner Joe Filippelli Advisory Services Senior Manager
City of Glendale, Arizona Pavement Management Program
 City of Glendale, Arizona Pavement Management Program Current Year Plan (FY 2014) and Five-Year Plan (FY 2015-2019) EXECUTIVE SUMMARY REPORT December 2013 TABLE OF CONTENTS TABLE OF CONTENTS I BACKGROUND
Stormwater System Asset Management Plan. June 2018
 Stormwater System Asset Management Plan June 2018 City Council Citizens, stakeholders Strategic Priorities Level of Service Goals Performance Measures What actions are needed to meet Level of Service Goals
p Local governments in Canada moved from a modified accrual to a full accrual accounting approach.
 PSAB 3150 p Local governments in Canada moved from a modified accrual to a full accrual accounting approach. p The primary change for local governments was the accounting treatment for tangible capital
Treasury Board Secretariat. Follow-Up on VFM Section 3.07, 2015 Annual Report RECOMMENDATION STATUS OVERVIEW
 Chapter 1 Section 1.07 Treasury Board Secretariat Infrastructure Planning Follow-Up on VFM Section 3.07, 2015 Annual Report Chapter 1 Follow-Up Section 1.07 RECOMMENDATION STATUS OVERVIEW # of Status of
2017 ENTERPRISE ASSET MANAGEMENT PLAN
 Corporate Asset Management 2017 ENTERPRISE ASSET MANAGEMENT PLAN Investments in Peel s Infrastructure We are all asset managers! Executive Summary The Region s infrastructure is a public investment with
ASSET MANAGEMENT PLANS: GETTING YOU PREPARED ROMA Conference
 ASSET MANAGEMENT PLANS: GETTING YOU PREPARED 2019 ROMA Conference January 28, 2019 What is Asset Management? Coordinated activity of municipal staff and elected officials to provide sustainable levels
Township of Melancthon Asset Management Plan
 Township of Melancthon Asset Management Plan R.J. Burnside & Associates Limited 15 Townline Orangeville ON L9W 3R4 CANADA 300038690.2016 Township of Melancthon i Table of Contents Executive Summary 1.0
City of Mississauga Municipal Performance Measurements Program (MPMP) Results. For the period ending December 31, 2013
 Results. For the period ending December 31, 2013") City of Mississauga Municipal Performance Measurements Program (MPMP) For the period ending December 31, Prepared by: Finance Division, Corporate Services Department City of Mississauga CITY OF MISSISSAUGA
City of Mississauga Municipal Performance Measurements Program (MPMP) For the period ending December 31, Prepared by: Finance Division, Corporate Services Department City of Mississauga CITY OF MISSISSAUGA
Update on Municipal Asset Management Planning
 Update on Municipal Asset Management Planning Municipal Finance Officers Association Conference Ontario Ministry of Infrastructure September 20, 2017 Overview Municipal asset management planning in Ontario
The Three Planning Windows of Asset Management John Murray City of Hamilton May 9 th, 2012 CNAM - Montreal. Hamilton Asset Management Plan
 The Three Planning Windows of Asset Management John Murray City of Hamilton May 9 th, 2012 CNAM - Montreal 1 City of Hamilton Amalgamated - 2001 7 Area Municipalities Population 500,000 The City of Waterfalls
What is Asset Management?
 David Allen, Chief Administrative Officer, City of Courtney Andy Wardell, Manager, Financial Services, District of North Vancouver Co-Chairs, Asset Management BC What is Asset Management? How can Asset
TOWN OF COLLINGWOOD ASSET MANAGEMENT PLAN
 TOWN OF COLLINGWOOD ASSET MANAGEMENT PLAN JUNE 24, 2014 EXECUTIVE SUMMARY CONTENTS Page (i) 1. INTRODUCTION 1.1 Overview 1-1 1.2 Plan Development 1-1 1.3 Maintaining the Asset Management Plan 1-2 1.4
A COMPREHENSIVE REVIEW OF APPROACHES USED BY ONTARIO MUNICIPALITIES TO DEVELOP ROAD ASSET MANAGEMENT PLANS
 0 A COMPREHENSIVE REVIEW OF APPROACHES USED BY ONTARIO MUNICIPALITIES TO DEVELOP ROAD ASSET MANAGEMENT PLANS Tamer E. El-Diraby Associate Professor, Department of Civil Engineering, University of Toronto.
Header Tile ATTACHMENT 2. City of Saskatoon
 Header Tile ATTACHMENT 2 2 Building Better Infrastructure The Administration evaluates the condition of the City s assets in order to develop annual programs to maintain the assets at a minimum cost. Where
Finance and Treasury Department
 Mission To provide financial governance, accountability and safeguard the City s assets while providing financial advice and strategy from both a department and corporate perspective Our Road Map Overview
Special Meeting of Council. 1.1 Strategic Decision Making; Council Priorities, Core Service Review and 2013 Service-Based Budget Process
 City of Saint John Common Council Meeting Wednesday, July 18, 2012 Special Meeting of Council 1. Call to Order Prayer 9:30 a.m. Council Chamber 1.1 Strategic Decision Making; Council Priorities, Core Service
Budget and Financial Controls Policy
 Approved via Resolution 2015-139 Budget and Financial Controls Policy Scope 1. This policy applies to all Town departments, boards, committees, and other organizations falling within the reporting requirements
1.0 CITY OF HOLLYWOOD, FL
 1.0 CITY OF HOLLYWOOD, FL PAVEMENT MANAGEMENT SYSTEM REPORT 1.1 PROJECT INTRODUCTION The nation's highways represent an investment of billions of dollars by local, state and federal governments. For the
Water Service Asset Management Plan
 Water Service Asset Management Plan November 2016 Joel Shaw, P.Eng. 1435 Water Street Kelowna, BC V1Y 1J4 TEL (250) 469-8739 jshaw@kelowna.ca kelowna.ca Document Control Rev No Date Revision Details Author
Implementation of an Asset Management Plan
 Municipal Finance Officers Association of Ontario 2006 Annual Conference Implementation of an Asset Management Plan Chad McCleave, CA PricewaterhouseCoopers September 21, 2006 pwc Municipal Infrastructure
Background. Request for Decision. Asset Management Plan. Resolution. Presented: Tuesday, Dec 13, Report Date Tuesday, Nov 29, 2016
 Presented To: City Council Request for Decision Asset Management Plan Presented: Tuesday, Dec 13, 2016 Report Date Tuesday, Nov 29, 2016 Type: Presentations Resolution THAT the City of Greater Sudbury
The regulation proposes that municipalities must prepare asset management plans which would meet the requirements of the regulation, such as:
 PROPOSED ASSET MANAGEMENT PLANNING REGULATION BACKGROUND On May 25, 2017, the Ministry of Infrastructure released a proposed regulation under the Infrastructure for Jobs and Prosperity Act, 2015. The proposed
Tax Supported Preliminary Operating Budget. Book 1. Budget Summary Report FCS17001
 2017 Tax Supported Preliminary Operating Budget Book 1 Budget Summary Report FCS17001 BOOK ONE: 2017 PRELIMINARY TAX SUPPORTED OPERATING BUDGET SUMMARY LIST OF APPENDICES APPENDIX DESCRIPTION PAGE Tax
Revenue Sharing Program Guidelines
 Revenue Sharing Program Guidelines For further information, contact Local VDOT Manager or Local Assistance Division Virginia Department of Transportation 1401 East Broad Street Richmond, Virginia 23219
Self Assessment Tool
 Self Assessment Tool Objectives of SAT Provide objective assessments for municipalities Measure progression over time of AM Educate the municipalities about the complexity of AM and their progress on the
Asset Management Plan The Corporation of the Town of Wasaga Beach
 Asset Management Plan The Corporation of the Town of Wasaga Beach Council Approved Nov-2016 Table of Contents Executive Summary... 2 Introduction... 4 Mission and Goals... 6 State of Local Infrastructure...
C ITY OF S OUTH E UCLID
 C ITY OF S OUTH E UCLID T A B L E O F C O N T E N T S 1. Executive Summary... 2 2. Background... 3 3. PART I: 2016 Pavement Condition... 8 4. PART II: 2018 Current Backlog... 12 5. PART III: Maintenance
Transfer of Federal Gas Tax Revenues Under the New Deal for Cities and Communities. Municipal Funding Agreement Guide.
 Transfer of Federal Gas Tax Revenues Under the New Deal for Cities and Communities Municipal Funding Agreement Guide January 2010 Administered by: Association of Municipalities of Ontario 200 University
City of Prince Albert YEAR STRATEGIC PLAN
 5 City of Prince Albert YEAR STRATEGIC PLAN 2015-2020 City of Prince Albert Introduction Members of City Council, along with Senior Administration, attended a two-day Strategic Planning Session for the
WORKSHOP 1: LONG-RANGE FINANCIAL PLANNING
 WORKSHOP 1: LONG-RANGE FINANCIAL PLANNING Tuesday, September 19, 2017 Overview of Today s Session Timeframe Topic/Discussion 20 min What is long-range financial planning and why is it important? 10 min
ASSET MANAGEMENT INVESTMENT PLAN
 CITY OF GRAND FORKS ASSET MANAGEMENT INVESTMENT PLAN 0788.0018.01 March, 2011 Prepared by: Prepared by: Suite 304-1353 Ellis Street Kelowna, BC V1Y 1S9 Telephone: (250) 762-2517 Fax: (250) 763-5266 USL
Capital and Debt. Capital Expenditures 2017 to 2021 Capital Plan. Capital Plan Introduction. PSAB Tangible Capital Asset Five year Capital Plan
 Capital and Debt CAPITAL AND DEBT Capital Expenditures 2017 to 2021 Capital Plan Capital Plan Introduction Asset Management Plans Bringing it all Together The City of Regina is building an asset management
Instructions for Completing the Annual Road and Street Finance Report
 Instructions for Completing the Annual Road and Street Finance Report Additional information you wish to submit may be attached to the report on 8.5" by 11" paper. Please round all amounts up or down to
Village of Point Edward Asset Management Plan Page 1
 The existing infrastructure in the Village of Point Edward is aging and deteriorating. Over the next 50 years, much of the infrastructure will require replacement or rehabilitation. The Asset Management
Proud Heritage, Exciting Future ASSET MANAGEMENT PLAN
 Proud Heritage, Exciting Future ASSET MANAGEMENT PLAN TABLE OF CONTENTS PAGE 3 OVERVIEW 8 FACILITIES 12 FLEET 16 PLAYGROUND EQUIPMENT 19 ROADWAYS 23 BRIDGES 26 WATER RELATED ASSETS One of the goals outlined
Revenue Sharing Program Guidelines
 Revenue Sharing Program Guidelines For further information, contact Local VDOT Manager or Local Assistance Division Virginia Department of Transportation 1401 East Broad Street Richmond, Virginia 23219
Building a Better Tomorrow
 Building a Better Tomorrow Investing in Ontario s Infrastructure to Deliver Real, Positive Change A Discussion Paper on Infrastructure Financing and Procurement February 2004 2 BUILDING A BETTER TOMORROW
DEVELOPMENT CHARGES & ASSET MANAGEMENT: FULFILLING THE NEW REQUIREMENTS OF THE DCA. Monday, June 12, 2017
 DEVELOPMENT CHARGES & ASSET MANAGEMENT: FULFILLING THE NEW REQUIREMENTS OF THE DCA Monday, June 12, 2017 Today we will discuss Overview of Development Charges and Asset Management Regulatory Context Asset
NCHRP Consequences of Delayed Maintenance
 NCHRP 14-20 Consequences of Delayed Maintenance Recommended Process for Bridges and Pavements prepared for NCHRP prepared by Cambridge Systematics, Inc. with Applied Research Associates, Inc. Spy Pond
City of Waterloo Financial Dashboard
 City of Waterloo Financial Dashboard Result for Change from Result for On BMA Study? 2017 2016 2016 A. Overall Financial Position 1 Financial Position per Capita Positive improving Positive Yes 2 Financial
Township of Centre Wellington Asset Management Plan
 Township of Centre Wellington 2016 Asset Management Plan November 16, 2016 Contents Page Executive Summary... i 1. Introduction... 1-1 1.1 Overview... 1-1 1.2 Plan Development... 1-1 1.3 Maintaining the
Township of Essa. Asset Management Plan
 Township of Essa Asset Management Plan For the Ten Year Period from 2014 to 2023 December 10, 2014 H:\Treasury\Finance\Budget F05\Essa Asset Management Plan\Essa Asset Management Plan 20141210.docx Page
FY Statewide Capital Investment Strategy... asset management, performance-based strategic direction
 FY 2009-2018 Statewide Capital Investment Strategy.. asset management, performance-based strategic direction March 31, 2008 Governor Jon S. Corzine Commissioner Kris Kolluri Table of Contents I. EXECUTIVE
Asset Management Program. Background
 Asset Management Program Background The City is responsible for the maintenance and operation of assets valuing $2.8 billion. These assets are critical for the delivery of service levels expected by the
2016 Asset Management Plan
 R I C H M O N D H I L L 2016 Asset Management Plan Richmond Hill, where people come together to build our community. The 2016 Asset Management Plan was received by Richmond Hill Council on December 12,