COUNTRY GENERAL OVERVIEW
|
|
|
- Randell Foster
- 5 years ago
- Views:
Transcription

1
2 OUR OBJECTIVE TODAY Raise your awareness that there are several Brazilian IT Services and Solutions Providers that are more than capable to fit your bill with great quality, delivery precision and competitive pricing with the addition of a creative prone cultural background that gives you added value in meeting your goals.
3 AGENDA WHAT IS BRAZIL IT? COUNTRY GENERAL OVERVIEW CURRENT IT SPENDING BUSINESS EXPERTISE BRIC BENCHMARKING CULTURAL DNA COMPETITIVE ADVANTAGE OUR MESSAGE
4 WHAT IS BRAZIL IT? BRAZIL IT is a brand name for the Brazilian Federal Government s Software and Services Export Incentive Program. The government, through a permanent agency called SOFTEX, is constantly supporting the Brazilian IT companies to be competitive in the world market and reach world class recognition
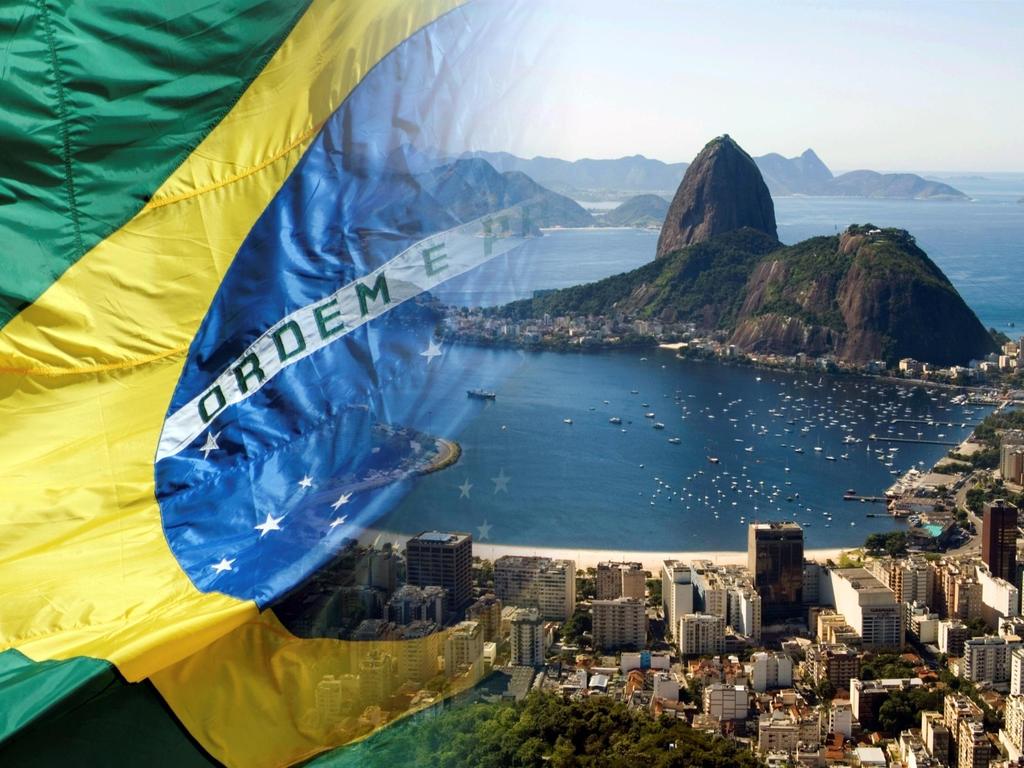
5 COUNTRY GENERAL OVERVIEW Venezuela Guiana Suriname Colombia French Guiana Ecuador Brazil Peru Bolivia Paraguay Argentina Chile Uruguay Facts and figures: Borders with 10 countries 50% of South America surface More than 8 million Km 2 50% of South American Population 190 million people 50% of South American GDP US$ 1 trillion 8 th largest in the world (PPP *) *Purchase Power Parity
6 COUNTRY GENERAL OVERVIEW GDP US $ , ,261.5 Real GDP Growth % Consumer price inflation Population (million) Exports US $ 73,084 96, ,31 137,80 161,16 Imports US $ 48,29 62,83 73,60 91,35 116,46 Reserves US $ 49,11 52,74 53,57 85,56 173,29 Total External Debt US $ 236,6 220,4 188,0 191,2 207,0 Exchange Rate (R:US $) Source: The Economist Intelligence Unit
7 COUNTRY GENERAL OVERVIEW Countries with area > 4 million km² Countries with population > 100 million Bangladesh Australia Canada France Germany Russia Nigeria USA Pakistan Brazil Indonesia China India Japan Mexico Spain Netherlands Italia UK South Korea Countries with GDP > US$ 1 trillion

8 COUNTRY GENERAL OVERVIEW Brazil has: The 2nd largest commercial air fleet in the world, The 2nd largest private executive jet s market in the world The 2nd largest agriculture vehicles market in the world, The 2nd largest jeans consumer market in the world, The 3rd largest market for copying machines in the world The 3rd largest market for TV sets in the world The 3rd largest soft drinks market in the world, The 4th largest refrigerators market in the world.


9 COUNTRY GENERAL OVERVIEW The most representative multinationals are present in Brazil

10 COMPARATIVE TOTAL DOMESTIC IT SPENDING USA US$ 439B UK US$ 80B China US$ 38B Russia US$ 14.2B Mexico US$ 9.2B Colombia US$ 2.1B Brazil US$ 16.2B Argentina US$ 2.5B India US$ 13.5B Korea US$ 14.7B Japan US$ 108B IDC data


11 BUSINESS EXPERTISE Financial Segment Retail Government Procurement Telecommunications Enterprise Applications Education & e-learning


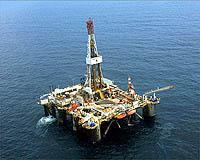

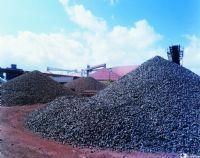


12 BUSINESS EXPERTISE Healthcare Energy Oil & Mining Agrobusiness Automotive Manufacturing
13 BRIC Benchmarking: Economic Development Overall physical infrastructure Technology infrastructure Multinational presence Brazil Russia India China solid nationwide Underpar Underpar Developing solid nationwide Underpar Only in Tech Parks All major industries Underpar Mostly IT related Only in Tech Parks Mostly IT related Global reach Maturing Underpar Matured Underpar Annual Inflation 4,5 % 8 % 11 % 8 %
14 BRIC Benchmarking: Domestic IT market Brazil Russia India China Market size U$ 16.2 bil U$ 14.3 bil U$ 13.8 bil U$ 38.0 bil Range of capabilities (mainframe to open source Financial IT Services Industry Matured Matured Developing Developing Matured Underpar Developing Underpar Business Expertise Skills Matured Developing Developing Underpar Software development quality Matured Matured Matured Developing
15 BRIC Benchmarking: Geographical facts Flying time from New York Brazil Russia India China São Paulo Moscow New Dheli Beijing 09 hrs 14 hrs 15hrs 13 hrs Time zone variation + 02 hrs + 13 hrs + 11 hrs + 13 hrs Western Cultural Proximity English business language Matured Developing Developing Under par Matured Developing Matured Under par


16 CULTURE DIVERSITY Easy understanding and adaptation to any culture No cultural barriers


17 CULTURAL DNA AS A COMPETITIVE ADVANTAGE Past economic instability and changes established a solid DNA for: Fast understanding Creative solutions Efficient process implementations Technology constantly updated
18 HOW BRAZIL S IT SKILLS ARE PERCEIVED BY ANALYSTS Expertise and Creativity are strong features Innovative professionals Extremely flexible and adaptable task force Good fine tuning with the client Good technical abilities
19 IDC S RECENT GUIDANCE MOST RECENT IDC ADVICE TO IT BUSINESS EXECUTIVES GO GREEN (WE SAY GO TO BRAZIL! IT S PLENTY GREEN) GO WEST - NEW VERTICALS AND NEW GEOGRAPHIES (WE SAY GO SOUTH) BE FLEXIBLE (WE SAY DEPLOY NEW OPTIONS THROUGH PROVEN VENDORS)


20 BEST OF BREED
21 IT SERVICES AND SOLUTIONS PORTFOLIO Applications Development Applications Maintenance Remote Infrastructure Management Staff Augmentation Risk Analysis & Management Vulnerability and Risk Assessment Governance and Compliance Business Continuity Planning


22 CONCLUSION when you are looking for software solutions and IT services......check Brazil too as it is also a world class supplier
23

24 Thank you Skype: rfjanssen Messenger:
Global Construction 2030 Expo EDIFICA 2017 Santiago Chile. 4-6 October 2017
 Global Construction 2030 Expo EDIFICA 2017 Santiago Chile 4-6 October 2017 Graham Robinson Global Construction Perspectives Global Construction 2030 is the fourth in a series of global studies of the construction
Total tax contribution in 2012 A report on the economic contribution made by BBVA Group to public finances
 1 Index 1 Introduction 2 Distribution of BBVA Group's tax payments by geographical area 3 Tax responsibility 4 5 Tax charged in the financial statements in 2012 6 Main conclusions 2 1 Introduction Tax
A Capital Opportunity. A Global Market for Mining Companies
 A Capital Opportunity A Global Market for Mining Companies Disclaimer This document is for information purposes only. While the information herein is collected and compiled with care, neither TMX Group
Global Business Barometer April 2008
 Global Business Barometer April 2008 The Global Business Barometer is a quarterly business-confidence index, conducted for The Economist by the Economist Intelligence Unit What are your expectations of
Strategies for Successful Business in Asia Fasico is proud to be a partner of
 Strategies for Successful Business in Asia Fasico is proud to be a partner of Introduction to Fasico Established as a fully independent consulting firm, in position to support European companies in Asia.
As close as you need, as far as you go
 As close as you need, as far as you go BBVA, a global group For more than 150 years our clients have been the centre of our business. Now as a highly solvent international financial group we offer clients
Charting Mexico s Economy
 Charting Mexico s Economy Designed to help executives catch up with the economy and incorporate macro impacts into company s planning. Annual subscription includes 2 semiannual issues published in June
Chile: Business Environment and Investment Opportunities
 Chile: Business Environment and Investment Opportunities Guest Speaker 14:00 15:00 GUEST SPEAKER Martin Pathan Investment Officer Foreign Investment Committee Chile: business environment and investment
FedEx International Priority. FedEx International Economy 3
 SERVICES AND RATES FedEx International Solutions for your business Whether you are shipping documents to meet a deadline, saving money on a regular shipment or moving freight, FedEx offers a suite of transportation
St. Martin 2013 SERVICES AND RATES
 SERVICES AND RATES FedEx International Solutions for your business Whether you are shipping documents to meet a deadline, saving money on a regular shipment or moving freight, FedEx offers a suite of transportation
WHY UHY? The network for doing business
 The network for doing business the network for doing business UHY has over 6,800 professionals to choose from trusted advisors and consultants operating in more than 250 business centres, based in 81 countries
Global Helicopter Forecast
 Global Helicopter Forecast C&P untapped demand is rising Key world economies are still underequipped TOP 10 Countries in 2016 ( H/C fleet in service) U.S.A. Russia Canada Brazil Australia United Kingdom
Priorities for Productivity and Income (PPIs) Country Results
 Country Results") Priorities for Productivity and Income (PPIs) Country Results Bolivia Alejandro Izquierdo Jimena Llopis Umberto Muratori Jose Juan Ruiz 2015 Priorities for Productivity and Income (PPIs) Country Results
Priorities for Productivity and Income (PPIs) Country Results Bolivia Alejandro Izquierdo Jimena Llopis Umberto Muratori Jose Juan Ruiz 2015 Priorities for Productivity and Income (PPIs) Country Results
Latin American Economic Outlook 2008
 Latin American Economic Outlook 28 Javier Santiso Director & Chief Development Economist OECD Development Centre Brasilia, 4th March 28 Banco Central do Brasil The OECD and Latin America: An emerging commitment
Country Risk Conference Coface Country Risk
 WORLD OVERVIEW OF COUNTRY RISK Country Risk Conference Coface Country Risk > Johannesburg, South Conference Africa 2014 > 12 th June 2013 Thursday, 15 th May 2014 Johannesburg, South Africa 1 Agenda 8.30
Elwin de Valk Antonio Hidalgo Lee Bennett
 Focus on Growth Elwin de Valk Antonio Hidalgo Lee Bennett 1 Health Variety Cooker China Commercial (dubbed into English for Capital Markets Day) 2 Growing in Emerging Markets Elwin de Valk Cluster Leader,
Impact of the convergence of International Financial Reporting Standards in the corporate government
 Impact of the convergence of International Financial Reporting Standards in the corporate government IFRS and the Corporate Government In Latin America, the State continues being the principal holder of
World Consumer Income and Expenditure Patterns
 World Consumer Income and Expenditure Patterns 2011 www.euromonitor.com iii Summary of Contents Contents Summary of Contents Section 1 Introduction 1 Section 2 Socio-economic parameters 21 Section 3 Annual
Investment for development:
 Investment for development: Towards a new generation of investment policies for inclusive growth and sustainable development Anabel González Minister of Foreign Trade, Costa Rica 59th Session Trade and
WHY UHY? The network for doing business
 The network for doing business UHY THE NETWORK FOR DOING BUSINESS We are connected Over 8,100 trusted advisors and consultants operating in over 320 business centres across more than 95 countries AFRICA
Auditores & Consultores S.A. Auditoria - Consultoria - Impuestos - Revisoria Fiscal - Outsourcing WHY UHY? The network for doing business
 Auditores & Consultores S.A. Auditoria - Consultoria - Impuestos - Revisoria Fiscal - Outsourcing WHY UHY? The network business WHY UHY? THE NETWORK FOR DOING BUSINESS UHY has over 6,800 professionals
Total Imports by Volume (Gallons per Country)
") 6/6/2018 Imports by Volume (Gallons per Country) YTD YTD Country 04/2017 04/2018 % Change 2017 2018 % Change MEXICO 60,968,190 71,994,646 18.1 % 231,460,145 253,500,213 9.5 % NETHERLANDS 13,307,731 10,001,693
6/6/2018 Imports by Volume (Gallons per Country) YTD YTD Country 04/2017 04/2018 % Change 2017 2018 % Change MEXICO 60,968,190 71,994,646 18.1 % 231,460,145 253,500,213 9.5 % NETHERLANDS 13,307,731 10,001,693
Public Procurement networks in Latin America and the Caribbean
 Session #7: Cross regional Learning: Cases in Caribbean and Latin American Countries Public Procurement networks in Latin America and the Caribbean Asia Pacific Public Electronic Procurement Network 2nd
EU Trade Policy and CETA
 EU Trade Policy and CETA http://www.youtube.com/watch?v=iioc5xg2i5y The EU a major trading power European Commission, 2013 The EU a major trading power % of global exports, goods, 2012 % of global exports,
2010 Annual Results. February 10, 2011
 2010 Annual Results February 10, 2011 Disclaimer This presentation contains forward-looking statements. The use of the words "aim(s)," "expect(s)," "feel(s)," "will," "may," "believe(s)," "anticipate(s)"
Putting Consumers First: The 2006 Guglielmo Marconi Lecture William W. Lewis Director Emeritus, McKinsey Global Institute Brussels, 04 December 2006
 Putting Consumers First: The 2006 Guglielmo Marconi Lecture William W. Lewis Director Emeritus, McKinsey Global Institute Brussels, 04 December 2006 Consumers First The Remaining Difference Between Europe
On Minimum Wage Determination
 On Minimum Wage Determination Tito Boeri Università Bocconi, LSE and fondazione RODOLFO DEBENEDETTI March 15, 2014 T. Boeri (Università Bocconi) On Minimum Wage Determination March 15, 2014 1 / 1 Motivations
Two tales of development
 Two tales of development BRAZIL-INDIA 17 Liliana Lavoratti, Rio de Janeiro India is still almost unknown to Brazilians in general. Given the distance not only geographically as well as quite different
Total Imports by Volume (Gallons per Country)
") 7/6/2018 Imports by Volume (Gallons per Country) YTD YTD Country 05/2017 05/2018 % Change 2017 2018 % Change MEXICO 71,166,360 74,896,922 5.2 % 302,626,505 328,397,135 8.5 % NETHERLANDS 12,039,171 13,341,929
7/6/2018 Imports by Volume (Gallons per Country) YTD YTD Country 05/2017 05/2018 % Change 2017 2018 % Change MEXICO 71,166,360 74,896,922 5.2 % 302,626,505 328,397,135 8.5 % NETHERLANDS 12,039,171 13,341,929
A world in transition: PwC s 2017 APEC CEO Survey, November APEC CEO Survey. Australia s findings.
 A world in transition: PwC s 2017 APEC CEO Survey, November 2017 2017 APEC CEO Survey Australia s findings www.pwc.com/apec Key themes Making of the workforce of the future An operating model for a fluid
Belize FedEx International Priority. FedEx International Economy 3
 SERVICES AND RATES FedEx International Solutions for your business Whether you are shipping documents to meet a deadline, saving money on a regular shipment or moving freight, FedEx offers a suite of transportation
Belize FedEx International Priority. FedEx International Economy 3
 SERVICES AND RATES FedEx International Solutions for your business Whether you are shipping documents to meet a deadline, saving money on a regular shipment or moving freight, FedEx offers a suite of transportation
Global Economic Indictors: CRB Raw Industrials & Global Economy
 Global Economic Indictors: & Global Economy December 14, 2017 Dr. Edward Yardeni 516-972-7683 eyardeni@ Mali Quintana 480-664-1333 aquintana@ Please visit our sites at www. blog. thinking outside the box
Global FDI Inflows. Global foreign direct investment (FDI) flows fell by 23 % to $1.43 trillion.
 flows fell by 23 % to $1.43 trillion.") Global FDI Inflows Distribution of Global FDI Inflows 1,92 1,87 -%23 Global foreign direct investment (FDI) flows fell by 23 % to $1.43 trillion. 1,18 1,37 1,57 1,57 1,43 1,34 1,43 This is in contrast
Global FDI Inflows Distribution of Global FDI Inflows 1,92 1,87 -%23 Global foreign direct investment (FDI) flows fell by 23 % to $1.43 trillion. 1,18 1,37 1,57 1,57 1,43 1,34 1,43 This is in contrast
T H E E C O N O M I C I M P A C T O F I T, S O F T W A R E, A N D T H E M I C R O S O F T E C O S Y S T E M O N T H E G L O B A L E C O N O M Y
 Global Headquarters: 5 Speen Street Framingham, MA 01701 USA P.508.872.8200 F.508.935.4015 www.idc.com WHITE PAPER T H E E C O N O M I C I M P A C T O F I T, S O F T W A R E, A N D T H E M I C R O S O
Overview of FSC-certified forests January January Maps of extend of FSC-certified forest globally and country specific
 Overview of FSCcertified forests January 2009 Maps of extend of FSCcertified forest globally and country specific Global certified forest area: 120.052.350 ha ( = 4,3%) + 11% Hectare FSCcertified forest
Corporate Presentation. March 2018
 Corporate Presentation March 2018 Forward-looking Statements This presentation may contain forward-looking statements, that should be considered as good faith estimates. Such statements are subject to
Low-carbon Development and Carbon Finance at the IDB Maria Netto Sustainable Energy and Climate Change Unit (ECC)
") Low-carbon Development and Carbon Finance at the IDB Maria Netto Sustainable Energy and Climate Change Unit (ECC) 11th Annual Workshop on Greenhouse Gas Emission Trading Oct 3 rd, 2011 Context for IDB
Low-carbon Development and Carbon Finance at the IDB Maria Netto Sustainable Energy and Climate Change Unit (ECC) 11th Annual Workshop on Greenhouse Gas Emission Trading Oct 3 rd, 2011 Context for IDB
The Global Summit of Women 2009 Santiago, Chile May 14-16
 The Global Summit of Women 2009 Santiago, Chile May 14-16 Presentation on Doing Business in Chile By Bruno Philippi, President, SOFOFA (Federacion Gremial de la Industria), Chile Global Summit of Women
Goldman Sachs BRICs Conference
 Goldman Sachs BRICs Conference Markus Akermann CEO Bandra Worli Sea Link Mumbai Holcim Ltd 2010 Founded back in 1912 Holcim started its internationalisation more than 80 years ago 1953 1912 1925 1990 1955
Total Imports by Volume (Gallons per Country)
") 11/2/2018 Imports by Volume (Gallons per Country) YTD YTD Country 09/2017 09/2018 % Change 2017 2018 % Change MEXICO 49,299,573 57,635,840 16.9 % 552,428,635 601,679,687 8.9 % NETHERLANDS 11,656,759 13,024,144
11/2/2018 Imports by Volume (Gallons per Country) YTD YTD Country 09/2017 09/2018 % Change 2017 2018 % Change MEXICO 49,299,573 57,635,840 16.9 % 552,428,635 601,679,687 8.9 % NETHERLANDS 11,656,759 13,024,144
MENA Benchmarking Report Arab-EU Business Facilitation Network
 MENA Benchmarking Report Arab-EU Business Facilitation Network www.ae-network.org September 2014 Agenda Objective of the Report Macroeconomic Analysis Business Environment Index MENA Rankings 2 Objective
Total Imports by Volume (Gallons per Country)
") 10/5/2018 Imports by Volume (Gallons per Country) YTD YTD Country 08/2017 08/2018 % Change 2017 2018 % Change MEXICO 67,180,788 71,483,563 6.4 % 503,129,061 544,043,847 8.1 % NETHERLANDS 12,954,789 12,582,508
10/5/2018 Imports by Volume (Gallons per Country) YTD YTD Country 08/2017 08/2018 % Change 2017 2018 % Change MEXICO 67,180,788 71,483,563 6.4 % 503,129,061 544,043,847 8.1 % NETHERLANDS 12,954,789 12,582,508
Total Imports by Volume (Gallons per Country)
") 12/6/2018 Imports by Volume (Gallons per Country) YTD YTD Country 10/2017 10/2018 % Change 2017 2018 % Change MEXICO 56,462,606 60,951,402 8.0 % 608,891,240 662,631,088 8.8 % NETHERLANDS 11,381,432 10,220,226
12/6/2018 Imports by Volume (Gallons per Country) YTD YTD Country 10/2017 10/2018 % Change 2017 2018 % Change MEXICO 56,462,606 60,951,402 8.0 % 608,891,240 662,631,088 8.8 % NETHERLANDS 11,381,432 10,220,226
Fiscal Policy and the Global Crisis
 Fiscal Policy and the Global Crisis Presentation at Koҫ University, Istanbul Carlo Cottarelli Director IMF Fiscal Affairs Department June 9, 2009 1 Two fiscal questions What is the appropriate fiscal policy
Total Imports by Volume (Gallons per Country)
") 3/6/2019 Imports by Volume (Gallons per Country) YTD YTD Country 12/2017 12/2018 % Change 2017 2018 % Change MEXICO 54,169,734 56,505,154 4.3 % 712,020,884 773,421,634 8.6 % NETHERLANDS 11,037,475 8,403,018
3/6/2019 Imports by Volume (Gallons per Country) YTD YTD Country 12/2017 12/2018 % Change 2017 2018 % Change MEXICO 54,169,734 56,505,154 4.3 % 712,020,884 773,421,634 8.6 % NETHERLANDS 11,037,475 8,403,018
SHARE IN OUR FUTURE AN ADVENTURE IN EMPLOYEE STOCK OWNERSHIP DEBBI MARCUS, UNILEVER
 SHARE IN OUR FUTURE AN ADVENTURE IN EMPLOYEE STOCK OWNERSHIP DEBBI MARCUS, UNILEVER DEBBI.MARCUS@UNILEVER.COM RUTGERS SCHOOL OF MANAGEMENT AND LABOR RELATIONS NJ/NY CENTER FOR EMPLOYEE OWNERSHIP AGENDA
Total Imports by Volume (Gallons per Country)
") 2/6/2019 Imports by Volume (Gallons per Country) YTD YTD Country 11/2017 11/2018 % Change 2017 2018 % Change MEXICO 48,959,909 54,285,392 10.9 % 657,851,150 716,916,480 9.0 % NETHERLANDS 11,903,919 10,024,814
2/6/2019 Imports by Volume (Gallons per Country) YTD YTD Country 11/2017 11/2018 % Change 2017 2018 % Change MEXICO 48,959,909 54,285,392 10.9 % 657,851,150 716,916,480 9.0 % NETHERLANDS 11,903,919 10,024,814
GBTA BTI Outlook: Brasil
 GBTA BTI Outlook: Brasil 2 nd Half - 2016 Agenda GBTA BTI Outlook Brazil: Overview Methodology GBTA BTI : Global Context Brazil Business Travel Spending Details 2 Overview In 2017, completed 8 th Global
Capital Markets Day 2011
 Capital Markets Day 2011 DSV Air & Sea Division Jorgen Moller, President DSV Air & Sea Holding A/S Capital Markets Day 6 September 2011 Agenda 1. DSV Air & Sea - general facts 2. Update on H1 2011 3. Growth
International Business Development International Trade Survey
 International Business Development 2007 International Trade Survey Overview What we have done How we accomplished these tasks Why these tasks were important Results Plan of action Additional project Survey
Total Imports by Volume (Gallons per Country)
") 4/5/2018 Imports by Volume (Gallons per Country) YTD YTD Country 02/2017 02/2018 % Change 2017 2018 % Change MEXICO 53,961,589 55,268,981 2.4 % 108,197,008 114,206,836 5.6 % NETHERLANDS 12,804,152 11,235,029
4/5/2018 Imports by Volume (Gallons per Country) YTD YTD Country 02/2017 02/2018 % Change 2017 2018 % Change MEXICO 53,961,589 55,268,981 2.4 % 108,197,008 114,206,836 5.6 % NETHERLANDS 12,804,152 11,235,029
Figure 1: Underlying Activity Growth (% MoM Ann.) for Global Aggregates
 for Global Aggregates") Figure 1: Underlying Activity Growth (% MoM Ann.) for Global Aggregates World Advanced Economies Emerging Market Economies Notes: The black dashed line represents the model s estimate of long-run growth.
Figure 1: Underlying Activity Growth (% MoM Ann.) for Global Aggregates World Advanced Economies Emerging Market Economies Notes: The black dashed line represents the model s estimate of long-run growth.
EQUITY REPORTING & WITHHOLDING. Updated May 2016
 EQUITY REPORTING & WITHHOLDING Updated May 2016 When you exercise stock options or have RSUs lapse, there may be tax implications in any country in which you worked for P&G during the period from the
First ever quarter with over 200m Gross Profit
 11 July 2018 and H1 2018 Trading Update Steve Ingham Kelvin Stagg Chief Executive Officer Chief Financial Officer First ever quarter with over 200m Gross Profit LSE: PAGE.L Website: http://www.page.com/investors
Latin American Economic Outlook 2008
 Latin American Economic Outlook 28 China and India: Angel or Devils for Latin America? Based on Chapter 4 of the Report Javier Santiso Director, OECD Development Centre Rio de Janeiro, March 28 The OECD
Investor Presentation
 Investor Presentation 2017 www.gerdau.com 1 Outlook Gerdau Highlights 2 Better outlook for steel consumption Region / Country (in mt and %) 2017f 17/16 World 1,535 1.3% European Union 158 0.5% NAFTA 135
Another quarter of double digit growth
 11 April 2018 2018 Trading Update Steve Ingham Kelvin Stagg Chief Executive Officer Chief Financial Officer Another quarter of double digit growth LSE: PAGE.L Website: http://www.page.com/investors Headline
Marine. Global Programmes. cunninghamlindsey.com. A Cunningham Lindsey service
 Marine Global Programmes A Cunningham Lindsey service Marine global presence Marine Global Programmes Cunningham Lindsey approach Managing your needs With 160 marine surveyors and claims managers in 36
PRELIMINARY RESULTS rd February 2012
 23 rd February 2012 Nicandro Durante Chief Executive Proven strategy continues to deliver Superior shareholder returns Daily Relative performance to FTSE100 Price GBp 2,800 2,600 2,400 2,200 2,000 1,800
CREDIT INSURANCE. To ensure peace, you must be prepared for war. CREDIT INSURANCE FUNDAMENTAL SOLUTION IN CREDIT RISK MANAGEMENT
 FUNDAMENTAL SOLUTION IN CREDIT RISK MANAGEMENT I would like to extend my relations with that customer... I would like to enter a new market... We have high exposure for that customer... We have delayed
Total Imports by Volume (Gallons per Country)
") 3/7/2018 Imports by Volume (Gallons per Country) YTD YTD Country 01/2017 01/2018 % Change 2017 2018 % Change MEXICO 54,235,419 58,937,856 8.7 % 54,235,419 58,937,856 8.7 % NETHERLANDS 12,265,935 10,356,183
3/7/2018 Imports by Volume (Gallons per Country) YTD YTD Country 01/2017 01/2018 % Change 2017 2018 % Change MEXICO 54,235,419 58,937,856 8.7 % 54,235,419 58,937,856 8.7 % NETHERLANDS 12,265,935 10,356,183
The Chilean economy: Institutional buildup and perspectives
 The Chilean economy: Institutional buildup and perspectives Vittorio Corbo Governor 1 Outline 1. Introduction 2. Chile s economic reforms and institutional buildup 3. Performance of the Chilean economy
Total Imports by Volume (Gallons per Country)
") 10/5/2017 Imports by Volume (Gallons per Country) YTD YTD Country 08/2016 08/2017 % Change 2016 2017 % Change MEXICO 51,349,849 67,180,788 30.8 % 475,806,632 503,129,061 5.7 % NETHERLANDS 12,756,776 12,954,789
10/5/2017 Imports by Volume (Gallons per Country) YTD YTD Country 08/2016 08/2017 % Change 2016 2017 % Change MEXICO 51,349,849 67,180,788 30.8 % 475,806,632 503,129,061 5.7 % NETHERLANDS 12,756,776 12,954,789
Financial wealth of private households worldwide
 Economic Research Financial wealth of private households worldwide Munich, October 217 Recovery in turbulent times Assets and liabilities of private households worldwide in EUR trillion and annualrate
Corporate Presentation
 Corporate Presentation December, 2012 Our Company 2 Company Overview Largest Latin American IT Services provider and an undisputed leader in systems integration, support and IT Outsourcing in Chile Corporate
2009 Half Year Results. August 25, 2009
 1 2009 Half Year Results August 25, 2009 2 Caution statement This presentation may contain forward looking statements, which are subject to risk and uncertainty. A variety of factors could cause our actual
Chart Collection for Morning Briefing
 Chart Collection for Morning Briefing February 7, 1 Dr. Edward Yardeni 1-97-73 eyardeni@ Mali Quintana --1333 aquintana@ Please visit our sites at www. blog. thinking outside the box 3 3 Figure 1. S&P
Total Imports by Volume (Gallons per Country)
") 1/5/2018 Imports by Volume (Gallons per Country) YTD YTD Country 11/2016 11/2017 % Change 2016 2017 % Change MEXICO 50,994,409 48,959,909 (4.0)% 631,442,105 657,851,150 4.2 % NETHERLANDS 9,378,351 11,903,919
1/5/2018 Imports by Volume (Gallons per Country) YTD YTD Country 11/2016 11/2017 % Change 2016 2017 % Change MEXICO 50,994,409 48,959,909 (4.0)% 631,442,105 657,851,150 4.2 % NETHERLANDS 9,378,351 11,903,919
Figure 1: Underlying Activity Growth (% MoM Ann.) for Global Aggregates
 for Global Aggregates") Figure 1: Underlying Activity Growth (% MoM Ann.) for Global Aggregates World Advanced Economies Emerging Market Economies Notes: The black dashed line represents the model s estimate of long-run growth.
Figure 1: Underlying Activity Growth (% MoM Ann.) for Global Aggregates World Advanced Economies Emerging Market Economies Notes: The black dashed line represents the model s estimate of long-run growth.
2010 Results. Paris - March 2, 2011
 2010 Results Paris - March 2, 2011 > Highlights of 2010 > Financial results > Strategy and outlook 2010 Results 2 2010: A Year of Acceleration Highlights of 2010 Revenue of 3,892m, up 19.1% Operating profit
Institutions, Capital Flight and the Resource Curse. Ragnar Torvik Department of Economics Norwegian University of Science and Technology
 Institutions, Capital Flight and the Resource Curse Ragnar Torvik Department of Economics Norwegian University of Science and Technology The resource curse Wave 1: Case studies, Gelb (1988) The resource
China s Overseas Direct Investment (ODI): Current situation and future outlook
: Current situation and future outlook") China s Overseas Direct Investment (ODI): Current situation and future outlook New York Stock Exchange (NYSE) Dr. Qin Xiao Chairman, the Boyuan Foundation January 7, 2015 Agenda A. China s ODI: High Growth
China s Overseas Direct Investment (ODI): Current situation and future outlook New York Stock Exchange (NYSE) Dr. Qin Xiao Chairman, the Boyuan Foundation January 7, 2015 Agenda A. China s ODI: High Growth
Global solutions. Local expertise.
 Global solutions. Local expertise. Count on Sedgwick around the world Sedgwick is a leading global provider of technology-enabled risk, benefits and integrated business solutions. Our 21,000 colleagues,
From HMO to IPO the Brazilian Experience. Luiz Kaufmann. IFC INTERNATIONAL HEALTH CONFERENCE 2007 April 2007
 From HMO to IPO the Brazilian Experience Luiz Kaufmann IFC INTERNATIONAL HEALTH CONFERENCE 2007 April 2007 IFC INTERNATIONAL HEALTH CONFERENCE 2007 April 2007 From HMO to IPO The Brazilian Experience Luiz
Summary 715 SUMMARY. Minimum Legal Fee Schedule. Loser Pays Statute. Prohibition Against Legal Advertising / Soliciting of Pro bono
 Summary Country Fee Aid Angola No No No Argentina No, with No No No Armenia, with No No No No, however the foreign Attorneys need to be registered at the Chamber of Advocates to be able to practice attorney
PACIFIC ALLIANCE THE BEST KEPT SECRET
 PACIFIC ALLIANCE THE BEST KEPT SECRET Juan C. Botero, CIO SURA AM THE PACIFIC ALLIANCE AT A GLANCE 5.1% GDP %YoY (PPP) Since 2004 (1) GDP 2016 USD 3.1 Trillion 43% of region Population 224 Million (2)
STOXX EMERGING MARKETS INDICES. UNDERSTANDA RULES-BA EMERGING MARK TRANSPARENT SIMPLE
 STOXX Limited STOXX EMERGING MARKETS INDICES. EMERGING MARK RULES-BA TRANSPARENT UNDERSTANDA SIMPLE MARKET CLASSIF INTRODUCTION. Many investors are seeking to embrace emerging market investments, because
Monetary Policy: A Key Driver for Long Term Macroeconomic Stability
 Monetary Policy: A Key Driver for Long Term Macroeconomic Stability Julio Velarde Governor Central Bank of Peru March 2016 Agenda 1. Peru s growth is based on strong fundamentals 2. Recent economic developments
PREDICTING VEHICLE SALES FROM GDP
 UMTRI--6 FEBRUARY PREDICTING VEHICLE SALES FROM GDP IN 8 COUNTRIES: - MICHAEL SIVAK PREDICTING VEHICLE SALES FROM GDP IN 8 COUNTRIES: - Michael Sivak The University of Michigan Transportation Research
Total Imports by Volume (Gallons per Country)
") 2/6/2018 Imports by Volume (Gallons per Country) YTD YTD Country 12/2016 12/2017 % Change 2016 2017 % Change MEXICO 50,839,282 54,169,734 6.6 % 682,281,387 712,020,884 4.4 % NETHERLANDS 10,630,799 11,037,475
2/6/2018 Imports by Volume (Gallons per Country) YTD YTD Country 12/2016 12/2017 % Change 2016 2017 % Change MEXICO 50,839,282 54,169,734 6.6 % 682,281,387 712,020,884 4.4 % NETHERLANDS 10,630,799 11,037,475
Market Briefing: S&P 500 Forward Earnings & the Economy
 Market Briefing: S&P Forward Earnings & the Economy January, 18 Dr. Edward Yardeni 516-972-7683 eyardeni@ Joe Abbott 732-497-56 jabbott@ Mali Quintana 48-664-1333 aquintana@ Please visit our sites at www.
Global Expansion. Agenda. Distribution Services - non Food OECD meeting Antoine de Riedmatten, Deloitte. Page. Opening remarks 3-4
 1 Agenda Global Expansion Page Opening remarks 3-4 10 years of Global Power of Retailing 5 Distribution Services - non Food OECD meeting Antoine de Riedmatten, Deloitte Franchising: an interesting way
Latin America: the shadow of China
 Latin America: the shadow of China Juan Ruiz BBVA Research Chief Economist for South America Latin America Outlook Second Quarter Madrid, 13 May Latin America Outlook / May Key messages 1 2 3 4 5 The global
Michigan s Economic Future and MEDC Initiatives
 Michigan s Economic Future and MEDC Initiatives Doug Smith, Senior Vice President, Governmental Affairs & Strategic Partnerships Michigan Economic Development Corporation Apartment Association of Michigan
Corn Products International, Inc.
 Corn Products International, Inc. To Acquire National Starch for $1.3 Billion in Cash; Creates $5 Billion Global Ingredients Company June 21, 2010 Ilene Gordon Chairman, President, and CEO Cheryl K. Beebe
Investor Presentation
 Investor Presentation 2017 www.gerdau.com 1 Outlook Gerdau Highlights 2 Better outlook for steel consumption Region / Country (in mt and %) 2017f 17/16 World 1,535 1.3% European Union 158 0.5% NAFTA 135
Corporate Presentation. June 2018
 Corporate Presentation June 2018 Forward-looking Statements This presentation may contain forward-looking statements, that should be considered as good faith estimates. Such statements are subject to risks
Latin American Economic Outlook 2008
 Latin American Economic Outlook 28 Javier Santiso Acting Director Chief Development Economist OECD Development Centre Brussels, 13 th December 27 The OECD and Latin America: An emerging commitment Latin
Globalisation, development financing and Chindia in Latin America
 Globalisation, development financing and Chindia in Latin America Latin American Economic Outlook 28 Javier Santiso Director & Chief Development Economist OECD Development Centre Bern, 11th March 28 Swiss
A 45 Year Forecast for the World Economies April 8, 2008
 A 45 Year Forecast for the World Economies April 8, 2008 Over the next 45 years, Vietnam and Nigeria may emerge as the premier developing economies. Pricewaterhouse Coopers (PWC), in their newly released
Capturing Opportunities Ahead of Us
 Capturing Opportunities Ahead of Us Ken Lewis, CPA, Chief Financial Officer Franklin Resources, Inc. February 12, 2013 Forward Looking Statements Statements in this presentation regarding Franklin Resources,
Market Allocation Platform Guiding investment decisions to maximize ROI. Tourism Economics
 Market Allocation Platform Guiding investment decisions to maximize ROI Tourism Economics core services Travel data and forecasts for 190 countries, 50 states, and 300 cities Policy analysis and recommendations
Transfer Pricing Audits Indian experience.
 Transfer Pricing Audits Indian experience. International Tax Conference - 2005 Vispi T. Patel Deloitte Haskins & Sells. Background of Indian TPR OECD s View Transfer pricing can deprive governments of
Actuarial Supply & Demand. By i.e. muhanna. i.e. muhanna Page 1 of
 By i.e. muhanna i.e. muhanna Page 1 of 8 040506 Additional Perspectives Measuring actuarial supply and demand in terms of GDP is indeed a valid basis for setting the actuarial density of a country and
Corporate Presentation. January 2018
 Corporate Presentation January 2018 Forward-looking Statements This presentation may contain forward-looking statements, that should be considered as good faith estimates. Such statements are subject to