MEASURING IMPACT ACROSS VIBRANT COMMUNITIES CANADA S CITIES REDUCING POVERTY NETWORK
|
|
|
- Piers Boone
- 5 years ago
- Views:
Transcription
1 THE CANADIAN COUNCIL ON SOCIAL DEVELOPMENT COMMUNITY DATA PROGRAM MEASURING IMPACT ACROSS VIBRANT COMMUNITIES CANADA S CITIES REDUCING POVERTY NETWORK PRESENTATION AT TAMARACK S NATIONAL POVERTY SUMMIT MAY 7, 2015 MICHEL FROJMOVIC, LEAD, MICHEL@CCSD.CA MIKE DITOR, SR. ANALYST, MIKE@COMMUNIYDATA.CA
2 Part 1 CCSD s Community Data Program: Enabling Access to Data by the Community Sector 2


3 THE COMMUNITY DATA PROGRAM Established by CCSD in the mid-1990s Support community sector access to data Focus on small area geography Customized data gateway Analyse and report on socio-economic trends 3
4 DEFINITION OF TERMS Community data Small area data Customized data Custom geography 4
5 THE PROGRAM SUPPORTS ORGANIZATIONS WITH A MANDATE TO 1. Monitor and report on social trends & conditions 2. Acquire customised small area data 3. Reduce costs 4. Build in-house capacity 5. Improve access by local organizations and residents to community data 5
6 THE COMMUNITY DATA NETWORK Community Data Consortia: 27 Consortium Member Organisations: 250 Municipal governments & local boards Social Planning Councils Local United Way chapters Public health agencies Community health centres Economic development agencies Registered Individuals: 2,000+ 6

7 Wood Buffalo Red Deer Bow Valley Regina Sudbury Saint John Parry Sound-Nipissing Erie-St. Clair Kingston-FLA Wellington-Dufferin-Guelph Durham London Oxford COMMUNITY DATA CONSORTIA 7 Niagara
8 WHAT DO PROGRAM MEMBERS GET FOR THEIR MEMBERSHIP FEE? Data Direct access to web-based customized community data Capacity building Data analysis tools and training Networking National network with teleconferences and annual faceto-face events 8
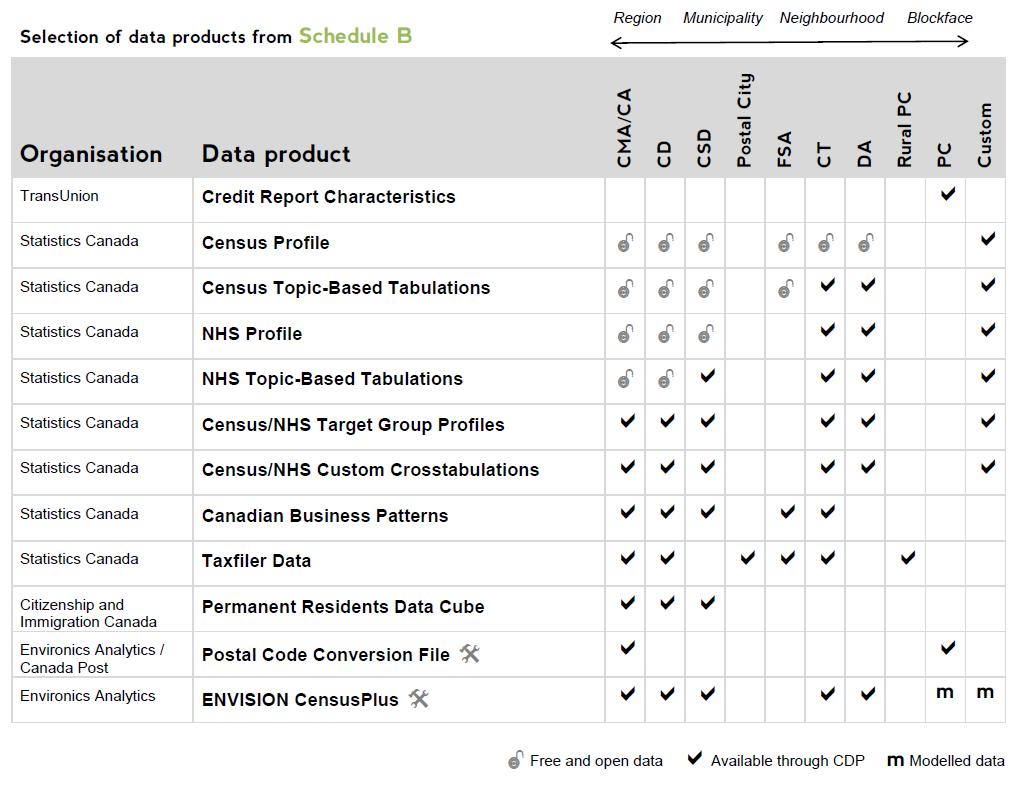
9 THE COMMUNITY DATA CATALOGUE Small area data for all of Canada Over 20 public & private data providers Municipal and neighbourhood level data Statistics Canada custom orders Custom geographies Analysis, reporting, and visualization tools Portal to the Free Stuff communitydata.ca/catalogue 9
10
11 LATEST ADDITIONS TO CCSD S COMMUNITYDATA.CA/CATALOGUE TGPs: Target Group Profiles All of Canada Smallest census geographies Customized community geographies Low income population: LICO-AT Low income population: LICO-BT Low income population: LIM-AT Low income population: MBM Population with difficulty in activities of daily living Aboriginal identity population Immigrants Female lone parents Population aged
12 CANADIAN POVERTY PROJECT (CPP) GOVERNMENT TRANSFER PAYMENTS $12,000 $10,000 Non-immigrants $8,000 $6,000 Low-income nonimmigrants Immigrants $4,000 $2,000 Low-income nonimmigrants $0 NL PEI NS NB QC ON MB SK AB BC 12
13 CPP LOW INCOME RATE (LIM-AT) BY IMMIGRANT STATUS 60% 40% 20% Non-immigrants Before to to % NL PEI NS NB QC ON MB SK AB BC 13
14 CPP LOW INCOME RATE (LIM-AT) BY ACTIVITY LIMITATION STATUS 30% 10% 8% 10% 12% 20% 8% 5% 6% 7% 6% 10% 4% No activity limitations With activity limitations 0% NL PEI NS NB QC ON MB SK AB BC 14
15 CPP LOW INCOME RATE (LIM-AT) BY KNOWLEDGE OF OFFICIAL LANGUAGES 80% 60% 60% 40% 21% 23% 28% 21% 20% Total population 20% 10% 14% 9% 14% No knowledge of French or English 0% NL PEI NS NB QC ON MB SK AB BC 15
16 CPP LOW INCOME RATE (LIM-AT) BY VISIBLE MINORITY STATUS 50% 40% 26% 17% 30% 20% 10% 12% 15% 8% 5% 8% 5% 8% Visible minority Non-visible minority 10% 0% NL PEI NS NB QC ON MB SK AB BC 16
17 CPP LOW INCOME RATE (LIM-AT) BY ABORIGINAL STATUS 40% 30% 15% 13% 17% 17% 12% 20% 3% 6% 6% 10% 10% Aboriginal Non-aboriginal 10% 0% NL PEI NS NB QC ON MB SK AB BC 17
18 CPP LOW INCOME RATE (LIM-AT) BY SEX 20% 4% 4% 4% 3% 3% 3% 2% 15% 2% 3% 10% 2% Male Female 5% 0% NL PEI NS NB QC ON MB SK AB BC 18
19 CPP LOW INCOME RATE (LIM-AT) BY SEX, WITH POST-SECONDARY EDUCATION 20% 15% 2% 2% 1% 10% 2% 2% 2% 1% 2% 1% 1% Male Female 5% 0% NL PEI NS NB QC ON MB SK AB BC 19
20 EXAMPLES OF THE USE OF COMMUNITY DATA


21 APPLYING THE CANADIAN INDEX OF WELLBEING TO SIMCOE COUNTY ON Barrie/Simcoe Resilience Colaborative Local assessment of CIW indicators Support of regional data provided by Community Data Program

22 MAPPING AND VISUAL TOOLS Wellbeing Toronto This web-based application that allows the user to look at and combine various indicators about neighbourhood wellbeing in the City of Toronto. wellbeing Source: Presentation by Consortia Member Social Policy Analysis & Research Section, City of Toronto, 2011

23 LOCAL DATA CENTRE: PEEL, ONTARIO The Region of Peel is made up of cities of Brampton, Mississauga and the Town of Caledon. Combines data from CCSD and other sources Data dissemination through newsletters and online Data informing research, social policy and advocacy

24 COMMUNITY INDICATOR REPORT: THE HALTON NEWCOMER STRATEGY Organizations: Halton Regional Municipality, Community Development Halton, and Halton Regional Police Services The Report provides baselines to improve our understanding of the current experience of newcomers in Halton, and to inform our progress in creating and maintaining the conditions of a welcoming community. 24

25 SPATIAL ANALYSIS OF SOCIO-ECONOMIC CONDITIONS: CITY OF HAMILTON Source: Social Planning and Research Council of Hamilton


26 SPATIAL ANALYSIS OF POVERTY: SOCIAL PLANNING COUNCIL OF WINNIPEG Source: Program Member Social Planning Council of Winnipeg
27 Discussion/Question & Answer 27
28 Part 2 Different Approaches to Measuring Poverty in Canadian Cities & Communities 28
29 TRADITIONAL MEASURES OF POVERTY LIM Low Income Measure LICO Low Income Cut Off MBM Market Basket Measure None is a formal poverty line All are different Rely on calculated income thresholds Adjusted for family size LICO & MBM adjusted for city size 29
30 LOW INCOME THRESHOLDS FOR 2011 LIM AT Family of 4 LICO AT Family of 4 Pop. 30,000-99,999 Pop. 500,000+ MBM 2 adults, 2 children Pop. 30,000-99,999 Edmonton $39,860 $30,487 $36,504 $32,471 $36,235 30
31 LOW-INCOME RATES & UNEMPLOYMENT RATE, CANADA, 1976 TO 2009 Source: Survey of Consumer Finances (1976 to 1995), Survey of Labour and Income Dynamics (1996 to 2009) and Labour Force Survey (CANSIM Table ), Statistics Canada. 31
32 3 MEASURES OF POVERTY IN 3 COMMUNITIES: INCIDENCE OF LOW INCOME LIM-AT LICO-AT MBM RANGE Canada 14.6% 10.9% 13.1% 3.7% Manitoba 15.5% 11.0% 12.0% 4.5% Winnipeg 16.6% 15.1% 13.8% 2.8% Ontario 13.8% 10.8% 13.0% 3.0% Hamilton 15.7% 14.2% 13.4% 2.3% Quebec 16.6% 12.1% 12.6% 4.5% Quebec City 14.4% 13.4% 11.1% 3.3%
33 3 MEASURES OF POVERTY IN 3 COMMUNITIES: # OF LOW INCOME PERSONS LIM-AT LICO-AT MBM RANGE Canada 4,812,115 3,573,095 4,309,945 1,239,020 Manitoba 181, , ,190 52,785 Winnipeg 108,125 98,065 89,460 18,665 Ontario 1,745,905 1,362,675 1,650, ,230 Hamilton 79,785 72,255 68,390 11,395 Quebec 1,284, , , ,295 Quebec City 72,595 67,345 56,005 16,590
34 CUSTOMISED MEASURES OF POVERTY AT A NEIGHBOURHOOD LEVEL Working Poverty Relies on taxfiler data Individuals in a low income family Earning $3000+ in working income Aged 18 to 64 Excludes full-time postsec students Excludes dependents Income Inequality Relies on taxfiler deciles data Ratio of incomes earned by highest and lowest earners % of all income earned by highest and lowest income earners 34
35 WORKING POVERTY (2010) As % of persons ages 18-64, (excluding students and dependents Canada: 6.4% Thunder Bay: 4.1% Lethbridge: 10.9% Working poor, as % all low income persons ages Canada: 34.0% Thunder Bay: 24.2% Lethbridge: 53.2% 35
36 INCOME INEQUALITY (2010) % OF TOTAL INCOME EARNED BY.. Canada Top 1%: 7.1% Bottom 20%: 6.1% City of London top 1%: 6.0% Bottom 20%: 5.8% City of Saskatoon top 1%: 7.0% bottom 20%: 5.9% 36
37 INCOME INEQUALITY (2010) CITY OF TORONTO % of total income earned by.. top 1%: 13.6% bottom 20%: 3.2% Bottom 40%: 11.3% 37
38 EXPLORING NEW SMALL AREA DATA SOURCES TO MEASURE POVERTY Environics Analytics Adjusted National Household Survey Wealthscapes database TransUnion Credit risk score Risk of Bankruptcy score Total consumer debt 38
39 BUILDING AN INDEX OF NEIGHBOURHOOD FINANCIAL SECURITY Income only tells part of the story Aspects of wealth such as assets, savings, and debt are equally critical determinants of household financial health. Community level data is needed to galvanize community action Existing analyses of financial security occur at the national or provincial scale, offering little help to those trying to understand the financial situation of Canadian households at the community level. 39

40 SHIFTING THE PERSPECTIVE: FROM INCOME TO NET WORTH
41 Income COMPONENTS OF AN INDEX OF NEIGHOURBOOD FINANCIAL SECURITY Variable Definition Average pre-tax household income, including employment income, income from government programs, pension income, investment income and any other money income; Liquid Assets Average per household value of financial assets, including registered & non-registered savings and financial investments; Real Estate Assets Average per household value of primary and other real estate; Consumer debt The average value of all household consumer debt, comprising debt from credit cards, personal loans and lines of credit; Mortgage debt Risk of Bankruptcy The average per household value of all mortgage debt; The score used by financial institutions to measure the likelihood of individuals filing for bankruptcy.
42 THE PILOT PROJECT: Pilot Communities: City of Toronto City of Calgary Wood Buffalo Regional Municipality Geographic data: Canadian and provincial averages Averages for all CMAs and all non-cmas in Canada Pilot community census subdivision and census division Pilot community dissemination areas (DAs) Data Year:
43 MEASURING NEIGHBOURHOOD FINANCE: CASE STUDY OF CALGARY Household Income $121,167 All CMAs: $92,079 Household Savings $98,284 All CMAs: $90,950 Household Assets $835,961 40% invested in primary real estate (national average 46%) All CMAs: $635,788 Household Debt $199,726 Mortgage debt accounts for 73% (national average 70%) All CMAs: $137,133 43
44 MEASURING NEIGHBOURHOOD FINANCIAL SECURITY WITHIN CALGARY The positive citywide snapshot of financial security masks considerable variation at the neighbourhood level. 44

45 VISUALIZING THE DATA 45
46 Neighbourhood Rank by Decile (Colour) (Rank out of 1,592 DAs) DA# St SE/16 Av SE Low Income DA# Taravista Way NE / Taradale Dr NE Lower-Middle Income Overall 3 (1,141) 1 (1,561) Assets 1 (1,592) 4 (1,002) Savings 1 (1,553) 1 (1,582) Debt 10 (6) 2 (1,330) Income 1 (1,531) 4 (1,055)
47 Discussion/Question & Answer 47
48 10 MINUTE BREAK 48
49 Part 3 A Community Analytics Project: Measuring poverty across the Cities Reducing Poverty Network
50 MEASURING POVERTY ACROSS THE CITIES REDUCING POVERTY NETWORK Contribute to a common evaluation framework for poverty reduction for the Cities Reducing Poverty network Support the Cities Reducing Poverty framework s Population cluster of indicators Compile indicators related to poverty reduction Enable comparison among the members of the network Provide data for time-series analysis: 2010 and
51 MEASURING POVERTY: THE INDICATORS Series 1 Indicators Average (After Tax) & Median Income (Before Tax) Incidence of Low Income (LIM-AT) By Family type: Couples; Lone-Parents; Singles By age: 0-17, 65+ Source: STC Taxfiler Standard Tables, 2010, 2011 Series 2 indicators Working Poverty (Based on Working Income Tax Credit) Income Inequality (Share of total income by decile) Source: STC Taxfiler Special Order, 2010,
52 CITIES REDUCING POVERTY NETWORK LOW INCOME COUPLE FAMILIES (2011) Strathcona County 2.5% Red Deer 5.4% Sherbrooke 6.8% Wood Buffalo 3.5% Iqaluit 5.6% Nelson 6.9% Grande Prairie 3.7% Nipissing 5.6% Saskatoon 6.9% Sudbury 3.7% Simcoe County 5.8% Edmonton 7.3% Revelstoke 3.8% Halton Region 5.8% Haliburton 7.5% Medicine Hat 3.9% Kawartha Lakes 5.9% Calgary 7.5% Whitehorse 4.1% Durham Region 5.9% Saint John 7.9% Quebec City 4.2% Kingston 5.9% Lethbridge 8.1% Yellowknife 4.3% Victoria 6.0% Hamilton 8.1% Oxford County 4.5% Regina 6.0% Charlotte County CIN 8.2% Sault Ste. Marie 4.5% Peterborough 6.1% Winnipeg 8.2% Sarnia-Lambton 4.5% Halifax 6.1% Canada 8.5% Antigonish 4.7% Fredericton 6.4% Charlottetown 8.6% Huron County 4.7% Waterloo Region 6.4% London 9.1% Dufferin County 4.8% St. John s 6.5% Abbotsford 9.2% Northumberland 4.9% Niagara Region 6.6% York Region 11.7% Thunder Bay 4.9% Elgin 6.6% Surrey 13.7% Moncton 4.9% Haldimand-Norfolk 6.6% Peel Region 13.8% Wellington-Guelph 5.1% Brant-Brantford 6.7% St. Michel (Montreal) 14.2% Leeds and Grenville 5.1% Chatham-Kent 6.7% Windsor (Essex) 14.7% Trois Rivieres 5.3% Chaleur CIN 6.7% Richmond 22.0%
53 CITIES REDUCING POVERTY NETWORK LOW INCOME LONE-PARENT FAMILIES (2011) Strathcona County 16.8% Kingston 30.3% Peterborough 34.4% Quebec City 20.6% Edmonton 30.9% Haliburton 34.5% Halton Region 20.6% Trois Rivieres 31.3% Sarnia-Lambton 34.7% Whitehorse 20.8% Chaleur CIN 31.6% Iqaluit 34.8% York Region 26.2% Antigonish 31.6% Saskatoon 35.1% Calgary 26.7% Sudbury 31.8% Elgin 35.1% Durham Region 27.5% Red Deer 31.9% St. Michel (Montreal) 35.2% Wellington-Guelph 27.9% Niagara Region 31.9% Sault Ste. Marie 35.3% Yellowknife 28.0% Richmond 31.9% Winnipeg 35.6% Dufferin County 28.1% Haldimand-Norfolk 32.0% Thunder Bay 35.7% Revelstoke 28.6% Simcoe County 32.2% St. John s 36.1% Peel Region 28.7% Lethbridge 32.2% Windsor (Essex) 36.3% Victoria 28.8% Moncton 32.2% Nipissing 36.4% Oxford County 29.0% Charlottetown 32.3% Surrey 36.6% Waterloo Region 29.1% Halifax 32.3% Abbotsford 36.8% Leeds and Grenville 29.1% Canada 32.4% Nelson 37.0% Huron County 29.6% Kawartha Lakes 32.6% Brant-Brantford 37.4% Wood Buffalo 29.8% Grande Prairie 33.3% Fredericton 38.0% Northumberland 29.9% Hamilton 33.9% Chatham-Kent 38.7% Sherbrooke 30.3% Medicine Hat 34.3% Charlotte County CIN 40.7% Regina 30.3% London 34.3% Saint John 41.2%
54 CITIES REDUCING POVERTY NETWORK LOW INCOME NON-FAMILY PERSONS (2011) Wood Buffalo 10.4% Leeds and Grenville 22.3% Winnipeg 26.8% Strathcona County 12.6% Dufferin County 22.6% Hamilton 27.0% Grande Prairie 14.2% Haliburton 23.0% Moncton 27.2% Iqaluit 15.4% Simcoe County 23.4% London 27.3% Whitehorse 15.6% Sudbury 23.5% Halifax 27.3% Medicine Hat 17.5% Durham Region 23.7% Fredericton 27.6% Yellowknife 17.8% Thunder Bay 23.7% Windsor (Essex) 28.1% Huron County 18.5% Victoria 23.8% Antigonish 28.7% Red Deer 19.4% Waterloo Region 23.9% Abbotsford 28.9% Calgary 19.5% Niagara Region 24.4% Charlottetown 29.4% Halton Region 19.8% Elgin 24.5% St. John s 29.5% Edmonton 20.0% Quebec City 25.0% Nelson 29.5% Oxford County 20.1% Peterborough 25.3% Saint John 30.0% Northumberland 20.2% Chatham-Kent 25.4% York Region 31.2% Regina 20.9% Lethbridge 25.5% Peel Region 31.3% Sarnia-Lambton 21.2% Brant-Brantford 25.5% Trois Rivieres 31.5% Haldimand-Norfolk 21.6% Sault Ste. Marie 25.5% Sherbrooke 32.9% Wellington-Guelph 21.7% Kingston 25.7% Surrey 33.5% Revelstoke 21.9% Nipissing 26.5% Chaleur CIN 33.9% Saskatoon 22.1% Charlotte County CIN 26.7% St. Michel (Montreal) 34.5% Kawartha Lakes 22.2% Canada 26.7% Richmond 37.4%
55 CITIES REDUCING POVERTY NETWORK COUPLE FAMILIES MEDIAN INCOME (2011) Richmond 58,610 $ Niagara Region 76,080 $ Waterloo Region 87,150 $ Haliburton 60,760 $ Charlottetown 76,340 $ Halifax 87,430 $ Chaleur CIN 64,400 $ Nipissing 76,500 $ Medicine Hat 88,910 $ Charlotte County CIN 64,560 $ Brant-Brantford 77,960 $ York Region 88,950 $ St. Michel (Montreal) 65,290 $ Leeds and Grenville 78,990 $ Wellington-Guelph 89,310 $ Surrey 67,990 $ Canada 79,530 $ St. John s 91,170 $ Abbotsford 68,380 $ Winnipeg 79,770 $ Dufferin County 91,200 $ Chatham-Kent 70,230 $ Fredericton 79,930 $ Saskatoon 92,270 $ Trois Rivieres 70,950 $ Lethbridge 80,010 $ Sudbury 92,320 $ Kawartha Lakes 71,110 $ London 80,220 $ Edmonton 92,990 $ Saint John 71,110 $ Oxford County 80,490 $ Durham Region 94,010 $ Sherbrooke 72,110 $ Hamilton 80,580 $ Red Deer 95,850 $ Nelson 72,180 $ Simcoe County 81,010 $ Regina 97,810 $ Windsor (Essex) 73,580 $ Quebec City 81,280 $ Calgary 100,010 $ Peel Region 74,060 $ Sault Ste. Marie 81,380 $ Halton Region 108,110 $ Elgin 75,110 $ Revelstoke 81,910 $ Whitehorse 109,430 $ Huron County 75,140 $ Antigonish 81,940 $ Grande Prairie 113,540 $ Moncton 75,180 $ Victoria 84,890 $ Strathcona County 128,010 $ Peterborough 75,860 $ Sarnia-Lambton 85,110 $ Yellowknife 146,570 $ Haldimand-Norfolk 75,870 $ Kingston 86,110 $ Iqaluit 159,430 $ Northumberland 76,060 $ Thunder Bay 87,010 $ Wood Buffalo 185,400 $
56 CITIES REDUCING POVERTY NETWORK LONE-PARENT FAMILIES MEDIAN INCOME (2011) Charlotte County CIN 29,730 $ Kawartha Lakes 36,180 $ Red Deer 39,540 $ Saint John 30,100 $ Niagara Region 36,220 $ Oxford County 39,750 $ Chatham-Kent 32,210 $ Haldimand-Norfolk 36,340 $ Lethbridge 39,920 $ Nelson 32,310 $ Thunder Bay 36,460 $ Waterloo Region 40,120 $ Chaleur CIN 32,320 $ London 36,690 $ Dufferin County 40,130 $ Fredericton 32,920 $ Northumberland 36,780 $ Revelstoke 40,980 $ Haliburton 33,340 $ Hamilton 36,910 $ Victoria 41,480 $ Nipissing 33,360 $ Trois Rivieres 36,970 $ Regina 41,870 $ Brant-Brantford 33,670 $ Medicine Hat 37,150 $ Peel Region 42,210 $ Abbotsford 33,980 $ Halifax 37,190 $ Wellington-Guelph 42,310 $ Sault Ste. Marie 34,180 $ Leeds and Grenville 37,300 $ Edmonton 42,530 $ St. John s 34,580 $ Simcoe County 37,320 $ Durham Region 44,160 $ Elgin 34,840 $ Winnipeg 37,770 $ York Region 45,170 $ Windsor (Essex) 34,910 $ Canada 37,900 $ Quebec City 45,450 $ Moncton 34,910 $ Saskatoon 37,950 $ Iqaluit 46,130 $ Peterborough 35,090 $ Sherbrooke 38,010 $ Calgary 46,720 $ Charlottetown 35,220 $ Sudbury 38,070 $ Whitehorse 49,420 $ St. Michel (Montreal) 35,280 $ Huron County 38,350 $ Halton Region 52,920 $ Sarnia-Lambton 35,690 $ Kingston 38,700 $ Yellowknife 53,950 $ Surrey 35,780 $ Richmond 38,940 $ Wood Buffalo 55,980 $ Antigonish 35,870 $ Grande Prairie 38,950 $ Strathcona County 60,350 $
57 CITIES REDUCING POVERTY NETWORK NON-FAMILY PERSONS MEDIAN INCOME (2011) Chaleur CIN 19,330 $ Peterborough 24,970 $ Oxford County 28,080 $ Trois Rivieres 21,000 $ Lethbridge 25,000 $ Northumberland 28,240 $ Sherbrooke 21,230 $ Fredericton 25,030 $ Revelstoke 28,280 $ Richmond 21,580 $ Hamilton 25,340 $ Waterloo Region 28,450 $ Charlotte County CIN 21,820 $ Elgin 25,410 $ Medicine Hat 29,310 $ St. Michel (Montreal) 22,100 $ Kawartha Lakes 25,460 $ Victoria 29,370 $ Antigonish 22,170 $ Niagara Region 25,620 $ Durham Region 29,460 $ Saint John 22,790 $ Canada 25,660 $ Sarnia-Lambton 29,570 $ Surrey 23,140 $ Windsor (Essex) 25,750 $ Wellington-Guelph 29,830 $ York Region 23,180 $ Haldimand-Norfolk 26,040 $ Saskatoon 30,240 $ Nelson 23,480 $ London 26,560 $ Regina 31,780 $ Abbotsford 23,540 $ Winnipeg 26,930 $ Red Deer 33,010 $ Nipissing 23,640 $ Simcoe County 27,000 $ Edmonton 33,030 $ Charlottetown 23,730 $ Leeds and Grenville 27,040 $ Halton Region 34,280 $ Moncton 24,030 $ Quebec City 27,080 $ Calgary 35,640 $ Peel Region 24,070 $ Thunder Bay 27,510 $ Whitehorse 37,840 $ Chatham-Kent 24,540 $ Kingston 27,560 $ Grande Prairie 40,960 $ Haliburton 24,600 $ Sudbury 27,640 $ Strathcona County 41,320 $ St. John s 24,600 $ Halifax 27,680 $ Yellowknife 48,320 $ Sault Ste. Marie 24,650 $ Huron County 27,690 $ Iqaluit 61,280 $ Brant-Brantford 24,810 $ Dufferin County 27,850 $ Wood Buffalo 75,580 $
58 CITIES REDUCING POVERTY NETWORK COMPARING INCIDENCE OF MEDIAN INCOME TO INCIDENCE OF LOW INCOME 200,000 $ 160,000 $ 120,000 $ Wood Buffalo Iqaluit Yellowknife Strathcona County Couple families Lone parent families Non-family persons 80,000 $ Richmond 40,000 $ Wood Buffalo Saint John St. Michel Charlotte County 0 $ 0.0% 10.0% 20.0% 30.0% 40.0% 50.0% 58
59 CITIES REDUCING POVERTY NETWORK PROPORTION OF POPULATION AGED THAT IS WORKING POOR (2010) Strathcona County 2.9% Regina 5.3% Moncton 6.5% Wood Buffalo 3.2% Haldimand-Norfolk 5.3% Capital Regional District 6.5% Thunder Bay 4.1% Kawartha Lakes 5.4% Haliburton 7.0% Sudbury 4.1% Chatham-Kent 5.5% Red Deer 7.0% Sault Ste. Marie 4.2% Brant-Brantford 5.5% Winnipeg 7.1% Halton Region 4.3% Peterborough 5.5% York Region 7.2% Quebec City 4.3% St. John s 5.5% Revelstoke 7.2% Sarnia-Lambton 4.4% Elgin 5.6% Charlotte County CIN 8.2% Oxford County 4.8% Simcoe County 5.7% Saint John 8.2% Trois Rivieres 4.8% Medicine Hat 5.8% Abbotsford 8.2% Nipissing 4.8% Saskatoon 5.8% Montreal-St. Michel 8.2% Durham Region 4.8% Hamilton 5.9% Peel Region 8.3% Wellington-Guelph 4.9% Edmonton 5.9% Windsor-Essex 8.6% Grande Prairie 4.9% Calgary 5.9% Charlottetown 8.7% Waterloo Region 4.9% Chaleur CIN 6.0% Surrey 9.2% Kingston 5.0% Niagara Region 6.0% Lethbridge 10.9% Leeds and Grenville 5.0% London 6.2% Yellowknife n/a Huron County 5.1% Antigonish 6.3% Whitehorse n/a Dufferin County 5.2% Halifax 6.3% Sherbrooke 5.2% Canada 6.4%
60 CITIES REDUCING POVERTY NETWORK INCOME INEQUALITY(RATIO OF 9TH/1ST DECILE) Oxford County 4.2 Sault Ste. Marie 4.9 Winnipeg 5.6 Huron County 4.3 Nipissing 4.9 Lethbridge 5.7 Quebec City 4.4 Chatham-Kent 4.9 Regina 5.7 Revelstoke 4.5 Niagara Region 4.9 Halifax 5.7 Strathcona County 4.6 Sherbrooke 5.0 Saint John 5.7 Haldimand-Norfolk 4.6 Medicine Hat 5.0 Canada 5.7 Northumberland 4.6 Sudbury 5.0 Nelson 5.8 Moncton 4.6 Sarnia-Lambton 5.0 Victoria (Capital Regional District) 5.8 Leeds and Grenville 4.6 Peterborough 5.1 Saskatoon 5.8 Dufferin County 4.6 Thunder Bay 5.1 London 5.9 Kawartha Lakes 4.6 Waterloo Region 5.1 Wood Buffalo 6.0 Haliburton 4.7 Durham Region 5.1 Windsor (Essex) 6.1 Antigonish 4.7 Charlottetown 5.3 Peel Region 6.2 Elgin 4.7 Grande Prairie 5.3 Edmonton 6.2 Chaleur CIN 4.7 Fredericton 5.4 Surrey 6.2 Trois Rivieres 4.7 Abbotsford 5.4 St. Michel (Montreal) 6.6 Charlotte County CIN 4.7 Kingston 5.5 St. John s 6.7 Brant-Brantford 4.8 Hamilton 5.6 York Region 6.7 Simcoe County 4.9 Red Deer 5.6 Calgary 7.1 Wellington-Guelph 4.9 Halton Region 5.6 Richmond 10.9
61 Measuring Poverty across the cities reducing poverty network Mapping census tract (CT) data in the City of Ottawa 61
62 OTTAWA % Low income persons Statistics Canada Taxfiler T1FF
63 OTTAWA % Low income, aged Statistics Canada Taxfiler T1FF

64 OTTAWA % Low income children, aged 0-17 Statistics Canada Taxfiler T1FF

65 OTTAWA % Low income seniors, aged 65+ Statistics Canada Taxfiler T1FF
66 OTTAWA % Working Poor, aged (excluding dependents & students) Statistics Canada Taxfiler Custom Order

 Statistics Canada")
67 OTTAWA Working poor as a % of low income persons (aged 18-64) Statistics Canada Taxfiler Custom Order
68 Discussion/Question & Answer 68

69 Michel holds a Master of Urban Planning (1993) and Bachelor of Arts (1991) from McGill University, and is a full member of the Canadian Institute of Planners and the Project Management Institute. Michel has served as lead consultant offering comprehensive support to Canada's leading municipal indicator and community data access projects. These include the Canadian Council on Social Development s Community Data Program (since 2005); the Federation of Canadian Municipalities' Quality of Life Reporting System (since 2002); and the Community Foundations of Canada's Vital Signs Repor ts ( ). SPEAKER BIO Michel Frojmovic, Program Lead 69

70 Michael works on various knowledge-sharing and monitoring initiatives, focussing on the creation and dissemination of sustainability indicators that track local trends and inform policy. Projects involve engaging multiple stakeholders, production of reports and shared databases, as well as providing online tools with access to content, data and rigorously maintained metadata. Projects have included Federation of Canadian Municipalities' Quality of Life Reporting System the Canadian Council on Social Developments' Community Data Program, the Community Foundation of Canada s Vital Signs Reports and the Sustainable Community Indicators Program, a joint project of Environment Canada, Canada Mortgage and Housing Corporation and the Federation of Canadian Municipalities. SPEAKER BIO Michael Ditor, Senior Analyst 70

71 CCSD S COMMUNITY DATA PROGRAM For more information, contact Michel Frojmovic, MCIP, RPP, PMP Lead, Community Data Program michel@ccsd.ca Social Development by Design Canadian Council on Social Development 71
2016 Census: Release 4. Income. Dr. Doug Norris Senior Vice President and Chief Demographer. September 20, Environics Analytics
 2016 Census: Release 4 Income Dr. Doug Norris Senior Vice President and Chief Demographer September 20, 2017 Today s presenter Dr. Doug Norris Senior Vice President and Chief Demographer 2 housekeeping
Does Money Matter? Determining the Happiness of Canadians
 Does Money Matter? Determining the Happiness of Canadians Andrew Sharpe Executive Director, Centre for the Study of Living Standards CSLS-ICP Conference on the Implications of Happiness Research for Public
LibraryCo Inc. Annual Report Osgoode Hall, 130 Queen Street West, Toronto, Ontario, M5H 2N6.
 Osgoode Hall, 130 Queen Street West, Toronto, Ontario, M5H 2N6 www.libraryco.ca Message from the board 2014 was a busy year for LibraryCo Inc., with continuing activity and interaction between and amongst
Metropolitan Gross Domestic Product: Experimental Estimates, 2001 to 2009
 Catalogue no. 11-626-X No. 042 ISSN 1927-503X ISBN 978-1-100-25208-7 Economic Insights Metropolitan Gross Domestic Product: Experimental Estimates, 2001 to 2009 by Mark Brown and Luke Rispoli Release date:
Canadian Council on Social Development ccsd.ca. The Community Data Consortium Program Communitydata.ca
 Canadian Council on Social Development ccsd.ca The Community Data Consortium Program Communitydata.ca Community Data Consortium Program Established in the mid-1990s as a gateway for municipalities and
Cross Canada Check-up
 Cross Canada Check-up Provincial/territorial findings from CANADA S NEIGHBOURHOOD FINANCIAL HEALTH INDEX Canadian Council on Social Development Conseil canadien de développement social 1 Introduction 3.4
Cross Canada Check-up
 Cross Canada Check-up Provincial/territorial findings from CANADA S NEIGHBOURHOOD FINANCIAL HEALTH INDEX Canadian Council on Social Development Conseil canadien de développement social 1 Introduction 3.4
TREIM 2017: ONTARIO TOURISM REGIONAL ECONOMIC IMPACT MODEL USER MANUAL
 TREIM 2017: ONTARIO TOURISM REGIONAL ECONOMIC IMPACT MODEL USER MANUAL Prepared for: Tourism Policy and Research Branch Ontario Ministry of Tourism, Culture and Sport 400 University Avenue th 5 Floor Toronto,
Executive Director Financial Analysis and Accountability Branch. EPO Funding Supports for Labour Implementation
 Ministry of Education Ministère de l Éducation Financial Analysis and Direction de l analyse et de la Accountability Branch responsabilité financières 21 st Floor, Mowat Block 21 e étage, édifice Mowat
Highlights. Ontario. Retirement Homes Report. Canada Mortgage and Housing Corporation. Table of Contents. subscribe NOW! Date Released: 2008
 Housing Market Information Retirement Homes Report Ontario Canada Mortgage and Housing Corporation Date Released: 2008 Figure 1 Highlights The vacancy rate for private retirement homes in Ontario declined
Canada-Ontario Affordable Housing Program (AHP) 2009 Extension. Homeownership Component
 2009 Extension. Homeownership Component") Canada-Ontario Affordable Housing Program (AHP) 2009 Extension Program Guidelines Ministry of Municipal Affairs and Housing Queen s Printer for Ontario, 2009 ISBN 978-1-4435-0782-0 (PDF) Disponible en
Canada-Ontario Affordable Housing Program (AHP) 2009 Extension Program Guidelines Ministry of Municipal Affairs and Housing Queen s Printer for Ontario, 2009 ISBN 978-1-4435-0782-0 (PDF) Disponible en
1 in 6 people.* 5.8 million people in Canada live in poverty That is16.8% or
 5.8 million people in Canada live in poverty That is16.8% or 1 in 6 people.* Canada has its first national poverty reduction strategy Opportunity for All. 1 The strategy sets targets to reduce poverty
Consumer Price Index. Highlights. Manitoba fourth highest among provinces. Consumer Price Index (CPI), Manitoba and Canada, November 2018
, Manitoba and Canada, November 2018") MBS Reports C o n s u m e r P r i c e I n d e x, N o v e m b e r 2 0 1 8 1 Consumer Price Index N o v e m b e r 2 0 1 8 Highlights The Manitoba all-items Consumer Price Index (CPI) increased 1.7% on a
MBS Reports C o n s u m e r P r i c e I n d e x, N o v e m b e r 2 0 1 8 1 Consumer Price Index N o v e m b e r 2 0 1 8 Highlights The Manitoba all-items Consumer Price Index (CPI) increased 1.7% on a
Consumer Price Index. Highlights. Manitoba third highest among provinces. Consumer Price Index (CPI), Manitoba and Canada, December 2018
, Manitoba and Canada, December 2018") MBS Reports C o n s u m e r P r i c e I n d e x, D e c e m b e r 2 0 1 8 1 Consumer Price Index D e c e m b e r 2 0 1 8 Highlights The Manitoba all-items Consumer Price Index (CPI) increased 2.1% on a
MBS Reports C o n s u m e r P r i c e I n d e x, D e c e m b e r 2 0 1 8 1 Consumer Price Index D e c e m b e r 2 0 1 8 Highlights The Manitoba all-items Consumer Price Index (CPI) increased 2.1% on a
INSIGHTS WEST Survey on Canadian Travel Behaviour - June 27, 2017
 (Summary Table: Appealing 8-10) Using a 10-point scale where 1 means Not at all appealing and 10 means Very appealing, how appealing do you personally consider the idea of visiting each of the following
Consumer Price Index report
 MBS Reports C o n s u m e r P r i c e I n d e x R e p o r t, J u n e 2 0 1 8 1 Consumer Price Index report J u n e 2 0 1 8 Highlights The Manitoba all-items Consumer Price Index (CPI) rose 2.7% on a year-over-year
Consumer Price Index. Highlights. Manitoba second highest among provinces. MBS Reports C o n s u m e r P r i c e I n d e x, M a r c h
 MBS Reports C o n s u m e r P r i c e I n d e x, M a r c h 2 0 1 9 1 Consumer Price Index M a r c h 2 0 1 9 Highlights The Manitoba all-items Consumer Price Index (CPI) increased 2.3% on a year-overyear
New Brunswick Analysis 2016 Census Topic: Income
 2016 Census Topic: Income Post-Secondary Education, Training and Labour January 2018 Contents General Information... 2 Section 1 Household Income... 2 1.1 Household Income National Context... 2 1.2 Household
2012 Annual Alberta Labour Market Review
 2012 Annual Alberta Labour Market Review Employment. Unemployment. Economic Regions. Migration Aboriginal People. Industries. Occupations. Education. Demographics Employment Alberta has the highest employment
Consumer Price Index report
 MBS Reports C o n s u m e r P r i c e I n d e x R e p o r t, J u l y 2 0 1 8 1 Consumer Price Index report J u l y 2 0 1 8 Highlights The Manitoba all-items Consumer Price Index (CPI) increased 3.3% on
Consumer Price Index. Highlights. Manitoba third highest among provinces. Consumer Price Index (CPI), Manitoba and Canada, September 2018
, Manitoba and Canada, September 2018") MBS Reports C o n s u m e r P r i c e I n d e x, S e p t e m b e r 2 0 1 8 1 Consumer Price Index S e p t e m b e r 2 0 1 8 Highlights The Manitoba all-items Consumer Price Index (CPI) increased 2.4% on
MBS Reports C o n s u m e r P r i c e I n d e x, S e p t e m b e r 2 0 1 8 1 Consumer Price Index S e p t e m b e r 2 0 1 8 Highlights The Manitoba all-items Consumer Price Index (CPI) increased 2.4% on
Alberta Labour Market Outlook
 Labour Market Outlook Released March 2012 Factors Likely to Affect Alberta s Labour Market Global economic and financial uncertainty created by the Eurozone debt crisis Economic growth in emerging markets
Workforce Attraction
 labour market 59 Workforce Attraction Ranking of 150 global cities Calgary ranked in the global Top 10 Most Attractive Cities for Workers Financial (salary levels, living costs, taxes) + Lifestyle (quality
Consumer Price Index. Highlights. Manitoba second highest among provinces. Consumer Price Index (CPI), Manitoba and Canada, February 2019
, Manitoba and Canada, February 2019") MBS Reports C o n s u m e r P r i c e I n d e x, F e b r u a r y 2 0 1 9 1 Consumer Price Index F e b r u a r y 2 0 1 9 Highlights The Manitoba all-items Consumer Price Index (CPI) increased % on a year-overyear
MBS Reports C o n s u m e r P r i c e I n d e x, F e b r u a r y 2 0 1 9 1 Consumer Price Index F e b r u a r y 2 0 1 9 Highlights The Manitoba all-items Consumer Price Index (CPI) increased % on a year-overyear
PROOF FOOD INSECURITY POLICY RESEARCH. Valerie Tarasuk Andy Mitchell Naomi Dachner
 2014 PROOF Valerie Tarasuk Andy Mitchell Naomi Dachner HOUSEHOLD IN CANADA, 2014 Household Food Insecurity in Canada, 2014 Valerie Tarasuk Andy Mitchell Naomi Dachner Acknowledgments: This report is a
Labour Market Information Monthly
 Canada's population estimates: Subprovincial areas, July 1, 2014 On July 1, 2014, almost 7 in 10 Canadians, or 24,858,600 people, were living in a census metropolitan area (CMA). In turn, more than one
Results from the City of Edmonton s 2007 Property Tax Survey
 Results from the City of Edmonton s 2007 Property Tax Survey Presentation prepared by: City of Winnipeg CAO Secretariat January 2008 QUICK OVERVIEW AND HIGHLIGHTS The Edmonton Residential Property Tax
Valerie Tarasuk Andy Mitchell Naomi Dachner. PROOF Research to identify policy options to reduce food insecurity
 PROOF Research to identify policy options to reduce food Valerie Tarasuk Andy Mitchell Naomi Dachner HOUSEHOLD FOOD INSECURITY IN CANADA, 2012 Household Food Insecurity in Canada, 2012 Valerie Tarasuk
Public Sector Debt. Quick Hit Plus! Muni market mash-up. FICC Strategy. January 23, (Vol. III, No. 11)
") FICC Strategy Quick Hit Plus! Muni market mash-up January 3, 19 - (Vol. III, No. 11) We don t necessarily favour a scattershot approach to credit analysis, but there have been a few recent developments
FICC Strategy Quick Hit Plus! Muni market mash-up January 3, 19 - (Vol. III, No. 11) We don t necessarily favour a scattershot approach to credit analysis, but there have been a few recent developments
Estimated Impact of the Elimination in 100,000 Public Sector Jobs in Cities and Communities across Ontario
 Estimated Impact of the Elimination in 100,000 Public Sector Jobs in Cities and Communities across Ontario Prepared by Toby Sanger, CUPE National 28 May 2014 Introduction On May 9 th, Ontario Conservative
Cost Containment Principles, Policies and Practices. Efficiency and Effectiveness Policies and Practices. Small Business Measures
 Cost Containment Principles, Policies and Practices Efficiency and Effectiveness Policies and Practices Small Business Measures Waste Diversion Ontario July 12, 2004 Table of Contents Executive Summary
Results from the City of Edmonton s 2008 Property Tax Survey
 Results from the City of Edmonton s 2008 Property Tax Survey Presentation prepared by: City of Winnipeg Office of the CFO August 2009 QUICK OVERVIEW AND HIGHLIGHTS The Edmonton Residential Property Tax
2018 Ontario Utility Allowances
 2018 Ontario Utility Allowances START HERE First, determine your new utility zone using the chart below. Then find the chart that applies to your co-op. Municipality Previous Utility Zone New Utility Zone
2017 Annual Alberta Labour Market Review
 2017 Annual Alberta Labour Market Review Employment. Unemployment. Economic Regions Migration. Indigenous People. Industries Occupations. Education. Demographics Employment Employment grew by 1. in Alberta
Saskatchewan Labour Force Statistics
 Saskatchewan Labour Force Statistics April 2017 UNADJUSTED DATA According to the Statistics Canada Labour Force Survey during the week covering April 9 th to 15 th,, 2017, there were 560,100 persons employed
ALBERTA FORECAST HOW LONG WILL IT LAST?
 ALBERTA FORECAST HOW LONG WILL IT LAST? FOCUSED ON THE WEST British Columbia Corporate tax rate lowered to 12% Rich resource sector 2010 Olympics construction boom 2006 GDP +4.0% (fcst) Alberta Only debt-free
Guelph s Financial Strategy 2014
 Guelph s Financial Strategy 2014 GUELPH S FINANCIAL STRATEGY Guelph is one of Canada s most livable cities - a testament to this community s commitment to Guelph s vision: Be a city that makes a difference
n Appendix 2: THE MANITOBA ADVANTAGE
 BUDGET 2012 Taxation Adjustments / C19 n Appendix 2: THE MANITOBA ADVANTAGE Manitoba is a diversified economy where no single industry dominates the industrial base. Manitoba has been quick to adjust to
Ministère de l Éducation. Direction des politiques et des programmes d immobilisations 900, rue Bay 19 e étage, Édifice Mowat
 Ministry of Education Capital Policy and Programs Branch 900 Bay Street 19 th Floor, Mowat Block Toronto ON M7A 1L2 Ministère de l Éducation Direction des politiques et des programmes d immobilisations
Ontario Home Builders Association
 Ontario Home Builders Association 20 Upjohn Rd., Suite 101 (416) 443-1545 North York, Ontario Toll Free 1-800-387-0109 M3B 2V9 Fax: (416) 443-9982 www.ohba.ca info@ohba.ca January 8, 2016 Mr. David Marshall
Socio-economic Profile for Pan-Northern Region Community Futures Development Corporation. Prepared for: FedNor/Industry Canada
 Socio-economic Profile for Community Futures Development Corporation Prepared for: FedNor/Industry Canada Statistics Canada Central Region March 2014 TABLE OF CONTENTS Introduction 4 Geography Note 5 List
to the Growth Plan for the Greater Golden Horseshoe, 2006
 Proposed Amendment 2 to the Growth Plan for the Greater Golden Horseshoe, 2006 November 2012 Population and Employment Forecasts Policies and Implementation Proposed Amendment 2 to the Growth Plan for
The Reform of Business Property Tax in Ontario: An Evaluation
 The Reform of Business Property Tax in Ontario: An Evaluation University of Toronto Introduction in Ontario (most of Canada) are high typically 25-40% of gross rents 2 4 times residential tax rates Past
Alberta Self-Employment Profile
 Alberta Self-Employment Profile 2016 Overview Self-employment represents the entrepreneurial spirit of Alberta. This spirit is at the heart of Alberta s vibrant economy. By creating employment, producing
To report back on the results of the external review of compensation for elected officials.
 STAFF REPORT April 24, 2006 To: From: Subject: Employee and Labour Relations Committee City Manager Compensation Review: Elected Officials Purpose: To report back on the results of the external review
Inspection of BDO Canada LLP (Headquartered in Toronto, Canada) Public Company Accounting Oversight Board
 Public Company Accounting Oversight Board") 1666 K Street, N.W. Washington, DC 20006 Telephone: (202) 207-9100 Facsimile: (202) 862-8433 www.pcaobus.org Inspection of BDO Canada LLP (Headquartered in Toronto, Canada) Issued by the Public Company
1666 K Street, N.W. Washington, DC 20006 Telephone: (202) 207-9100 Facsimile: (202) 862-8433 www.pcaobus.org Inspection of BDO Canada LLP (Headquartered in Toronto, Canada) Issued by the Public Company
CONSUMER PRICE INDEX REPORT NOVEMBER 2017
 CONSUMER PRICE INDEX REPORT NOVEMBER 2017 M A N I T O B A B U R E A U O F S T A T I S T I C S RIGHT ANSWERS RIGHT NOW December 21, 2017 CONTENTS SUMMARY CHART 1 - ANNUAL INFLATION RATE: MANITOBA AND CANADA
Demographic Trends: The 2mes they are a changin Highlights from the 2011 Census and Na2onal Household Survey
 Demographic Trends: The 2mes they are a changin Highlights from the 2011 Census and Na2onal Household Survey Dr. Doug Norris Senior Vice- President and Chief Demographer Presented to MRIA O/awa Chapter
2006 Property Assessment and Tax Analysis of 2005 Data. Prepared for Real Property Association of Canada. December 14, 2006
 2006 Property Assessment and Tax Analysis of 2005 Data Prepared for Real Property Association of Canada December 14, 2006 Prepared by: A division of Altus Group Limited 191 The West Mall, Suite 200 ON
EXTENSION AGREEMENT BETWEEN: ONTARIO PUBLIC SCHOOL BOARDS' ASSOCIATION hereinafter: "OPSBA" AND
 EXTENSION AGREEMENT BETWEEN: ONTARIO PUBLIC SCHOOL BOARDS' ASSOCIATION hereinafter: "OPSBA" AND ELEMENTARY TEACHERS' FEDERATION OF ONTARIO hereinafter: "ETFO" AND AGREED TO BY: THE CROWN 1. The parties
Memorandum. Some of the report s key findings include:
 Community and Health Services Department Office of the Commissioner Memorandum To: From: Members of Committee of the Whole Katherine Chislett Commissioner of Community and Health Services Date: April 6,
context about this report what is poverty?
 Poverty Trends in London September 2015 table of contents 3 3 3 4 5 5 6 8 9 10 11 12 13 14 14 15 15 16 context about this report what is poverty? who is most likely experiencing poverty? how is ontario
THE GROWTH OUTLOOK FOR THE GREATER GOLDEN HORSESHOE
 THE GROWTH OUTLOOK FOR THE GREATER GOLDEN HORSESHOE Simcoe Grey Dufferin Wellington Peel Halton erth Waterloo Hamilton Oxford Brant Haldimand Norfolk Kawartha Peterborough Lakes Northumberland Durham York
Canadians Are Happy and Getting Happier: An Overview of Life Satisfaction in Canada,
 September 2012 0 151 Slater Street, Suite 710 Ottawa, Ontario K1P 5H3 613-233-8891, Fax 613-233-8250 csls@csls.ca Centre for the Study of Living Standards Canadians Are Happy and Getting Happier: An Overview
CONSUMER PRICE INDEX REPORT OCTOBER 2017
 CONSUMER PRICE INDEX REPORT OCTOBER 2017 M A N I T O B A B U R E A U O F S T A T I S T I C S RIGHT ANSWERS RIGHT NOW November 17, 2017 CONTENTS SUMMARY CHART 1 - ANNUAL INFLATION RATE: MANITOBA AND CANADA
LABOUR FORCE STATISTICS REPORT MAY 2018
 LABOUR FORCE STATISTICS REPORT MAY 2018 MANITOBA BUREAU OF STATISTICS JUNE 8, 2018 CHARTS 1. UNEMPLOYMENT RATES, CANADA AND PROVINCES 2. YOUTH UNEMPLOYMENT RATES, CANADA AND PROVINCES 3. TOTAL EMPLOYMENT,
2007 Property Assessment and Tax Analysis of 2006 Data. Prepared for Real Property Association of Canada. November 23, 2007
 2007 Property Assessment and Tax Analysis of 2006 Data Prepared for Real Property Association of Canada November 23, 2007 Prepared by: ALTUS DERBYSHIRE A division of Altus Group Limited 191 The West Mall,
Central West Ontario Social and Economic Inclusion Project. Brant County Profile. Prepared by:
 Central West Ontario Social and Economic Inclusion Project Brant County Profile Prepared by: December, 2003 1.0 Introduction to Brant County Brant County is located between Hamilton to the east and London
LABOUR FORCE STATISTICS REPORT APRIL 2018
 LABOUR FORCE STATISTICS REPORT APRIL 2018 MANITOBA BUREAU OF STATISTICS MAY 11, 2018 CHARTS 1. UNEMPLOYMENT RATES, CANADA AND PROVINCES 2. YOUTH UNEMPLOYMENT RATES, CANADA AND PROVINCES 3. TOTAL EMPLOYMENT,
LABOUR FORCE STATISTICS REPORT OCTOBER 2018
 LABOUR FORCE STATISTICS REPORT OCTOBER 2018 MANITOBA BUREAU OF STATISTICS NOVEMBER 2, 2018 CHARTS 1. UNEMPLOYMENT RATES, CANADA AND PROVINCES 2. YOUTH UNEMPLOYMENT RATES, CANADA AND PROVINCES 3. TOTAL
LABOUR FORCE STATISTICS REPORT AUGUST 2018
 LABOUR FORCE STATISTICS REPORT AUGUST 2018 MANITOBA BUREAU OF STATISTICS SEPTEMBER 7, 2018 CHARTS 1. UNEMPLOYMENT RATES, CANADA AND PROVINCES 2. YOUTH UNEMPLOYMENT RATES, CANADA AND PROVINCES 3. TOTAL
Provincial and National Employment, Alberta and Canada Employment Rates 1, % 62.7% 62.7% 63.0% 63.5%
 Employment ALBERTA S HOT ECONOMY CONTINUES TO PRODUCE HIGH EMPLOYMENT GROWTH IN 2007 The number of employed Albertans in 2007 increased by 88,775, higher than the 2006 growth of 86,240. The economy also
An Introduction to the Scientific Research and Experimental Development Program
 An Introduction to the Scientific Research and Experimental Development Program 4052(E) Rev. 07 Your opinion counts! We review our income tax guides and pamphlets each year. If you have any comments or
ALBERTA LABOUR FORCE PROFILES Aboriginal People in the Labour Force Alberta Labour Force Profiles
 ALBERTA LABOUR FORCE PROFILES Aboriginal People in the Labour Force 2009 Alberta Labour Force Profiles Aboriginal People 2011 Highlights 1. Population of More than 60.0% of the working age population (WAP)
Socio-economic Profile for Northeastern Region Community Futures Development Corporation. Prepared for: FedNor/Industry Canada
 Socio-economic Profile for Community Futures Development Corporation Prepared for: FedNor/Industry Canada Statistics Canada Central Region June 2015 TABLE OF CONTENTS Introduction 4 Geography Note 5 List
How Much Are Canadians Paying for Milk?
 June 18th, 2018 How Much Are Canadians Paying for Milk? Prepared By: Field Agent Canada Executive Summary Field Agent Canada conducted a cross-country price survey on fluid milk prices at 171 retailers
Economic Spotlight June 20, 2009
 Economic Spotlight June 2, 29 Summary: Consumer Bankruptcy Deteriorating economic conditions, combined with rising unemployment and declining asset values, have caused a significant increase in consumer
ALBERTA PROFILE: YOUTH IN THE LABOUR FORCE
 ALBERTA PROFILE: YOUTH IN THE LABOUR FORCE Highlights Statistics Canada defines youth as those people between the ages of 15-24 years. 1 1. Youth Labour Force Statistics Over one quarter of Canada s increase
2011 Community Development Halton, all rights reserved.
 May 2011 2011 Community Development Halton, all rights reserved. Copies of this document may be reproduced non-commercially for the purpose of community awareness or community development with appropriate
2017 Financial Information Return Instructions Ministry of Municipal Affairs Municipal Finance Policy Branch
 2017 Financial Information Return Instructions Ministry of Municipal Affairs Municipal Finance Policy Branch FIR2017 Introduction INTRO - 1 Table of Contents 1. Introduction... 4 2. Municipal Services
Form F2 Change or Surrender of Individual Categories (section 2.2(2), 2.4, 2.6(2) or 4.1(4))
, 2.4, 2.6(2) or 4.1(4))") Form 33-109F2 Change or Surrender of Individual Categories (section 2.2(2), 2.4, 2.6(2) or 4.1(4)) GENERAL INSTRUCTIONS Complete and submit this form to notify the relevant regulator(s) or, in Québec,
Form 33-109F2 Change or Surrender of Individual Categories (section 2.2(2), 2.4, 2.6(2) or 4.1(4)) GENERAL INSTRUCTIONS Complete and submit this form to notify the relevant regulator(s) or, in Québec,
Modifying the five solitudes of Ontario / 2. How the metropolitan areas have performed the big picture / 5. Supporting the Fraser Institute / 37
 Contents Executive summary / iii Introduction / 1 Modifying the five solitudes of / 2 How the metropolitan areas have performed the big picture / 5 Conclusion / 29 Appendix / 30 References / 33 About the
Charlottetown St. John's Halifax Fredericton Québec Toronto Iqaluit Ottawa innipeg W Yelowknife Regina onton Edm hitehorse Victoria
 Yukon Whitehorse! British Columbia! Victoria Northwest Territories! Yellowknife Alberta Edmonton! Saskatchewan Regina! Nunavut Manitoba! Winnipeg Ontario Iqaluit! Newfoundland and Labrador Quebec! St.
Low Income Lines,
 Catalogue no. 75F0002M No. 002 ISSN 1707-2840 ISBN 978-1-100-20844-2 Research Paper Income Research Paper Series Low Income Lines, 2010 2011 Income Statistics Division Jean Talon Building, 170 Tunney's
UP, UP, AND AWAY. The Impact of Restrictive Tendering ON MUNICIPAL CONTRACTING IN ONTARIO DECEMBER 2017
 UP, UP, AND AWAY The Impact of Restrictive Tendering ON MUNICIPAL CONTRACTING IN ONTARIO DECEMBER 2017 DR. MORLEY GUNDERSON DR. TINGTING ZHANG BRIAN DIJKEMA ABOUT CARDUS CARDUS IS A THINK TANK dedicated
TD Covered Bond (Legislative) Programme Monthly Investor Report Calculation Date: 30-Jun-15
 Programme Monthly Investor Report Calculation Date: 30-Jun-15") TD Covered Bond Programme Monthly Investor Report - June 30, 2015 1 This report contains information regarding TD Covered Bond (Legislative) Programme's Cover Pool as of the indicated Calculation Date.
TD Covered Bond Programme Monthly Investor Report - June 30, 2015 1 This report contains information regarding TD Covered Bond (Legislative) Programme's Cover Pool as of the indicated Calculation Date.
TD Covered Bond (Legislative) Programme Monthly Investor Report
 Programme Monthly Investor Report") TD Covered Bond Programme Monthly Investor Report - December 31, 2015 1 This report contains information regarding TD Covered Bond (Legislative) Programme's Cover Pool as of the indicated Calculation Date.
TD Covered Bond Programme Monthly Investor Report - December 31, 2015 1 This report contains information regarding TD Covered Bond (Legislative) Programme's Cover Pool as of the indicated Calculation Date.
TD Covered Bond (Legislative) Programme Monthly Investor Report
 Programme Monthly Investor Report") TD Covered Bond Programme Monthly Investor Report - February 29, 2016 1 This report contains information regarding TD Covered Bond (Legislative) Programme's Cover Pool as of the indicated Calculation Date.
TD Covered Bond Programme Monthly Investor Report - February 29, 2016 1 This report contains information regarding TD Covered Bond (Legislative) Programme's Cover Pool as of the indicated Calculation Date.
Understanding the Fiscal Environment for Cities
 Understanding the Fiscal Environment for Cities Presentation for Toronto Urban Fellows 20 June, 2013 Enid Slack & André Côté Institute on Municipal Finance and Governance Munk School of Global Affairs
Tracking the SDGs in Canadian Cities: SDG 8
 BRIEFING NOTE Tracking the SDGs in Canadian Cities: SDG 8 Jennifer Temmer & Kyle Wiebe January 2018 A key indicator for a vibrant city is a strong economy and quality work opportunities for all citizens.
Northern Residents Deductions for 2016
 Northern Residents Deductions for 2016 The purpose of this information sheet is to provide you with general information about the northern residents deductions and answer some frequently asked questions.
A Profile of Wellbeing in Ontario THE NORTH REGION. An agency of the Government of Ontario. Un organisme du gouvernement de l Ontario.
 A Profile of Wellbeing in Ontario THE NORTH REGION An agency of the Government of Ontario. Un organisme du gouvernement de l Ontario. ACKNOWLEDGMENTS We would like to thank the Ontario Trillium Foundation
Commissioner, Community and Neighbourhood Services. Subject: Ontario Works Benefit Rates: Loss of Purchasing Power Since 1995
 Community & Neighbourhood Services Eric Gam, Commissioner Social Services Division 55 John Street Station 1123, 12 th Floor, Metro Hall Toronto, ON M5V 3C6 Heather MacVicar General Manager Tel: 416 392-8623
2008 ANNUAL ALBERTA LABOUR MARKET REVIEW
 ANNUAL ALBERTA LABOUR MARKET REVIEW employment unemployment economic regions migration aboriginal people industries occupations education demographics Employment and Immigration EMPLOYMENT Employment increased
Charlottetown St. John's Halifax Fredericton Québec Toronto Iqaluit Ottawa innipeg W Yelowknife Regina onton Edm hitehorse Victoria
 Yukon Whitehorse! British Columbia! Victoria Northwest Territories! Yellowknife Alberta Edmonton! Saskatchewan Regina! Nunavut Manitoba! Winnipeg Ontario Iqaluit! Newfoundland and Labrador Quebec! St.
TD Covered Bond (Legislative) Programme Monthly Investor Report Calculation Date: 31/05/17 Date of Report: 21/06/17
 Programme Monthly Investor Report Calculation Date: 31/05/17 Date of Report: 21/06/17") Programme Information Covered Bond (Legislative) Programme Monthly Investor Report This report contains information regarding Covered Bond (Legislative) Programme's Cover Pool as of the indicated Calculation
Programme Information Covered Bond (Legislative) Programme Monthly Investor Report This report contains information regarding Covered Bond (Legislative) Programme's Cover Pool as of the indicated Calculation
Northern Residents Deductions for 2017
 Northern Residents Deductions for 2017 The purpose of this information sheet is to provide you with general information about the northern residents deductions and answer some frequently asked questions.
Consumer Perspective: Industry Insights and Lending Dynamics. Matt Fabian Director, Research & Industry Analysis
 Consumer Perspective: Industry Insights and Lending Dynamics Matt Fabian Director, Research & Industry Analysis Agenda 1 Context A summary of economic trends 2 An overall perspective on the Canadian consumer
Mortgage solutions that make sense
 Mortgage solutions that make sense Protecting your client s biggest asset PN00035F (2015/04/21) Agenda Review of the Canadian housing market Structuring mortgage solutions for your clients Case study Business
Comparing Poverty Measures Ontario
 Comparing Poverty Measures Ontario Working Paper No. 4 Informetrica Limited August 2009 Richard Shillington Michelle Lasota Mike McCracken: Reviewer Table of Contents 1 Objectives... 2 2 Application of
Diversified National Platform Positioned for Continued Profitable Growth. January
 Diversified National Platform Positioned for Continued Profitable Growth January 2016 www.northviewreit.com Disclaimer This presentation may contain forward-looking information. All information included
RECIPROCAL TRANSFER AGREEMENT WITH TEACHERS PENSION PLAN AUTHORITIES
 RECIPROCAL TRANSFER AGREEMENT WITH This information sheet provides information as to whether you may be eligible to transfer a benefit under the terms of the Reciprocal Transfer Agreement between the Teachers
It s Complicated Benjamin Tal, Deputy Chief Economist & Managing Director
 It s Complicated Benjamin Tal, Deputy Chief Economist & Managing Director September 214 EZ Vulnerability to Russia Limited, Outside Energy 18 16 14 12 1 Russian Federation, % of exports, 213 3.5 3. 2.5
The Implications of New Brunswick s Population and Labour Market Forecasts
 The Implications of New Brunswick s Population and Labour Market Forecasts November 22, 2017 John Calhoun Post-Secondary Education, Training and Labour 1 Presentation Outline Population and Labour Market
SUBMISSION TO: MINISTER OF FINANCE FEBRUARY 3, Toronto Financial District BIA
 SUBMISSION TO: MINISTER OF FINANCE FEBRUARY 3, 2015 SUBMITTED BY: Toronto Association of Business Improvement Areas (TABIA) Toronto Financial District BIA John Kiru, Executive Director Lionel Miskin, Vice
List of educational programs (accredited and registered)
") List of educational programs (accredited and registered) Last updated: March 1, 2018 Cardiology technology Cardiovascular perfusion Clinical genetics Cytotechnology Diagnostic medical sonography Magnetic
List of educational programs (accredited and registered) Last updated: March 1, 2018 Cardiology technology Cardiovascular perfusion Clinical genetics Cytotechnology Diagnostic medical sonography Magnetic
Fact Sheet Calgary Wealth
 Fact Sheet Calgary Wealth CALGARY CENSUS METROPOLITAN AREA (CMA) 2017 EDITION RESEARCH & STRATEGY PUBLISHED: FEBRUARY 2018 From personal income to investments, Calgary is Canada s leader in earnings and
Canadian Western Bank Group. Third Quarter 2011 Corporate Presentation
 Canadian Western Bank Group Third Quarter 2011 Corporate Presentation ADVISORY Forward-looking Statements From time to time, Canadian Western Bank (the Bank) makes written and verbal forward-looking statements.
DALRON CONSTRUCTION LIMITED
 DALRON CONSTRUCTION LIMITED RESEARCH COORDINATOR, JAMES CUDDY 4 JUNE 215, DAYS INN, SUDBURY Overview What is Northern Policy Institute? Economic growth in Northern Ontario Economic growth in Greater Sudbury
Price per Patron. Discount. $30-$47 (2011) (varies by municipality) 50% $25-$57.50 (2016) $43.50 (2012) $47.50 (2016) 50%
 (varies by municipality) 50% $25-$57.50 (2016) $43.50 (2012) $47.50 (2016) 50%") Appendix A: Canadian and International Jurisdictional Reviews Summary Table EX20.10a Jurisdiction GTHA Halton Region 2011 LICO-BT Gross LICO + 15% Sponsored refugees (gov't/ private) /ODSP (those not in
Appendix A: Canadian and International Jurisdictional Reviews Summary Table EX20.10a Jurisdiction GTHA Halton Region 2011 LICO-BT Gross LICO + 15% Sponsored refugees (gov't/ private) /ODSP (those not in