2016 Census: Release 4. Income. Dr. Doug Norris Senior Vice President and Chief Demographer. September 20, Environics Analytics
|
|
|
- Hollie Harrison
- 6 years ago
- Views:
Transcription


1 2016 Census: Release 4 Income Dr. Doug Norris Senior Vice President and Chief Demographer September 20, 2017

2 Today s presenter Dr. Doug Norris Senior Vice President and Chief Demographer 2
3 housekeeping Listen-only mode for attendees Questions at the end. Use the Webex Q&A Feature in your Interface Technical difficulties? Presentation deck will be available environicsanalytics.com/webcasts 3
4 Overview of presentation Background on income measurement Household income Individual income Income of couples Low-income A closer look at seniors Contributions to savings programs What s still to come 4
5 Background on income measurement 5
6 Changes in collection of Income Data Income data collected solely from tax records Record Linkage rate T1 record 85.2% CRA record (partial information) 94.8% Income data derived from all persons rather than the sample long form as in previous censuses (30 percent sample in 2016) New information available on contributions to various government programs Registered Retirement Savings Program (RRSP) Registered Pension Plans (RRP) Tax Free Savings Account (TFSA) 6
7 Measuring income Many different measures of income for 2015 Total Household Income Total Income of Individuals Census Family Income Economic Family Income Refers to a group of two or more persons who live in the same dwelling and are related to each other by blood, marriage, common-law, adoption, or a foster relationship Before and after tax income Comparisons of 2015 to 2005 from 2006 Census Summary measures Median Average (Mean) to be released later on sample data Aggregate Income to be released later on sample data 7
8 Components of Total Income Market Income Employment income (wages and salaries/self-employment) Private retirement income Investment income Any other money income Income from Government Programs Old Age Security (OAS), Guaranteed Income Supplement (GIS), Spouse s Allowance (SPA) Canada Pension Plan (CPP) and Quebec Pension Plan (QPP) benefits Child benefits Employment Insurance (EI) benefits Social assistance Other government transfers Excludes net capital gains or losses 8
9 Income Data available This release presents income statistics for different demographic characteristics: a) Age b) Sex c) Family characteristics d) Household characteristics e) Dwelling characteristics More income estimates will be available in subsequent major census releases, when ethnocultural, housing, education, and labour characteristics collected by the long-form census questionnaire are featured 9
10 Household income 10


11 Total Household Income The total income of a household is the sum of the total incomes of all members of that household 11
12 Various Measures of Median Household/Family Income, 2015, Canada Household Median Income # of Hhlds 14,072,080 Economic Family (2 or more persons) # of Economic Families 9,688,845 Census family (2 or more persons) # of Census Families 9,840,725 Total 70,300 $ Total 88,300 $ 84,600 $ After tax 61,400 After tax 76,400 73,300 % Change % Change % Change Total 10.8 % Total 12.5 % Total 12.0 % After tax 11.5 After tax 12.9 After tax 12.5 Source: Statistics Canada 2016 Census 12
13 Change in median income higher than previous decade Percentage Change in Median Household Income (after adjusting for inflation), Canada % Source: Statistics Canada 2016 Census 13
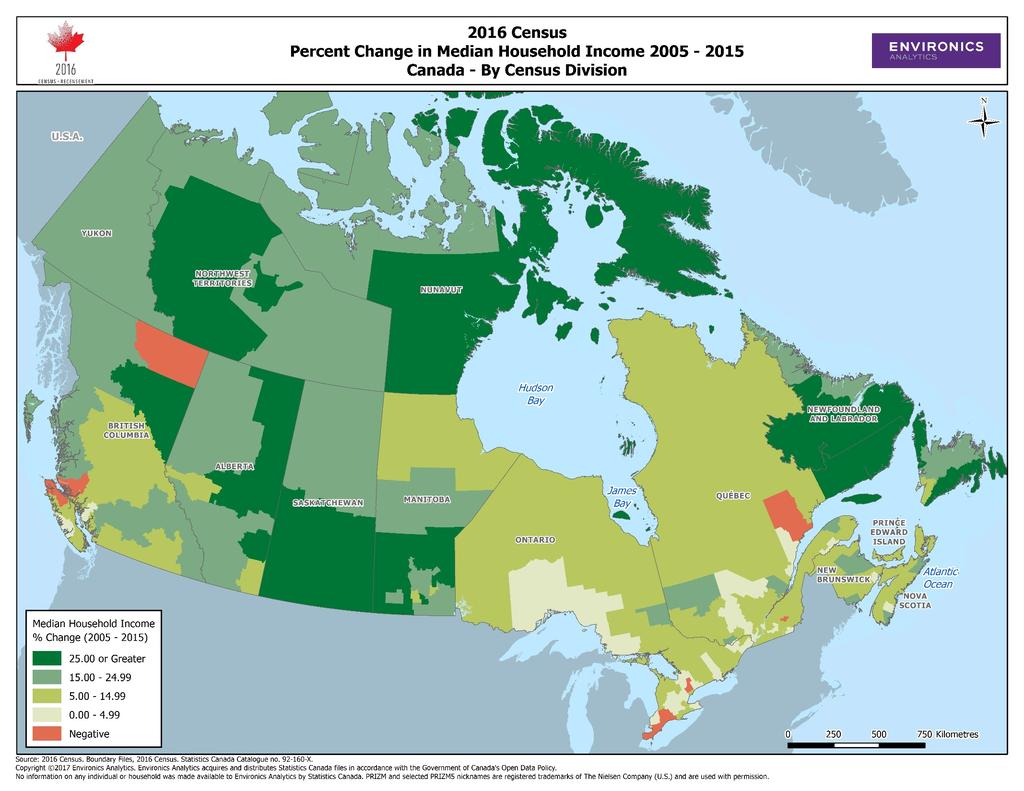
14 Alberta much above average; Highest increases in resource-based provinces Median Household Income ($), 2015, Canada Change (2015$) Alberta Saskatchewan 93,800 75,400 $ Saskatchewan Newfoundland and Labrador % Ontario 74,300 Alberta 24 Canada 70,300 Manitoba 20 British Columbia 70,000 British Columbia 12 Manitoba 68,100 Prince Edward Island 11 Newfoundland and Labrador 67,300 New Brunswick 11 Prince Edward Island 61,200 Canada 11 Nova Scotia 60,800 Nova Scotia 10 Quebec 59,800 Quebec 9 New Brunswick 59,300 Ontario 3.8 Source: Statistics Canada, 2016 Census 14
15 15
16 16
17 Median Household Income 2015: Top 10 and Bottom 10 CMAs Median Household Income ($), 2015, Canada Calgary 99,600 $ Peterborough 64,800 $ Edmonton 94,400 London 64,700 Oshawa 85,700 Belleville 63,900 Regina 84,400 Saint John 63,700 Saskatoon 83,000 St. Catharines - Niagara 63,000 Ottawa - Gatineau 82,100 Moncton 62,900 Guelph 81,200 Montréal 61,800 Barrie 80,800 Saguenay 59,200 St. John's 79,800 Sherbrooke 53,700 Toronto 78,400 Trois-Rivières 51,900 Source: Statistics Canada, 2016 Census 17
18 Change in median income ; Top 10 and Bottom 10 CMAs Percentage Change in Median Household Income ($), , Canada Top 10 Bottom 10 Saskatoon 37.0 Regina 28.1 St. John's 27.5 Edmonton 26.6 Calgary 22.7 Lethbridge 20.5 Kelowna 19.5 Winnipeg 16.6 Abbotsford - Mission 14.1 Victoria 11.5 % Belleville Barrie Toronto Brantford Guelph Kitchener - Cambridge - Waterloo St. Catharines - Niagara Oshawa London -2.1 Windsor -6.4 % Source: Statistics Canada, 2016 Census 18
19 Municipalities vary widely in income Median Household Income, Top 10 and Bottom 10 Municipalities, 2015$ Municipalities of 25,000 households or more Top 10 Bottom 10 Wood Buffalo 195,600 $ Cape Breton 53,800 $ Strathcona County 126,400 Victoria 53,100 Oakville 113,700 Granby 52,400 Vaughan 105,400 Saint John 52,100 Milton 104,700 Sherbrooke 51,700 North Vancouver 104,000 Saint-Jérôme 51,500 Whitby 103,800 Saint-Hyacinthe 50,900 Pickering 99,700 Trois-Rivières 50,700 Calgary 97,300 Drummondville 50,400 Ajax 96,900 Montréal 50,200 19
20 Income varies by family type and Most family types had increases in income Median Household Income, 2015, Canada Total Households 70,300 $ Percentage Change in Median Household Income, , Canada 10.8% Total Households Couple without children 79, % Couple without children Couple with children 112, % Couple with children Male lone-parent 65, % Male lone-parent Female lone-parent 49, % Female lone-parent Non-family households 38, % Non-family households Source: Statistics Canada, 2016 Census 20
21 Distribution of income shifts Upward Percentage Household Income Distribution (2015$), Canada % 10.7 Under $30,000 $30,000 - $59,999 $60,000 - $99,999 $100,000 - $124,999 $125,000+ Source: Statistics Canada 2016 Census 21
22 Calgary CMA has highest concentration of high income Concentration of Household Income above $150,000, 2015 Calgary Edmonton Regina Toronto Saskatoon St. John's Oshawa Ottawa - Gatineau Guelph Hamilton Vancouver Barrie Kitchener - Cambridge - Waterloo Greater Sudbury $150,000-$199,999 $200,000+ Total at end % Source: Statistics Canada 2016 Census 22
23 Individual Income 23
24 Males continue to have much higher incomes Total Income, 2015$, Canada Male Female $ 40,800 28,900 41,200 32,900 56,000 56,300 41,000 40,200 48,700 33,000 34,600 22,800 11,900 11,200 All ages Age Groups Source: Statistics Canada 2016 Census 24
25 However, Income increases higher for females Percentage Change in Median Individual Income by Age Group, , Canada 30 % Male Female M F M F M F M F M F M F M F Age 16 and over and over $40,782 $28,860 11,918 11,172 41,159 32,907 55,981 40,990 56,334 40,217 48,728 33,032 37,647 23,752 30,368 22, Median Income $ 2015 Median Income $ Source: Statistics Canada, 2016 Census 25
26 Income increases higher for females Percentage Change in Median Individual Income by Age Group, , Canada 30 % Male Female M F M F M F M F M F M F M F Age 16 and over and over $40,782 $28,860 11,918 11,172 41,159 32,907 55,981 40,990 56,334 40,217 48,728 33,032 37,647 23,752 30,368 22, Median Income $ Source: Statistics Canada, 2016 Census 26
27 Most individuals receive income from government transfers Percent of Individuals Receiving Income Source, 2015, Canada 90% 80% 70% 60% 50% 40% 30% 20% 10% 0% -10% Investment Income Employment Income EI Benefits Child Benefits All ages Age Groups EI - Employment Insurance Source: Statistics Canada 2016 Census 27
28 Employment accounts for three quarters of total income Sources of Total Income, 2015, Canada Investment 5% Retirement 8% Other 2% Percentage Change in Income, , Canada Total income 26 % Employment income 20 Employment 72% Government transfers 13% Investment income Retirement income Other income Government transfers Source: Statistics Canada, 2015 Income survey 28
29 Aggregate income highest for persons aged Percent of Aggregate Income by Age Group, Canada, 2015 Change in Aggregate Income (2015$) by Age Group, Ages % and over 16% % % % % % Ages and over Source: Statistics Canada Income Survey 29
30 Income of couples 30
31 In nearly a third of couples, women have higher incomes Percent of Couples Where a Female is the Higher Total Income Recipient, 2015, Canada % All ages Age of older person Source: Statistics Canada 2016 Census 31
32 Females contribution higher at lower incomes Percent of Couples Where a Female is the Higher Total Income Recipient, 2015, Canada % Total Income from couple Under $20,000 (including loss) $20,000 - $29,999 $30,000 - $39,999 $40,000 - $49,999 $50,000 - $59,999 $60,000 - $79,999 $80,000 - $99,999 $100,000 and over $100,000 - $124,999 $125,000 - $149,999 $150,000 - $199,999 $200,000 - $249,999 $250,000 and over Source: Statistics Canada 2016 Census 32
33 Same-sex couples have higher household incomes Median Household Income for Couples, 2015$, Canada Opposite-sex couples Same-sex couples $ 87,600 96,900 68,700 56, , , ,500 92,200 62,300 81,200 All ages Age Groups Source: Statistics Canada 2016 Census 33
34 Low-income 34
35 Low-Income Concepts Low-income measure, after tax (LIM-AT) Low-income measure, before tax (LIM-BT) Low-income cut-offs, after tax (LICO-AT) Low-income cut-offs, before tax (LICO-BT) Market Basket Measure (MBM) 35
36 The Low-income measure, after tax, (LIM-AT) Refers to a fixed percentage (50%) of median adjusted after tax income of private households. The household after tax income is adjusted for household size by an equivalence scale to take economies of scale into account. Same threshold for all geographic areas Not calculated for Reserves and 3 Northern Territories Widely used for international comparisons 36
37 Low-Income Cut-off after tax (LICO-AT) Refers to income thresholds, calculated as 20 percentage points higher after tax income than the average spent on food, shelter and clothing. Defined using 1992 expenditure data, adjusted for inflation The LICO-AT has 35 cut-offs varying by seven family sizes and five different sizes of area of residence to account for economies of scale and potential differences in cost of living Not calculated for Reserves or Northern Territories 37
38 Market Basket Measure Refers to the measure of low-income based on the cost of a specific basket of goods and services representing a modest, basic standard of living developed by Employment and Social Development Canada (ESDC). The threshold represents the costs of specified qualities and quantities of food, clothing, footwear, transportation, shelter and other expenses for a reference family of two adults and two children. The measure is adjusted for family size The MBM basket (2011-base) is priced for 50 different geographic areas The 2016 MBM is not yet available as it depends on some long form data 38
39 Alternative Measures of Low-Income from Household Surveys, Canada 16% 15% 14% 13% 12% 11% 10% 9% 8% 7% 6% LIM-AT MBM LICO-AT LIM-AT Low-income measure after tax LICO-AT Low-income cut-offs after tax, 1992 base MBM Market basket measure, 2011 base Source: Statistics Canada, Income surveys 39
40 Thresholds for 2015 Census low-income Measure After tax 31,300 38,300 44,300 49,500 54,200 58,600 $ 22,100 1 Person Number of Persons The Low-income Measure, after tax, refers to a fixed percentage (50%) of median adjusted after tax income off private households. The household after tax income is adjusted by an equivalence scale to take economies of scale into account. This adjustment for different household sizes reflects the fact that a household's needs increase, but at a decreasing rate, as the number of members increases. Source: Statistics Canada 2016 Census 40
41 Little change in low-income except for seniors that had increase Percent of Persons in Low-income Households (LIM-AT), 2016, Canada % Total and over Age Groups Note: 2015 Low-income Threshold 1 person $22,133 2 persons $31,301 4 persons $44,266 Source: Statistics Canada, 2016 Census 41
42 half of persons in low-income households are aged Persons in Low-income Households (000s) by Age, 2015, Canada Increase in Number of Persons in Low-income Households, 2015, Canada 65 and over % Age ,164 24% 65.2 Age ,349 49% % % Total and Age Groups over Total 4,809,940 4,810 1, , Number of Persons, (000s), 2015 Source: Statistics Canada 2016 Census 42
43 High levels of low-income for lone-parents and persons not in families Percent Prevalence of Low-income Households, 2015, Canada Persons in Economic Families Without children or other relatives With children Male lone-parent Female lone-parent Total Persons +14.2% 8.3 % Persons Not in Economic Families Aged 15 to 29 years Aged 30 to 64 years Aged 65 years and over Total Persons +14.2% Source: Statistics Canada, 2016 Census 43
44 Low-income ranges from 17% in Nova Scotia to 9% in Alberta Percent of Persons in Low-income Households, 2015, Canada % NS NB PEI BC NL MB QC ON Canada SK AB Source: Statistics Canada 2016 Census 44
45 Many more persons in low-income in some provinces Percentage Change in Persons in Low-Income Households, , Canada Ontario 23.7 % Alberta Prince Edward Island British Columbia Canada Manitoba Quebec New Brunswick Nova Scotia Saskatchewan Newfoundland and Labrador Number in Low-Income Households ON 1,899,000 AB 363,900 PE 23,500 BC 695,000 Canada 4,809,900 MB 180,900 QC 1,160,200 NB 123,800 NS 155,000 SK 130,200 NL 78,600 Source: Statistics Canada 2016 Census 45
46 Larger Municipalities with highest low-income rates Percent of Persons in Low-income Households, 2015 and Increase Since 2005 Municipalities of 50,000+ population Windsor 23.3 Montréal 22.7 Saint John 22.5 Richmond 22.4 Burnaby 20.6 Toronto 20.2 Victoria 19.8 Cape Breton 19.7 Moncton 19.6 Fredericton 18.9 Vancouver 18.8 London 18.8 Peterborough 18.7 Trois-Rivières 18.0 Sherbrooke 17.8 Coquitlam 17.7 St. Catharines 17.5 Saint-Jérôme 17.5 Welland 17.5 Nanaimo 17.3 % Absolute Change Windsor 5.5 Montréal -1.2 Saint John 1.7 Richmond 1.3 Burnaby 0.4 Toronto 1.5 Victoria -0.4 Cape Breton -1.6 Moncton 2.0 Fredericton 2.9 Vancouver -1.4 London 4.1 Peterborough 3.9 Trois-Rivières -0.6 Sherbrooke 0.5 Coquitlam 2.1 St. Catharines 3.6 Saint-Jérôme 2.3 Welland 3.9 Nanaimo
47 a CLOSER LOOK AT SENIORS 47
48 Senior s income sources Median Individual Income Persons Aged 65 and Over, 2015, Canada 27,400 Median Amount and Percentage Receiving, 2015,Canada Employment income 6,100 Percent Receiving $ 29.8% 17,900 15,200 Investment income Private retirement income 1,300 14, $ OAS and GIS 6, Total income Market income Government transfers CPP and QPP 7, Source: Statistics Canada 2016 Census 48
49 Differences in male and female incomes Median Individual Income of Persons Aged 65 and Over, 2015$, Canada Male Female Percentage Increase in Median Individual Income of Persons Aged 65 and Over, , Canada Male Female $ 34,600 37,600 22,800 23,800 30,400 22,200 % and over and over Age Groups 65 and over and over Age Groups Source: Statistics Canada 2016 Census 49
50 Similar increase for couples and those living alone Median Income for Persons Aged 65 and Over, 2015$, Canada Percentage Increase in Median Income for Persons Aged 65 and Over, , Canada 62, $ 28,400 % Couple income* Living alone income Couple income** Living alone income * At least one person is 65 or over ** Couples value is estimated Source: Statistics Canada 2016 Census 50
51 Increases in low-income for both family types Percent of Seniors in Low Income Households, 2015$, Canada Number of Seniors in Low Income Households, 2015, Canada % 26.2 Count 790, , , , , ,700 Total In economic family Not in economic family Total In economic family Not in economic family 65% 85% 55% Percentage increase Source: Statistics Canada 2016 Census 51
52 Low-incomes higher for females but increases higher for males Percent of Seniors in Low Income Households, 2005 and 2015, Canada Number of Seniors in Low Income Households, 2015, Canada % Count , , , , , ,000 M F M F M F 65 and over and over Age Groups Male Female Male Female Male Female 65 and over and over Percentage increase Source: Statistics Canada 2016 Census 52
53 Contributions to savings programs 53
54 Two thirds of households save in one of the three programs Percent of Households Contributing to RRSP, RPP, and TFSA, 2015, Canada Any of % Median Contribution $8,100 Any of 3 RRSP RPP TFSA $3,800 RRSP $4,200 RPP $5,800 TFSA All
55 Young and old contribute less except for TFSA Percent of Households Contributing to RRSP, RPP, and TFSA, 2015, Canada 80% 70% 60% 50% 40% 30% 20% 10% 0% Any TFSA RRSP RPP or older Age Groups 55
56 Contribution rates increase with income Percent of Households Contributing - RRSP, RPP, and TFSA, 2015, Canada 100% 90% 80% 70% 60% 50% 40% 30% 20% 10% 0% Under $10K $10K - $19K $20K - $29K $30K - $39K $40K - $49K $50K - $59K $60K - $69K $70K - $79K $80K - $89K $90K - $99K $100K - $149K $150K - $199K $200K - $249K Any RRSP TFSA RPP $250K 56
57 Summary Median household income of $77,000 up by 10.8 percent over a decade Changes in income reflect impact of boom in resources and decline of manufacturing over the decade (recent downturn in resources not much reflected) Still a wide gap between male and female individual income but higher income increases for females Little change in low-income levels overall but rates up for seniors Two-thirds of Canadian households contribute to one of three registered savings programs 57


58 What s still to come 58
59 Future Census Releases October 25, 2017 Immigration and ethnocultural diversity Housing Aboriginal peoples November 29, 2017 Education Labour Journey to work Language of work Mobility and migration 59


60 What s Ahead for Environics Analytics DemoStats 2017 DemoStats released Based on 2011 Census geography Based on 2011 Census 2018 DemoStats released at end of March Shift to 2016 Census geography Still based on 2011 Census, but will incorporate some trends from DemoStats released at end of March Built with 2016 Census-based estimates adjusted for 2016 coverage Update to PRIZM5 based on 2016 Census and other data 60

61 2016 Census: Income Questions Dr. Doug Norris Senior Vice President and Chief Demographer
Metropolitan Gross Domestic Product: Experimental Estimates, 2001 to 2009
 Catalogue no. 11-626-X No. 042 ISSN 1927-503X ISBN 978-1-100-25208-7 Economic Insights Metropolitan Gross Domestic Product: Experimental Estimates, 2001 to 2009 by Mark Brown and Luke Rispoli Release date:
Saskatchewan Labour Force Statistics
 Saskatchewan Labour Force Statistics April 2017 UNADJUSTED DATA According to the Statistics Canada Labour Force Survey during the week covering April 9 th to 15 th,, 2017, there were 560,100 persons employed
Labour Market Information Monthly
 Canada's population estimates: Subprovincial areas, July 1, 2014 On July 1, 2014, almost 7 in 10 Canadians, or 24,858,600 people, were living in a census metropolitan area (CMA). In turn, more than one
Post-Secondary Education, Training and Labour Prepared November New Brunswick Minimum Wage Report
 Post-Secondary Education, Training and Labour Prepared November 2018 2018 New Brunswick Minimum Wage Report Contents Section 1 Minimum Wage Rates in New Brunswick... 2 1.1 Recent History of Minimum Wage
Does Money Matter? Determining the Happiness of Canadians
 Does Money Matter? Determining the Happiness of Canadians Andrew Sharpe Executive Director, Centre for the Study of Living Standards CSLS-ICP Conference on the Implications of Happiness Research for Public
MEASURING IMPACT ACROSS VIBRANT COMMUNITIES CANADA S CITIES REDUCING POVERTY NETWORK
 THE CANADIAN COUNCIL ON SOCIAL DEVELOPMENT COMMUNITY DATA PROGRAM MEASURING IMPACT ACROSS VIBRANT COMMUNITIES CANADA S CITIES REDUCING POVERTY NETWORK PRESENTATION AT TAMARACK S NATIONAL POVERTY SUMMIT
Post-Secondary Education, Training and Labour Prepared May New Brunswick Minimum Wage Report
 Post-Secondary Education, Training and Labour Prepared May 2018 2018 New Brunswick Minimum Wage Report Contents Section 1 Minimum Wage Rates in New Brunswick... 2 1.1 Recent History of Minimum Wage in
Consumer Price Index. Highlights. Manitoba third highest among provinces. Consumer Price Index (CPI), Manitoba and Canada, December 2018
, Manitoba and Canada, December 2018") MBS Reports C o n s u m e r P r i c e I n d e x, D e c e m b e r 2 0 1 8 1 Consumer Price Index D e c e m b e r 2 0 1 8 Highlights The Manitoba all-items Consumer Price Index (CPI) increased 2.1% on a
MBS Reports C o n s u m e r P r i c e I n d e x, D e c e m b e r 2 0 1 8 1 Consumer Price Index D e c e m b e r 2 0 1 8 Highlights The Manitoba all-items Consumer Price Index (CPI) increased 2.1% on a
Consumer Price Index report
 MBS Reports C o n s u m e r P r i c e I n d e x R e p o r t, J u n e 2 0 1 8 1 Consumer Price Index report J u n e 2 0 1 8 Highlights The Manitoba all-items Consumer Price Index (CPI) rose 2.7% on a year-over-year
Consumer Price Index. Highlights. Manitoba second highest among provinces. MBS Reports C o n s u m e r P r i c e I n d e x, M a r c h
 MBS Reports C o n s u m e r P r i c e I n d e x, M a r c h 2 0 1 9 1 Consumer Price Index M a r c h 2 0 1 9 Highlights The Manitoba all-items Consumer Price Index (CPI) increased 2.3% on a year-overyear
Consumer Price Index. Highlights. Manitoba third highest among provinces. Consumer Price Index (CPI), Manitoba and Canada, September 2018
, Manitoba and Canada, September 2018") MBS Reports C o n s u m e r P r i c e I n d e x, S e p t e m b e r 2 0 1 8 1 Consumer Price Index S e p t e m b e r 2 0 1 8 Highlights The Manitoba all-items Consumer Price Index (CPI) increased 2.4% on
MBS Reports C o n s u m e r P r i c e I n d e x, S e p t e m b e r 2 0 1 8 1 Consumer Price Index S e p t e m b e r 2 0 1 8 Highlights The Manitoba all-items Consumer Price Index (CPI) increased 2.4% on
Consumer Price Index. Highlights. Manitoba fourth highest among provinces. Consumer Price Index (CPI), Manitoba and Canada, November 2018
, Manitoba and Canada, November 2018") MBS Reports C o n s u m e r P r i c e I n d e x, N o v e m b e r 2 0 1 8 1 Consumer Price Index N o v e m b e r 2 0 1 8 Highlights The Manitoba all-items Consumer Price Index (CPI) increased 1.7% on a
MBS Reports C o n s u m e r P r i c e I n d e x, N o v e m b e r 2 0 1 8 1 Consumer Price Index N o v e m b e r 2 0 1 8 Highlights The Manitoba all-items Consumer Price Index (CPI) increased 1.7% on a
2016 Census of Canada
 216 Census of Canada Incomes Results from the latest Census release show that Alberta had the highest median income among the provinces. Alberta s strong economic expansion in recent years, particularly
Valerie Tarasuk Andy Mitchell Naomi Dachner. PROOF Research to identify policy options to reduce food insecurity
 PROOF Research to identify policy options to reduce food Valerie Tarasuk Andy Mitchell Naomi Dachner HOUSEHOLD FOOD INSECURITY IN CANADA, 2012 Household Food Insecurity in Canada, 2012 Valerie Tarasuk
Consumer Price Index report
 MBS Reports C o n s u m e r P r i c e I n d e x R e p o r t, J u l y 2 0 1 8 1 Consumer Price Index report J u l y 2 0 1 8 Highlights The Manitoba all-items Consumer Price Index (CPI) increased 3.3% on
Post-Secondary Education, Training and Labour August New Brunswick Minimum Wage Factsheet 2017
 Post-Secondary Education, Training and Labour August 2017 New Brunswick Minimum Wage Factsheet 2017 Contents PART 1 - Minimum Wage Rates in New Brunswick... 3 1.1 Recent History of Minimum Wage in New
Consumer Price Index. Highlights. Manitoba second highest among provinces. Consumer Price Index (CPI), Manitoba and Canada, February 2019
, Manitoba and Canada, February 2019") MBS Reports C o n s u m e r P r i c e I n d e x, F e b r u a r y 2 0 1 9 1 Consumer Price Index F e b r u a r y 2 0 1 9 Highlights The Manitoba all-items Consumer Price Index (CPI) increased % on a year-overyear
MBS Reports C o n s u m e r P r i c e I n d e x, F e b r u a r y 2 0 1 9 1 Consumer Price Index F e b r u a r y 2 0 1 9 Highlights The Manitoba all-items Consumer Price Index (CPI) increased % on a year-overyear
CONSUMER PRICE INDEX REPORT OCTOBER 2017
 CONSUMER PRICE INDEX REPORT OCTOBER 2017 M A N I T O B A B U R E A U O F S T A T I S T I C S RIGHT ANSWERS RIGHT NOW November 17, 2017 CONTENTS SUMMARY CHART 1 - ANNUAL INFLATION RATE: MANITOBA AND CANADA
PROOF FOOD INSECURITY POLICY RESEARCH. Valerie Tarasuk Andy Mitchell Naomi Dachner
 2014 PROOF Valerie Tarasuk Andy Mitchell Naomi Dachner HOUSEHOLD IN CANADA, 2014 Household Food Insecurity in Canada, 2014 Valerie Tarasuk Andy Mitchell Naomi Dachner Acknowledgments: This report is a
Low Income Lines,
 Catalogue no. 75F0002M No. 003 ISSN 1707-2840 ISBN 978-1-100-25347-3 Income Research Paper Series Low Income Lines, 2012-2013 by Income Statistics Division Release date: December 10, 2014 How to obtain
Low Income Lines,
 Catalogue no. 75F0002M No. 002 ISSN 1707-2840 ISBN 978-1-100-20844-2 Research Paper Income Research Paper Series Low Income Lines, 2010 2011 Income Statistics Division Jean Talon Building, 170 Tunney's
CONSUMER PRICE INDEX REPORT NOVEMBER 2017
 CONSUMER PRICE INDEX REPORT NOVEMBER 2017 M A N I T O B A B U R E A U O F S T A T I S T I C S RIGHT ANSWERS RIGHT NOW December 21, 2017 CONTENTS SUMMARY CHART 1 - ANNUAL INFLATION RATE: MANITOBA AND CANADA
Low Income in Canada: Using the Market Basket Measure
 Low Income in Canada: 2000-2004 Using the Market Basket Measure Human Resources and Social Development Canada SP-682-10-07E PDF ISBN: 978-0-662-47054-0 Catalogue No.: HS28-49/2004E-PDF Table of Contents
Demographic Trends: The 2mes they are a changin Highlights from the 2011 Census and Na2onal Household Survey
 Demographic Trends: The 2mes they are a changin Highlights from the 2011 Census and Na2onal Household Survey Dr. Doug Norris Senior Vice- President and Chief Demographer Presented to MRIA O/awa Chapter
Estimate Request for Canada Pension Plan Retirement Pension and Post-Retirement Benefit
 Estimate Request for Pension Plan Retirement Pension and Post-Retirement Benefit You may also visit the website at servicecanada.gc.ca/calculator to use the online retirement calculator to estimate your
RECIPROCAL TRANSFER AGREEMENT WITH TEACHERS PENSION PLAN AUTHORITIES
 RECIPROCAL TRANSFER AGREEMENT WITH This information sheet provides information as to whether you may be eligible to transfer a benefit under the terms of the Reciprocal Transfer Agreement between the Teachers
Application for a Canada Pension Plan Death Benefit
 Service Canada Personal Information Bank ESDC PPU 146 Application for a Canada Pension Plan Death Benefit It is very important that you: - send in this form with supporting documents (see the information
2017 Alberta Labour Force Profiles Youth
 2017 Alberta Labour Force Profiles Youth Highlights Population Statistics Labour Force Statistics 4 th highest proportion of youth in the working age population 1. 16.3% MB 2. 15.3% ON 2. 15.2% SK 4. 14.9%
Mackenzie's Canadian Federal / Provincial Marginal Tax Rates
 Mackenzie's Federal / Provincial Marginal Tax Rates Current as of: July 1, 2012 Quick Links by Province AB NS QC BC NT SK MB NU YT NB ON NL PE How To Use These Tables: Marginal Tax Rates calculate the
1 in 6 people.* 5.8 million people in Canada live in poverty That is16.8% or
 5.8 million people in Canada live in poverty That is16.8% or 1 in 6 people.* Canada has its first national poverty reduction strategy Opportunity for All. 1 The strategy sets targets to reduce poverty
2012 Annual Alberta Labour Market Review
 2012 Annual Alberta Labour Market Review Employment. Unemployment. Economic Regions. Migration Aboriginal People. Industries. Occupations. Education. Demographics Employment Alberta has the highest employment
Alberta Labour Force Profiles
 Alberta Labour Force Profiles 2011 Highlights For the purpose of this profile, youth are defined as persons aged 15 to 24 years. 1. Alberta Population Statistics Among the provinces, Alberta had the third
Canadians Are Happy and Getting Happier: An Overview of Life Satisfaction in Canada,
 September 2012 0 151 Slater Street, Suite 710 Ottawa, Ontario K1P 5H3 613-233-8891, Fax 613-233-8250 csls@csls.ca Centre for the Study of Living Standards Canadians Are Happy and Getting Happier: An Overview
BC CAMPAIGN 2000 WHAT IS CHILD POVERTY? FACT SHEET #1 November 24, 2005
 WHAT IS CHILD POVERTY? FACT SHEET #1 Poverty in Canada is measured by using Statistics Canada's Low Income Cut-Offs (LICOs). The cut-offs are based on the concept that people in poverty live in "straitened
CENSUS BULLETIN #4. September 13 th, Income. Bulletin Highlights: The median total income of households in Brampton was $87,290 in 2015.
 CENSUS BULLETIN #4 Income September 13 th, 2017 Bulletin Highlights: The median total income of households in Brampton was $87,290 in 2015. The median total income of households (private households) in
2016 Alberta Labour Force Profiles Women
 2016 Alberta Labour Force Profiles Alberta s Highlights Population Statistics Labour Force Statistics lowest percentage of women in the working age population 1. 51.7% NS 2. 51.5% PEI 9. 49.6% SK 10. 49.3%
How it works. for Newfoundland & Labrador. Labour s Plan for an improved Canada Pension Plan. Get the job done! canadianlabour.ca
 Labour s Plan for an improved Canada Pension Plan How it works for Newfoundland & Labrador RETIREMENT R SECURITY for everyone canadianlabour.ca Labour s plan for retirement security: DOUBLE CANADA PENSION
POVERTY PROFILE UPDATE FOR
 POVERTY PROFILE UPDATE FOR 1991 National Council of Welfare Jeanne Mance Building OTTAWA K1A 0K9 613 957-2961 Winter 1993 POVERTY IN CANADA IN 1991 The pages that follow contain selected poverty statistics
Alberta Minimum Wage Profile April March 2018
 Alberta Minimum Wage Profile April 2017 - March 2018 Introduction The Alberta Minimum Wage Profile presents current information on persons whose average hourly earnings 1 are at or below minimum in Alberta
New Brunswick Analysis 2016 Census Topic: Income
 2016 Census Topic: Income Post-Secondary Education, Training and Labour January 2018 Contents General Information... 2 Section 1 Household Income... 2 1.1 Household Income National Context... 2 1.2 Household
Overview of Social & Economic Trends
 Overview of Social & Economic Trends 2 Objectives Provide an overview on what s happening in the external environment Relate this information to DCS and its programs Get feedback regarding your information
Yukon Bureau of Statistics
 Yukon Bureau of Statistics 2 9 # $ > 0-2 + 6 & ± 8 < 3 π 7 5 9 ^ Highlights Income and Housing 20 National Household Survey According to the 20 National Household Survey (NHS), the median income in Yukon
Comparing Ontario s Fiscal Position with Other Provinces
 Comparing Ontario s Fiscal Position with Other Provinces Key Points In 2017, the Ontario provincial government received $10,415 in total revenue per person 1, the lowest in the country. Despite the lowest
Highlights. For the purpose of this profile, the population is defined as women 15+ years.
 A L B E R T A L A B O U R F O R C E P R O F I L ES Women 2014 Highlights For the purpose of this profile, the population is defined as women 15+. Working Age Population of Women in Alberta The number of
 Estimated total job losses from 10% minimum wage increase across all provinces Upper Bound 321,300 Lower Bound 92,300 Source: CFIB calculations from Statistic Canada s 2009 Labour Force Survey data. iv
AUGUST THE DUNNING REPORT: DIMENSIONS OF CORE HOUSING NEED IN CANADA Second Edition
 AUGUST 2009 THE DUNNING REPORT: DIMENSIONS OF CORE HOUSING NEED IN Second Edition Table of Contents PAGE Background 2 Summary 3 Trends 1991 to 2006, and Beyond 6 The Dimensions of Core Housing Need 8
Alberta Minimum Wage Profile April March 2017
 Alberta Minimum Wage Profile April 2016 - March 2017 Introduction The Alberta Minimum Wage Profile presents current information on persons whose average hourly earnings 1 are at or below minimum wage in
BC CAMPAIGN FACT SHEETS
 2006 FACT SHEETS Fact Sheet #1 - What is Child Poverty? Fact Sheet #2 - BC Had the Worst Record Three Years in a Row Fact Sheet #3 - Child Poverty over the Years Fact Sheet #4 - Child Poverty by Family
Business Barometer Newfoundland & Labrador
 Newfoundland & Labrador February 18 Optimism among Newfoundland & Labrador's small businesses improved again in February. Its Business Barometer bounced almost points to reach 6.. The other indicators
INSIGHTS WEST Survey on Canadian Travel Behaviour - June 27, 2017
 (Summary Table: Appealing 8-10) Using a 10-point scale where 1 means Not at all appealing and 10 means Very appealing, how appealing do you personally consider the idea of visiting each of the following
CANADIAN MANUFACTURERS & EXPORTERS BUSINESS CONDITIONS SURVEY
 CANADIAN MANUFACTURERS & EXPORTERS BUSINESS CONDITIONS SURVEY August 2009 CME Business Conditions Survey August 2009 CME, in partnership with member associations of the Canadian Manufacturing Coalition,
BC JOBS PLAN ECONOMY BACKGROUNDER. Current statistics show that the BC Jobs Plan is working: The economy is growing and creating jobs.
 We know that uncertainty continues to remain in the global economy and we expect to see some monthly fluctuations in jobs numbers. That is why we will continue to create an environment that is welcoming
Canada Child Benefit. and related provincial and territorial programs. For the period from July 2017 to June 2018
 Canada Child Benefit and related provincial and territorial programs For the period from July 2017 to June 2018 Our publications and personalized correspondence are available in braille, large print, e-text,
2017 Annual Alberta Labour Market Review
 2017 Annual Alberta Labour Market Review Employment. Unemployment. Economic Regions Migration. Indigenous People. Industries Occupations. Education. Demographics Employment Employment grew by 1. in Alberta
TAX FACTS What s Inside. Quick Estimates. RRSP, RPP and DPSP Limits. Top Personal Rates for CPP, EI and QPIP Rates
 1 Tax Q&A: Tax Planning Strategies for Cottage Owners BDO CURRENT TO OCTOBER 1, 2018 www.bdo.ca TAX FACTS 2018 Tax Facts 2018 provides you with a summary of 2018 personal income tax rates and amounts,
Application for the Old Age Security Pension Under the Old Age Security Program
 Service Canada Application for the Old Age Security Pension 1. 2. Mr. Mrs. Your first name, initial and last name Ms. Miss 3. Name at birth (if different from above) 4. Date of birth () Age established
2010 CSA Survey on Retirement and Investing
 2010 CSA Survey on Retirement and Investing Prepared for: Canadian Securities Administrators Executive Summary September 28, 2010 www.ipsos.ca TABLE OF CONTENTS EXECUTIVE SUMMARY... 1 Key Findings... 1
Investing in Canada s Future. Prosperity: An Economic Opportunity. for Canadian Industries
 Investing in Canada s Future Prosperity: An Economic Opportunity for Canadian Industries PART II of Reconciliation: Growing Canada s Economy by $27.7 B Methods and Sources Paper Prepared for the National
Charlottetown St. John's Halifax Fredericton Québec Toronto Iqaluit Ottawa innipeg W Yelowknife Regina onton Edm hitehorse Victoria
 Yukon Whitehorse! British Columbia! Victoria Northwest Territories! Yellowknife Alberta Edmonton! Saskatchewan Regina! Nunavut Manitoba! Winnipeg Ontario Iqaluit! Newfoundland and Labrador Quebec! St.
2019 New Years Tax Changes
 2019 New Years Tax Changes Jeff Bowes Research Director Canadian Taxpayers Federation 1 Contents About the Canadian Taxpayers Federation... 3 Summary... 4 Taxpayers Examples... 5 Tax Rates... 5 Total Tax...
Catalogue no XIE. Income in Canada
 Catalogue no. 75-202-XIE Income in Canada 2005 How to obtain more information Specific inquiries about this product and related statistics or services should be directed to: Income in Canada, Statistics
2. Full-time staffing intentions, next 3 months 3. General state of business health. 20 Bad 5 10 Down
 Newfoundland & Labrador April Newfoundland & Labrador's small businesses are seeing a weaker outlook in April. The Business Barometer lost another 2 points to reach.8. Full-time short-term staffing intentions
Income, pensions, spending and wealth
 CHAPTER 18 Income, pensions, spending and wealth After four years of growth, the median after-tax income for Canadian families of two or more people remained virtually stable in 2008 at $63,900. The level
Mortgage solutions that make sense
 Mortgage solutions that make sense Protecting your client s biggest asset PN00035F (2015/04/21) Agenda Review of the Canadian housing market Structuring mortgage solutions for your clients Case study Business
Yukon Bureau of Statistics
 Yukon Bureau of Statistics 2 9 # $ > 0-2 + 6 & ± 8 < 3 π 7 5 9 ^ Highlights: Yukon Statistics 205 Taxation Year There were 28,00 income taxfilers in Yukon in 205, an increase of 400, or.4%, compared to
First Comprehensive Review of the Market Basket Measure of Low Income
 Social Policy First Comprehensive Review of the Market Basket Measure of Low Income Final Report Michael Hatfield, Human Resources and Skills Development Canada Wendy Pyper, Statistics Canada Burton Gustajtis,
2. Full-time staffing intentions, next 3 months 3. General state of business health. * 12-month moving averages. * 12-month moving averages.
 Newfoundland & Labrador March After two months of improved optimism, Newfoundland & Labrador's small businesses have seen a less confident month of March. The Business Barometer lost almost 4 points to
GOVERNMENT BENEFITS UPDATE 2017
 GOVERNMENT BENEFITS UPDATE 2017 Our annual update of the statutory benefits provided by the Federal and Provincial Governments of Canada TRG Group Benefits & Pensions Inc. Suite 800, 1177 West Hastings
Northern Residents Deductions for 2016
 Northern Residents Deductions for 2016 The purpose of this information sheet is to provide you with general information about the northern residents deductions and answer some frequently asked questions.
Electing Under Section 217 of the Income Tax Act
 Is this pamphlet for you? Electing Under Section 217 of the Income Tax Act This pamphlet applies to you if: you were a non-resident of Canada for all of 2017; and you received any of the types of Canadian-source
MLS Sales vs. Listings (seasonaly adjusted)
") QUARTER 4: Canada Guaranty Housing Market Review OCTOBER - DECEMBER 21 The Canadian economy posted positive indicators of growth in early 21; however, the optimistic sentiment deteriorated in the latter
QUARTER 4: Canada Guaranty Housing Market Review OCTOBER - DECEMBER 21 The Canadian economy posted positive indicators of growth in early 21; however, the optimistic sentiment deteriorated in the latter
IN THE MATTER OF THE SECURITIES ACT, R.S.N.W.T. 1988, ch. S-5, AS AMENDED. IN THE MATTER OF Certain Exemptions for Capital Accumulation Plans
 IN THE MATTER OF THE SECURITIES ACT, R.S.N.W.T. 1988, ch. S-5, AS AMENDED - and - IN THE MATTER OF Certain Exemptions for Capital Accumulation Plans BLANKET ORDER NO. 6 WHEREAS the Joint Forum of Financial
GOVERNMENT BENEFITS UPDATE 2018
 GOVERNMENT BENEFITS UPDATE 2018 Our annual update of the statutory benefits provided by the Federal and Provincial Governments of Canada TRG Group Benefits & Pensions Inc. Suite 800, 1177 West Hastings
Charlottetown St. John's Halifax Fredericton Québec Toronto Iqaluit Ottawa innipeg W Yelowknife Regina onton Edm hitehorse Victoria
 Yukon Whitehorse! British Columbia! Victoria Northwest Territories! Yellowknife Alberta Edmonton! Saskatchewan Regina! Nunavut Manitoba! Winnipeg Ontario Iqaluit! Newfoundland and Labrador Quebec! St.
ALBERTA FORECAST HOW LONG WILL IT LAST?
 ALBERTA FORECAST HOW LONG WILL IT LAST? FOCUSED ON THE WEST British Columbia Corporate tax rate lowered to 12% Rich resource sector 2010 Olympics construction boom 2006 GDP +4.0% (fcst) Alberta Only debt-free
Federal and Provincial/Territorial Tax Rates for Income Earned
 by a CCPC Effective January 1, 2015 and 2016 by a CCPC Effective January 1, 2015 1 Federal rates General corporate rate 38.0% 38.0% 38.0% Federal abatement (10.0) (10.0) (10.0) 28.0 28.0 28.0 business
What s Hot & What s Not
 What s Hot & What s Not Warren Jestin SVP & Chief Economist Vancouver Real Estate Forum April 25, 27 The Economic Landscape is Shifting Global Growth Moves East 11 1 9 8 7 6 5 4 3 2 1 annual average %
Form F2 Change or Surrender of Individual Categories (section 2.2(2), 2.4, 2.6(2) or 4.1(4))
, 2.4, 2.6(2) or 4.1(4))") Form 33-109F2 Change or Surrender of Individual Categories (section 2.2(2), 2.4, 2.6(2) or 4.1(4)) GENERAL INSTRUCTIONS Complete and submit this form to notify the relevant regulator(s) or, in Québec,
Form 33-109F2 Change or Surrender of Individual Categories (section 2.2(2), 2.4, 2.6(2) or 4.1(4)) GENERAL INSTRUCTIONS Complete and submit this form to notify the relevant regulator(s) or, in Québec,
EDUCATION SPENDING in Public Schools in Canada
 EDUCATION SPENDING in Public Schools in Canada 2019 Edition Angela MacLeod and Joel Emes Contents Executive summary / iii Introduction / 1 Education spending and public student enrolment / 2 Understanding
Payments in Lieu of Taxes
 Real Property Institute of Canada November 6, 2013 Why are there? Under Section 125 of the Constitution Act, 1867, the property of the Government of Canada is exempt from taxation. Since 1950, the Government
CANTAX T1Plus 2007 versions December 2007
 CANTAX T1Plus 2007 versions December 2007 Introduction This tax changes summary was prepared to allow you to evaluate the impact of the tax changes on your tax season. This document takes into account
National Sector Results. First Quarter 2018
 National Sector Results First Quarter 2018 National Sector Results First Quarter 2018 Canadian credit unions posted strong financial results in first quarter of 2018, enjoying another quarter of healthy
Appendix A Jurisdiction-Specific Requirements General Insurance Agents And Brokers
 Appendix A Jurisdiction-Specific Requirements General Insurance Agents And Brokers Documents to be attached to Application: Non-residents must attach a Certificate of Authority from their home jurisdiction
2008 ANNUAL ALBERTA LABOUR MARKET REVIEW
 ANNUAL ALBERTA LABOUR MARKET REVIEW employment unemployment economic regions migration aboriginal people industries occupations education demographics Employment and Immigration EMPLOYMENT Employment increased
Tax Toolkit TAX PLANNING
 2017-2018 Tax Toolkit TAX PLANNING More opportunities for tax savings Contents More opportunities for tax savings 2 Jamie Golombek s tax tips 3 Not all fund distributions are created equal 4 Understanding
Child Poverty and the Child Care Solution
 Child Poverty and the Child Care Solution Presentation by Adrienne Montani, Provincial Coordinator First Call: BC Child and Youth Advocacy Coalition To CUPE Child Care Forum November 24, 2009 Child Poverty
Alberta Self-Employment Profile
 Alberta Self-Employment Profile 2016 Overview Self-employment represents the entrepreneurial spirit of Alberta. This spirit is at the heart of Alberta s vibrant economy. By creating employment, producing
Ontario is the second worst economy in Canada for younger generations
 Ontario is the second worst economy in Canada for younger generations Dr. Paul Kershaw, University of B.C. The growing gap between earnings and home prices in Ontario $600K $500K +$311,000 since 1976 Average
National Sector Results. Fourth Quarter 2018
 National Sector Results Fourth Quarter 2018 National Sector Results Fourth Quarter 2018 Canadian credit unions ended 2018 with solid growth and a strong balance sheet. assets at Canadian Credit Union Association
Household Food Insecurity in Canada: Time for Action!
 Household Food Insecurity in Canada: Time for Action! McGill Conference on Global Food Security October 29, 2014 Naomi Dachner PROOF Research Manager Department of Nutritional Sciences University of Toronto
Sprott Flow-Through Limited Partnerships
 Sprott Tax-Assisted Investments Sprott Flow-Through Limited Partnerships Natural resources an essential element of a wellstructured investment portfolio Adding natural resource investments to your portfolio
National System Results. Fourth Quarter 2016
 National System Results Fourth Quarter 2016 National System Results Fourth Quarter 2016 Canadian credit unions ended 2016 with solid growth and a strong balance sheet. Canadian Credit Union Association
2013 Payroll Guide. This is how we work.
 2013 Payroll Guide This is how we work. 2013 Calendar and Important Dates January February March April S M T W T F S S M T W T F S S M T W T F S S M T W T F S 1 2 3 4 5 1 2 1 2 1 2 3 4 5 6 6 7 8 9 10 11
Northern Residents Deductions for 2017
 Northern Residents Deductions for 2017 The purpose of this information sheet is to provide you with general information about the northern residents deductions and answer some frequently asked questions.
Individual Taxation Tax Planning Guide
 Taxable Income TABLE I1 ONTARIO (2014) TAX TABLE Tax Effective Marginal Rate Federal Ontario Total Rate Federal Ontario Total $ $ $ $ 10,000-17 17 0.2 0.0 5.0 5.0 11,000-67 67 0.6 12.9 5.1 18.0 12,000
Provincial and National Employment, Alberta and Canada Employment Rates 1, % 62.7% 62.7% 63.0% 63.5%
 Employment ALBERTA S HOT ECONOMY CONTINUES TO PRODUCE HIGH EMPLOYMENT GROWTH IN 2007 The number of employed Albertans in 2007 increased by 88,775, higher than the 2006 growth of 86,240. The economy also
Regional Intensity Index Average number of items exchanged per person by Region
 The Kijiji 2018 Second-Hand Economy Index Report surveyed Canadians across the country about their involvement in the second-hand economy; including second-hand purchases, sales, trades, donations, and
August 2015 Aboriginal Population Off-Reserve Package
 Labour Force Statistics Aboriginal Population Off-Reserve Package Package Includes: - Information for all Aboriginal people, First Nations and Métis - Working age population, labour force, employment,
October 2016 Aboriginal Population Off-Reserve Package
 Labour Force Statistics Aboriginal Population Off-Reserve Package Package Includes: - Information for all Aboriginal people, First Nations and Métis - Working age population, labour force, employment,
How Investment Income is Taxed
 B M O N E S B I T T B U R N S How Investment Income is Taxed When it comes to investment income, all is not equal after tax. Knowing how tax rules affect your investments is essential in order to maximize