Public Meeting of the Mayors Council (Items 2, 3 and 4)
|
|
|
- Marvin Shelton
- 5 years ago
- Views:
Transcription

 February")
1 TransLink Room 427/428 Public Meeting of the Mayors Council (Items 2, 3 and 4) February 15, 2018
2 2 Item 2: Report of the Finance Committee Next Steps on the Phase Two Plan

3 Item 2 3 3
4 Investment Plan Item 2 Phase Two Plan of the 10-Year Vision Working timeline for plan approval Sep Oct Nov Dec Jan Feb Mar Apr May Jun July Aug Sep Rapid Transit Draft business cases submitted Revised draft business cases submitted Finalize rail, bus, HD, MRN Confirm senior government and regional funding Regional Funding Agreement with Province Financial analysis Project Partnership Agreement development Engagement workshops Public consultation Municipal updates Document development TransLink Board and Mayors Council Approval MLBE and SNG Rapid Transit Projects launch Major Rapid Transit Project Procurement/Pre-construction
5 Item 2 Next Steps on the Phase Two Plan Timeline and approval realities Phase Two Plan cannot be approved until new revenues confirmed for 100% of all costs of the plan. We have confirmed 85% of funding required, but until we get to 100%, we cannot proceed further. If the Phase Two Plan is not approved by July, inflationary cost delays of ~$10M/month begin. Approval process takes 3 months. Need funding agreement on remaining 15% ( regional funding gap ) in March to stay on track.
 Funded $130M/year Regional Funding Gap $60-70M/year Federal (up to 40% of capital of MLBE, SNG, SkyTrain upgrade) 15% of total Phase Two funding")
6 Item 2 Next Steps on the Phase Two Plan Regional Funding Gap Total Phase Two Plan funding required TransLink share of Phase Two Plan Provincial (40% of capital of all projects) TransLink (30% capital + 100% operating) Funded $130M/year Regional Funding Gap $60-70M/year Federal (up to 40% of capital of MLBE, SNG, SkyTrain upgrade) 15% of total Phase Two funding needed 6
7 Item 2 Next Steps on the Phase Two Plan TransLink s contributions TransLink revenues confirmed/invested to date: Phase One Plan: Phase Two Plan: Phase 1+2 Plans: 71% of Phase Plan One 21% of Phase Two (increased fare revenues, property sales, internal savings) 33% from TransLink sources Plus ongoing base funding for TransLink from fares, property taxes, other own-source revenues. Funding Gap: 15% of Phase Two If all of Funding Gap is paid by TransLink, regional share for Phase 1+2 would be 45%.
8 Item 2 Next Steps on the Phase Two Plan Work plan to stay on schedule 1. March: Agreement on closing the regional funding gap. 2. March: Finalize scope of Phase Two bus expansion 3. April: Approve Draft Phase Two Investment Plan 4. April/May: Public Consultation on Draft Phase Two Plan. 5. June/July: Approve Final Phase Two Investment Plan. 6. July: Phase Two Plan implementation begins 8
9 Item 2 Next Steps on the Phase Two Plan Alternatives 1. Reduce scope of Phase Two Plan 2. Stretch out 10-Year Vision over >10 years 3. Delay Phase Two Plan until 2019 or later 9
10 Item 3: TransLink Management Report 10
11 Item 3 11 TransLink Management Report ridership report 3.2 Progress Report on Phase One Plan Implementation

12 Record Ridership 2017 Record Ridership Boardings: 5.7% Journeys: 5.8% 407 million boardings Boardings by mode in 2017 Bus: 247 million Expo/Millennium: 105 million Canada Line: 46 million West Coast Express: 2.32 million SeaBus: 5.84 million
13 Record Ridership Ridership trend in Canada and U.S., YTD, 3 rd quarter 2017 City (Transit Agency) Change +(-) Vancouver (TransLink) 6.1% Montreal (STM) 1.91% Toronto (TTC) -0.62% New York City (MTA) -2.73% Boston (MBTA) -3.17% Washington, DC (WMATA) -3.59% Chicago (CTA) -3.81% Los Angeles (MTA) -5.24% Philadelphia (SEPTA) -5.30% Agencies with over 1 million Average Weekday Boardings, reported by APTA, Third Quarter, 2017

14 Phase One transit improvements for 2017

15 Phase One improvements for 2018 and 2019 Notes: Additional improvements for 2018 that are no/low-cost may be identified with available unallocated expansion hours.
16 Item 4: Public Delegates 16
17 Item 4 Public Delegates 1. Laura Jane, HUB Cycling 2. Jeneen Sutherland and Carol Sartor, North Shore Safe Route Advocates 3. Ray Mcdonald, North Vancouver 4. Dr. Lisa Mu, Vancouver 5. Tom Green, David Suzuki Foundation 17

18
19
20

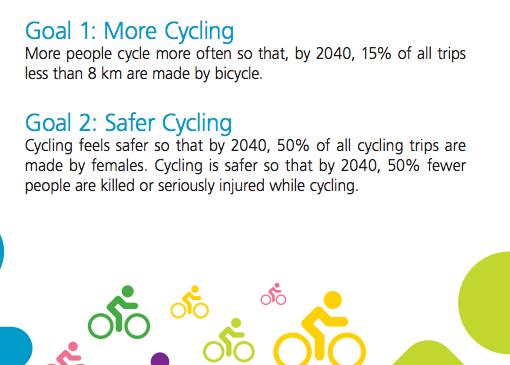
21 Source: Cycling for Everyone: A Regional Cycling Strategy for Metro Vancouver. TransLink, 2011.


22

23
Better Transit and Transportation for a Better British Columbia
 Better Transit and Transportation for a Better British Columbia PRE-BUDGET SUBMISSION TO THE SELECT STANDING COMMITTEE ON FINANCE AND GOVERNMENT SERVICES MAYORS COUNCIL ON REGIONAL TRANSPORTATION OCTOBER
INSIGHTS WEST Survey on the Transportation and Transit Referendum in Metro Vancouver - December 15, 2014
 Survey on the Transportation and Transit Referendum in Vancouver - December 15, 2014 Have you heard of the Transportation and Transit Referendum, which is scheduled to take place in the Lower Mainland
Cash & Liquidity The chart below highlights CTA s cash position at March 2017 compared to March 2016.
 To: Chicago Transit Authority Board From: Jeremy Fine, Chief Financial Officer Re: Financial Results for March 2017 Date: May 10, 2017 I. Summary CTA s financial results are $0.6 million favorable to budget
Cash & Liquidity The chart below highlights CTA s cash position at December 2017 compared to December 2016.
 To: Chicago Transit Authority Board From: Jeremy Fine, Chief Financial Officer Re: Financial Results for December 2017 Date: February 14, 2018 I. Summary CTA s financial results are $4.7 million favorable
Cash & Liquidity The chart below highlights CTA s cash position at September 2017 compared to September 2016.
 To: Chicago Transit Authority Board From: Jeremy Fine, Chief Financial Officer Re: Financial Results for September 2017 Date: November 15, 2017 I. Summary CTA s financial results are $7.7 million favorable
INSIGHTS WEST Survey on the Metro Vancouver Transportation and Transit Plebiscite - January 20, 2014
 Survey on the Vancouver Transportation and Transit Plebiscite - January 20, 2014 Have you heard of the Vancouver Transportation & Transit Plebiscite, which is scheduled to take place in the Lower Mainland
Cash & Liquidity The chart below highlights CTA s cash position at July 2016 compared to July 2015.
 To: Chicago Transit Authority Board From: Jeremy Fine, Chief Financial Officer Re: Financial Results for July 2016 Date: September 14, 2016 I. Summary CTA s financial results are $0.4 million favorable
The year to date is less than budget and prior year by 15.4 million and 11.6 million, respectively.
 To: Chicago Transit Authority Board From: Jeremy Fine, Chief Financial Officer Re: Financial Results for September 2016 Date: November 16, 2016 I. Summary CTA s financial results are $0.3 million unfavorable
Cash & Liquidity The chart below highlights CTA s cash position at March 2018 compared to March 2017.
 To: Chicago Transit Authority Board From: Jeremy Fine, Chief Financial Officer Re: Financial Results for March 2018 Date: May 9, 2018 I. Summary CTA s financial results are $0.9 million favorable to budget
Cash & Liquidity The chart below highlights CTA s cash position at January 2018 compared to January 2017.
 To: Chicago Transit Authority Board From: Jeremy Fine, Chief Financial Officer Re: Financial Results for January 2018 Date: March 14, 2018 I. Summary CTA s financial results are $1.7 million unfavorable
CTA 2007 Contingency Plan
 CTA 2007 Contingency Plan JUST THE FACTS RTA Directive Unless the RTA Board makes a determination no later than July 1, 2007, that the funds identified as new transit funding are available for 2007 such
Cash & Liquidity The chart below highlights CTA s cash position at June 2018 compared to June 2017.
 To: Chicago Transit Authority Board From: Jeremy Fine, Chief Financial Officer Re: Financial Results for June 2018 Date: August 15, 2018 I. Summary CTA s financial results are unfavorable to budget for
The Brookings Institution Center on Urban and Metropolitan Policy Robert Puentes, Senior Research Manager
 The Brookings Institution Center on Urban and Metropolitan Policy Robert Puentes, Senior Research Manager Washington s Metro: Deficits by Design Presentation to the WMATA Board Committee June 3, 2004 Washington
PRESENTATION TITLE TRANSLINK ASSET MANAGEMENT PROJECT. Title sub text if required. Vikki Kwan, TransLink
 TRANSLINK ASSET MANAGEMENT PROJECT Vikki Kwan, TransLink vikki.kwan@translink.ca Chris Lombard, AECOM christiaan.lombard@aecom.com May 6 th, 2013 Agenda Introduction to TransLink Title Study sub text Background
1ST QUARTER May 2018
 1ST QUARTER 2018 May 2018 0 1 st Quarter 2018 Financial and Performance Report Table of Contents Executive Summary... 2 Environmental Factors... 4 Ridership... 6 Peer Ridership Comparison... 7 Operating
Cash & Liquidity The chart below highlights CTA s cash position at August 2018 compared to August 2017.
 To: Chicago Transit Authority Board From: Jeremy Fine, Chief Financial Officer Re: Financial Results for August 2018 Date: October 10, 2018 I. Summary CTA s financial results are favorable to budget for
2 ND QUARTER 2017 QUARTERLY FINANCIAL AND PERFORMANCE REPORT
 2 ND QUARTER 2017 QUARTERLY FINANCIAL AND PERFORMANCE REPORT August 2017 0 2 nd Quarter 2017 Financial and Performance Report Table of Contents Executive Summary... 2 Environmental Factors... 4 Ridership...
Financial Report - FY 2017 Year to Date May 31, 2017
 Financial Report - FY 2017 Year to Date July 19, 2017 1 Major Highlights Revenue Sales tax remittances received through YTD April 2017 are 4.2% higher than YTD April 2016 Plaza Saltillo lease income budgeted
Update to Phase One 2017 Investment Plan. Regional Planning Committee July 14, 2017 DRAFT FOR DISCUSSION
 Update to Phase One 2017 Investment Plan Regional Planning Committee July 14, 2017 DRAFT FOR DISCUSSION SkyTrain Vehicles 2 Phase 1 Fleet Expansion called for 28 cars to provide sufficient capacity for
Cash & Liquidity The chart below highlights CTA s cash position at February 2017 compared to February 2016.
 To: Chicago Transit Authority Board From: Jeremy Fine, Chief Financial Officer Re: Financial Results for February 2017 Date: April 5, 2017 I. Summary CTA s financial results are $0.3 million favorable
3 RD QUARTER 2016 QUARTERLY FINANCIAL AND PERFORMANCE REPORT
 3 RD QUARTER 2016 QUARTERLY FINANCIAL AND PERFORMANCE REPORT November 2016 0 3 rd Quarter 2016 Financial and Performance Report Table of Contents Executive Summary... 1 Environmental Factors... 3 Ridership...
Operating Budget Stability
 Operating Budget Stability March Financial Update Report to Agenda Executive Summary March Performance Against FY16 Budget March Performance Against Same Period Last Year Appendix Financial Detail: March
3RD QUARTER November 2018
 3RD QUARTER 2018 November 2018 0 Quarterly Financial and Performance Report 3rd Quarter 2018 3rd Quarter 2018 Financial and Performance Report Table of Contents Executive Summary... 2 Environmental Factors...
Fare Policy. Discussion Document November 23, 2015
 Fare Policy Discussion Document November 23, 2015 Key legislation regarding fare levels 2013 Session Law Chapter 46 SECTION 6A. Set goal of an increase in the farebox recovery ratio of at least 10 per
1 ST QUARTER 2017 QUARTERLY FINANCIAL AND PERFORMANCE REPORT
 1 ST QUARTER 2017 QUARTERLY FINANCIAL AND PERFORMANCE REPORT May 2017 0 1 st Quarter 2017 Financial and Performance Report Table of Contents Executive Summary... 2 Environmental Factors... 4 Ridership...
3 RD QUARTER 2017 QUARTERLY FINANCIAL AND PERFORMANCE REPORT
 3 RD QUARTER 2017 QUARTERLY FINANCIAL AND PERFORMANCE REPORT November 2017 0 3 rd Quarter 2017 Financial and Performance Report Table of Contents Executive Summary... 2 Environmental Factors... 4 Ridership...
4 TH QUARTER 2017 QUARTERLY FINANCIAL AND PERFORMANCE REPORT
 4 TH QUARTER 2017 QUARTERLY FINANCIAL AND PERFORMANCE REPORT February 2018 0 4 th Quarter 2017 Financial and Performance Report Table of Contents Executive Summary... 2 Environmental Factors... 4 Ridership...
FINANCIAL MANAGEMENT STRATEGY REPORT ON OUTCOMES FOR THE YEAR ENDED MARCH 31, 2016
 FINANCIAL MANAGEMENT STRATEGY REPORT ON OUTCOMES FOR THE YEAR ENDED MARCH 31, 2016 Manitoba Finance General Inquiries: Room 109, Legislative Building Winnipeg, Manitoba R3C 0V8 Phone: 204-945-5343 Fax:
PASSENGER REJECTION REDUCTION INITIATIVE KIRK PEREIRA. 24 th April 2018
 PASSENGER REJECTION REDUCTION INITIATIVE KIRK PEREIRA 24 th April 2018 WHAT IS THIS PROJECT ABOUT? Well we are not going into that again this year! Nearly everyone in this room knows about the project
4TH QUARTER 2016 QUARTERLY FINANCIAL AND PERFORMANCE REPORT
 4TH QUARTER 2016 QUARTERLY FINANCIAL AND PERFORMANCE REPORT February 2017 0 Quarterly Financial and Performance Report 4th Quarter 2016 4th Quarter 2016 Financial and Performance Report Table of Contents
Monthly Labour Force Survey Statistics December 2018
 800 Monthly Labour Force Survey Statistics CALGARY CMA Table 282-0135 Labour force survey estimates (LFS), by census metropolitan area based on 2011 census boundaries, 3-month moving average, seasonally
Monthly Labour Force Survey Statistics November 2018
 800 Monthly Labour Force Survey Statistics CALGARY CMA Table 282-0135 Labour force survey estimates (LFS), by census metropolitan area based on 2011 census boundaries, 3-month moving average, seasonally
METRO. Monthly Board Report. June 2006
 METRO Monthly Board Report Operating Capital Service Performance June 26 7/17/26 June 26 MONTHLY BOARD REPORT INDEX Section A Section B Section C Section D Section E Section F Section G Operating Budget
REVENUE & RIDERSHIP REPORT OCTOBER 2017
 REVENUE & RIDERSHIP REPORT OCTOBER 2017 Monthly passenger revenue 3.5% above last year and 1.4% below budget Monthly ridership 3.4% below budget and 6.3% below last year Year-to-date revenue 3.5% and ridership
FY2014 Operating Budget Performance Report
 Finance & Administration Committee Information Item IV-C September 11, 2014 FY2014 Operating Budget Performance Report Washington Metropolitan Area Transit Authority Board Action/Information Summary Action
Moving Forward: Improving Metro Vancouver s Transportation Network
 Moving Forward: Improving Metro Vancouver s Transportation Network 2011 Supplemental Plan and Outlook Transportation and Financial Supplemental Plan for 2011 to 2013 and Outlook for 2014 to 2020 For the
XML Publisher Balance Sheet Vision Operations (USA) Feb-02
 Feb-02") Page:1 Apr-01 May-01 Jun-01 Jul-01 ASSETS Current Assets Cash and Short Term Investments 15,862,304 51,998,607 9,198,226 Accounts Receivable - Net of Allowance 2,560,786
Page:1 Apr-01 May-01 Jun-01 Jul-01 ASSETS Current Assets Cash and Short Term Investments 15,862,304 51,998,607 9,198,226 Accounts Receivable - Net of Allowance 2,560,786
Metro Vancouver Mayors Council on Regional Transportation
 Metro Vancouver Mayors Council on Regional Transportation Mayors Transportation and Transit Plan: Regional Funding of Planned Projects Final Report March, 2015 This document was developed by a joint working
Review of FasTracks Status and Future Strategic Direction
 Review of FasTracks Status and Future Strategic Direction Regional Transportation District August 21, 2008 1 Overview RTD has experienced a dramatic increase in ridership over the past year, showing that
Knowledge is too important to leave in the hands of the bosses INFLATION MONITOR MARCH 2018
 Knowledge is too important to leave in the hands of the bosses INFLATION MONITOR MARCH 2018 1 The Consumer Price Index (CPI) declined to 3.8% in March 2018 The term inflation means a sustained increase
Spheria Australian Smaller Companies Fund
 29-Jun-18 $ 2.7686 $ 2.7603 $ 2.7520 28-Jun-18 $ 2.7764 $ 2.7681 $ 2.7598 27-Jun-18 $ 2.7804 $ 2.7721 $ 2.7638 26-Jun-18 $ 2.7857 $ 2.7774 $ 2.7690 25-Jun-18 $ 2.7931 $ 2.7848 $ 2.7764 22-Jun-18 $ 2.7771
BART s Business Model
 BART s Business Model July 31, 2018 What is Public Transit s Business Model? BART Background Basic Facts Regional rail rapid transit Elected Board of Directors: 9 Comprised of 3 Counties: - Alameda, Contra
TERMS OF REFERENCE FOR THE INVESTMENT COMMITTEE
 I. PURPOSE The purpose of the Investment Committee (the Committee ) is to recommend to the Board the investment policy, including the asset mix policy and the appropriate benchmark for both ICBC and any
The Price of Inaction
 The Price of Inaction Economic Impact of SEPTA s Plan B Service Cuts and Fare Increases May 2007 Economy League of Greater Philadelphia April 2007 Agenda 1. Background: How did SEPTA get here? 2. The SEPTA
1.2 The purpose of the Finance Committee is to assist the Board in fulfilling its oversight responsibilities related to:
 Category: BOARD PROCESS Title: Terms of Reference for the Finance Committee Reference Number: AB-331 Last Approved: February 22, 2018 Last Reviewed: February 22, 2018 1. PURPOSE 1.1 Primary responsibility
STAFF REPORT INFORMATION ONLY
 nsert TTC logo here STAFF REPORT INFORMATION ONLY Presentation: TTC Budgets Date: June 17, 2015 To: From: TTC Budget Committee Chief Executive Officer Summary Staff will deliver for the information of
Common stock prices 1. New York Stock Exchange indexes (Dec. 31,1965=50)2. Transportation. Utility 3. Finance
2. Transportation. Utility 3. Finance") Digitized for FRASER http://fraser.stlouisfed.org/ Federal Reserve Bank of St. Louis 000 97 98 99 I90 9 9 9 9 9 9 97 98 99 970 97 97 ""..".'..'.."... 97 97 97 97 977 978 979 980 98 98 98 98 98 98 987 988
Digitized for FRASER http://fraser.stlouisfed.org/ Federal Reserve Bank of St. Louis 000 97 98 99 I90 9 9 9 9 9 9 97 98 99 970 97 97 ""..".'..'.."... 97 97 97 97 977 978 979 980 98 98 98 98 98 98 987 988
Budget Process Overview and Cost Allocation Methodology
 Budget Process Overview and Cost Allocation Methodology 1 Cost Allocation Agreement Guiding Principles Operate a consolidated regional public transportation system within and between the Participating
Review of Registered Charites Compliance Rates with Annual Reporting Requirements 2016
 Review of Registered Charites Compliance Rates with Annual Reporting Requirements 2016 October 2017 The Charities Regulator, in accordance with the provisions of section 14 of the Charities Act 2009, carried
Dulles Corridor Enterprise Financial Update Dulles Corridor Advisory Committee Meeting
 Dulles Corridor Enterprise Financial Update Dulles Corridor Advisory Committee Meeting December 15, 2014 Discussion Outline Finance Plan for the Metrorail Project Allocation of Estimated Capital Costs
PHOENIX ENERGY MARKETING CONSULTANTS INC. HISTORICAL NATURAL GAS & CRUDE OIL PRICES UPDATED TO July, 2018
 Jan-01 $12.9112 $10.4754 $9.7870 $1.5032 $29.2595 $275.39 $43.78 $159.32 $25.33 Feb-01 $10.4670 $7.8378 $6.9397 $1.5218 $29.6447 $279.78 $44.48 $165.68 $26.34 Mar-01 $7.6303 $7.3271 $5.0903 $1.5585 $27.2714
HIPIOWA - IOWA COMPREHENSIVE HEALTH ASSOCIATION Unaudited Balance Sheet As of July 31
 Unaudited Balance Sheet As of July 31 Total Enrollment: 407 Assets: Cash $ 9,541,661 $ 1,237,950 Invested Cash 781,689 8,630,624 Premiums Receivable 16,445 299,134 Prepaid 32,930 34,403 Assessments Receivable
HIPIOWA - IOWA COMPREHENSIVE HEALTH ASSOCIATION Unaudited Balance Sheet As of January 31
 Unaudited Balance Sheet As of January 31 Total Enrollment: 371 Assets: Cash $ 1,408,868 $ 1,375,117 Invested Cash 4,664,286 4,136,167 Premiums Receivable 94,152 91,261 Prepaid 32,270 33,421 Assessments
PLANNING, HOUSING AND COMMUNITY SERVICES Transportation Planning
 REGION OF WATERLOO PLANNING, HOUSING AND COMMUNITY SERVICES Transportation Planning TO: Chair Jim Wideman and Members of the Planning and Works Committee DATE: February 1, 2005 FILE CODE: D10-20/CTC SUBJECT:
Public-Private Partnerships in Maryland. Canada-US Forum on Public-Private Partnerships October 3, 2013
 Public-Private Partnerships in Maryland Canada-US Forum on Public-Private Partnerships October 3, 2013 Towards a More Comprehensive P3 Approach 2010 P3 Law (Chapters 640 and 641 of 2010) Joint Legislative
Memorandum. May 28, Mr. Ken Bleiwas Office of the State Comptroller 59 Maiden Lane, 29 th Floor New York, New York Dear Mr.
 Memorandum State of New York May 28, 2014 Mr. Ken Bleiwas Office of the State Comptroller 59 Maiden Lane, 29 th Floor New York, New York 10038 Dear Mr. Bleiwas, This represents the MTA s First Quarter,
R o l l i n g F o r e c a s t i n g :
 R o l l i n g F o r e c a s t i n g : A S t r a t e g y f o r E f f e c t i v e F i n a n c i a l M a n a g e m e n t Debra Miller Vice President Client Success January 22, 2016 Discussion Topics Overview
QUESTION 2. QUESTION 3 Which one of the following is most indicative of a flexible short-term financial policy?
 QUESTION 1 Compute the cash cycle based on the following information: Average Collection Period = 47 Accounts Payable Period = 40 Average Age of Inventory = 55 QUESTION 2 Jan 41,700 July 39,182 Feb 18,921
Memorandum. May 29, Mr. Ken Bleiwas Office of the State Comptroller 59 Maiden Lane, 29 th Floor New York, New York Dear Mr.
 Memorandum State of New York May 29, 2015 Mr. Ken Bleiwas Office of the State Comptroller 59 Maiden Lane, 29 th Floor New York, New York 10038 Dear Mr. Bleiwas, This represents the MTA s First Quarter,
Strategic Plan Progress Report Goal 2 Focus. July 2015 San Francisco, California
 Strategic Plan Progress Report Goal 2 Focus July 2015 San Francisco, California 1 Goal 2 focus Make transit, walking, bicycling, taxi, ridesharing and carsharing the preferred means of travel Objective
April 30, 2016 Financial Report
 2016 April 30, 2016 Financial Report Capital Metropolitan Transportation Authority 6/15/2016 Table of Contents SUMMARY REPORT Budgetary Performance - Revenue 2 - Sales Tax Revenue 6 - Operating Expenses
Financial & Business Highlights For the Year Ended June 30, 2017
 Financial & Business Highlights For the Year Ended June, 17 17 16 15 14 13 12 Profit and Loss Account Operating Revenue 858 590 648 415 172 174 Investment gains net 5 162 909 825 322 516 Other 262 146
February 2016 Financial Report
 2016 February 2016 Financial Report Capital Metropolitan Transportation Authority 4/13/2016 Table of Contents SUMMARY REPORT Budgetary Performance - Revenue 2 - Sales Tax Revenue 5 - Operating Expenses
SCHEDULE 10 INDEX FACTOR
 DRAFT SCHEDULE 10 INDEX FACTOR SCHEDULE 10 INDEX FACTOR 1. GENERAL 1.1 Capitalized Terms Capitalized terms used in this Schedule have the definitions as set out in the Agreement to Design, Build, Finance
Big Walnut Local School District
 Big Walnut Local School District Monthly Financial Report for the month ended September 30, 2013 Prepared By: Felicia Drummey Treasurer BIG WALNUT LOCAL SCHOOL DISTRICT SUMMARY OF YEAR TO DATE FINANCIAL
August 31, 2016 Financial Report
 August 31, 2016 Financial Report Capital Metropolitan Transportation Authority 10/14/2016 Table of Contents SUMMARY REPORTS Budgetary Performance - Revenue 2 - Sales Tax Revenue 6 - Operating Expenses
FEBRUARY 2017 EMPLOYMENT CONSTRUCTION TRANSIT & TOURISM
 FINANCE REAL ESTATE TRANSIT & TOURISM HIGHLIGHTS January 2017 saw a sharp rise in private sector employment The value of venture capital financings in New York City grew 18% in the final quarter of Citywide
TABLE OF CONTENTS. Page 1
 TABLE OF CONTENTS 1. Financial and Performance Summary... 3 Key Priorities... 4 Strategic Regional Transportation Investments... 6 2. 5 Year Summary... 7 3. Consolidated Statement of Operational Analysis...
TABLE OF CONTENTS. Page 1
 TABLE OF CONTENTS 1. Executive Summary... 3 2. 2015 Financial and Operating Summary... 6 Operating Indicators... 8 Key Drivers... 10 Assumptions and Sensitivity Analysis... 11 3. Consolidated Statement
Division of Bond Finance Interest Rate Calculations. Revenue Estimating Conference Interest Rates Used for Appropriations, including PECO Bond Rates
 Division of Bond Finance Interest Rate Calculations Revenue Estimating Conference Interest Rates Used for Appropriations, including PECO Bond Rates November 16, 2018 Division of Bond Finance Calculation
WESTWOOD LUTHERAN CHURCH Summary Financial Statement YEAR TO DATE - February 28, Over(Under) Budget WECC Fund Actual Budget
 Budget WECC Fund Actual Budget") WESTWOOD LUTHERAN CHURCH Summary Financial Statement YEAR TO DATE - February 28, 2018 General Fund Actual A B C D E F WECC Fund Actual Revenue Revenue - Faith Giving 1 $ 213 $ 234 $ (22) - Tuition $ 226
WESTWOOD LUTHERAN CHURCH Summary Financial Statement YEAR TO DATE - February 28, 2018 General Fund Actual A B C D E F WECC Fund Actual Revenue Revenue - Faith Giving 1 $ 213 $ 234 $ (22) - Tuition $ 226
Version number Effective date Person in charge Changes
 0.Version Version number Effective date Person in charge Changes V1 9-Nov-11 SK V1.1 10-Nov-11 PV V1.2 11-Nov-11 PV V1.3 14-Nov-11 PV V1.4 1-Oct-12 ST Add Short-Term Student Research Assistants in Internal
Consolidated Financial Results for the Nine-Month Period Ended December 31, 2016
 Statements made in this document with respect to SQUARE ENIX HOLDINGS CO., LTD. and its consolidated subsidiaries' (together, SQUARE ENIX GROUP") plans, estimates, strategies and beliefs are forward-looking
Board of Directors October 2018 and YTD Financial Report
 Board of Directors October 2018 and YTD Financial Report Consolidated Financial Results Operating Margin October ($30,262) $129,301 ($159,563) Year-to-date $292,283 $931,358 ($639,076) Excess of Revenue
SIGNS. MICHAEL FERREIRA URBAN ANALYTICS INC. October 24, 2014
 SIGNS MICHAEL FERREIRA URBAN ANALYTICS INC. October 24, 2014 8.0 7.0 6.0 5.0 4.0 3.0 2.0 1.0 0.0-1.0 Jan-10 Mar-10 May-10 Jul-10 Sep-10 Nov-10 Jan-11 Mar-11 May-11 Jul-11 Sep-11 Nov-11 Jan-12 Mar-12 May-12
QUARTERLY REPORT AND CERTIFICATION OF THE COUNTY TREASURER For Quarter Ending June 30, 2009 COMPLIANCE CERTIFICATION
 QUARTERLY REPORT AND CERTIFICATION OF THE COUNTY TREASURER For Quarter Ending June 30, 2009 The Government Code requires the County Treasurer to render a Quarterly Report to the County Administrator, the
U.S. and New England Economic Conditions and Outlook
 U.S. and New England Economic Conditions and Outlook Yolanda Kodrzycki Senior Economist and Policy Advisor charts prepared by Ana Patricia Muñoz presented to New England Board of Higher Education conference
U.S. Natural Gas Storage Charts
 U.S. Natural Gas Storage Charts BMO Capital Markets Commodity Products Group November 26, 214 Total U.S. Natural Gas in Storage 5, Total Stocks This Week 3432 4, 3, 2, 1, Reported On: November 26, 214
Top NYMEX Crude Oil Options Daily Market Update
 Options Volume and Open Interest: Last 5 Trade Days Options Volume and Open Interest: Last 12 Months Trade Date Globex ClearPort Pit Total Volume % Volume % Volume % Volume 11/13/2017 141,096 71% 58,191
Operating Budget. Third Quarter Financial Report (July 2005 March 2006)
") Third Quarter Financial Report (July 2005 March 2006) INDEX A. Executive Summary...page 2 B. Revenue and Expense Analysis...page 3 C. Budget Variance Reports...page 14 D. Ridership and Performance Measures...page
Third Quarter Financial Report (July 2005 March 2006) INDEX A. Executive Summary...page 2 B. Revenue and Expense Analysis...page 3 C. Budget Variance Reports...page 14 D. Ridership and Performance Measures...page
China Economic Outlook 2013
 China Economic Outlook 2 Key Developments in Brief - Mild recovery of GDP growth: +8 8.5% - Construction and consumption as main drivers - Inflationary pressure to increase: +3% - Tight labor market and
Cost Estimation of a Manufacturing Company
 Cost Estimation of a Manufacturing Company Name: Business: Date: Economics of One Unit: Manufacturing Company (Only complete if you are making a product, such as a bracelet or beauty product) Economics
GVS&DD Development Cost Charge Program Review
 GVS&DD Development Cost Charge Program Review Fred Nenninger DIRECTOR, POLICY PLANNING & ANALYSIS LIQUID WASTE SERVICES Stakeholder Engagement Dean Rear DIRECTOR, FINANCIAL PLANNING & OPERATIONS FINANCE
FOR RELEASE: MONDAY, MARCH 21 AT 4 PM
 Interviews with 1,012 adult Americans conducted by telephone by Opinion Research Corporation on March 18-20, 2011. The margin of sampling error for results based on the total sample is plus or minus 3
Re: Metro Vancouver Board Decisions Relating to the Strategic Priorities Fund
 ~ 4... ~~.t.r..f:).y.~. ~.~.?~~.~. r... (:.'.:::lt.. :'.'.. ::.. :'.:... ~. ':\\'.. '1'.. 1.:... :..... ~.... ::"... :.. \..'.'.. ".".'.. ~. ':.. ~. '. "... f i... : :. ~.. I\.i.. l ~.Jr... ltr\ t',''''',
Public Transit Infrastructure Fund (PTIF) Phase I Progress Update and Next Steps
 Phase I Progress Update and Next Steps") Clause 6 in Report No. 11 of Committee of the Whole was adopted, without amendment, by the Council of The Regional Municipality of York at its meeting held on June 29, 2017. 6 Public Transit Infrastructure
Clause 6 in Report No. 11 of Committee of the Whole was adopted, without amendment, by the Council of The Regional Municipality of York at its meeting held on June 29, 2017. 6 Public Transit Infrastructure
Tooele County. Financial Recovery Plan 3rd Quarter 2014 Update
 Tooele County Financial Recovery Plan 3rd Quarter 2014 Update Original Projection 14,000,000 Tooele County Cash 2009-2015 12,000,000 10,000,000 8,000,000 6,000,000 4,000,000 2,000,000 - Ahead of Projection
Key IRS Interest Rates After PPA
 Key IRS Rates - After PPA - thru 2011 Page 1 of 10 Key IRS Interest Rates After PPA (updated upon release of figures in IRS Notice usually by the end of the first full business week of the month) Below
Constructing a Cash Flow Forecast
 Constructing a Cash Flow Forecast Method and Worked Example A cash flow forecast shows the estimates of the timing and amounts of cash inflows and outflows over a period of time. The sections of a cash
Department of Public Welfare (DPW)
") Department of Public Welfare (DPW) Office of Income Maintenance Electronic Benefits Transfer Card Risk Management Report Out-of-State Residency Review FISCAL YEAR 2014-2015 September 2014 (June, July and
Department of Public Welfare (DPW) Office of Income Maintenance Electronic Benefits Transfer Card Risk Management Report Out-of-State Residency Review FISCAL YEAR 2014-2015 September 2014 (June, July and
Commercial Real Estate Outlook June Must Own Property Names to Buy During Interest Rate Fears
 Jonathan Litt Founder & CEO Must Own Property Names to Buy During Interest Rate Fears REITs have sold off 9.5% since their peak in mid-may on fears of rising interest rates. Historically, sell-offs related
Dulles Corridor Enterprise Financial Update Dulles Corridor Advisory Committee Meeting
 Dulles Corridor Enterprise Financial Update Dulles Corridor Advisory Committee Meeting May 30, 2014 Discussion Outline Finance Plan for the Metrorail Project Allocation of Estimated Capital Costs and TIFIA
3rd Quarter, 2000 Investor Presentation
 Canadian Imperial Bank of Commerce 3rd Quarter, 2000 September 7, 2000 CIBC Overview John S. Hunkin Chairman and CEO Third Quarter, 2000 Financial Review Tom Woods Executive Vice-President Chief Financial
Factor Leave Accruals. Accruing Vacation and Sick Leave
 Factor Leave Accruals Accruing Vacation and Sick Leave Factor Leave Accruals As part of the transition of non-exempt employees to biweekly pay, the UC Office of the President also requires standardization
Proposed Funding Strategy for Metro Vancouver s 10-Year Transit and Transportation Plan
 April 29, 2016 The Honourable Christy Clark Premier of BC PO Box 9041 STN PROV GOVT Victoria, BC V8W 9E1 (E-mail: premier@gov.bc.ca) The Honourable Peter Fassbender Minister of Community Services PO Box
Growth through Partnerships
 Growth through Partnerships Long Term Investments in Regional Transportation Infrastructure for Economic and Environmental Sustainability April 2013 Growth Through Partnerships 1 Executive Summary TransLink
SCHEDULE 10 INDEX FACTOR
 SCHEDULE 10 INDEX FACTOR SCHEDULE 10 INDEX FACTOR 1. GENERAL 1.1 Capitalized Terms Capitalized terms used in this Schedule have the definitions as set out in the Agreement to Design, Build, Finance and
Durham Orange Joint Staff Working Group Meeting Agenda October 10, :30 pm 4:00 pm Durham City Hall, Transportation 4B
 Durham Orange Joint Staff Working Group Meeting Agenda October 10, 2018 2:30 pm 4:00 pm Durham City Hall, Transportation 4B 1. Call to Order/Roll Call 2. Election Chair Position 3. Open Issues a. FY2019
Executive Summary. July 17, 2015
 Executive Summary July 17, 2015 The Revenue Estimating Conference adopted interest rates for use in the state budgeting process. The adopted interest rates take into consideration current benchmark rates
MANAGING FOR RESULTS: An Implementation Plan for the City of Portland
 MANAGING FOR RESULTS: An Implementation Plan for the City of Portland Office of Management and Finance City Auditor s Office Bureau of Planning City of Portland, Oregon June, 2003 Managing for Results