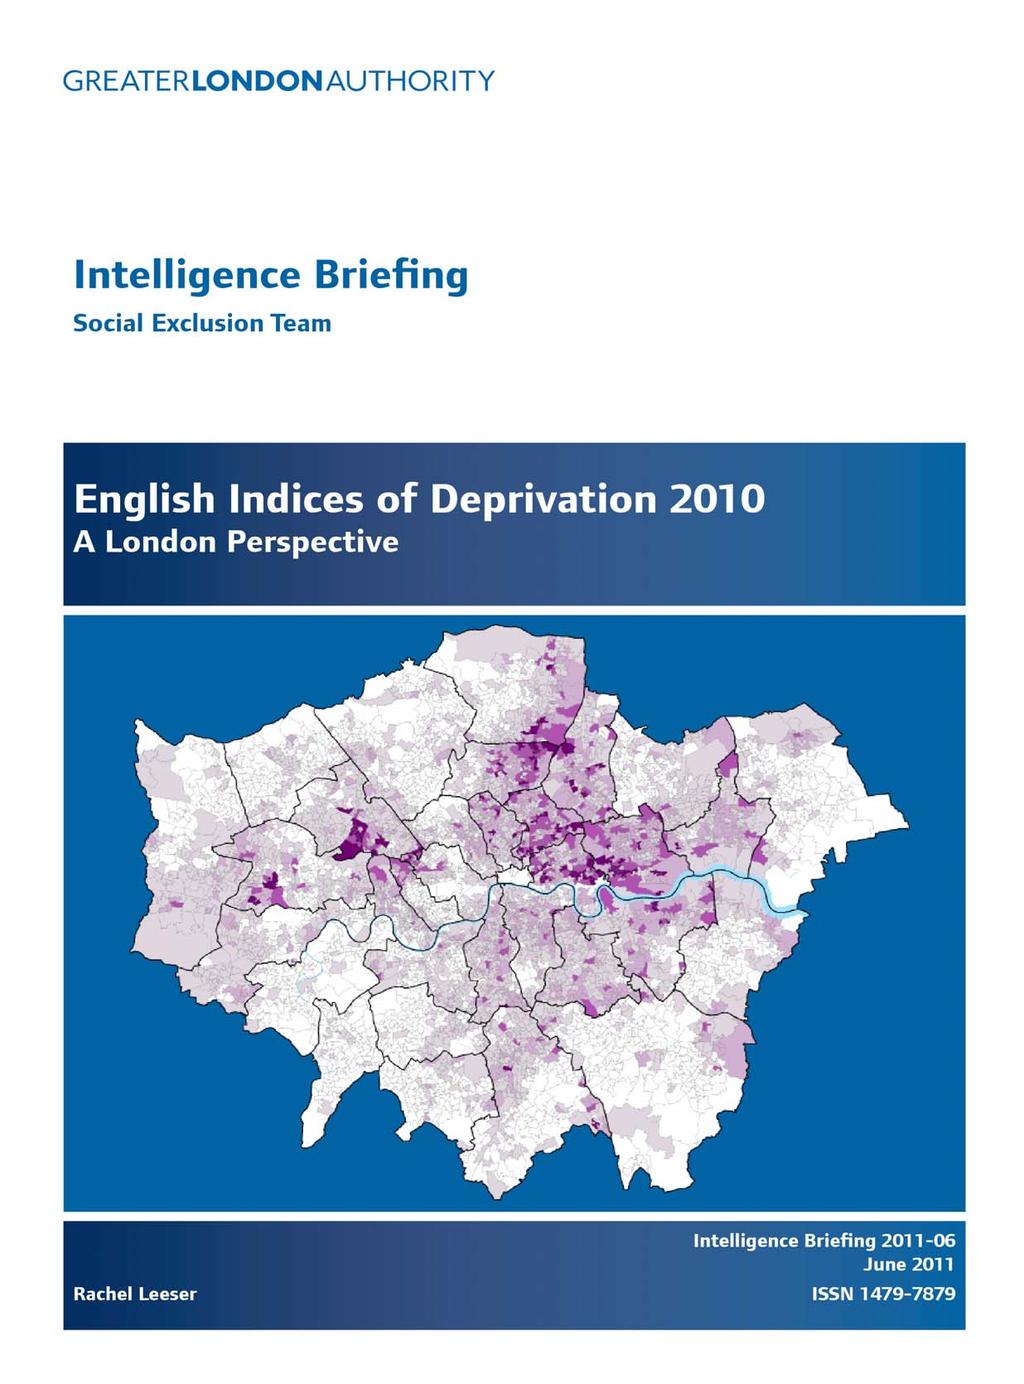
Intelligence Briefing English Indices of Deprivation 2010 A London perspective. June 2011
|
|
|
- Jonah Melton
- 6 years ago
- Views:
Transcription
1
2 Intelligence Briefing June 2011 English Indices of Deprivation 2010 A London perspective For more information please contact: Rachel Leeser Intelligence Unit Greater London Authority City Hall (2 East) The Queen s Walk London SE1 2AA Tel: Rachel.Leeser@london.gov.uk Copyright Greater London Authority, 2011 All data in this briefing are taken from the Department of Communities and Local Government Indices of Deprivation 2010, Indices of Deprivation 2007 or the Indices of Deprivation The Super Output Area Boundaries used in this report are Crown copyright The maps are Crown copyright. All rights reserved. (Greater London Authority) (LA ) (2011). Crown Copyright material has been reproduced with the permission of the Controller of Her Majesty s Stationery Office. Cover is Map 2 from this report. ISSN Indices of Deprivation 2010 Intelligence Briefing
3 Contents Summary of main findings i Introduction 1 The domains, the indicators and denominators 2 The combined index and the supplementary indices 5 The results 5 Index of Multiple Deprivation 5 Income deprivation domain 11 Employment deprivation domain 16 Health deprivation and disability domain 18 Education, skills and training deprivation domain 20 Barriers to housing and services domain 24 The living environment deprivation domain 28 Crime domain 32 Using the ID2010 at higher geographical levels 34 Access to further information 39 List of Maps Map 1 Index of Multiple Deprivation 2010, England 7 Map 2 Index of Multiple Deprivation 2010, London 8 Map 3 Index of Multiple Deprivation 2007, London 9 Map 4 Index of Multiple Deprivation 2004, London 10 Map 5 Income Deprivation Domain 2010, London 13 Map 6 Income Deprivation Affecting Children Index 2010, London 14 Map 7 Income Deprivation Affecting Older People Index 2010, London 15 Map 8 Employment Deprivation Domain 2010, London 17 Map 9 Health Deprivation and Disability Domain 2010, London 19 Map 10 Education, Skills and Training Deprivation Domain 2010, London 21 Map 11 Children and Young People Sub Domain 2010, London 22 Map 12 Skills Sub Domain 2010, London 23 Map 13 Barriers to Housing and Services Domain 2010, London 25 Map 14 Wider Barriers Sub Domain 2010, London 26 Map 15 Geographical Barriers Sub Domain 2010, London 27 Map 16 The Living Environment Deprivation Domain 2010, London 29 Map 17 The Indoors Living Environment Sub Domain 2010, London 30 Map 18 The Outdoors Living Environment Sub Domain 2010, London 31 Map 19 Crime Domain 2010, London 33 Indices of Deprivation 2010 Intelligence Briefing
4 Summary of main findings The Indices of Deprivation 2010 (ID2010) are the Government s primary measure of deprivation for small areas in England. The ID2010 replace and update the Indices of Deprivation The main index is the Index of Multiple Deprivation, which combines measures across seven distinct aspects of deprivation. The most deprived areas within London are concentrated to the north and east of the City, from Newham to Islington and from Tower Hamlets north to Enfield and Waltham Forest. Over 26 per cent of London falls within the most deprived 20 per cent of England. Richmond upon Thames and the City of London are the only local authority areas in London with no LSOAs at all amongst the 20 per cent most deprived in England. Two thirds of London LSOAs have above average levels of deprivation, the highest of any region, with by far the smallest proportion of LSOAs among the least deprived quintile. While London includes some of the least deprived LSOAs on the income deprivation domain, it also incorporates some of the most deprived LSOAs. On average, London LSOAs have the most income deprivation of any region. There are 25 LSOAs where more than half the population is income deprived, down from nearly 100 in IMD2007. The three English local authorities with the highest levels of income deprivation are all in London (Tower Hamlets, Newham and Hackney). Over a third of London is among the top 20 per cent of England LSOAs for income deprivation among older people, including more than nine per cent among the country s top five per cent. These figure have changed little since For children, these figures are even higher, with 13 per cent of London LSOAs rank among the top five per cent nationally, 23 per cent among the top 10 per cent and 41 per cent among the top 20 per cent. These are very similar to the 2007 levels. Nearly one in three children and one in four people aged over 60 in London lives in a household in income deprivation. The most deprived LSOA in England on the Income Deprivation Affecting Children Index is in Westminster. Indices of Deprivation 2010 i Intelligence Briefing
5 Tower Hamlets has the highest proportion of its children and older people in income deprivation of any local authority in England. Islington, Hackney, Newham and Haringey are the remaining authorities in the five English local authorities with the highest proportions of areas in the worst decile on both measures. Despite higher unemployment rates in London than in other regions, the IMD shows relatively low levels of employment deprivation in the capital, with relatively fewer people unable to work due to ill health. There are low levels of health problems or disability in London compared with other parts of the country, and these have been further reduced since IMD2007. London is the least deprived region in England in terms of education, skills and training deprivation with two thirds of London s areas having a score on this domain below the England average. The barriers to housing and services domain of IMD2010 shows London is far more deprived in this domain than the other English regions, even more so than in IMD2007. This is nearly all due to high levels of housing barriers. Hackney, Newham, Haringey, Waltham Forest and Kensington & Chelsea are the five local authorities in England with the highest levels of deprivation on this domain. London is again by far the most deprived region on the living environment deprivation domain. The most deprived parts of London according to the living environment deprivation domain remain concentrated in north, west and south inner London London is the most deprived region on the crime domain, with more than 30 per cent of areas in the worst 20 per cent in England, higher even than in IMD2007. Hackney, Newham and Tower Hamlets remain the London boroughs with the highest levels of deprivation, ranking 1 st, 2 nd and 3 rd nationally on two of the six published summary measures at local authority level. Nineteen London boroughs rank within the top 50 of the 326 local authorities in England on at least one of the summary measures of deprivation. London is the only English region with no small areas among the most deprived one per cent nationally, but is second only to the North West region in terms of the percentage in the most deprived quintile. London also has the lowest proportion of areas of any English region among the least deprived decile and quintile in England, and indeed fewest with deprivation scores below average. Indices of Deprivation 2010 ii Intelligence Briefing
6 Indices of Deprivation 2010 iii Intelligence Briefing
7 Introduction The English Indices of Deprivation 2010 (ID2010) consist of three separate but related indices: the Index of Multiple Deprivation 2010 (IMD2010); the Income Deprivation Affecting Children Index (IDACI) and the Income Deprivation Affecting Older People Index (IDAOPI). The first of these, the IMD2010, is complex and combines data on a range of topics into a single measure. The other two are supplementary indices and are concerned solely with people from the relevant groups in low income households. The ID2010 are the third release in a series of statistics to provide an indication of relative levels of deprivation across small areas using a consistent approach. They replace the Indices of Deprivation 2007 (ID2007) as the Government s official measure of deprivation from the Department for Communities and Local Government. The work to construct the indices was carried out by the Social Disadvantage Research Centre at the Department of Social Policy and Social Research at the University of Oxford. Separate indices are produced for Wales, for Scotland and for Northern Ireland, which are not directly comparable with the English Indices as described here. The purpose of the Indices is to measure multiple deprivation, or identify areas of need, at the small area level, so each of the three indices is produced for small areas known as Lower Layer Super Output Areas (LSOAs). These are geographical areas devised, following the 2001 Census of Population, to be of a consistent size generated in a consistent way across the whole of England. The total resident population of LSOAs averaged around 1,500 people. These areas are nested, as far as possible, within electoral wards (as they existed in 2002). There are exceptions to this, such as in the City of London, where ward populations are so small that this is not possible. The LSOAs were created to be fixed geographical zones used for statistical purposes. Thus population sizes of LSOAs are likely to have greater variation over time. The LSOAs were used for the first time to create the ID2004, so it is possible to carry out comparisons between ID2010, ID2007 and ID2004 unaffected by changes of boundaries. There are a total of 32,482 such LSOAs in England. Summary measures of the small area data are produced for local authorities. Central government and other bodies use these and the small area indices to identify areas where disadvantage is concentrated, to build schemes or assign resources appropriately. The Index of Multiple Deprivation is based on the concept of measuring distinct dimensions of deprivation separately and then combining these to give an overall score. It is an area based measure, rather than an individual based measure, so it looks at the extent of each type of deprivation within the area and then combines these to give a figure taking into account the extent of each type of deprivation. It does this by using statistical techniques to combine information on economic and social issues to produce scores for small areas across the whole of England. These are then used to rank the areas according to their relative level of deprivation. Full details can be found in the main report from CLG. (See Access to Further Information on p39 for details.) The IMD2010 is a straightforward update to the ID2007, with only marginal change in the definition of the underlying indicators where, for example, there were changes in the welfare benefit system. This allows comparisons to be made on a robust basis. Indices of Deprivation Intelligence Briefing
8 Seven distinct dimensions or `domains of deprivation are included in the IMD2010, made up of 38 separate indicators. The domains are: Income deprivation Employment deprivation Health deprivation and disability Education, skills and training deprivation Barriers to housing and services Living environment deprivation Crime These seven domains have been produced for each LSOA, and are then combined to produce a single score for each LSOA in the country. These are then ranked to compare the areas across England. Two further indices are created which are subsets of the income deprivation domain. These are the Income Deprivation Affecting Children Index (IDACI) and the Income Deprivation Affecting Older People Index (IDAOPI). Essentially these give the proportion of the age group (under 16 and 60 and over respectively) in receipt of, or in a family in receipt of, certain means-tested benefits. These indices are also ranked across all LSOAs in England. The ID2010 are essentially an update of the ID2007 and the work to construct them was carried out during 2010, though they were not published until late March This Briefing briefly covers the construction of the indices and how they differ from the indicators or construction used for the ID2007 and any issues around making comparisons. It also covers the results for London at LSOA level for individual domains and the overall IMD but makes limited comparisons to the previous Indices of Deprivation (2007). The summary measures produced at LA level are also covered in this report, though there are particular issues with making comparisons with those produced in the ID2007, as there has been a significant change in administrative geography, with the numbers of local authorities reduced from 354 to 326. Therefore, the summary measures for the ID2007 have been recalculated to the new local authority measures, so those reported here will not necessarily be the same as those published previously. The domains, the indicators and denominators Most of the indicators used for the ID2010 relate to 2008, as these were the latest available at the time of index construction. All the indicators need to meet criteria of relevance, robustness and availability. In order to meet these criteria, some indicators use data combined over a longer period than a single year to improve robustness, and other indicators to use data from sources where no update exists and where no sufficiently robust alternative was available. The sources are varied; most come directly from administrative sources, some modelled or calculated using administrative and other data and some coming from the 2001 Census. Where improved or more reliable data have become available, these have been incorporated replacing the indicators used in previous versions. However, issues raised in previous Briefings around coverage in particular domains, for example, are not addressed in this update of the IMD. As before, Indices of Deprivation Intelligence Briefing
9 to improve reliability of indicators based on small numbers, a technique called shrinkage, which is more often applied to correct for sample error, is used. This has greater effect in local authorities where there are large differences between areas within them, such as many of the London boroughs, than on local authorities that are more homogeneous. Indicators are in most cases expressed as rates, rather than using actual numbers, since rates are more easily compared. The majority of indicators use denominators derived from the 2008 resident population estimates (less the prison population) at LSOA level produced by the Office for National Statistics Small Area Population Estimation Unit. In other cases, the denominator was taken from the same source as the indicator, including the small number of indicators derived from the 2001 Census counts, where no update could be produced. At the time of writing, the population estimates underlying the ID2010 have not been published. While for the vast majority of LSOAs they will be the same as those already published, where there are prisons the figures will be different, which will affect the ranks of other LSOAs too. Additionally, the denominators used for the ID2007 had allocated prison populations for two large prisons in London (Wandsworth and Wormwood Scrubs) to the wrong LSOAs, thus giving misleading population denominators, and therefore rankings to further LSOAs. There also remains an issue over the population figures used for the ID2004, which underestimated the populations and therefore compromises their comparability, particularly for three boroughs - Wandsworth, Southwark and Westminster. Income deprivation domain As in the previous IMD, the income deprivation domain of the IMD2010 is possibly the most straightforward in concept in that it aims to give the proportion of people in an area who are living on low incomes. In practice, this is operationalised as the proportion of people who are dependent on means-tested benefits (including any dependents of claimants). Whereas there were significant changes to the benefit system between the 2004 and 2007 IMD, there was relatively little change to 2010, and no impact on the benefits incorporated in this domain. The benefits included in the count are Income Support, Income Based Job Seekers Allowance, Pension Credit and Child Tax Credit, along with asylum seekers receiving support. Only those people in families receiving the Guarantee element of the Pension Credit are included in the income deprivation domain, and only those in families receiving Child Tax Credit (who are not already included as receiving Income Support, Income Based Job seeker s Allowance or Pension Credit) where the income is below the level used for the Government s poverty targets. Geographical information for other elements of the Working Tax Credit was not sufficiently reliable to enable their use. Employment deprivation domain The conceptual basis of this domain is, again, straightforward and, as in the IMD2007, is a simple proportion of people who are involuntarily out of work including those unable to work due to incapacity or disability. This is measured by the number of people Indices of Deprivation Intelligence Briefing
10 claiming the relevant benefits or participating in the various New Deal schemes. There is only one significant change in the indicators from those used in the IMD2007. Employment Support Allowance (ESA) was introduced in October 2001, replacing Incapacity Benefit for new claimants. The fourth quarter figures for ESA are therefore used, along with the Incapacity Benefit figures to calculate a four quarter average. The other benefits incorporated in this domain are Jobseeker s Allowance (both Income- Based and Contributory), Severe Disablement Allowance and New Deal participants. Health deprivation and disability domain This domain is more complex in construction than the income and employment domains, since it is not possible, or necessarily desirable, to simply give a proportion of the population with health problems or a disability. The domain takes into account a wide range of aspects, including premature death and mental health issues as well as measures of morbidity and disability. This domain is a straightforward update of that used in the IMD2007. While three of the four indicators in this domain (years of potential life lost, comparative illness and disability ratio and measure of acute morbidity) use updated information, the fourth indicator, proportion of adults under 60 suffering from mood or anxiety disorders is more complex and is modelled based on a range of measures. One of these could not be updated, so used the data from 2005 as used in IMD2007. Other measures within this domain combine several years data to build more robust figures. Education, skills and training deprivation domain As in previous IMD, this domain is formed from two sub domains combined with equal weights. The first includes measures for children and young people, using achievement and participation data at various educational stages and is essentially an update of the 2007 sub domain. However, the denominator used for the entry to higher education indicator has been kept as that used in IMD2007 and is the number of 14 to 17 year olds taken from the 2001 Census. Whereas in IMD2007 this therefore gave the proportion of the 18 to 21 year olds, the group at risk of entering higher education (based on 2005 data and assuming zero net migration of this age group between 2001 and 2005), in IMD2010, this assumes that the number in the at risk group remained the same between the two dates. The second sub domain is a measure for working age adults and uses just one indicator of those aged with no or low qualifications. This indicator is derived from the 2001 Census and is therefore unchanged from IMD2004. Barriers to housing and services domain This domain again comprises two equally weighted sub domains geographical barriers and wider barriers. The geographical barriers sub domain updates directly the IMD2007 sub domain. In the wider barriers sub domain, the household overcrowding indicator is based on the 2001 Census and therefore cannot be updated, so it is included unchanged, and the method for calculating the affordability (access to owner occupation) indicator has been slightly improved and is in line with other estimates available. Both the affordability and homelessness indicators within this sub domain are calculated at local authority level and the indicator attributed to all constituent LSOAs. Indices of Deprivation Intelligence Briefing
11 The living environment deprivation domain Housing issues are also incorporated into this domain, in terms of the standard of housing as the indoors living environment sub-domain. Again one indicator within this sub domain is derived from the 2001 Census and the other also has not been updated from IMD2007. The two indicators within the outdoors living environment sub-domain (air quality and road accidents) have been directly updated from the IMD2007. The indoors sub-domain is given twice the weight of the outdoors sub-domain, in line with the relative time spent indoors and outdoors, again as in the IMD2007. Crime domain This domain uses data on 33 types of recorded crime under four broad categories burglary, theft, criminal damage and violence. It directly updates the crime domain from IMD2007, except where figures used for the denominators cannot be updated, so counts of dwellings and workplace populations are taken directly from the 2001 Census. The combined index and the supplementary indices As the IMD2010 is intended to be a straightforward update, the statistical methods used for combining the indicators and domains replicate those used in IMD2004 and IMD2007. While the weights used for combining the domains to the overall IMD are Table 1 Domain weights used to calculate the overall IMD2010 Domain Weight Income deprivation 22.5% Employment deprivation 22.5% Health deprivation and disability 13.5% Education, skills and training deprivation 13.5% (Skills sub domain 6.75%) (Children and Young People sub domain 6.75%) Barriers to housing and services 9.33% (Wider Barriers sub domain 4.67%) (Geographical Barriers sub domain 4.67%) Crime 9.33% Living Environment deprivation 9.33% (Indoors sub domain 6.22%) (Outdoors sub domain 3.11%) unchanged (see Table 1), the weights for individual indicators in the IMD may vary from those of previous indices, since factor analysis is used within several domains, and so the relative weights given to the indicators within the domain or sub domain may alter. The two supplementary indices relating to children and older people are simple proportions of the age group under consideration in lowincome households, as measured by those claiming state means-tested benefits. The results For each small area (LSOA), ten main measures are produced: each of the seven domains; the combined IMD and the two supplementary indices. Additionally, the data are given for each of the sub-domains; a further six measures for each LSOA. These are shown for London in map form over the following pages and the results are discussed. Index of Multiple Deprivation Map 1 shows London in the context of the IMD2010 across the whole of England. It is clear from this map that deprivation is not spread evenly across the country, but that some areas have higher concentrations than others. More than one in four LSOAs in Indices of Deprivation Intelligence Briefing
12 London are among the 20 per cent most deprived in England and two thirds have levels of deprivation above the national average, the highest proportion of any English region. Map 2 shows more detail for London and it is clear from this that the most deprived areas within London are concentrated in an arc to the east and north of the City, from Newham through Tower Hamlets, Hackney and Islington up into Haringey and the outer London boroughs of Enfield and Waltham Forest. Other outer London boroughs, such as Brent and Ealing, also include some of the most deprived parts of the country while other parts of inner London showing areas with high levels of deprivation can be found in Kensington & Chelsea and in Westminster. Hackney and Tower Hamlets are among the ten local authorities in the country with the highest proportion of LSOAs in the most deprived ten per cent in England, though both boroughs have seen a reduction in the number of LSOAs in the top five per cent since The five LSOAs with the highest ranks in London are in five boroughs, Tower Hamlets, Newham, Hackney, Haringey and Waltham Forest. Deprivation is not confined to boroughs north of the Thames, however, and the IMD2010 reveals pockets of deprivation in boroughs south of the river, such as Greenwich, Croydon, Lambeth, Southwark, Lewisham and Bromley. The first three of these boroughs are the only ones south of the Thames with any LSOAs among the most deprived five per cent in England. Overall, London has fewer LSOAs than expected in the most deprived categories, with just over two per cent falling into the five per cent most deprived areas in the country and eight per cent of London is ranked in the top ten per cent. However, there are higher than average levels of deprivation in the next category, so that over 26 per cent of London falls within the most deprived 20 per cent of England. While it is clear from Map 2 that areas with high levels of deprivation tend to be in inner London, and mostly north of the river, Richmond upon Thames is the only borough (along with the City of London) with no LSOAs at all amongst the 20 per cent most deprived in England. Only one third of London LSOAs had an IMD score below average for England, and the proportion in the 20 per cent least deprived, at less than 9 per cent, was lower than for any other English region. Generally, this pattern is similar to that shown in the IMD2007 (Map 3) and IMD2004 (Map 4) although there are more of the most deprived LSOAs in the outer London boroughs such as Ealing, Enfield, Greenwich and Brent and fewer in the inner, particularly south London boroughs. Overall, the number of London LSOAs falling into the top 20 per cent of deprived areas in England decreased between the 2007 and 2010 indices, as Table 2 highlights, but there were more between average levels of Table 2 Number of LSOAs in London by England rank on IMD, 2004, 2007, In 5% most deprived In 5-10% most deprived In 10-20% most deprived In 20-50% most deprived In 50% least deprived Source: Indices of Deprivation, 2004, 2007, 2010, CLG deprivation and the top 20 per cent. As this is a purely relative measure, it is not possible to tell whether deprivation levels in London decreased or whether areas in the rest of England became more deprived or indeed how much of this change can be attributed to differences in population denominators. Indices of Deprivation Intelligence Briefing


13 Map 1 Index of Multiple Deprivation 2010, England Indices of Deprivation Intelligence Briefing
14 Map 2 Index of Multiple Deprivation 2010, London Indices of Deprivation DMAG Briefing
15 Map 3 Index of Multiple Deprivation 2007, London Indices of Deprivation DMAG Briefing
16 Map 4 Index of Multiple Deprivation 2004, London Indices of Deprivation DMAG Briefing
17 Income deprivation domain The Income deprivation domain shows a broadly similar distribution within London to the overall IMD, but more exaggerated, with high levels of income deprivation seen among large parts of Inner London, and more widespread pockets in Outer London (see Map 5). Altogether, almost a third of London LSOAs ranked among the 20 per cent most deprived in the country. While London includes some of the least deprived LSOAs on the income domain (14 of the least deprived 100 in England, in Westminster, City of London, Richmond upon Thames, Kensington & Chelsea, Bromley and Southwark), it also incorporates some of the most deprived LSOAs. These include 25 LSOAs where over half the population is income deprived, six of which fall with the top 100 in the country, in Tower Hamlets, Haringey and Enfield. Westminster includes an LSOA just outside this group (ranked 103), reflecting the diversity of wealth among its population. On average, London LSOAs have the most income deprivation of any region, and the three local authorities with the highest levels of income deprivation are all in London (Tower Hamlets, Newham and Hackney). These are the only authorities in England where this level is more than 30 per cent. Over 60 per cent of LSOAs in Tower Hamlets are among the ten per cent highest ranked areas in England on this domain. The figures for Newham and Hackney are over 50 per cent and for Haringey over 40 per cent. Along with Knowsley (44 per cent) in the North West region, these make the five local authorities with the highest proportions of LSOAs in the worst ten per cent. The distribution within London of LSOA ranks according to the two supplementary indices, for Income Deprivation among Children and among Older People, are illustrated on the following pages (Maps 6 and 7), since they are effectively sub-domains of the Income Deprivation domain. Not surprisingly, they are broadly similar in the distribution of the most deprived areas to the entire income deprivation domain, but there are more LSOAs among the most deprived in the country for both children and older people, suggesting that it is the working age adults, particularly those without children, who are less likely to be on low incomes in London than elsewhere. These maps show the same pattern as on the income domain as a whole, with high levels of income deprivation among children and older people concentrated mostly in the north Inner London boroughs, and up into Enfield, but noticeably more also among the most deprived in the country. There are some notable differences between these two supplementary indices, however. Some of the differences apparent in both the 2004 and 2007 IDACI and IDAOPI remain. For example, most of a large block of LSOAs in north Newham from Forest Gate to Plashet and Upton to Manor Park are among the worst five per cent in the country on the IDAOPI, but only a few of these LSOAs are ranked highly on IDACI, whereas the reverse is apparent for an area around Stonebridge/Harlesden in Brent. Parts of Westminster rank very highly on not only the income deprivation domain, but particularly on the IDACI. In fact the LSOA ranked highest (most deprived) in England on the IDACI is in Westminster, one of five Westminster LSOAs ranked within the top Indices of Deprivation Intelligence Briefing
18 20. LSOAs in Islington and Tower Hamlets also feature in the top 20. Altogether, 39 LSOAs in London are within the most deprived 100 LSOAs in England on the IDACI. The five top (most deprived) LSOAs nationally on the IDAOPI are in Tower Hamlets, with a further twelve in the top 100. The only other borough with an LSOA ranked in the top 100 on the IDAOPI is Haringey. Altogether, over a third of London is among the 20 per cent of England LSOAs for income deprivation among older people, including more than nine per cent among the country s top five per cent. For children, these figures are even higher, with more than twice the expected proportion of London LSOAs ranking in the most deprived ranges on the IDACI. For example, 13 per cent of London LSOAs rank among the top five per cent nationally, 23 per cent among the top 10 per cent and 41 per cent among the top 20 per cent. Put another way, 37% of the most deprived LSOAs (within the top 5 per cent) in England on the IDACI are in London (compared to less than 15% of all LSOAs). This pattern shows hardly any change on either of these two indices from the picture in the ID2007. Nearly a third of children in London are in households in income deprivation, by far the highest proportion of any region and around double the rates for the South East and East of England. London is also the region with the largest number of children affected by income deprivation, at nearly 475,000. This is much higher than in the next highest region, the North West which has just over 300,000 children in income deprivation. The five local authorities with the highest levels of income deprivation affecting children are all in London (See Table 3 below), and the same five local authorities have the highest proportions of LSOAs in the most deprived ten per cent on the IDACI. London also has a higher percentage of older people in income deprivation than any other region, with nearly one in four people aged 60 or over affected by income deprivation. However, due to differences in the age structure, the number of older people in London affected, at 286,000, is lower than in the North West (over 330,000). The first four of the top five local authorities with the highest levels of income deprivation affecting older people are in London (see Table 3 below), and these four, along with Haringey make up the five local authorities have the highest proportions of LSOAs in the most deprived ten per cent on the IDAOPI, the same ones that rank most highly on the IDACI. Table 3 The five local authorities in England ranked highest on measures of IDACI and IDAOPI LA IDACI level % of LSOAs in 10% most deprived on IDAOPI level IDACI Tower Hamlets Islington Hackney Newham Haringey Liverpool 37.3 % of LSOAs in 10% most deprived on IDAOPI Source: English Indices of Deprivation 2010, Department for Communities and Local Government Indices of Deprivation Intelligence Briefing
19 Map 5 Income Deprivation Domain 2010, London 13
20 Map 6 Income Deprivation Affecting Children Index 2010, London 14
21 Map 7 Income Deprivation Affecting Older People Index 2010, London 15
22 Employment deprivation domain There are relatively low levels of employment deprivation overall in London compared with income deprivation domain, though the pattern of distribution remains largely the same in that the highest levels of deprivation are mainly in the northern Inner London boroughs. In London there are far fewer LSOAs ranked among the most deprived in England, with only just over half of one per cent of London LSOAs in the worst five per cent in England, nearly half thee proportion from the IMD2007, and lower proportions in the most deprived quintile, so that there are around 15 per cent of London LSOAs falling into the worst 20 per cent in the country, again a better picture than in the IMD2007. As unemployment in London was among the highest of any region (as shown by both the claimant count and ILO rates), the low levels of employment deprivation may be related more to a smaller proportion of the population not working due to ill health and claiming Incapacity Benefit (IB) etc. London was the only region where the claimant count for 2008 (the reference date for ID2010) was lower than in 2005 (the reference date for ID2007) for the whole year, while the ratio of the number of people claiming out of work benefits due to ill health or disability to the number claiming unemployment benefits was also still lower for London than most other regions. This may explain some of the reason for the relatively low employment deprivation rates in most parts of London. Another is, as noted earlier, the use of denominators that included other people of working age not in the labour force, while a higher proportion of Londoners are not working voluntarily. These include many students and people looking after the home and family. A particular issue is the figures for lone parents. Surveys 1 show that a very high proportion of lone parents in London would want to work if they could, but are prevented from doing so due to lack of child care or jobs with suitable hours. Relatively few lone parents take part in the New Deal scheme, for similar reasons, but London has relatively more lone parents than most parts of the country. All of these factors mean that the use of the total working age population as denominator in this domain serves to lower the employment deprivation rate. Even though employment deprivation is well below average in London, it is still more prevalent than in the neighbouring regions. 1 For example, London Household Survey 2002 Indices of Deprivation Intelligence Briefing
23 Map 8 Employment Deprivation Domain 2010, London Indices of Deprivation 2010 Intelligence Briefing
24 Health deprivation and disability domain The health deprivation and disability domain shows even fewer areas with higher levels of deprivation across London than those seen on the employment deprivation domain. There are also fewer LSOAs in the most deprived 10 and 20 per cent on this domain than in IMD2007, and just over half of London LSOAs have below average scores. This suggests that there are low levels of health problems or disability in London compared with other parts of the country. The map shows that people with health problems within London are largely concentrated in similar areas to those suffering from employment deprivation this overlap is understandable given that the number of people unable to work due to ill health and therefore collecting Incapacity Benefit etc makes a significant contribution to both domains. Few people in most of the Outer London boroughs have health problems or disability, and indeed nowhere in Richmond upon Thames has a score above the England average. The clearest exceptions to this are Greenwich, which includes some of the worst areas in London on this measure, and Barking & Dagenham and Waltham Forest where most LSOAs have above average levels of health problems. Indices of Deprivation Intelligence Briefing
25 Map 9 Health Deprivation and Disability Domain 2010, London Indices of Deprivation 2010 Intelligence Briefing
26 Education, skills and training deprivation domain As in IMD2007, London clearly has relatively low levels of deprivation in this domain, as the map shows, with less than one per cent of London s LSOAs among the country s worst ten per cent and less than five per cent within the worst 20 per cent in England. Just six LSOAs fall in the top five per cent nationally, two in each of Bexley and Croydon and one each in Greenwich and Havering. Only two inner London LSOAs are among England s worst ten per cent, one in each of Lewisham and Tower Hamlets. The pattern of deprivation in this domain is clearly different to that for the health deprivation and disability domain, with far fewer areas within Central London particularly, but more in some of the Outer London boroughs. Nearly two thirds of LSOAs in London have an education deprivation score below the England median, so that on average, London is the least education deprived region in England. There are clear similarities in the patterns shown in the two sub domains that make up this domain, as can be seen from Maps 11 and 12, with pockets of deprivation showing in similar areas, such as New Addington in Croydon, whereas other areas show clear differences, such as in parts of Barking and Dagenham. The skills sub domain is identical to that from IMD2007, and indeed IMD2004, since no more recent data was available, whereas there has been further improvement in the relative deprivation levels for children and young people in the IMD2007, with even fewer LSOAs showing high levels of deprivation on this sub domain. Most boroughs, including the Inner London boroughs have very few LSOAs even in the top 50 per cent in England on the skills sub domain. Indices of Deprivation Intelligence Briefing
27 Map 10 Education, Skills and Training Deprivation Domain 2010, London 21
28 Map 11 Children and Young People Sub Domain 2010, London 22
29 Map 12 Skills Sub Domain 2010, London 23
30 Barriers to housing and services domain Map 13, showing the barriers to housing and services domain, is in contrast to the education deprivation map, in that the majority of London LSOAs fall within the 20 per cent most deprived LSOAs in England, and less than 10 per cent of LSOAs ranked better than the England average. London stands out as having by far the highest levels of deprivation on this domain compared with the other English regions. It has a median rank of 5,810 and an interquartile range that barely overlaps with any of the other regions. Merton stands out as the least deprived borough on this domain, contrasting sharply with Hackney, where nearly all LSOAs fall within the most deprived five per cent nationally, and all within the top 10 per cent. Newham, Haringey and Waltham Forest all have well over 90 per cent of LSOAs in the top ten per cent in England, with Kensington and Chelsea not far behind at over 85 per cent. These five boroughs make up the five local authorities in England with the highest scores on this domain. The pattern is on the whole similar to that for the overall IMD in that the arc of higher deprivation levels to the east and north of the City is apparent, but there are more pockets with higher levels of deprivation in some of the outer London boroughs, such as Hillingdon and Bromley. The levels of deprivation in London on this domain relative to elsewhere in England are higher than in the IMD2007. The London median rank has gone up by over 2,000 places, from 7,951, and fewer LSOAs are at the bottom end of the deprivation range. However, the two sub domains that make up this domain could hardly provide a more different picture. In terms of the wider barriers sub domain, which is made up of measures relating to access to housing, the London picture is very bleak, with almost one in three London LSOAs falling within the worst five per cent in the country. This includes the whole of Hackney, Haringey, Newham, Tower Hamlets, Kensington & Chelsea and Westminster, along with most of Brent and Waltham Forest with the remainder of these boroughs falling within the worst ten per cent. Lambeth, Southwark and Lewisham also have high levels on this sub domain. The pattern seen in Map 14, with little difference between LSOAs within each borough, reflects the fact that two of the three indicators in this sub domain are borough level indicators, ascribed equally to all constituent LSOAs. Only the overcrowding indicator, derived from the 2001 Census and therefore more out of date, distinguishes between LSOAs. On the geographical barriers sub domain, less than four per cent of London LSOAs fall within the worst 20 per cent in England, and only 22 per cent of London LSOAs have scores above the England average. Nearly all the LSOAs with the relatively high scores on this sub domain are on the edges of London. Combining two such different measures into a single domain inevitably produces a compromise between the two, but even so, the use of the exponential transformation means that more than half of all London LSOAs are in the top 20 per cent on this domain. Indices of Deprivation Intelligence Briefing
31 Map 13 Barriers to Housing and Services Domain 2010, London Indices of Deprivation 2010 Intelligence Briefing
32 Map 14 Wider Barriers Sub Domain 2010, London Indices of Deprivation 2010 Intelligence Briefing
33 Map 15 Geographical Barriers Sub Domain 2010, London Indices of Deprivation 2010 Intelligence Briefing
34 The living environment deprivation domain The most deprived parts of London according to this domain are concentrated within Inner London, as with several of the other domains. However, many of the worst areas are north, west and south Inner London, whereas for most other domains, those to the north and east of the City are the most deprived. This shows that this domain is picking up different elements of deprivation to those shown in other domains. Over 40 per cent of London LSOAs rank among the 20 per cent most deprived in England on this measure. Again, this is reflected in London s regional averages, as it is by far the most deprived region on this domain. Over two thirds of LSOAs in Kensington & Chelsea are in the most deprived ten per cent in England on this domain, giving it the highest proportion in this category of all the local authorities. The next three highest ranking local authorities on this measure are also in London Hackney, Westminster and Lambeth. The two sub domains mapped on the following pages, concerned with the indoors living environment (housing quality) and outdoors living environment again show some contrast, but not the negative correlation seen in the barriers to housing and services domain. In terms of the indoors living environment sub domain, this is unchanged from IMD2007, with just over 25 per cent of London LSOAs among the most deprived 20 per cent in England, but only one per cent among the country s most deprived five per cent. The pattern of distribution of the highest ranked LSOAs within London is more dispersed than for many of the other measures, with LSOAs among the top five per cent in England in the boroughs of Barking and Dagenham, Ealing, Merton and Kingston but not in Tower Hamlets or Southwark. The outdoors living environment sub domain, on the other hand, has been updated and shows almost 60 per cent of London LSOAs in the worst 20 per cent in England, including more than 24 per cent of London LSOAs in the worst five per cent nationally and less than nine per cent below average. The map shows clearly that the worst areas are concentrated towards the centre of London, but it is equally clear that there is some spread, following some of the major arterial roads out from the centre such as to the north through Haringey and Enfield to the west through Ealing, and to the south through Croydon. Indices of Deprivation Intelligence Briefing
35 Map 16 The Living Environment Deprivation Domain 2010, London Indices of Deprivation 2010 Intelligence Briefing
36 Map 17 The Indoors Living Environment Sub Domain 2010, London Indices of Deprivation 2010 Intelligence Briefing
37 Map 18 The Outdoors Living Environment Sub Domain 2010, London Indices of Deprivation 2010 Intelligence Briefing
38 Crime domain The crime domain also shows above average levels of deprivation among London LSOAs, with a widely dispersed pattern, and again it is the most deprived region in England on this domain. Even so, Newham is the only borough to rank within the five local authorities with the highest proportions of LSOAs in the most deprived ten per cent nationally, with 44 per cent. More than three quarters of London LSOAs have scores on this domain above the England average. Richmond upon Thames, Merton and the City are the only London authorities that do not include at least one LSOA among the worst ten per cent in England on this measure. Whereas every borough included at least one LSOA with below average levels of deprivation on this domain in IMD2007, this is no longer the case, as three boroughs Lewisham, Newham and Waltham Forest all had above average levels in all LSOAs. The City has no areas with above average levels on this domain, but is unusual in that its daytime population and numbers of businesses, which are used in the denominators for the indicators within this domain, are huge in comparison to the resident population. Altogether, over 30 per cent of London LSOAs fall amongst the country s worst 20 per cent a little higher than in IMD2007 and there are fewer among the least deprived 50 per cent. Indices of Deprivation Intelligence Briefing
39 Map 19 Crime Domain 2010, London Indices of Deprivation 2010 Intelligence Briefing
40 Using the ID2010 at higher geographical levels The IMD is created for small areas because that is considered the best way to identify the areas of need. However, it is occasionally necessary to consider higher geographical levels for painting a picture of a wider area to make comparisons or for funding decisions. Most of these higher areas are fairly arbitrary in their geography and exist for administrative or political purposes. Summary measures of the IMD have been published for local authority areas. Additionally it is possible to compare larger areas based on the ranks of LSOAs within the area. Some regional and borough comparisons are given later in this report on this basis. Six different summary measures have been created for local authorities, each focusing on different, but equally valid aspects of multiple deprivation in the district. Therefore no single measure is favoured over another and all should be taken into account. The six measures are: Average of LSOA Ranks summarises the district as a whole, taking into account the population weighted ranks of both the deprived and less deprived LSOAs. Average of LSOA Scores again describes the overall position of people in the district by taking the population weighted average of the scores for each LSOA within the district. Local Concentration identifies districts' 'hot spots' of deprivation by looking at the (population weighted) average rank of the most deprived LSOAs containing ten per cent of the district s population. Extent depicts how widespread high levels of deprivation are in a district by considering the proportion of the district s population living in the most deprived LSOAs in England. The Income Scale gives the number of people in the district who are income deprived. The Employment Scale gives the number of people in the district who are employment deprived. For the published tables, local authorities are ranked according to each of these six measures. The population in each LSOA is taken into account in calculating these scores (that is, the total resident population less the prison population, as used in many of the indicators). Many funding decisions are made at this level, so the local authority level measures are the ones most widely reported and those covered in this report. Following the same procedures it is possible to produce summary measures for other areas, but this should only be done where the LSOA data cannot be used, since the lower level data provides not only more geographical detail in identifying which parts of an area are considered most deprived, but it also provides greater detail on the different aspects of deprivation, since the individual domain scores are unavailable for any other geography. The GLA will produce summary measures for London wards when the population estimates Indices of Deprivation Intelligence Briefing
FOCUSONLONDON 2011 POVERTY:THEHIDDENCITY
 FOCUSONLONDON 2011 POVERTY:THEHIDDENCITY GLA Intelligence Unit City Hall Queen s Walk More London SE1 2AA Author: Rachel Leeser POVERTY:THEHIDDENCITY intelligence@london.gov.uk 020 7983 4658 Follow us
London s Poverty Profile 2011
 London s Poverty Profile 2011 Trust for London and the New Policy Institute have updated a wide range of indicators related to poverty and inequality in London. These indicators use government data to
Data Management and Analysis Group. Child Poverty in London Income and Labour Market Indicators
 Data Management and Analysis Group Child Poverty in Income and Labour Market Indicators 60 50 40 30 1995 1996 1997 1998 1999 2000 2001 2002 2003 2004 2005 DMAG Briefing 2006/19 June 2006 Social Exclusion
Neighbourhoods. The English Indices of Deprivation Bradford District. Neighbourhoods. Statistical Release. June 2011.
 Neighbourhoods Statistical Release The English Indices of Deprivation 2010 Bradford District About this release This release provides an overview of the findings of the English Indices of Deprivation 2010
Deprivation in Rochdale Borough Indices of Deprivation 2004 (Revised)
") Deprivation in Rochdale Borough Indices of Deprivation 2004 (Revised) Summary New Indices of Deprivation (ID 2004) were published on 28 April 2004, based on data from 2001. These were subsequently revised
Deprivation in Rochdale Borough Indices of Deprivation 2004 (Revised) Summary New Indices of Deprivation (ID 2004) were published on 28 April 2004, based on data from 2001. These were subsequently revised
Still Too Poor to Pay Council Tax Support in London /18 Update
 Still Too Poor to Pay Council Tax Support in London - 2017/18 Update Overview After producing three previous reports on the impact of the localisation of council tax benefit in London, Child Poverty Action
What can cities learn from Labour Market Intelligence? Paul Bivand Lovedeep Vaid
 What can cities learn from Labour Market Intelligence? Paul Bivand Lovedeep Vaid Using LMI to produce an economic assessment for Tower Hamlets Presented indicators (at the LA level and below) covering:
This is Havering LONDON BOROUGH OF HAVERING. A Demographic and Socio-economic Profile. Some Key Facts and Figures. Version 3.4 (March, 2018) HAVERING
 HAVERING") LONDON BOROUGH OF This is Havering 2018 A Demographic and Socio-economic Profile Some Key Facts and Figures By London Borough of Havering Public Health Service Version 3.4 (March, 2018) Contents List of
LONDON BOROUGH OF This is Havering 2018 A Demographic and Socio-economic Profile Some Key Facts and Figures By London Borough of Havering Public Health Service Version 3.4 (March, 2018) Contents List of
English Indices of Deprivation 2015 Bradford District in focus
 Understanding Bradford District 1. Background English Indices of Deprivation 2015 Bradford District in focus 15 th October 2015 This briefing provides an overview of the findings of the English Indices
Indices of Deprivation
 DEPARTMENT OF SOCIAL POLICY AND INTERVENTION Indices of Deprivation Mapping the spatial distribution of multiple deprivation at small area level and their uses for targeting area-based regeneration policies
Indices of Deprivation 2010
 Indices of Deprivation 2010 Dudley Borough Statistics Corporate Policy & Research Team Indices of Deprivation 2010 Introduction The Indices of Deprivation (ID) 2010 is a measure of deprivation at a small
Indices of Multiple Deprivation: 2000, 2004 and 2007
 Indices of Multiple Deprivation: 2000, 2004 and 2007 Background This report gives an overview of the Indices of Multiple Deprivation (IMD), including what is measured to calculate the IMD, what it shows
Poverty figures for London: 2010/11 Intelligence Update
 Poverty figures for London: 2010/11 Intelligence Update 11-2012 Key points The number of Londoners living in poverty has seen little change. Children, particularly those in workless households, remain
Marmot Indicators 2015 A preliminary summary with graphs
 Marmot Indicators 2015 A preliminary summary with graphs Marmot Indicators 2015 Fair Society, Healthy Lives, The Marmot Review was published in 2010 i. The review set out the key areas that needed to be
The Landline Tax and other unnecessary costs on London households and businesses using fixed line broadband services
 The Landline Tax and other unnecessary costs on London households and businesses using fixed line broadband services Prepared for UK Broadband Contents Executive Summary 03 Section 1: Research overview
Age UK Waltham Forest Profile: Deprivation in Waltham Forest 08/01/2013
 Age UK Waltham Forest Profile: Deprivation in Waltham Forest 08/01/2013 Population Waltham Forest (WF) has a population of some 258,249 1 persons living in 96,861 households. There are 57,000 people aged
Deprivation in East Sussex Indices of Deprivation 2007
 Deprivation in East Sussex Indices of Deprivation 2007 The new Indices of Deprivation 2007 (ID 2007) have recently been released by the Department for Communities and Local Government (DCLG). They update
Indices of Deprivation 2015: Swindon Pharmaceutical Needs Assess Swindon Research Report
 Indices of Deprivation 2015: Swindon Pharmaceutical Needs Assess Swindon Research Report 2015 2018 Swindon Health and Wellbeing Board Publication date: March 2015 Page 1 Contents Contents... 2 Executive
Wider determinants of health
 3 Wider determinants of health A variety of factors, both social and environmental, impact on an individual s health. This chapter considers how these wider determinants of health are at work in Southwark.
Two Islingtons: Understanding the problem
 www.islington.gov.uk/fairness Two Islingtons: Understanding the problem Paper 1: What is the picture for Islington? Understanding the evidence base Introduction 1. It has become rather clichéd to say that
INCOMEANDSPENDINGATHOME
 GREATERLONDONAUTHORITY FOCUSONLONDON 2010 INCOMEANDSPENDINGATHOME GLA Intelligence Unit City Hall Queen s Walk More SE1 2AA intelligence@london.gov.uk 020 7983 4658 Author: Richard Walker INCOMEANDSPENDINGATHOME
Help to Buy: ISA (Issue 3)
") Please keep for future reference Page 1 of 3 Call in to any Santander branch The Financial Conduct Authority is a financial services regulator. It requires us, Santander UK plc, to give you this important
Please keep for future reference Page 1 of 3 Call in to any Santander branch The Financial Conduct Authority is a financial services regulator. It requires us, Santander UK plc, to give you this important
Local Child Poverty Measurement Frequently Asked Questions
 Local Child Poverty Measurement Frequently Asked Questions Measurement of child poverty... 2 1. How does the Government measure child poverty at a national level?... 2 2. How is local child poverty measured?...
Household income distribution estimates: The example of Pay to Stay impacts in Local Authority areas in two English regions
 Household income distribution estimates: The example of Pay to Stay impacts in Local Authority areas in two English regions Chihiro Udagawa and Paul Sanderson August 2016 Household income distribution
Ipsos MORI Local. Ben Page PEOPLE, PERCEPTIONS AND PLACE. Chief Executive, Ipsos MORI
 Ipsos MORI Local PEOPLE, PERCEPTIONS AND PLACE Ben Page Chief Executive, Ipsos MORI It s making the news And we are of course, all Localists now. [We propose] giving local communities the Who power said
The Impact of Welfare Reform in Kingston
 The Impact of Welfare Reform in Kingston October 2013 October 2016 Strategic Business Royal Borough of Kingston upon Thames Contents: Summary p2 Overview p4-15 Trends & Future Changes Across Kingston p16-33
HelptoBuy:ISA(Issue3)
") Page 1 of 4 Please keep for future reference Talk to us in branch HelptoBuy:ISA(Issue3) Key Facts Document (including Financial Services Compensation Scheme (FSCS) Information Sheet & Exclusions List)
Page 1 of 4 Please keep for future reference Talk to us in branch HelptoBuy:ISA(Issue3) Key Facts Document (including Financial Services Compensation Scheme (FSCS) Information Sheet & Exclusions List)
Stockport (Local Authority)
") Population Brinnington & Central (Ward) All Usual Residents (Count) 14999 Area (Hectares) (Count) 527 Females (Count) 7316 Females (Percentage) 48.8 Males (Count) 7683 Males (Percentage) 51.2 Dataset:
Population Brinnington & Central (Ward) All Usual Residents (Count) 14999 Area (Hectares) (Count) 527 Females (Count) 7316 Females (Percentage) 48.8 Males (Count) 7683 Males (Percentage) 51.2 Dataset:
Local Government Pension Scheme (England and Wales) Actuarial valuation as at 31 March 2013 Report on data used for experience analysis
 Actuarial valuation as at 31 March 2013 Report on data used for experience analysis") Date: 2 February 2015 Authors: Ian Boonin FIA Michael Scanlon FIA Contents page 1 Introduction 1 2 Description of movements data provided 2 3 Checks carried out on the data 4 4 Summary of membership movements
Date: 2 February 2015 Authors: Ian Boonin FIA Michael Scanlon FIA Contents page 1 Introduction 1 2 Description of movements data provided 2 3 Checks carried out on the data 4 4 Summary of membership movements
Stockport (Local Authority)
") Population Bramhall North (Ward) All Usual Residents (Count) 13033 Area (Hectares) (Count) 648 Females (Count) 6716 Females (Percentage) 51.5 Males (Count) 6317 Males (Percentage) 48.5 Dataset: KS101 Usual
Population Bramhall North (Ward) All Usual Residents (Count) 13033 Area (Hectares) (Count) 648 Females (Count) 6716 Females (Percentage) 51.5 Males (Count) 6317 Males (Percentage) 48.5 Dataset: KS101 Usual
Page 2
 Dr Margarethe Theseira / July 2014 The findings from this paper helped to inform Centre for London s Hollow Promise report, published September 2014. Hollow Promise: How London fails people on modest incomes
Church Urban Fund s vision is to see people and communities all over England flourish and enjoy life in all its fullness.
 The Diocese of Birmingham Diocesan Briefing 2016 Church Urban Fund s vision is to see people and communities all over England flourish and enjoy life in all its fullness. To this end, we have worked with
Church Urban Fund s vision is to see people and communities all over England flourish and enjoy life in all its fullness.
 The Diocese of Rochester Diocesan Briefing 2016 Church Urban Fund s vision is to see people and communities all over England flourish and enjoy life in all its fullness. To this end, we have worked with
Understanding household income poverty at small area level
 Understanding household income poverty at small area level Robert Fry, Office for National Statistics Abstract A new ONS data release provides experimental estimates of the proportion of households in
MONITORING POVERTY AND SOCIAL EXCLUSION 2013
 MONITORING POVERTY AND SOCIAL EXCLUSION 213 The latest annual report from the New Policy Institute brings together the most recent data to present a comprehensive picture of poverty in the UK. Key points
Church Urban Fund s vision is to see people and communities all over England flourish and enjoy life in all its fullness.
 The Diocese of York Diocesan Briefing 2016 Church Urban Fund s vision is to see people and communities all over England flourish and enjoy life in all its fullness. To this end, we have worked with the
Area Analysis of Child Deprivation 2014 (WIMD Indicators 2014) 1
 1") Area Analysis of Child Deprivation 2014 (WIMD Indicators 2014) 1 This Statistical Article provides an Area Analysis of Child Deprivation in Wales, using some of the indicators underlying the Welsh Index
Area Analysis of Child Deprivation 2014 (WIMD Indicators 2014) 1 This Statistical Article provides an Area Analysis of Child Deprivation in Wales, using some of the indicators underlying the Welsh Index
Statistical Analysis of Worklessness in Southampton Executive Summary
 Statistical Analysis of Worklessness in Southampton Executive Summary The Bargate, Southampton City Centre Submitted to Southampton City Council and SITES by CLREA, Portsmouth Business School, University
Child poverty in Lewisham A briefing for London s councillors. Autumn 2018
 Child poverty in Lewisham A briefing for London s councillors Autumn 2018 Contents Introduction... 3 Rates of child poverty... 5 Low pay... 11 Employment... 14 Housing... 16 Crisis prevention and support...
Notes to help you fill in the Residential Support Scheme (RSS) application
 application") SAMPLE APPLICATION Notes to help you fill in the Residential Support Scheme (RSS) application How do I apply? First complete the application form and ensure you have all supporting documents. Once complete,
SAMPLE APPLICATION Notes to help you fill in the Residential Support Scheme (RSS) application How do I apply? First complete the application form and ensure you have all supporting documents. Once complete,
London labour market projections 2017
 Copyright Greater London Authority August 217 Published by Greater London Authority City Hall The Queen s Walk London SE1 2AA www.london.gov.uk enquiries 2 7983 41 minicom 2 7983 4458 ISBN 978-1-84781-66-3
INDICATORS OF POVERTY AND SOCIAL EXCLUSION IN RURAL ENGLAND: 2009
 INDICATORS OF POVERTY AND SOCIAL EXCLUSION IN RURAL ENGLAND: 2009 A Report for the Commission for Rural Communities Guy Palmer The Poverty Site www.poverty.org.uk INDICATORS OF POVERTY AND SOCIAL EXCLUSION
HelptoBuy:ISA(Issue3)
") Page 1 of 4 Please keep for future reference Talk to us in branch santander.co.uk HelptoBuy:ISA(Issue3) Key Facts Document (including Financial Services Compensation Scheme (FSCS) Information Sheet & Exclusions
Page 1 of 4 Please keep for future reference Talk to us in branch santander.co.uk HelptoBuy:ISA(Issue3) Key Facts Document (including Financial Services Compensation Scheme (FSCS) Information Sheet & Exclusions
Demography and deprivation in Southwark and Tower Hamlets. A paper for the Wakefield and Tetley Trust by the New Policy Institute
 Demography and deprivation in Southwark and Tower Hamlets A paper for the Wakefield and Tetley Trust by the New Policy Institute August 2016 Table of Contents 1. Introduction and summary... 3 1.1. Introduction...
LONDON RESIDENTIAL REVIEW BREXIT AND THE PRIME LONDON PROPERTY MARKET AUTUMN 2016
 LONDON RESIDENTIAL REVIEW BREXIT AND THE PRIME LONDON PROPERTY MARKET AUTUMN 2016 BREXIT VOTE REINFORCES PRICING TRENDS STAMP DUTY REFORMS IMPACT LONDON MARKET SUB- 2 MILLION MARKET OUTPERFORMS LONDON
The Peabody Index. Tracking the financial experiences of London s social housing tenants. Scott Corfe
 The Peabody Index Tracking the financial experiences of London s social housing tenants Scott Corfe SOCIAL MARKET FOUNDATION FIRST PUBLISHED BY The Social Market Foundation, June 2018 11 Tufton Street,
Skills for Health: Skills and Labour Market Intelligence Briefing for London, 2010
 Skills for Health: Skills and Labour Market Intelligence Briefing for London, 2010 All material in this report is, unless otherwise stated, the property of Skills for Health. Copyright and other intellectual
STILL TOO POOR TO PAY
 STILL TOO POOR TO PAY THREE YEARS OF LOCALISED COUNCIL TAX SUPPORT IN LONDON Sam Ashton, Marc Francis and Alice Woudhuysen STILL TOO POOR TO PAY: ThRee YeARS Of LOcALISed council TAx SuPPORT In LOndOn
GLA 2014 round of trend-based population projections - Methodology
 GLA 2014 round of trend-based population projections - Methodology June 2015 Introduction The GLA produces a range of annually updated population projections at both borough and ward level. Multiple different
Technical note: GLA 2011 Round Borough Population Projections
 Technical note: GLA 2011 Round Borough Population Projections Introduction Each year the GLA produces updated borough projections incorporating the latest births, deaths, migration, and development data.
London s Poverty Profile
 London s Poverty Profile Adam Tinson, Carla Ayrton, Karen Barker, Theo Barry Born and Otis Long 2017 London s Poverty Profile 2017 Adam Tinson, Carla Ayrton, Karen Barker, Theo Barry Born and Otis Long
00: WOMEN SAVE 17% MORE IN PROPORTION TO THEIR EARNINGS
 Press Release Embargoed until: 00:01 16.05.09 NOT FOR BROADCAST OR PUBLICATION BEFORE 00.01 HRS Saturday 16 th May 2009 This Halifax Savings Report, part of a series of research pieces published by the
THINGOE SOUTH ELECTORAL DIVISION PROFILE
 THINGOE SOUTH ELECTORAL DIVISION PROFILE 2017 This Division comprises Barrow, Chedburgh, Horringer and Whelnetham and Rougham wards www.suffolkobservatory.info Crown copyright and database rights 2017
Dundee City Electoral Wards Poverty Profile
 Dundee City Electoral Wards Poverty Profile 2013 Produced by: Tony Jenkins Senior Planning Officer (Information & Research) Information & Research Team Chief Executive Department Dundee City Council email:
Nuneaton & Bedworth Local Economic Assessment Summary. October 2011
 Nuneaton & Bedworth Local Economic Assessment Summary October 2011 Disclaimer This report has been prepared by the Warwickshire Observatory and Warwickshire County Council, with all reasonable skill, care,
Michelle Jones, Stephanie Tipping
 Economy READER INFORMATION Need Identified Lead Author Date completed Director approved Economy Michelle Jones, Stephanie Tipping To be signed off To be signed off Key needs Economic inactivity The employment
North Warwickshire Local Economic Assessment Summary. October 2011
 North Warwickshire Local Economic Assessment Summary October 2011 Disclaimer This report has been prepared by the Warwickshire Observatory and Warwickshire County Council, with all reasonable skill, care,
The poisoned chalice. What replacing CTB means for local authorities in England. Peter Kenway
 The poisoned chalice What replacing CTB means for local authorities in England Peter Kenway THE POISONED CHALICE WHAT REPLACING CTB MEANS FOR LOCAL AUTHORITIES IN ENGLAND Peter Kenway Contents Summary
DECEMBER 2006 INFORMING CHANGE. Monitoring poverty and social exclusion in Scotland 2006
 DECEMBER 2006 findings INFORMING CHANGE Monitoring poverty and social exclusion in Scotland 2006 The New Policy Institute has produced its 2006 edition of indicators of poverty and social exclusion in
2016 Statistical Profile. (December 2016 Update) Durham City Major Centre. Altogether better. Durham. Durham Area Action Partnership
 Durham City Major Centre. Altogether better. Durham. Durham Area Action Partnership") 2016 Statistical Profile (December 2016 Update) Durham City Major Centre Altogether better Durham Durham Area Action Partnership Contents Page Map 1 Introduction Geography 2 Background 2 Notes 3 Useful
2016 Statistical Profile (December 2016 Update) Durham City Major Centre Altogether better Durham Durham Area Action Partnership Contents Page Map 1 Introduction Geography 2 Background 2 Notes 3 Useful
2017 Statistical Profile. County Durham. Altogether better. Durham
 2017 Statistical Profile Altogether better Durham Statistical Profile for: Contents Map 1 Introduction Background 2 Notes 2 Useful Links 2 Updates 3 Page Deprivation Background 5 Domains and Geography
LOW INCOME LONDONERS AND WELFARE REFORM A DATA LED INVESTIGATION INTO THE CAUSES AND CONSEQUENCES OF POVERTY
 LOW INCOME LONDONERS AND WELFARE REFORM A DATA LED INVESTIGATION INTO THE CAUSES AND CONSEQUENCES OF POVERTY 1 PHASE ONE FINDINGS, JUNE 2017 Contents Foreword by Jane Mansour... 3 Executive Summary...
Joint Negotiating Committee for Youth and Community Workers
 Joint Negotiating Committee for Youth and Community Workers Staff Side Pay and Conditions Claim 2014 Submitted by Unite, Unison, NUT and UCU June 2014 Contents Introduction...3 Summary of Claim...3 1.
National Flood Risk Assessment Key facts. Environment Agency 1 NaFRA 2005 Key Facts
 National Flood Risk Assessment 2005 Key facts 1 NaFRA 2005 Key Facts We are The. It's our job to look after your environment and make it a better place - for you, and for future generations. Your environment
MONITORING POVERTY AND SOCIAL EXCLUSION 2015
 MONITORING POVERTY AND SOCIAL EXCLUSION 2015 This annual review by the New Policy Institute brings together indicators covering poverty, work, education and housing. It looks at changes over the last parliament
Dundee Partnership Fairness Strategy
 Dundee Partnership Fairness Strategy 2014 Electoral Ward Profile 1 2 Contents Page 1 Introduction 1 2 Poverty Definition 2 2.1 Scottish Index of Multiple Deprivation 2012 2 2.2 Benefit and Tax Credit Data
Ward profile information packs: East Cowes
 % of Island population % of Island population Ward profile information packs: The information within this pack is designed to offer key data and information about this ward in a variety of subjects. It
The Diocese of Chelmsford
 The Diocese of Chelmsford Poverty Briefing 2014 Church Urban Fund s vision is for every church in every community to be involved in tackling poverty, working alongside others to support the poorest and
Stratford-on-Avon Local Economic Assessment Summary. October 2011
 Stratford-on-Avon Local Economic Assessment Summary October 2011 Disclaimer This report has been prepared by the Warwickshire Observatory and Warwickshire County Council, with all reasonable skill, care,
The Diocese of London
 The Diocese of London Poverty Briefing 2014 Church Urban Fund s vision is for every church in every community to be involved in tackling poverty, working alongside others to support the poorest and most
The Diocese of Southwark
 The Diocese of Southwark Poverty Briefing 2014 Church Urban Fund s vision is for every church in every community to be involved in tackling poverty, working alongside others to support the poorest and
Statistics about the Canning Town South Ward, Newham
 National Statistics Online - Statistics about the Ward, This summary gives information on the people living and working within the area, their health and employment status. It also gives information on
Monitoring poverty and social exclusion 2009
 Monitoring poverty and social exclusion 29 December 29 Findings Informing change The New Policy Institute has produced its twelfth annual report of indicators of poverty and social exclusion in the United
Proposal for asset pooling in the LGPS 15 July 2016
 Proposal for asset pooling in the LGPS 15 July 2016 Name of pool London CIV The London CIV was formed as a voluntary collaborative venture by the London Local Authorities in 2014 and has led the way in
Dundee City Poverty Profile
 Dundee City Poverty Profile 2013 Produced by: Tony Jenkins Senior Planning Officer (Information & Research) Information & Research Team Chief Executive Department Dundee City Council email: anthony.jenkins@dundeecity.gov.uk
All people - Economically active - Unemployed London
 All people - Economically active - Unemployed London < 6.02 < 7.84 < 9.66 < 11.48 < 13.3 constituency numbers % Croydon North 9,400 13.3 Poplar and Limehouse 11,600 11.4 Westminster North 6,800 10.9 Tottenham
All people - Economically active - Unemployed London
 All people - Economically active - Unemployed London < 6.02 < 7.84 < 9.66 < 11.48 < 13.3 constituency numbers % Wimbledon #! Westminster North 6,800 10.9 West Ham 7,500 6.8 Walthamstow # # Vauxhall # #
Poverty and income inequality in Scotland:
 A National Statistics Publication for Scotland Poverty and income inequality in Scotland: 2008-09 20 May 2010 This publication presents annual estimates of the proportion and number of children, working
THANET CCG Analysis of Deprived Areas
 THANET CCG Analysis of Deprived Areas In the most deprived decile for Kent January 2016 KCC Public Health is taking a new approach to reducing health inequalities in the county, by producing focussed analysis
The Impacts of Welfare Reform
 The impact of welfare reform across Britain The Impacts of Welfare Reform Steve Fothergill Centre for Regional Economic and Social Research Sheffield Hallam University Publications Hitting the Poorest
Proposal on the provision of magistrates and county court services in London
 Proposal on the provision of magistrates and county court services in London Consultation Paper HMCS CP12/10 Published on 23 June 2010 This consultation will end on 15 September 2010 Proposal on the provision
Financial Intelligence Toolkit. 2018/19 Subscription. Financial Benchmarking - Unit Costs. Newtimber
 Financial Intelligence Toolkit 2018/19 Subscription Financial Benchmarking - Unit Costs Newtimber Overview This report compares unit costs between local authorities in England, using budgeted expenditure
The Impacts of Welfare Reform
 The local and regional impact of welfare reform The Impacts of Welfare Reform Steve Fothergill Centre for Regional Economic and Social Research Sheffield Hallam University Publications Hitting the Poorest
For review, comment and to spark conversations.version as at 01 September 2016
 2.6 Local economy 2.6.1 Markets and sectors This section looks at some of Newcastle s economic strengths together with some of the risks facing the local economy. Note: Gross Value Added (GVA) is the standard
Church Urban Fund s vision is for every church in every community to be involved in tackling poverty,
 The Diocese of York Poverty Briefing 2014 Church Urban Fund s vision is for every church in every community to be involved in tackling poverty, working alongside others to support the poorest and most
The number of unemployed people
 Economic & Labour Market Review Vol 3 No February 9 FEATURE Debra Leaker Trends since the 197s SUMMARY occurs when an individual is available and seeking work but is without work. There are various causes
Age, Demographics and Employment
 Key Facts Age, Demographics and Employment This document summarises key facts about demographic change, age, employment, training, retirement, pensions and savings. 1 Demographic change The population
Ward profile information packs: Wootton Bridge
 % of Island population % of Island population Ward profile information packs: The information within this pack is designed to offer key data and information about this ward in a variety of subjects. It
MOVING ON UP Improving employment outcomes for young black men in London
 MOVING ON UP Improving employment outcomes for young black men in London BRIEFING PAPER No 8 JUNE 2017 Moving on Up is an employment initiative helping young black men to find jobs and careers in London
Ward profile information packs: Ventnor West
 % of Island population % of Island population Ward profile information packs: The information within this pack is designed to offer key data and information about this ward in a variety of subjects. It
Vital Issues. A report commissioned by East End Community Foundation. Written by Dr Megan Ryburn London School of Economics
 Vital Issues 2017 A report commissioned by East End Community Foundation Written by Dr Megan Ryburn London School of Economics Contents Table of Figures... 2 Executive Summary... 3 Introducing Vital Issues...
A Minimum Income Standard for London
 Loughborough University Institutional Repository A Minimum Income Standard for London This item was submitted to Loughborough University's Institutional Repository by the/an author. Citation: VALADEZ,
What salary will a typical first-time buyer need in 2020?
 Research Note What will a typical first-time buyer need in 2020? April 2016 /policylibrary 2010 Shelter. All rights reserved. This document is only for your personal, non-commercial use. You may not copy,
UK in Version 1 Internal Use Only. Ben Page, Chief Executive, Ipsos
 UK in 2015 Version 1 Internal Use Only Ben Page, Chief Executive, Ipsos MORI Ben.page@ipsos.com @benatipsosmori www.ipsos-mori.com Apr-97 Jul-97 Oct-97 Jan-98 Apr-98 Jul-98 Oct-98 Jan-99 Apr-99 Jul-99
MONITORING POVERTY AND SOCIAL EXCLUSION IN SCOTLAND 2015
 MONITORING POVERTY AND SOCIAL EXCLUSION IN SCOTLAND 2015 This study is the seventh in a series of reports monitoring poverty and social exclusion in Scotland since 2002. The analysis combines evidence
Section 4.3a Title: Draft 1 Income
 Section 4.3a Title: Draft 1 Income Contents 1. Overview... 3 2. Story behind the data... 4 Gross full time weekly pay work in local authority... 4 Gross full time weekly pay male residents... 5 Gross full
Ageing across the UK. By James Bayliss and Frances Sly, Office for National Statistics. Introduction. Abstract
 By James Bayliss and Frances Sly, Office for National Statistics Abstract The wellbeing of the older population in the UK is a priority to local and national government and health authorities, as well
PPI Briefing Note Number 97 Page 1 5.9% 5.8% 5.9% 5.7% Source: PPI Aggregate Model
 Briefing Note Number 97 Page 1 Introduction Ahead of the June 2017 general election, the is issuing a series of Briefing Notes summarising some of the key issues surrounding pension policy that are relevant
Child Poverty: Emerging Issues Paper
 Introduction This paper aims to provide a detailed understanding of any emerging issues and data updates linked to child poverty in Warwickshire. The original Child Poverty Needs Assessment produced by
The Diocese of Coventry
 The Diocese of Coventry Poverty Briefing 2014 Church Urban Fund s vision is for every church in every community to be involved in tackling poverty, working alongside others to support the poorest and most