THANET CCG Analysis of Deprived Areas
|
|
|
- Evan Webb
- 5 years ago
- Views:
Transcription


 Rachel Kennard: Senior Intelligence Analyst (rachel.kennard@kent.gov.")
1 THANET CCG Analysis of Deprived Areas In the most deprived decile for Kent January 2016 KCC Public Health is taking a new approach to reducing health inequalities in the county, by producing focussed analysis of LSOAs in the most deprived decile. Multivariate segmentation techniques have been used to identify different types of deprivation in Kent. This report shows our analysis of the most deprived areas in the Thanet CCG area. For more information on the rationale of this approach and our methods, please see the full report: Produced by Dr Wikum Jayatunga: Public Health Registrar (wikum.jayatunga@kent.gov.uk) Rachel Kennard: Senior Intelligence Analyst (rachel.kennard@kent.gov.uk) Natasha Hobbs: Public Health Information Officer (natasha.hobbs@kent.gov.uk) Correspondence to: Rachel Kennard
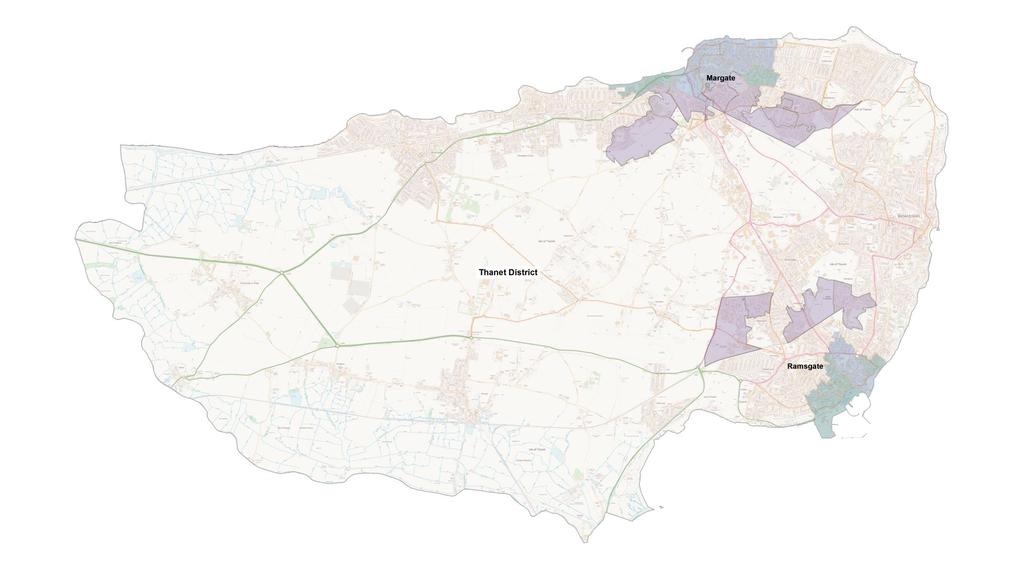
2 Background Thanet is an area in east Kent that includes the coastal towns of Margate, Ramsgate and Broadstairs and surrounding village areas. The Thanet CCG area is coterminous with the district boundaries. Deprivation, crime and unemployment are all statistically higher than the England average, with higher proportions of vulnerable populations. There are limited skilled employment opportunities in the area, although there are good transport links to Kent and London. Health outcomes are worse than for Kent and England, and inequalities are wider than in any other Kent district. A number of Thanet LSOAs feature in the most deprived decile for deprivation in Kent, mainly around the towns of Margate and Ramsgate. Deprived Areas Ward Code Ward Name LSOA Code LSOA Name E E E Margate Central Cliftonville West Dane Valley LSOA rank GP Practice Code Serving LSOA E Thanet 001E 2 G E Thanet 003A 3 G82052 G E Thanet 003B 65 G82052 G82066 G E Thanet 001A 1 G82105 G E Thanet 001D 5 G E Thanet 001B 6 G E Thanet 004A 22 G82052 G E Thanet 001C 42 G82105 G E Thanet 006D 10 G E Thanet 006E 21 G E Thanet 006C 59 G E Thanet 004B 66 G82105 G82066 G E Garlinge E Thanet 005A 55 G82810 G E E E Eastcliff Central Harbour Newington E Thanet 016D 9 G E Thanet 015D 44 G82126 G E Thanet 016E 36 G E Thanet 016C 43 G82126 G82064 G E Thanet 016A 84 G82126 G82064 G E Thanet 013B 11 G E Thanet 013A 40 G82150 G E Northwood E Thanet 013E 17 G82046 G82150 G E Sir Moses Montefiore E Thanet 012C 62 G E Salmestone E Thanet 003D 34 G82052 G82066 G E Westbrook E Thanet 003E 15 G82810 G Type
3 3
 MAIN ISSUES Characteristics Young adults in private rented accommodation Particularly high levels of shared dwellings and")

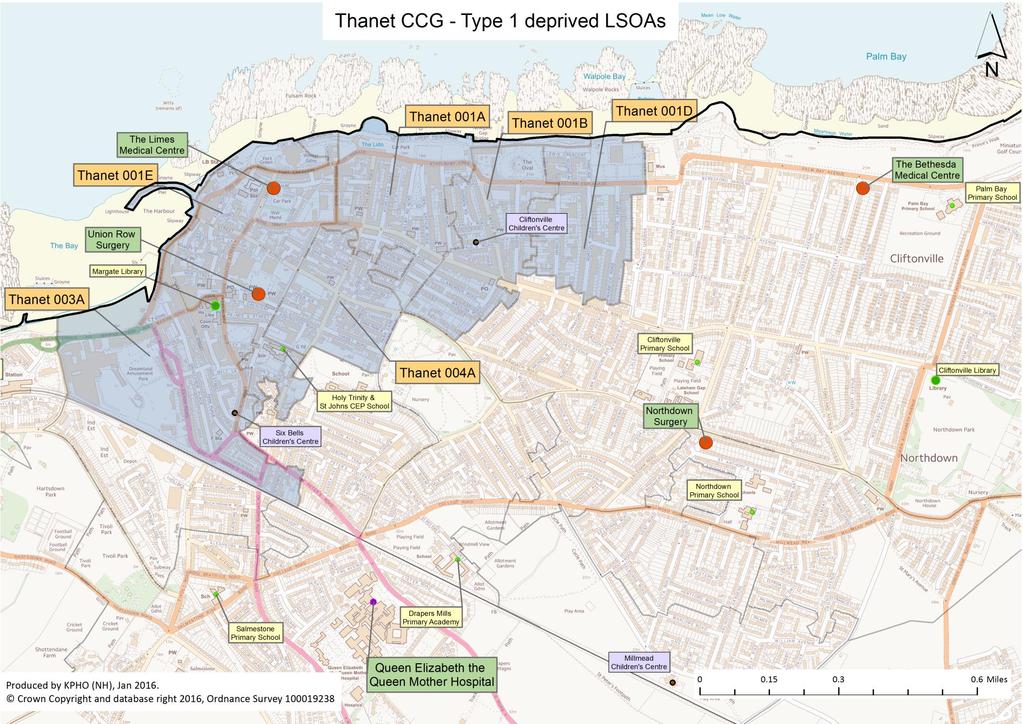
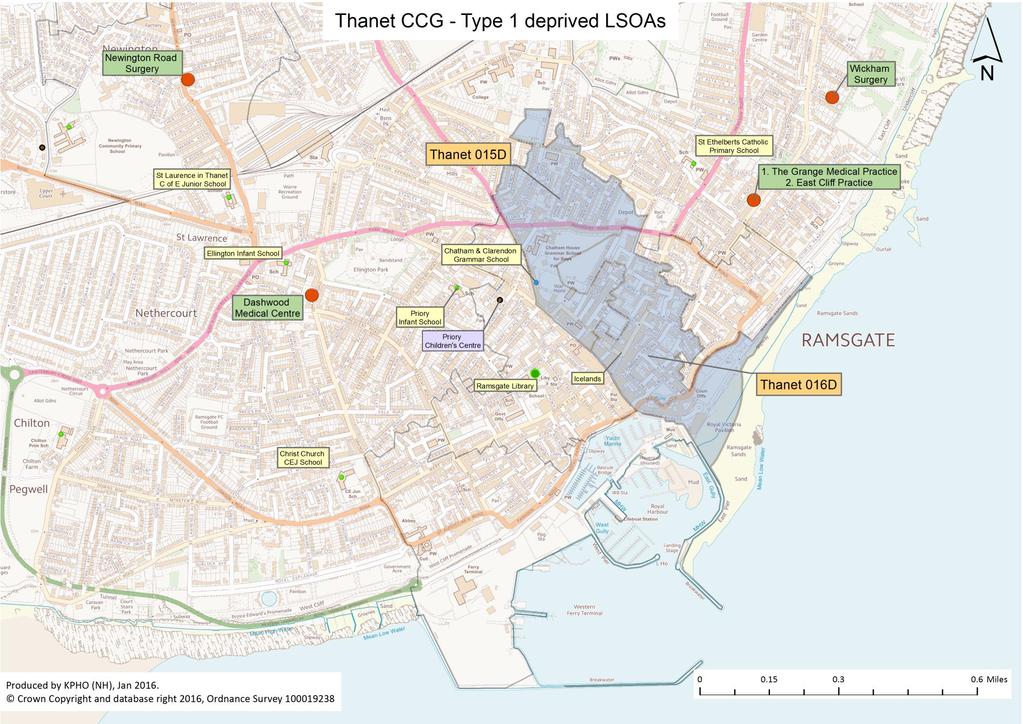
4 Wider Determinants Health Risks/Behaviours Health Outcomes Young people lacking opportunities Thanet CCG Type 1 Deprived LSOAs Health Inequalities: Type 1 LSOAs Thanet CCG Margate Central, Cliftonville West, Eastcliff All Kent 1 st decile LSOAs Type 1 (Thanet CCG) MAIN ISSUES Characteristics Young adults in private rented accommodation Particularly high levels of shared dwellings and overcrowding Particularly poor living environment with particularly high crime rates Low incomes Particularly high levels of out-of-work benefit claimants Poor scores for education Particularly high levels of movement/ transiency Health Risks/Behaviours High smoking prevalence Low levels of wellbeing Health Outcomes 4 Particularly high premature mortality rates Alcohol-related premature mortality and from external causes and respiratory conditions particularly high Particularly high emergency hospital admission rates High rates of disability ( activities limited a lot ) 1 Under 75 mortality: All cause 2 Under 75 mortality: Circulatory 3 Under 75 mortality: Respiratory 4 Under 75 mortality: Cancer 5 Under 75 mortality: External causes 6 Under 75 mortality: Alcohol-related 7 Emergency Admissions 8 Disability: Activities limited 'a lot' 9 Smoking prevalence (modelled) 10 Physically inactive (modelled) 11 Childhood obesity - Year R 12 Childhood obesity - Year 6 13 Eat '5-a-day' fruit & veg (modelled) 14 Mental health prevalence (modelled) 15 Wellbeing: Low life satisfaction (modelled) 16 Wellbeing: Low 'things I do worthwhile' (modelled) 17 Median income (modelled) 18 Benefit claimants (out-of-work benefits) 19 Not school ready (Year R) 20 Do not achieve 5+ good GCSEs 21 No qualifications 22 Education, Training & Skills (IMD domain) 23 No car 24 Tenure: Social Rented 25 Tenure: Private Rented 26 Overcrowding 27 Shared dwellings 28 Transience: Moved in last year 29 Single parents 30 Distance to nearest GP 31 Distance to nearest pharmacy 32 Distance to nearest A&E/Urgent Care centre 33 Crime rate (per 1,000 population) 34 Living environment (IMD domain) 35 Deprivation (IMD) Index (1=same as Kent) POPULATION DISTRIBUTION High numbers young adults and young children KEY FOCUS AREAS: Education and employment opportunities for young people Prepared by KPHO (RK), Jan 2016
5 5
6 6
 1 Under 75 mortality: All cause 2 Under 75 mortality: Circulatory MAIN ISSUES 3 Under 75 mortality: Respiratory 4 Under 75 mortality: Cancer Characteristics")
 10 Physically inactive (modelled) 11 Childhood obesity - Year R 12")
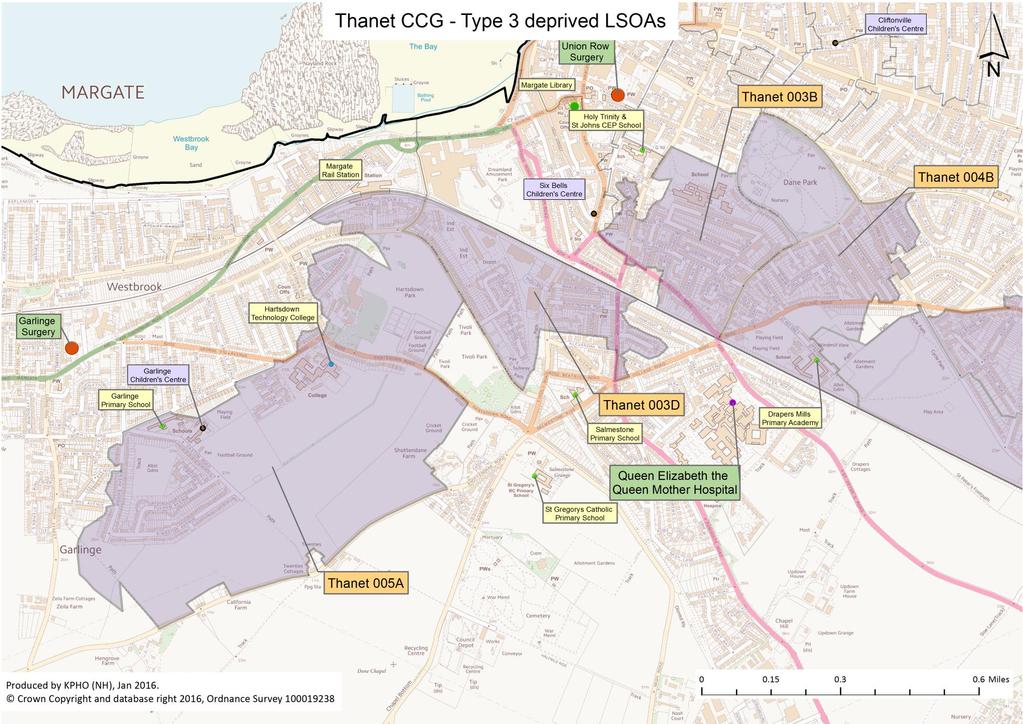
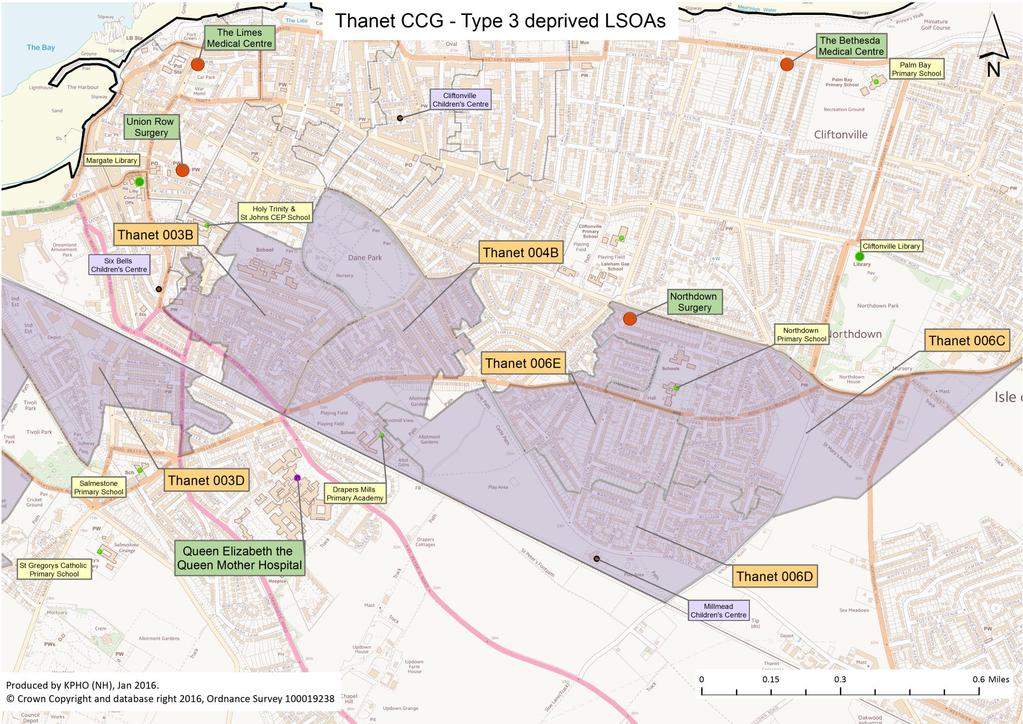
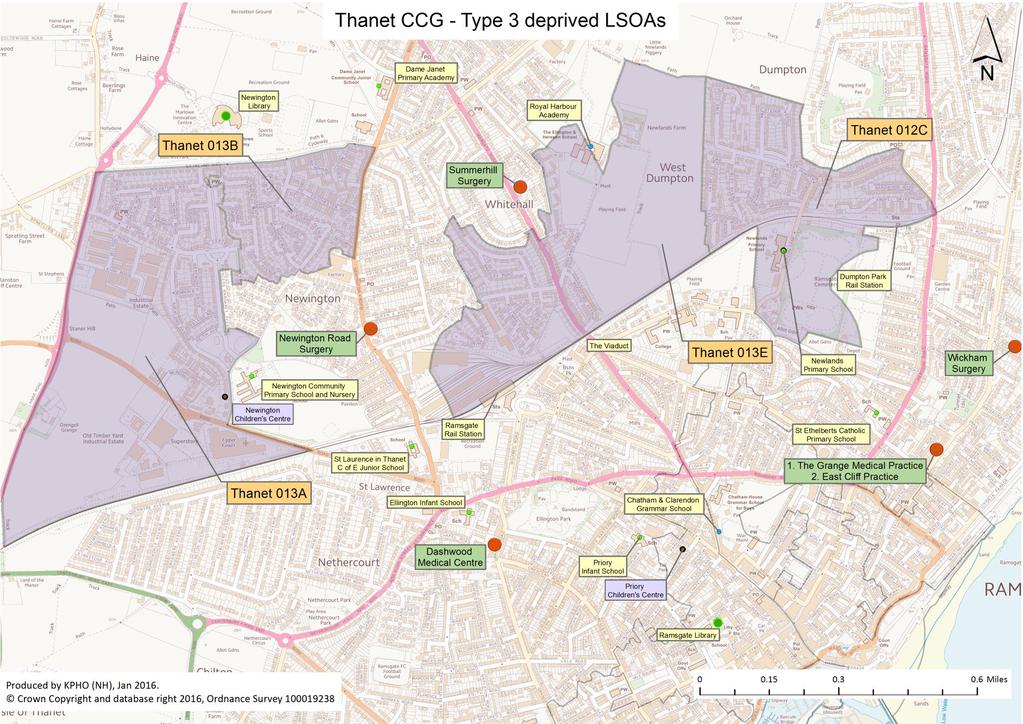
7 Wider Determinants Health Risks/Behaviours Health Outcomes Families in social housing Thanet CCG Type 3 Deprived LSOAs Health Inequalities: Type 3 LSOAs Dane Valley, Thanet CCGarlinge, Newington All Kent 1 st decile LSOAs Type 3 (Thanet CCG) 1 Under 75 mortality: All cause 2 Under 75 mortality: Circulatory MAIN ISSUES 3 Under 75 mortality: Respiratory 4 Under 75 mortality: Cancer Characteristics Families with children in social housing 5 Under 75 mortality: External causes 6 Under 75 mortality: Alcohol-related 7 Emergency Admissions 8 Disability: Activities limited 'a lot' POPULATION DISTRIBUTION Low incomes Poor scores for education High numbers of out-of-work benefits claimants 9 Smoking prevalence (modelled) 10 Physically inactive (modelled) 11 Childhood obesity - Year R 12 Childhood obesity - Year 6 High number of single parents Better living environment and lower crime rates than other deprived areas. 13 Eat '5-a-day' fruit & veg (modelled) 14 Mental health prevalence (modelled) 15 Wellbeing: Low life satisfaction (modelled) 16 Wellbeing: Low 'things I do worthwhile' (modelled) Health Risks/Behaviours 17 Median income (modelled) 18 Benefit claimants (out-of-work benefits) High smoking prevalence Low levels of wellbeing. 19 Not school ready (Year R) 20 Do not achieve 5+ good GCSEs 21 No qualifications 22 Education, Training & Skills (IMD domain) Health Outcomes Fairly high premature mortality rates High emergency hospital admission rates High rates of disability ( activities limited a lot ) 23 No car 24 Tenure: Social Rented 25 Tenure: Private Rented 26 Overcrowding 27 Shared dwellings 28 Transience: Moved in last year 29 Single parents 30 Distance to nearest GP Very high numbers of children Slightly lower numbers of over 50s KEY FOCUS AREAS: 7 31 Distance to nearest pharmacy 32 Distance to nearest A&E/Urgent Care centre 33 Crime rate (per 1,000 population) 34 Living environment (IMD domain) 35 Deprivation (IMD) Training, qualifications and employment for parents Child health and education Index (1=same as Kent) Prepared by KPHO (RK), Jan 2016
8 8
9 9
10 10
 1 Under 75 mortality: All cause 2 Under 75 mortality: Circulatory MAIN ISSUES 3 Under 75 mortality: Respiratory")
 10 Physically inactive (modelled) POPULATION DISTRIBUTION Better educated than the")
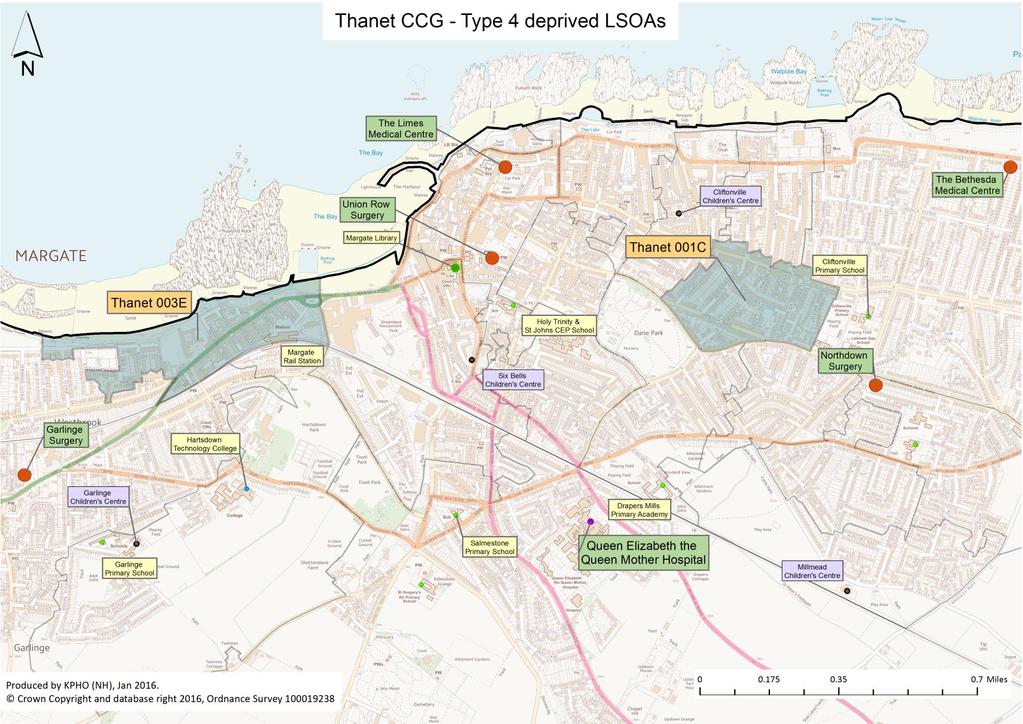
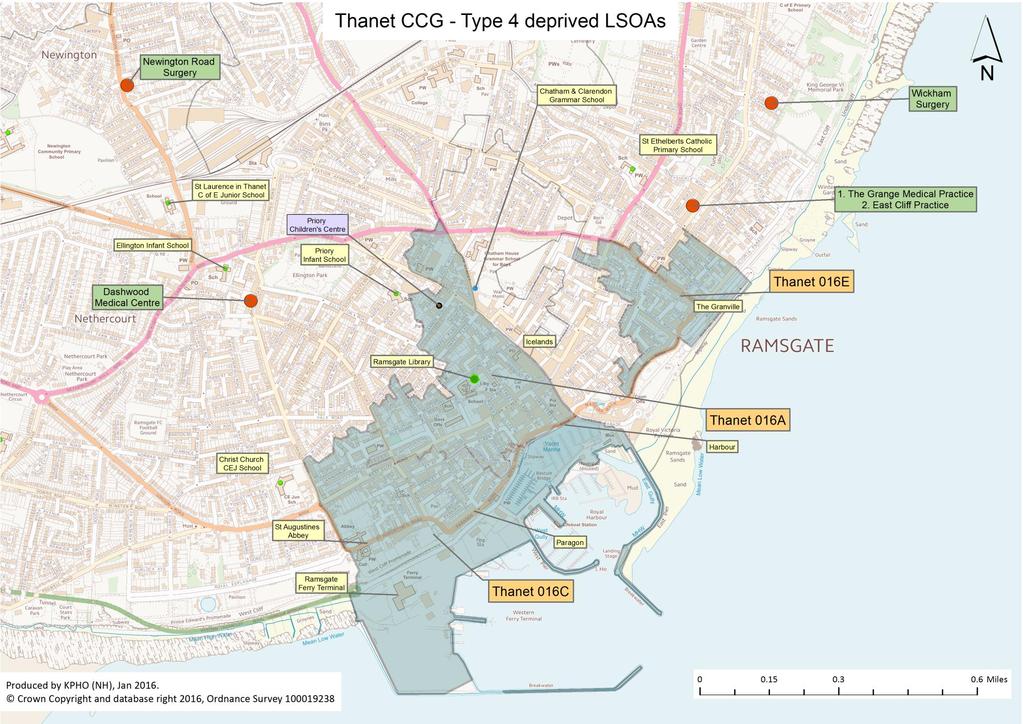
11 Wider Determinants Health Risks/Behaviours Health Outcomes Young people in poor quality accommodation Thanet CCG Type 4 Deprived LSOAs Health Inequalities: Type 4 LSOAs Thanet CCG Central Harbour, Westbrook, Eastcliff, Clinftonville West All Kent 1 st decile LSOAs Type 4 (Thanet CCG) 1 Under 75 mortality: All cause 2 Under 75 mortality: Circulatory MAIN ISSUES 3 Under 75 mortality: Respiratory 4 Under 75 mortality: Cancer Characteristics 5 Under 75 mortality: External causes 6 Under 75 mortality: Alcohol-related Young adults in private rented accommodation High levels of shared dwellings and overcrowding 7 Emergency Admissions 8 Disability: Activities limited 'a lot' 9 Smoking prevalence (modelled) 10 Physically inactive (modelled) POPULATION DISTRIBUTION Better educated than the other deprivation types 11 Childhood obesity - Year R 12 Childhood obesity - Year 6 13 Eat '5-a-day' fruit & veg (modelled) Particularly poor living environment with high crime rates Low incomes, but not as low as other deprivation areas 14 Mental health prevalence (modelled) 15 Wellbeing: Low life satisfaction (modelled) 16 Wellbeing: Low 'things I do worthwhile' (modelled) 17 Median income (modelled) High levels of out-of-work benefit claimants, but not as high has Type I areas Particularly high levels of movement/ transiency 18 Benefit claimants (out-of-work benefits) 19 Not school ready (Year R) 20 Do not achieve 5+ good GCSEs 21 No qualifications 22 Education, Training & Skills (IMD domain) 23 No car Health Risks/Behaviours 24 Tenure: Social Rented 25 Tenure: Private Rented High smoking prevalence Health Outcomes 26 Overcrowding 27 Shared dwellings 28 Transience: Moved in last year High numbers of young adults Low numbers of children and teenagers 11 High premature mortality rates High emergency hospital admission rates High rates of disability ( activities limited a lot ) 29 Single parents 30 Distance to nearest GP 31 Distance to nearest pharmacy 32 Distance to nearest A&E/Urgent Care centre 33 Crime rate (per 1,000 population) 34 Living environment (IMD domain) 35 Deprivation (IMD) Index (1=same as Kent) KEY FOCUS AREAS: Improve living environment and good affordable housing Prepared by KPHO (RK), Jan 2016
12 12
13 13
14 GP Practices GP Practices Serving Deprived LSOAs: Recorded Disease Prevalence For the GP practices that serve LSOAs in the most deprived decile, we have analysed the recorded disease prevalence from QOF data (Quality Outcomes Framework). Note that the data shows recorded disease prevalence, and does not account for undiagnosed disease in the community. Generally high recorded prevalence of Chronic Kidney Disease, COPD, depression and mental illness. Summerhill Surgery, Garlinge Surgery and Northdown Surgery appear to have high recorded disease prevalence across a large number of conditions. GP Practice Atrial Fibrillation Coronary Heart Disease Chronic Kidney Disease Asthma Cancer COPD Diabetes Dementia Epilepsy Depression G82020 The Grange Practice G82046 Summerhill Surgery G82052 The Limes Medical Centre G82064 Dashwood Medical Centre G82066 Northdown Surgery G82105 The Bethesda Medical Centre G82126 East Cliff Medical Practice G82150 Newington Road Surgery G82649 Union Row Surgery G82810 Garlinge Surgery Heart Failure Hypertension Stroke & TIA Mental health Learning Disabilities Denotes value is in the upper quartile for GP practices in Kent Denotes value is in the lower quartile for GP practices in Kent Figures for chronic kidney disease (CKD), epilepsy and depression related to patients aged 18+, figures for diabetes to patients aged 17+. Other measures (including learning disability) related to all ages Source: HSCIC - Quality and Outcomes Framework (QOF) for April March 2015, prepared by KPHO (RK), December
15 Data Sources 1-6 Age-standardised mortality rates, Source: PCMD. 2 ICD10: I00-I99. 3 ICD10: J00-J99. 4 ICD10: C00-C97. 5 ICD10: U00-Y99. 6 ICD10: F10, G31.2, G62.1, I42.6, K29.2, K70, K73, K74, K86.0, X45, X65, Y15. 7 Emergency admissions, 2012/ /14. Source: SUS. 8 % self-reporting day-to-day activities 'limited a lot', Source: Census. 9 Modelled based on smoking prevalence data by Mosaic type. Source: Experian (TGI: 'Heavy', 'Medium' & 'Light' smokers combined). 10 Modelled based on % who do not exercise by Mosaic type. Source: Experian (TGI) % children measured who were obese, 2013/14. Source: NCMP. 13 Modelled based on % who claim to eat '5-a-day' fruit and vegetables by Mosaic type. Source: Experian (TGI). 14 Modelled mental health prevalence based on GP practice-level data, 2014/15. Source: QOF Modelled wellbeing based on ONS Annual Population Survey (APS) data by Acorn type, 2011/12. Source: DCLG. 15 % scoring 0-6 for 'Overall, how satisfied are you with your life nowadays?' 16 % scoring 0-6 for 'Overall, to what extent do you feel the things you do in your life are worthwhile?' 17 Modelled based on median household income data by Mosaic type. Source: Experian (ConsumerView). 18 % claiming out of work benefits (defined as all those aged who are jobseekers, claiming ESA & incapacity benefits, lone parents claiming Income Support and others on income related benefits), February Source: DWP (from Nomis). 19 % Year R pupils not achieving a good level of development, Source: KCC, MIU. 20 % pupils not achieving 5+ A*-C GCSEs (including English & Maths) at the end of Key Stage 4, Source: KCC, MIU. 21 % with no qualifications (based on persons aged 16+), Source: Census. 22 Education, Training & Skills IMD domain (average score), Source: DCLG. 23 % of households with no car or van, Source: Census. 24 % of households living in social rented accommodation, Source: Census. 25 % of households living in private rented accommodation, Source: Census. 26 % of households with an occupancy rating of -2 (i.e. with 2 too few rooms), Source: Census. 27 % of households with accommodation type 'shared dwellings', Source: Census. 28 % of households not living at the same address a year ago, Source: Census. Please note that OAs E & E have been removed from this analysis due to the undue influence of Eastchurch prison on levels of transience. 29 % of households with no adults or one adult and one or more children, Source: Census Distance to nearest GP/pharmacy/A&E or Urgent Care centre (in miles, as the crow flies from population weighted centroid of LSOA), Source: KCC Business Intelligence. 33 Crime rate (recorded crime per 1,000 population), Oct Sept Source: data.police.uk. 34 Living Environment IMD domain (average score), Source: DCLG. 35 Index of Multiple Deprivation (IMD) (average score), Source: DCLG. 15
Kent Mental Health & Wellbeing Index Local Wellbeing Tool
 Kent Mental Health & Wellbeing Index Local Wellbeing Tool Technical Report July 2016 Produced by Jessica Mookherjee: Public Health Consultant (Jessica.Mookherjee@kent.gov.uk) Gerrard Abi-Aad: Head of Public
Stockport (Local Authority)
") Population Brinnington & Central (Ward) All Usual Residents (Count) 14999 Area (Hectares) (Count) 527 Females (Count) 7316 Females (Percentage) 48.8 Males (Count) 7683 Males (Percentage) 51.2 Dataset:
Population Brinnington & Central (Ward) All Usual Residents (Count) 14999 Area (Hectares) (Count) 527 Females (Count) 7316 Females (Percentage) 48.8 Males (Count) 7683 Males (Percentage) 51.2 Dataset:
Stockport (Local Authority)
") Population Bramhall North (Ward) All Usual Residents (Count) 13033 Area (Hectares) (Count) 648 Females (Count) 6716 Females (Percentage) 51.5 Males (Count) 6317 Males (Percentage) 48.5 Dataset: KS101 Usual
Population Bramhall North (Ward) All Usual Residents (Count) 13033 Area (Hectares) (Count) 648 Females (Count) 6716 Females (Percentage) 51.5 Males (Count) 6317 Males (Percentage) 48.5 Dataset: KS101 Usual
Wider determinants of health
 3 Wider determinants of health A variety of factors, both social and environmental, impact on an individual s health. This chapter considers how these wider determinants of health are at work in Southwark.
PERRY BARR DISTRICT PROFILE June 2015
 PERRY BARR DISTRICT PROFILE June 2015 Key information: In 2013 the estimated population of Perry Barr district was 108,807; this represents 10% of Birmingham s population. 87.6% of its population are under
Local Insight profile for Brighton & Hove GP Cluster 4 area
 1 Local Insight profile for Brighton & Hove GP Cluster 4 area Report created 11 September 2017 Practices in Cluster 4 Hove Medical Centre Links Road Surgery Mile Oak Medical Centre Portslade Health Centre
Neighbourhoods. The English Indices of Deprivation Bradford District. Neighbourhoods. Statistical Release. June 2011.
 Neighbourhoods Statistical Release The English Indices of Deprivation 2010 Bradford District About this release This release provides an overview of the findings of the English Indices of Deprivation 2010
West Lothian Health and Wellbeing Profiles key indicators and overview
 West Lothian Health and Wellbeing Profiles key indicators and overview Cite as: Millard A, McCartney G, MacKinnon A, Van Heelsum A, Gasiorowski A, Barkat S. West Lothian Health and Wellbeing Profiles key
City of Edinburgh Health and Wellbeing Profiles key indicators and overview
 City of Edinburgh Health and Wellbeing Profiles key indicators and overview Cite as: Millard A, McCartney G, MacKinnon A, Van Heelsum A, Gasiorowski A, Barkat S. City of Edinburgh Health and Wellbeing
Aberdeen City Health and Wellbeing Profiles key indicators and overview
 Aberdeen City Health and Wellbeing Profiles key indicators and overview Cite as: Millard A, McCartney G, MacKinnon A, Van Heelsum A, Gasiorowski A, Barkat S. Aberdeen City Health and Wellbeing Profiles
South Lanarkshire Health and Wellbeing Profiles key indicators and overview
 South Lanarkshire Health and Wellbeing Profiles key indicators and overview Cite as: Millard A, McCartney G, MacKinnon A, Van Heelsum A, Gasiorowski A, Barkat S. South Lanarkshire Health and Wellbeing
North Lanarkshire Health and Wellbeing Profiles key indicators and overview
 North Lanarkshire Health and Wellbeing Profiles key indicators and overview Cite as: Millard A, McCartney G, MacKinnon A, Van Heelsum A, Gasiorowski A, Barkat S. North Lanarkshire Health and Wellbeing
Dumfries & Galloway Health and Wellbeing Profiles key indicators and overview
 Dumfries Galloway Health and Wellbeing Profiles key indicators and overview Cite as: Millard A, McCartney G, MacKinnon A, Van Heelsum A, Gasiorowski A, Barkat S. Dumfries Galloway Health and Wellbeing
Shetland Islands Health and Wellbeing Profiles key indicators and overview
 Shetland Islands Health and Wellbeing Profiles key indicators and overview Cite as: Millard A, McCartney G, MacKinnon A, Van Heelsum A, Gasiorowski A, Barkat S. Shetland Islands Health and Wellbeing Profiles
Inverclyde Health and Wellbeing Profiles key indicators and overview
 Inverclyde Health and Wellbeing Profiles key indicators and overview Cite as: Millard A, McCartney G, MacKinnon A, Van Heelsum A, Gasiorowski A, Barkat S. Inverclyde Health and Wellbeing Profiles key indicators
Haxby and Wigginton Ward Profile York Summary
 Summary has 204,439 residents with 9.8% from a black and minority ethnic community group. 83.9% are in good health, with 15.3% stating that they have some limitation in day to day activities. 537.41 was
Age UK Waltham Forest Profile: Deprivation in Waltham Forest 08/01/2013
 Age UK Waltham Forest Profile: Deprivation in Waltham Forest 08/01/2013 Population Waltham Forest (WF) has a population of some 258,249 1 persons living in 96,861 households. There are 57,000 people aged
Local Insight profile for Knoll Estate area. Brighton and Hove. Report created 22 July 2015
 1 Local Insight profile for Knoll Estate area Brighton and Hove Report created 22 July 21 Finding your way around this Local Insight profile 2 Introduction Page 3 for an introduction to this report There
NISRA Merged Report. Area Profile Report. Created Wednesday, December 30, :22 PM. Page 1
 Area Profile Report Created Wednesday, December 30, 2015 5:22 PM Page 1 Population Estimates for Carrickfergus Local Government District The estimated population of Carrickfergus Local Government District
Scottish Indices of Multiple Deprivation (SIMD)
") Scottish Indices of Multiple Deprivation (SIMD) The dataset for the Lothian NHS Board Public Health Annual Report 2004 uses the Scottish Indices of Multiple Deprivation (SIMD). These indices are the most
Scottish Indices of Multiple Deprivation (SIMD) The dataset for the Lothian NHS Board Public Health Annual Report 2004 uses the Scottish Indices of Multiple Deprivation (SIMD). These indices are the most
NISRA Merged Report. Area Profile Report. Created Monday, January 07, :39 PM. Page 1
 Area Profile Report Created Monday, January 07, 2013 5:39 PM Page 1 Census 2011 Population Statistics for Cookstown Local Government District This page provides information on the 2011 Census for Cookstown
Profile: Wheldrake 198,051 residents 83,552 houses City of York Council Population
 York Summary York has 198,51 residents with 9.8% from a black and minority ethnic community group. 84% are in good health, with 15.3% stating they have some limitation in day to day activities. Males can
Indices of Deprivation 2010
 Indices of Deprivation 2010 Dudley Borough Statistics Corporate Policy & Research Team Indices of Deprivation 2010 Introduction The Indices of Deprivation (ID) 2010 is a measure of deprivation at a small
INDICATORS OF POVERTY AND SOCIAL EXCLUSION IN RURAL ENGLAND: 2009
 INDICATORS OF POVERTY AND SOCIAL EXCLUSION IN RURAL ENGLAND: 2009 A Report for the Commission for Rural Communities Guy Palmer The Poverty Site www.poverty.org.uk INDICATORS OF POVERTY AND SOCIAL EXCLUSION
Deprivation in Rochdale Borough Indices of Deprivation 2004 (Revised)
") Deprivation in Rochdale Borough Indices of Deprivation 2004 (Revised) Summary New Indices of Deprivation (ID 2004) were published on 28 April 2004, based on data from 2001. These were subsequently revised
Deprivation in Rochdale Borough Indices of Deprivation 2004 (Revised) Summary New Indices of Deprivation (ID 2004) were published on 28 April 2004, based on data from 2001. These were subsequently revised
State of the City 2016
 Salford City Council State of the City 2016 Narrative Summary 1. Overview 1.1. Methodology 1.1.1. There are three alternative but related population projections / forecasts available for the City of Salford.
Southwark A profile of socio-economic determinants of health during the economic downturn
 A profile of socio-economic determinants of health during the economic downturn This profile provides an overview of socioeconomic determinants of health in this borough during the economic downturn. It
Huntington and New Earswick. York Summary
 Huntington and New Earswick York Summary York has 202,433 residents with 9.8% from a black and minority ethnic community group. 84% are in good health, with 15.3% stating they have some limitation in day
Huntington and New Earswick
 York Summary York has 198,51 residents with 9.8% from a black and minority ethnic community group. 84% are in good health, with 15.3% stating they have some limitation in day to day activities. Males can
Statement of Intent Flexible Eligibility
 Statement of Intent Flexible Eligibility Name of Local Authority: Rushcliffe Borough Council Date of Publication: 12 September 2017 1. Introduction Nottinghamshire District & Borough Councils are targeting
Local Insight profile for Brighton & Hove GP Cluster 3 area
 1 Local Insight profile for Brighton & Hove GP Cluster 3 area PRACTICES IN CLUSTER 3 Beaconsfield Medical Practice Preston Park Surgery Stanford Medical Centre Warmdene Surgery Report created 9 February
Profile of Westy situated in Latchford East, Warrington. Map 1: Westy the Big Local Area
 Profile of Westy situated in Latchford East, Map 1: Westy the Big Local Area 1 Contents of the profile: 1. People and population pages 4-8 Population by age Ethnic groups Country of birth Household language
North Locality Profile
 North Locality Profile December 2017 Contact: Elaine McConnachie Public Health Co-ordinator North Locality Aberdeen Health & Social Care Partnership Old Aberdeen Medical Practice 12 Sunnybank Road ABERDEEN
QUALICUM Local Health Area Profile 2015
 QUALICUM Local Health Area Profile 2015 Qualicum Local Health Area (LHA) is one of 14 LHAs in Island Health and is located in Island Health s Central Health Service Delivery Area (HSDA). Qualicum is at
Public Health Outcomes Framework. Summary for Eastbourne. Indicators at a glance (February 2017)
") Public Health Outcomes Framework Indicators at a glance (February 2017) Notes: - Value cells are shaded red, amber or green to show significance compared to England, or where the value can be benchmarked
Public Health Outcomes Framework Indicators at a glance (February 2017) Notes: - Value cells are shaded red, amber or green to show significance compared to England, or where the value can be benchmarked
Rural community profile for Bishop Sutton (Rural place) Action with Communities in Rural England (ACRE) Rural evidence project December 2013
 Action with Communities in Rural England (ACRE) Rural evidence project December 2013") 1 Rural community profile for Bishop Sutton (Rural place) Action with Communities in Rural England (ACRE) Rural evidence project December 213 Finding your way around this profile report 2 A national review
1 Rural community profile for Bishop Sutton (Rural place) Action with Communities in Rural England (ACRE) Rural evidence project December 213 Finding your way around this profile report 2 A national review
Harrogate & Knarsborough ACC Area Pack
 Item 7 CORRECTED REPORT CIRCULATED AFTER MEETING Harrogate & Knarsborough ACC Area Pack This pack contains the following: Topline statistics & key topics. Map of area highlighting areas of interest. Local
CAMPBELL RIVER Local Health Area Profile 2015
 CAMPBELL RIVER Local Health Area Profile 215 Campbell River Local Health Area (LHA) is one of 14 LHAs in Island Health and is located in Island Health s North Island Health Service Delivery Area (HSDA).
Rural community profile for Threlkeld (Parish) Action with Communities in Rural England (ACRE) Rural evidence project October 2013
 Action with Communities in Rural England (ACRE) Rural evidence project October 2013") 1 Rural community profile for Threlkeld (Parish) Action with Communities in Rural England (ACRE) Rural evidence project October 213 Finding your way around this profile report 2 A national review carried
1 Rural community profile for Threlkeld (Parish) Action with Communities in Rural England (ACRE) Rural evidence project October 213 Finding your way around this profile report 2 A national review carried
Rural community profile for Cockermouth (Parish) Action with Communities in Rural England (ACRE) Rural evidence project October 2013
 Action with Communities in Rural England (ACRE) Rural evidence project October 2013") 1 Rural community profile for Cockermouth (Parish) Action with Communities in Rural England (ACRE) Rural evidence project October 213 Finding your way around this profile report 2 A national review carried
1 Rural community profile for Cockermouth (Parish) Action with Communities in Rural England (ACRE) Rural evidence project October 213 Finding your way around this profile report 2 A national review carried
Health and Work Spotlight on Mental Health. Mental health conditions are a leading cause of sickness absence in the UK.
 Spotlight on Mental Health Almost 1in6 people of working age have a diagnosable mental health condition Mental health conditions are a leading cause of sickness absence in the UK OVER 15m days were lost
HEALTH AND WELLBEING: AGEING WORKFORCE
 HEALTH AND WELLBEING: AGEING WORKFORCE DR NATHAN LANGSLEY BMEDSCI, MB BS, MRCPSYCH, MPHIL Welcome My details Scope of the talk Apologies for terminology eg older or ageing Apologies that some stats (eg
Nuneaton & Bedworth Local Economic Assessment Summary. October 2011
 Nuneaton & Bedworth Local Economic Assessment Summary October 2011 Disclaimer This report has been prepared by the Warwickshire Observatory and Warwickshire County Council, with all reasonable skill, care,
ESOL Neighbourhood Audit Pilot (Harehills, Leeds) Annex 1: Demographic study of Harehills
 Annex 1: Demographic study of Harehills") ESOL Neighbourhood Audit Pilot (Harehills, ) Annex 1: Demographic study of Harehills May 2011-0 - Contents Introduction... 2 Gender profile... 3 Age profile... 3 Ethnic breakdown... 5 Religion... 6 Levels
ESOL Neighbourhood Audit Pilot (Harehills, ) Annex 1: Demographic study of Harehills May 2011-0 - Contents Introduction... 2 Gender profile... 3 Age profile... 3 Ethnic breakdown... 5 Religion... 6 Levels
Health and Work Spotlight on Mental Health. Mental health conditions are a leading cause of sickness absence in the UK.
 Spotlight on Mental Health Almost 1in6 people of working age have a diagnosable mental health condition Mental health conditions are a leading cause of sickness absence in the UK OVER 15m days were lost
Indices of Deprivation 2015: Swindon Pharmaceutical Needs Assess Swindon Research Report
 Indices of Deprivation 2015: Swindon Pharmaceutical Needs Assess Swindon Research Report 2015 2018 Swindon Health and Wellbeing Board Publication date: March 2015 Page 1 Contents Contents... 2 Executive
Intelligence Briefing English Indices of Deprivation 2010 A London perspective. June 2011
 Intelligence Briefing 2011-06 June 2011 English Indices of Deprivation 2010 A London perspective For more information please contact: Rachel Leeser Intelligence Unit Greater London Authority City Hall
Dr Rachel Loopstra King s College
 Financial insecurity, food insecurity, and disability: the profile of people receiving emergency food assistance from The Trussell Trust Foodbank Network in Britain. Dr Rachel Loopstra King s College London
Key Findings: For Decision Makers to Consider:
 Key Findings: Since 2007, the population of Havering has been growing at a faster rate than the England average, and this is expected to continue in the future, with the population rising by 8.3% by 2020
Public Health Portfolio Plan 2013/ /16
 Public Health Portfolio Plan 2013/14 2015/16 V17 22/08/13 Portfolio Policy Policy Overview by Lead Member i) The Coalition Government has laid out a comprehensive plan of change across the National Health
North Warwickshire Local Economic Assessment Summary. October 2011
 North Warwickshire Local Economic Assessment Summary October 2011 Disclaimer This report has been prepared by the Warwickshire Observatory and Warwickshire County Council, with all reasonable skill, care,
Rural community profile for Henley-on-Thames (Parish) Action with Communities in Rural England (ACRE) Rural evidence project November 2013
 Action with Communities in Rural England (ACRE) Rural evidence project November 2013") 1 Rural community profile for Henley-on-Thames (Parish) Action with Communities in Rural England (ACRE) Rural evidence project November 213 Finding your way around this profile report 2 A national review
1 Rural community profile for Henley-on-Thames (Parish) Action with Communities in Rural England (ACRE) Rural evidence project November 213 Finding your way around this profile report 2 A national review
Addressing Worklessness and Health the potential role of Government. Dr Bill Gunnyeon Chief Medical Adviser Department for Work and Pensions
 Addressing Worklessness and Health the potential role of Government Dr Bill Gunnyeon Chief Medical Adviser Department for Work and Pensions Key Issues Taking an holistic approach Reducing the potential
Stratford-on-Avon Local Economic Assessment Summary. October 2011
 Stratford-on-Avon Local Economic Assessment Summary October 2011 Disclaimer This report has been prepared by the Warwickshire Observatory and Warwickshire County Council, with all reasonable skill, care,
York Profile Summary
 Summary has 28,163 residents with 5.7% from a black and minority ethnic community group. 83.9% are in good health, with 15.3% stating that they have some limitation in day to day activities. 637.58 was
Two Islingtons: Understanding the problem
 www.islington.gov.uk/fairness Two Islingtons: Understanding the problem Paper 1: What is the picture for Islington? Understanding the evidence base Introduction 1. It has become rather clichéd to say that
The Gazetteer for Scotland, Used with permission from The Gazetteer for Scotland at
 The Gazetteer for Scotland, 1995-2007 Used with permission from The Gazetteer for Scotland at http://www.geo.ed.ac.uk/scotgaz/ A Profile of Moray Moray is the 8 th largest Council area in Scotland, covering
Demography and deprivation in Southwark and Tower Hamlets. A paper for the Wakefield and Tetley Trust by the New Policy Institute
 Demography and deprivation in Southwark and Tower Hamlets A paper for the Wakefield and Tetley Trust by the New Policy Institute August 2016 Table of Contents 1. Introduction and summary... 3 1.1. Introduction...
THINGOE SOUTH ELECTORAL DIVISION PROFILE
 THINGOE SOUTH ELECTORAL DIVISION PROFILE 2017 This Division comprises Barrow, Chedburgh, Horringer and Whelnetham and Rougham wards www.suffolkobservatory.info Crown copyright and database rights 2017
Rural community profile for Houghton on the Hill (Parish) Action with Communities in Rural England (ACRE) Rural evidence project October 2013
 Action with Communities in Rural England (ACRE) Rural evidence project October 2013") 1 Rural community profile for Houghton on the Hill (Parish) Action with Communities in Rural England (ACRE) Rural evidence project October 213 Finding your way around this profile report 2 A national review
1 Rural community profile for Houghton on the Hill (Parish) Action with Communities in Rural England (ACRE) Rural evidence project October 213 Finding your way around this profile report 2 A national review
Paper 5b. PMS Contract Reviews.
 Paper 5b PMS Contract Reviews 18 August 2015 PMS Contract Reviews In February 2014 Area Teams received guidance setting out a requirement to review all PMS contracts by March 2016. The purpose of the review
The Diocese of London
 The Diocese of London Poverty Briefing 2014 Church Urban Fund s vision is for every church in every community to be involved in tackling poverty, working alongside others to support the poorest and most
The Diocese of Chelmsford
 The Diocese of Chelmsford Poverty Briefing 2014 Church Urban Fund s vision is for every church in every community to be involved in tackling poverty, working alongside others to support the poorest and
Tomintoul, Moray. Area profile
 Tomintoul, Moray Area profile Situated at 1,164 feet above sea level Tomintoul is the highest village in the Highlands and lies some 37 miles south of Elgin, with a population of 716 (Census 2011). Located
Note that data will change regularly as information is updated on Local Insight. This report was correct at the date of publication.
 OXFORDSHIRE NEEDS ANALYSIS Loneliness and Isolation This report was produced by Oxfordshire Community Foundation using community mapping and reporting tool Local Insight. This tool has been developed by
NHS North Central London Commissioning Strategy and QIPP Plan 2012/ /15
 NHS North Central London Commissioning Strategy and QIPP Plan 2012/13-2014/15 Joint Health Overview and Scrutiny Committee 9 th July 2012 Sylvia Kennedy AD Strategy & Planning www.ncl.nhs.uk Key messages
Monitoring poverty and social exclusion 2009
 Monitoring poverty and social exclusion 29 December 29 Findings Informing change The New Policy Institute has produced its twelfth annual report of indicators of poverty and social exclusion in the United
Multinational Comparisons of Health Systems Data, 2010
 1 Multinational Comparisons of Health Systems Data, 21 Gerard F. Anderson and Patricia Markovich Johns Hopkins University November 21 Support for this research was provided by The Commonwealth Fund. 2
The Diocese of Coventry
 The Diocese of Coventry Poverty Briefing 2014 Church Urban Fund s vision is for every church in every community to be involved in tackling poverty, working alongside others to support the poorest and most
Church Urban Fund s vision is for every church in every community to be involved in tackling poverty,
 The Diocese of York Poverty Briefing 2014 Church Urban Fund s vision is for every church in every community to be involved in tackling poverty, working alongside others to support the poorest and most
OPJSNA Factsheet 2: Wider determinants of Health in Older People (Income, Benefits and Poverty)
") OPJSNA Factsheet 2: Wider determinants of Health in Older People (Income, Benefits and Poverty) Summary Having sufficient income is a key factor in older people maintaining health, well-being and independence.
OPJSNA Factsheet 2: Wider determinants of Health in Older People (Income, Benefits and Poverty) Summary Having sufficient income is a key factor in older people maintaining health, well-being and independence.
STRATHMARTINE. Census Profile. Local Community Planning Partnership. dundee. Working together to make Dundee a better place
 dundee STRATHMARTINE Census Profile Local Community Planning Partnership Ardler Baldragon Caird Park Camperdown Country Park Clatto Downfield & The Dales Dunsinane North Kirkton & Trottick Sherbrook St
WESTBOURNE MASTERPLAN AREA
 WESTBOURNE MASTERPLAN AREA HEALTH AND WELLBEING NEEDS ASSESSMENT WWW.JSNA.INFO Chapter 1 Introduction Aim of the Document Provide descriptive overview of demographics and health needs of the population
Deprivation in East Sussex Indices of Deprivation 2007
 Deprivation in East Sussex Indices of Deprivation 2007 The new Indices of Deprivation 2007 (ID 2007) have recently been released by the Department for Communities and Local Government (DCLG). They update
Happy City Index 2016 Report
 Happy City Index 2016 Report Produced in 2016 by Sam Wren Lewis with support from Saamah Abdallah and the Happy City Measurement & Policy Team Special thanks to Cara Marie O Keeffe and Zoe Travers 1 Contents
Indices of Deprivation
 DEPARTMENT OF SOCIAL POLICY AND INTERVENTION Indices of Deprivation Mapping the spatial distribution of multiple deprivation at small area level and their uses for targeting area-based regeneration policies
Mapping customer vulnerability: Methodology
 Mapping customer vulnerability: Methodology Report to Western Power Distribution March 2017 Lead Author: Toby Bridgeman Mapping customer vulnerability: Methodology March 2017 Contents 1. Introduction...
English Indices of Deprivation 2015 Bradford District in focus
 Understanding Bradford District 1. Background English Indices of Deprivation 2015 Bradford District in focus 15 th October 2015 This briefing provides an overview of the findings of the English Indices
Health Inequalities the Northern Ireland context. Dr Michael McBride Chief Medical Officer DHSSPS
 Health Inequalities the Northern Ireland context Dr Michael McBride Chief Medical Officer DHSSPS That Poverty is associated with ill health must always have been obvious, except to those who did not care
Marmot Indicators 2015 A preliminary summary with graphs
 Marmot Indicators 2015 A preliminary summary with graphs Marmot Indicators 2015 Fair Society, Healthy Lives, The Marmot Review was published in 2010 i. The review set out the key areas that needed to be
Ward profile information packs: East Cowes
 % of Island population % of Island population Ward profile information packs: The information within this pack is designed to offer key data and information about this ward in a variety of subjects. It
Population health profile of the. Northern Rivers. Division of General Practice
 Population health profile of the Northern Rivers Division of General Practice Population Profile Series: No. 23 PHIDU November 2005 Copyright Commonwealth of 2005 This work may be reproduced and used subject
The Social Report 2007 A summary
 The Social Report 2007 A summary Level 7, 45 Johnston St, PO Box 10 617, Wellington, New Zealand P 04 499 3088 F 04 499 3414 E info@researchnz.com W www.researchnz.com 2008 Research New Zealand Contents
Ward profile information packs: Wootton Bridge
 % of Island population % of Island population Ward profile information packs: The information within this pack is designed to offer key data and information about this ward in a variety of subjects. It
The Diocese of Southwark
 The Diocese of Southwark Poverty Briefing 2014 Church Urban Fund s vision is for every church in every community to be involved in tackling poverty, working alongside others to support the poorest and
Merton CCG Balanced Scorecard Reporting period: Q1 NHSE Q2 NHSE Q3 (CCG Rating)
") Merton CCG Balanced Scorecard Reporting period: Q1 NHSE Q2 NHSE Q3 (CCG Rating) re local people getting good quality care? mber/green mber/green mber/green re patient rights under the NHS Constitution
Merton CCG Balanced Scorecard Reporting period: Q1 NHSE Q2 NHSE Q3 (CCG Rating) re local people getting good quality care? mber/green mber/green mber/green re patient rights under the NHS Constitution
Scottish Index of Multiple Deprivation (SIMD) 2009: Focus on Glenrothes. Scottish Index of Multiple Deprivation 2009: Focus on North East Fife
 2009: Focus on Glenrothes. Scottish Index of Multiple Deprivation 2009: Focus on North East Fife") 1 Summary Analysis of the Scottish Index of Multiple Deprivation (SIMD) shows that North East Fife has one area - Cupar North West - which features in the 20% most deprived for Scotland. The rural nature
1 Summary Analysis of the Scottish Index of Multiple Deprivation (SIMD) shows that North East Fife has one area - Cupar North West - which features in the 20% most deprived for Scotland. The rural nature
MONITORING POVERTY AND SOCIAL EXCLUSION IN NORTHERN IRELAND 2016
 MONITORING POVERTY AND SOCIAL EXCLUSION IN NORTHERN IRELAND 216 This Findings from the New Policy Institute brings together the latest data to show the extent and nature of poverty in. It focuses on the
Area Analysis of Child Deprivation 2014 (WIMD Indicators 2014) 1
 1") Area Analysis of Child Deprivation 2014 (WIMD Indicators 2014) 1 This Statistical Article provides an Area Analysis of Child Deprivation in Wales, using some of the indicators underlying the Welsh Index
Area Analysis of Child Deprivation 2014 (WIMD Indicators 2014) 1 This Statistical Article provides an Area Analysis of Child Deprivation in Wales, using some of the indicators underlying the Welsh Index
MONITORING POVERTY AND SOCIAL EXCLUSION 2013
 MONITORING POVERTY AND SOCIAL EXCLUSION 213 The latest annual report from the New Policy Institute brings together the most recent data to present a comprehensive picture of poverty in the UK. Key points
NHS Tower Hamlets. Clinical Commissioning Group. Annual Report and Accounts 2017/18
 NHS Tower Hamlets Clinical Commissioning Group Annual Report and Accounts 2017/18 1 Contents Page Performance Report 5 Accountability Report 43 Corporate Governance Report 43 Members Report 43 Statement
Diversity and different experiences in the UK
 Diversity and different experiences in the UK National Statistician s Annual Article on Society Karen Dunnell National Statistician Equality is recognised nationally and internationally as a key aspect
Poverty in Doncaster. Data Update. June 2016
 Poverty in Data Update June 2016 1 Contents Section 1: Introduction... 4 Executive Summary... 5 Section 2: Indices of Multiple Deprivation 2015... 7 IMD 2015 Rank out of 326 Local Authorities... 10 Change...
Grow the Economy Briefing note
 Grow the Economy Briefing note Key messages The economy has shown resilience and consistent growth since 2011. At that time the borough was experiencing its most challenging economic period following the
Statistics about the Canning Town South Ward, Newham
 National Statistics Online - Statistics about the Ward, This summary gives information on the people living and working within the area, their health and employment status. It also gives information on
Financial Intelligence Toolkit. 2018/19 Subscription. Financial Benchmarking - Unit Costs. Newtimber
 Financial Intelligence Toolkit 2018/19 Subscription Financial Benchmarking - Unit Costs Newtimber Overview This report compares unit costs between local authorities in England, using budgeted expenditure
2016 Statistical Profile. (December 2016 Update) Durham City Major Centre. Altogether better. Durham. Durham Area Action Partnership
 Durham City Major Centre. Altogether better. Durham. Durham Area Action Partnership") 2016 Statistical Profile (December 2016 Update) Durham City Major Centre Altogether better Durham Durham Area Action Partnership Contents Page Map 1 Introduction Geography 2 Background 2 Notes 3 Useful
2016 Statistical Profile (December 2016 Update) Durham City Major Centre Altogether better Durham Durham Area Action Partnership Contents Page Map 1 Introduction Geography 2 Background 2 Notes 3 Useful
North East LHIN Demographic, Socioeconomic, and Population Health Profile
 North East LHIN Demographic, Socioeconomic, and Population Health Profile November 2008 www.nelhin.on.ca NORTH EAST LHIN DEMOGRAPHIC, SOCIOECONOMIC AND POPULATION HEALTH PROFILE Table of Contents Summary...ii
SEMLEP SOCIAL INCLUSION EVIDENCE ANNEX A
 SEMLEP SOCIAL INCLUSION EVIDENCE ANNEX A Worklessness Levels of worklessness continues to rise as more people become unemployed/economically inactive and looking for work. At the same time unemployment
Glenlivet and Inveravon, Moray
 Glenlivet and, Moray Area profile The area for the purpose of this area profile consists of eight geographical Output areas (output areas are the smallest areas by population used in the census). With