Page 2
|
|
|
- Randolph Webster
- 5 years ago
- Views:
Transcription
1 Dr Margarethe Theseira / July 2014
2 The findings from this paper helped to inform Centre for London s Hollow Promise report, published September Hollow Promise: How London fails people on modest incomes and what should be done about it is written by Charles Leadbeater, Brell Wilson and Margarethe Theseira. The research has been supported by Circle Housing Group, Argent LLP, Grosvenor, London Borough of Ealing and London Borough of Haringey. Dr Margarethe Theseira is an independent consultant specialising in London s economy. She has extensive experience researching London issues and developing policy and strategy. She helped to establish GLA Economics and is formerly the Senior Manager of GLA Intelligence, providing advice and analysis to the Mayor of London and GLA Group for their investment and policy decisions. Margarethe has a PhD in modelling from Cranfield University and is an Honorary Senior Research Fellow at University College London. Page 1
3 Page 2
4 The experience of living in London is different from that in the rest of the country. We have a different demographic composition with a younger, better qualified and more transient population than elsewhere in the country. In part because of the high costs of housing within our city and in part due to the age of Londoners, our household composition is different from that of the rest of the country. The types of employers and jobs in London are different too. This leads to higher wages for skilled workers but for those at the bottom of the income spectrum where minimum wage legislation sets the salary we have people earning wages that are not uplifted to meet the higher costs of living in London. For these reasons, it is necessary to take into account London s unique characteristics to understand how different households have reacted to pressure arising from reduced incomes and increasing costs. The resolution foundation defines the squeezed middle as those of working age and relying primarily on their own earned resources but with incomes below the median in the UK. Their definition does not include the poorest 10% of households and those who receive more than one fifth of their gross household income from means tested benefits. Using the Resolution Foundation, 19 per cent of London households are low to middle income. However, despite Londoners earn higher wages they also face far higher costs, particularly for housing and childcare, which we take these into account in defining our profiles of London s households under pressure. Our analysis of wage data, household composition and household expenditure data finds that the most constrained households are likely to include the following household profiles: One person household Male Working full time at a job in Central London and lives in Travel Zone 4-6 Annual gross wages of between 22k and 33k Older than 35 years Doesn t own a car and travels by public transport Couple with 2 dependent children One parent working full time in Central London and travel by public transport to work Other parent not working specific choice due to high costs of childcare (so likely to be in lower skilled occupation before having children) Annual gross wages of between 25k and 43k Own a car Living in Outer London Page 3
5 Person in a shared household Aged under 30 years Has a degree Is working full time with annual gross wage of between 22k and 33k Living in Inner London and uses public transport to reach work Is living in private rented accommodation paying 40% of income in rent Other Household with dependent children Preferably a family with 3 generations or more living in one household. E.g. Grandparents, child(ren), grandchild(ren) aged under 18 (or 19 if still in full time education). Total household income of between 25k and 43k Most likely locations within Newham, Redbridge, Hounslow, Ealing, Brent or Harrow Most likely to be from Bangladeshi, Pakistani, African and other Asian ethnic backgrounds Lone parent with 2 dependent children Income of between 22k and 33k Living in private rented sector in inner London Has informal childcare arrangements or access to heavily subsidised childcare Page 4
6 London is a growing city with a population of 8.44 million people, an increase of 7 per cent from five years ago when the country s economy entered into a long and deep recession from which it has only recently emerged. This report explores how the combined impacts of a growing population, a struggling economy and a retrenchment of welfare benefits has impacted upon the spending power of London s residents and in particular on those in households with lower incomes. We will look at how different households are changing their consumption patterns to cope with lower incomes. A dynamic population and a distinct economic structure Over the last decade, London has become increasingly diverse with 37 per cent of the city s population born outside of the UK compared with 27 per cent in London is subject to large amounts of churn: 18 per cent of London s population arrived from overseas in the last 10 years compared with just 7 per cent for the country as a whole. The peak age for overseas immigrants arriving into London is for those aged years (in line with global trends in migration). This ready labour supply makes access to entry level jobs and lower paid work highly competitive in London and impacts on the salaries that can be achieved at this level. Four out of every 10 employed London residents was born overseas compared with one out of every 10 employed UK residents. 2 Recent research suggests that although the overall impact of immigration on the UK is to slightly raise wages it depresses wages below the 20 th percentile of the wage distribution. 3 As London is home to greater numbers of migrants and has a younger population - who are at the start of their careers - than the country as a whole, it is likely that this wage depression is felt more strongly in London than elsewhere in the country. London s economy and labour market is distinctive from the rest of the country. London specialises in particular service industries including finance and insurance; professional, scientific and technical activities (such as management consultancy, legal services and accountancy); information and communications (including computer programming, film making and publishing); real estate; and business support services. These service industries require workers with high levels of skills and in London just under half of all jobs are held by people with at least degree level qualifications. The decline of industries in London such as manufacturing, that typically employ lower skilled workers, mean that for those with lower qualifications there are likely to be fewer jobs available in the city. This makes it harder for low skilled workers to find jobs in London. In London, 38 per cent of employees work in low-skilled occupations 1 ONS Census data 2001 and Milja Keijonen, Working Paper 60: Migrant Employment in Low Skilled Work, GLA Economics, March Christina Dustmann, Tommaso Frattini and Ian Preston, The Effect of Immigration along the Distribution of Wages, Centre for Research and Analysis of Migration Discussion paper 03/08 Page 5
7 (which are likely to be in lower paid jobs) compared to 47 per cent in the rest of the UK. Low skilled occupations in London are more likely to be filled by higher skilled workers than elsewhere. Around a quarter of London residents employed in low-skilled occupations had degree level qualifications compared to a fifth of non- UK-born and a tenth of UK born people employed in low-skilled occupations elsewhere in the UK. Page 6

8 Income distribution in London Given that London has a different economic and demographic structure to elsewhere in the country, it is expected that income levels of Londoners will also differ. Income includes money that is earned from working, profit made by the self-employed, pension income and money gained from property, interest, dividend payments and other income. Data for income is provided by Her Majesty s Revenues and Customs department and is based on the Survey of Personal Incomes, an annual sample survey of HMRC records for individuals who could be liable to UK income tax. Figure 1 highlights that London has a higher percentage of individual tax payers with a total income above 30k per annum compared to the UK as a whole. Figure 1. Distribution of individual tax payers by tax band for London and the UK Source: HMRC, Personal income statistics , released 31 st January 2014 Sources of income To be able to identify households under pressure it is important to consider where people obtain their income from. As shown in figure 2, the majority of income for Londoners is through money earned either from employment or self-employment rather than money from investments and pensions. Londoners are more dependent on their income from their job (employment or self-employment) than individuals based elsewhere in the country. Income from pensions is a more important source to Page 7

9 individuals from lower tax paying bands than those from higher paying tax bands. Within this study, we are specifically excluding pensioners, but this data shows that low income pensioners are an important group to which we should return in the future. For those individuals earning above 10k a higher proportion of their income is from Figure 2. Sources of income for London tax payers by income tax band Source: HMRC, Personal income statistics , released 31 st January 2014 Income of London households compared to UK households Spending decisions are often made at the family household level rather than at the level of individuals so it is important to understand the distribution of household income levels in London. The Family Resources Survey is collected to inform the work of the Department of Work and Pensions and households interviewed in the survey are asked a wide range of questions about their circumstances. It is this data that we used to understand the differences between income of London households and those in the UK. Figure 3 highlights that 28 per cent of London households have an income of greater than 1000 per week compared to 20 per cent of UK households. Nearly two thirds of households in the UK (64 per cent) live on an income of less than 700 per week compared to 56 per cent of London households. Page 8

10 Figure 3. Weekly income of London and UK households, Source: Family Resources Survey 2011/12, Department of Work and Pensions, July 2013 Income of households in Inner and Outer London and the UK Location matters when considering household incomes - at the upper end of the income distribution, around 30 per cent of households in Outer London have weekly incomes greater than 1000 ( 52k per annum); this drops to 26 per cent of households in Inner London and to 20 per cent of households in the UK as a whole. At the lower end of the income distribution, half of households in Inner London have an income of less than 500 per week ( 26k per annum), compared to 47 per cent of households in the UK as a whole and 37 per cent of households in Outer London. Page 9

11 Figure 4. Weekly household income of households in Inner London, Outer London and UK, Source: Family Resources Survey 2011/12, Department of Work and Pensions, July 2013 Households below average income As the number of people living in households varies between Inner and Outer London reflecting the type of stock available (houses, flats etc) it is worth looking at differences once household size has been accounted for. The Households Below Average Income (HBAI) measure adjusts for household composition and looks at the proportions of people of people living in households with incomes below 60 per cent of the national median. Table 1. shows that 25% of individuals living in Outer London are counted as being in poverty after housing costs are taking into account increasing to 33% of individuals in Inner London. Table 1. Percentage of individuals in households with income below 60 per cent of national median UK London Inner London Outer London Before Housing Costs After Housing Costs Source: Family Resources Survey 2009/ /12 Note: Figures for London are based on three-year rolling averages. UK figure is based on a single year. Page 10
.")
12 London sub-regional changes in gross disposable household incomes per capita We need to take into account how changes in taxation, national insurance and benefits have impacted on the amount of money that is available for spending or saving by Londoners. We do this by looking at official measures of Gross Disposable Household Income (GDHI). 4 Figure 5 reveals that between 1997 and 2012 the disposable income of individuals living in Inner London, particularly those in West Inner London has risen at a far greater rate than for people elsewhere in our city. In 2012, West Inner London residents had a GDHI per head of over twice the national average (at 36,963) and their incomes were affected far more by the downturn in the early 2000s than the more recent recession. Similarly, this data shows that the GDHI of residents in East Inner London has increased rapidly between 1997 and The change in East Inner London is likely to be caused by an influx of more affluent residents due to the Olympic Games spurred regeneration of the area. This is in stark contrast to residents living in Outer London where the GDHI index has actually reduced for those living in the East and North East. There have been minimal changes in the GDHI index for those living in South, West and North West Outer London. Figure 5. Map of London s sub-regions and changes to the Gross Domestic Household Income per Capita Source: ONS, A beginners guide to UK Geography 4 Gross disposable household income (GDHI) is the amount of money that individuals (i.e. the household sector) have available for spending or saving. This is money left after expenditure associated with income, e.g. taxes and social contributions, property ownership and provision for future pension income. It is calculated gross of any deductions for capital consumption. Page 11
13 UK Inner London - East Outer London - South Inner London - West Outer London - East and North East Outer London - West and North West Source: Office for National Statistics, Gross Domestic Household Income Index Income by household type London households have a different composition to the rest of the country with higher percentages of other household types and more single person households of working age, (particularly for men). London has a dramatically lower percentage of households with people of a retirement age and has a lower percentage of couple households with no children. Unsurprisingly, lower income households are most likely to comprise a single person. 82 per cent of UK households and 80 per cent of London households with a weekly income of between are one person households. However, single working aged households in London are much more likely to also be represented in higher income households in London than the rest of the country. Household income tends to rise with the number of people sharing the house. For households with a weekly income greater than 1000, 94 per cent contain two people or more at a national level dropping to 90 per cent for London households. There is a higher proportion of single parent households and households with children in London in the weekly income bracket than at the national level. There is a higher proportion of households with 3 of more adults with no children in London with incomes of between 300 and 600 per week than at the national level. This also applies to households of three or more adults with children for weekly income levels of and Page 12


14 Figure 6a. Composition of household types by weekly income bands for UK Figure 6b. Composition of households by weekly income bands, London Source: Family Resources Survey 2011/12, Department of Work and Pensions, July 2013 Page 13
15 Households with children in London are more likely to have incomes of higher than 1000 weekly and less likely to have incomes of lower than 1000 per week than equivalent households in the UK except for those households within incomes of between where they are broadly similar. Figure 7. Composition of households with and without children for London and UK by weekly income bands Benefits Inner London has particularly high rates of take up of housing benefit and council tax benefit when compared to the UK. This is reflecting the high costs of housing in the city. Outer London has higher take up of child benefit than the national average reflecting the large numbers of young families living in this area. As both housing benefit and child benefit have been the subject to recent reform which caps the amount payable for housing benefit and limits the uptake of child benefit then London households will have felt a greater impact from the recent reforms than households at a national level. Page 14
16 Figure 8. Take up of benefits for Inner and Outer London compared to the UK Source: Family Resources Survey 2011/12, Department of Work and Pensions, July 2013 London wages have decreased by a greater amount than wages in the country as a whole London s higher wages is one of the reasons that London attracts so many migrants from elsewhere in the country and from overseas and indeed has a growing number of commuters willing to travel long distances to work in the city. Our analysis on wage changes is restricted to look at London residents, however it is important to recognise that many of London s work force live outside of our city boundaries and commute into work. Commuters are an important component of supply to the London labour market and in 2011 filled around 16 per cent of the capital s jobs. The latest wage data for London shows an annual median wage for full time workers of 32,800 higher than the national median wage of 27,126. Real wages for all London residents working full time increased between 2002 and 2008, however, higher earners benefited from higher wage increases than lower earners. Since the onset of the recession in 2008, London wages have decreased by a greater amount than wages elsewhere in the country. In London, only those in the higher wage deciles 6,7 and 9 are earning higher wages in 2013 than they were in 2002 once inflation is taken into account. For the country as a whole those in the lowest income decile and those with a median income and above are earning more in 2013 than they were in Page 15
17 Figure 9a. Annual Gross Wages for London by decile, Source: Annual Survey Hours and Earnings, ONS n.b. adjusted for inflation using CPI Figure 9b. Annual Gross Wages Great Britain by decile, Source: Annual Survey Hours and Earnings, ONS n.b. adjusted for inflation using CPI Figure 10 highlights the amount that wages have decreased in London and Great Britain for full time workers between 2008 and 2013 once inflation has been taken into account and shows that London resident wages have been harder hit than for those living elsewhere in the country. Page 16
18 Figure 10. Drop in real wages for full time workers in London and Great Britain between 2008 and Source: Annual Survey Hours and Earnings, ONS n.b. adjusted for inflation using CPI Table 2 demonstrates that the wage distribution across London has become more unequal since In 2002, the top 10 per cent of wages was 4 times higher than the bottom 10 per cent of wages; by 2013, this had increased to 4.3 times higher. This is a different trend to that of the country as a whole, where the wage differential between the top 10 per cent of wages and the bottom 10 per cent of wages has remained fairly constant with the highest decile wages being around 3.7 times that of the lowest decile. London residents with salaries below the median have been harder hit than those in the country as a whole. The real wages of the lowest decile decreased by 4.8 per cent between 2002 and 2013 for those living in London but increased by 1.1 per cent elsewhere. There has been little change in salaries when you look at the country as a whole with the most notable change being an increase of 2.7 per cent for the top decile of wages 5. London s wage premium, which is critical to attracting new talent into our city and helps to counter the high costs of living in our city, is not evenly distributed across the wage spectrum and has declined for all deciles (except the 6 th where it is little changed at a 1% increase). The rate of decline of the London wage premium has been substantially higher for lower earners hitting those earning less than the median wage 5 NB Remember that the top decile of workers in GB include those highly paid commuters working in London but living outside of the city. Page 17
19 more strongly than higher earners. Moreover, it is the lowest earners who have been hit the hardest with a 32 per cent drop in the London premium for the bottom earning decile. It has become harder for Londoners to counter the higher costs of living in the city through their salaries. Table 2. Real annual wages for full time workers in London and Great Britain for 2002 and 2013 and the London wage premium by percentile. Percentile London Wages ( ) GB Wages ( ) % change in Wages (02 13) London wage premium London GB 2013 ( ) % change since ,809 16,957 14,590 14, , ,966 21,226 17,847 17, , ,605 25,131 20,729 20, , ,415 28,765 23,745 23, , Median 33,289 32,800 26,985 27, , ,330 37,363 30,774 30, , ,641 42,900 35,232 35, , ,436 50,985 41,150 41, , ,875 72,768 52,652 54, , Wage ratio 90/ Source: Annual Survey Hours and Earnings, ONS n.b. adjusted for inflation using CPI London s wage constraint has hit younger people harder The hourly wage of London residents in 2013 was higher than for residents elsewhere in the UK regardless of age. However, salaries have decreased in London compared to salaries in the rest of the UK. The largest decline in salaries were for younger London residents whose hourly wage has dropped by 8 per cent for year olds and 9 per cent for year olds once inflation is taken into account.. The rapid rise in hourly wages for the over 55 year olds reflects many factors one of which is the increased likelihood of older workers to be employed in the better paid occupations as managers and senior officials and professional jobs. 6 Yet even for this age band, London residents wages have increased less than for similar aged people living elsewhere in the country. 6 A comparison of occupational categories by age between the 2001 and 2011 census show a higher proportion of workers aged over 50 in the managers and senior officials and professional occupations. Page 18

20 Figure 11. Hourly wage and changes in real earnings between 2002 and 2013 for London and Rest of UK by age bands Source: Annual Survey of Hours and Earnings, ONS adjusted for inflation using CPI. NB Provisional data for Increasing numbers of people reporting underemployment and self-employment Earnings are closely linked to the number of hours that a person is working. Recent research shows that since the onset of the recession, there has been a rapid increase in the number of people who are working fewer hours than they would like (see figure 12). In London, similar to the UK as a whole, 1 in 10 workers report that they are underemployed. 7 This trend has continued to increase despite unemployment rates declining. Nationally there has been a rise in the number of self-employed people and at 17.2%, London has the highest percentage of workers who are self-employed. 8 7 Underemployed worker are those who are employed but who either wish to work more hours in their current role or who are looking for an additional job or for a replacement job which offers more hours. They must also be over 16 and currently working under 40 hours if they are aged years and under 48 hours if they are over 18. Finally they must be available to start working extra hours within the next two weeks. 8 ONS, Annual Population Survey. Page 19
21 Figure 12. Underemployment and unemployment rates in London Source: Labour Force Survey, Office for National Statistics, February 2014 Page 20

22 Households do not only have access to their latest pay cheque but over time can choose to invest, save and/or borrow additional money. This section looks at the total wealth of London households which includes the value of any property that is owned, the value of the household belongings including artwork and vehicles, savings, borrowings and investments and private pension wealth. In 2010/12, the total wealth of London s median household stood at 213,200. This is a substantial increase of 31% from 2006/08 and a rate of increase much higher than the 11% experienced in Britain as a whole. This increase was across all components of wealth but was highest for private pension wealth and net financial wealth with rises of 48% and 26% respectively. 9 However despite this rapid rise over recent years, London households at both the median and lower quartile still have lower total household wealth than equivalent households in Great Britain: at 5,200 for median households and a whopping 26,800 for the bottom quartile. It is only at the upper quartile where London households, with a total wealth of 546,200, do better than the British average and even at this level, households in the South East, East of England and South West regions are wealthier still. Figure 13. Total wealth by quartile for London and British households, 2006/08 to 2010/12 Source: ONS, Wealth and Assets Survey, Wave 3, 2010/12 9 Office for National Statistics, Wealth in Great Britain, Wave 3, 2010/12, May 2014 Page 21

23 Given the high house prices which are prevalent in London, as expected, net property wealth of London households is higher than the national average and the highest of all regions. But as London households are less likely to be owner occupiers this wealth is shared between just over half of London households. Net property wealth has risen by 9% for median households in London since 2006/08 compared to no change for similar British households. Figure 14. Net Property Wealth, London and British Households, 2006/08 to 2010/12 Source: ONS, Wealth and Assets Survey, Wave 3, 2010/12 For the bottom quartile of households regardless of location, households do not hold any financial wealth and for the 2008/10 period they were indebted by 100 if based in London. The financial wealth of median London households has increased by 26% compared to a national rise of 4% since 2006/08 to leave them level pegging at 5,900 in 2010/12. For those in the upper quartile, London households have surpassed the national figure with a net financial wealth figure of 46,000 compared to a national figure of 38,500 but once again, households in the South East, South West and Eastern regions have higher levels of financial wealth. Page 22
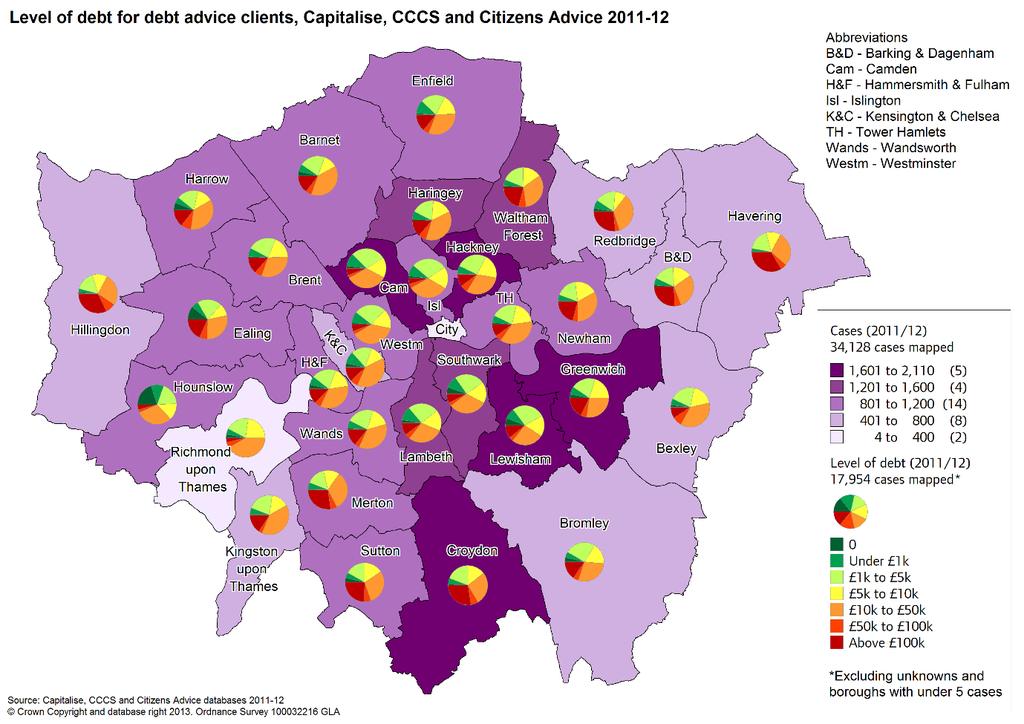
24 Figure 15. Net Financial Wealth, London and British Households, 2006/08 to 2010/12 Debt Average household debt in the UK (excluding mortgages) was 6,080 in May 2014 and if mortgages are included this rises to 54,701. Broken down by person, this means that the average amount owed per UK adult was 28,610. This equates to around 115% of average annual earnings. 10 The Greater London Authority reported that of those households in London living in debt, half owed more than 3,000, but the average debt was nearer to 8,000. Only half of households did not view this as a burden, while for one in six, this debt was a heavy burden. Among the ten per cent of households with the lowest total wealth, their total debt was more than four times as much as their total financial wealth. Around 40 per cent of this group felt their debt was a heavy burden, but a quarter did not see it as a problem. 11 The GLA also collate debt statistics from debt advice agencies records of their clients. This is a self-selected group which does not provide a complete picture of debt in London but helps to understand the characteristics of those seeking debt advice Rachel Leeser, The Wealth Gap in London, GLA Intelligence Update , February 2013 Page 23
25 . Page 24
26 London households income distribution We use the Family Expenditure Survey to better understand how households across the income distribution have changed their spending behaviour in response to the squeeze on their incomes and rising living costs. We divide London households by income into 10 equal sized groups (deciles) and compare these with households with similar income levels in the UK. We also compare how spending has changed for London households over time. Table 3. Income thresholds for London household deciles Decile Lower gross income threshold ( per week) Decile Lower gross income threshold ( per week) 1 lowest 10% of household income highest 10% of household income 1722 How does London household spend differ from households in the UK? If we compare all London households with all UK households, they spend more per week. But when we look at the UK, household expenditure increases according to household income as would be expected. This is not the case for London, where households within the bottom 10 per cent of income levels spent slightly more each week ( 7.30) than households in the next decile up. In general, London households spent more each week than equivalent households in the UK except for those households in decile 7 (with a weekly gross income of between 714 and 860) where London households spent 12 less per week. Figure 16. shows the total expenditure of households by income decile in London and the UK covering the years The largest difference is for those households within the top 10 per cent of income where London households spent more each week. Somewhat surprisingly, the second largest difference in spend between London and UK households is for households within the lowest 10 per cent of income where London households spend more each week. This may reflect different household compositions within each of the income brackets. Page 25
27 Figure 17. Total Weekly Expenditure of London and UK households, by income decile, Source: ONS, Family Expenditure Survey/Living Costs and Food Survey There are some specific expenditure categories 12 where all London households are paying more than households elsewhere in the country and these are in rent; water supply and miscellaneous services relating to the dwelling (typically accommodation service charges) and communication. London households spent between 25 per cent and 98 per cent more on rent than households elsewhere in the country. The higher spending on rent in London is partly attributable to higher rent payments but it is also related to the higher proportion of households living in rented accommodation in our city compared to nationally. The spending figures are averaged across all households, whether they rent accommodation or not. As London has more renters then it leads to higher average household spending on rent overall. Later in the report we look at data that looks at spending for renting households and mortgaged households separately which shows that on average London renting households are spending 48% more on rent than renting households elsewhere and mortgage holders are spending 54% more than mortgage holders in the UK as a whole. The only category where London households spent less than households elsewhere in the country across the income spectrum is on alcohol. London households spent less than UK households on recreation and culture for all income deciles except the lowest income households. The main area where London households spend less on recreation 12 For a detailed definition of what is contained within each of these COICOP categories please refer to Page 26
28 and culture is in gardening and money spent on pets. As we will see later on in the report, recreation and culture activities are also areas where many London households have reigned in their expenditure over the last decade. Figure 18 highlights that London households within the bottom 40 per cent of income spent more on transport than households elsewhere in the country but this is reversed for London households higher up the income distribution. The transport category includes private and public transport as well as journeys made abroad (but not package holidays). It is likely that this unusual expenditure pattern can be explained by greater use of public transport by all London households regardless of their income levels. Figure 18. Differences in average weekly expenditure ( ) between London and UK households by category and income decile Source: ONS, Family Expenditure Survey/Living Costs and Food Survey Page 27
29 Table 4. Differences in average weekly spend ( ) between London and UK households by category and income decile Decile 1 Decile 2 Decile 3 Decile 4 Decile 5 Decile 6 Decile 7 Decile 8 Decile 9 Decile 10 Rent Education Food & non-alcoholic drinks Restaurants & hotels Transport Other expenditure items Water supply and miscellaneous serv Communication Clothing & footwear Recreation & culture Maintenance and repair of dwelling Health Alcoholic drinks, tobacco & narcotics Household goods & services Electricity, gas and other fuels Miscellaneous goods & services Total n.b. Highlighted cells are the top 5 categories by income decile, where London households spend more than UK households Source: ONS, Family Expenditure Survey/Living Costs and Food Survey Page 28
30 per week Mortgage holders compared to renters The Bank of England base rates have been held at historically low levels of 0.5% since March 2009 which would benefit mortgage holders who are on variable rates but the credit squeeze has constrained lending and meant that higher deposits were required for those wishing to take out a mortgage in recent years. The analysis so far has broken down London households by income deciles and compared their expenditure regardless of housing tenure. This section looks at the amount spent on net rent by renting households and the amount spent on mortgages by households who are paying these. Figure 19. highlights that both renting and mortgaged households are paying substantially more in London that for the UK as a whole. Households with mortgage payments are spending more than those households who are renting. London mortgage holders are spending an average of per week compared to for the UK whereas London renters are spending an average of per week on net rent compared to nationally. Figure 19. Weekly expenditure on rent by households renting and amount spent on mortgage by mortgage households for London and UK London UK Source: ONS, Family Spending 2012 Net Rent Mortgage Page 29

31 Housing Costs If owner-occupying residents of London were trying to buy their homes today, much of London s housing would be beyond their reach. Figure 20 takes the median house price and median earnings of residents within each borough to create an index of affordability. In only a few boroughs, Barking and Dagenham, Newham and Tower Hamlets are houses costing the median or less within an affordable reach for those earning median wages in that borough. Figure 20. London s affordability challenges Source: ONS, Annual Survey of Hours and Earnings 2013 and Land Registry median house prices data For those households living in the private rental sector, London has seen a far higher rate of increase in average private rents than that experienced elsewhere in the country since Page 30
32 Figure 21. Index of average private rents, 2005 to 2014 Source: ONS Experimental index of private housing rental prices, February 2014 Figure 22. Annualised change in average private rents since 2006 Source: ONS Experimental index of private housing rental prices, February 2014 Increase in private rental costs The proportion of household income spent on rent (excluding Housing Benefit), increased from 21 per cent in 2001/02 to 27 per cent in 2010/11. For those households on lower incomes ( 250 to 399 per week) rental costs accounted for 49 per cent of their income in 2010/11. For those households in the middle income brackets ( 400 to 549 per week) the costs of their rent increase by 14 percentage points over the last decade, and rental costs accounted for 41 per cent of their income in 2010/11. Page 31
33 Impacts of Changes to Local Housing Allowance The Local Housing Allowance (LHA) benefit is paid to eligible tenants in the private rental sector. As we saw earlier in this report, Inner London has a particularly high proportion of households claiming housing benefit. Recent changes have meant that the LHA is subject to a cap depending on the number of bedrooms in the home and is set at the 30th percentile of the local market rent. The five bedroom rate has been removed. The restricted rate of LHA for single people to only be entitled to a shared room rate was extended from those aged under 25 years to those aged under 35. The 15 excess payment which allowed tenants to keep excess Housing Benefit payments has been abolished. 10 million was added to Local Councils Discretionary Housing Payment pot in 2011/12, and a further 40 million per annum between 2012/13 and 2014/15 to mitigate the impacts of these changes. The amount payable was linked to the Consumer Pricing Index (CPI) in 2013, and will rise by CPI + 1% in the following two years. The Department for Work and Pensions (DWP) estimated that nearly 160,000 London households would be affected by the reforms to the LHA, more than any other UK region. 13 Recent research conducted by the Institute of Fiscal Studies on behalf of DWP has shown that the changes to the Local Housing Allowance had the greatest impact in London where the difference between existing rent and the maximum LHA was per week of this difference reductions in rent by landlords accounted for 3.47 meaning that tenants needed to fund 9.92 from their own resources. The difference between the maximum LHA and rent was, as could be expected, highest in the Central London boroughs where despite rent reductions by landlords tenants needed to find an additional per week to stay in the same accommodation. 14 The report also 13 Department for Work and Pensions, Impact Assessment of Housing Benefit Proposals: Changes to LHA 11 12, Department for Work and Pensions conducted by the Institute of Fiscal Studies, Econometric analysis of the impacts of Local Housing Allowance reforms on existing claimants, July Page 32
34 found that for a subgroup of LHA recipients living in London boroughs were there LHA award was higher than the national cap for their household type there was an increased probability of moving accommodation. In London, the interaction between a strong housing market, high market rents and high PRS demand contributes to the high LHA claimant rates. In effect the LHA acts as a rent subsidy for large numbers of claimants who are in work in London: some 44 per cent of LHA claimant households had an income from work compared to 32 per cent of all LHA claimant households in Great Britain. 15 Transport Each day around 30 million journey stages 16 are undertaken within London and our transport infrastructure has benefitted from a massive investment programme over the past decade in order to modernise the existing services and build new capacity for London. Each year around 4 billion is raised from fares providing a vital part (approximately 61 per cent) of TfL s income for their operational budget. 17 Over the period 2008 to 2014 for trips using pay as you go oyster, bus fares have gone up by 61 per cent and zone 1 underground fares have increased by 47 per cent. This compares to a change in the retail price index of 20.4 per cent and average weekly earnings increases of just 10.4 per cent over the same period. 15 Beatty et al, Monitoring the impact of changes to the LHA system of housing benefit, (Department of Work and Pensions, June 2012).h 16 A Trip is defined as a one-way movement from an origin to a destination in order to achieve a specific purpose, for example to go from home to work. Each trip may involve travel by one or more individual modes of transport. These component parts of trips are referred to as Journey Stages pdf Page 33
35 Figure 23. Increase in pay as you go bus and underground fares between 2008 and 2014 Source: Transport for London For many parts of Outer London, commuting to Central London is only viable using rail services. The number of trips made by national rail that start and finish within London s boundaries has more than doubled since 1995 to over 4 million journeys in 2011/12. Along with a large increase in the usage of railway services has come a large increase in fares paid to use these services. Rail services covering London and the South East have increased their fares by 54.4 per cent between 2004 and A peak day return rail ticket from zone 4 in London into Central London rail termini now costs Yet the recently announced national minimum wage 2014 is 6.50 per hour. If you are earning minimum wage and commuting by train into Central London from Outer London, this effectively means that the first hour and 18 minutes of your working day is spent earning the money to cover your fare to reach your job. If you need to take a bus or tube as well as a train to reach your job, then you would work the first 1 hour and 45 minutes to cover the cost of a peak travel card at Access to car ownership Car ownership is declining in London. In 2012, 54 per cent of London households had at least one car compared to around 57 per cent in 2005/06. Ownership varies substantially across London boroughs from 26 per cent of households in Islington to 75 per cent of households in Richmond Upon Thames. Londoners are more likely to own a car if they live in Outer London, live in an area with poor access to public transport, have a higher income, have a child in the house, 18 Office of Rail Regulator, Index showing average change in price of rail fares Page 34

36 and are of Western European nationality. Car ownership is higher amongst men than women (46 per cent compared to 34 per cent) and this gender gap is greater in lower income households. The likelihood of a household owning a car rises as household income increases. Figure 24. shows that car ownership rises steadily with household income up to 75k a year. Beyond this income level, car ownership no longer rises, remaining at just over 80 per cent. 19 Figure 24. Car ownership rates by household income Source: London Travel Demand Survey 2011/12. Nb: household income before tax. Energy costs In , London households spent around 60 per month on fuel costs, this had increased to 92 by This is an increase of expenditure 52 per cent above inflation and this increase comes despite an overall reduction in energy use. The group with the largest increase in their expenditure are for those in the 6 th decile of household incomes. Figure 25. Changes in amount spent on fuel for London households between and Transport for London, Roads Task Force Technical Note 12, How many cars are there in London and who owns them? 2012 Page 35


37 Source: ONS, Family Expenditure Survey/Living Costs and Food Survey covering financial years 01 06, and calendar years Fuel poverty We now turn to look at locations of households who are suffering from fuel poverty. This is defined as households who need to spend more than 10 per cent of its income on fuel to maintain an adequate level of warmth. Of the UK regions, London has the lowest fuel poverty rates with 9 per cent of households fulfilling the criteria. From figure 26 it can be seen that households living in Outer London are at greater risk of fuel poverty than those in Inner London. Figure 26. Fuel poverty in London, 2011 Source: Annual report on fuel poverty statistics 2013, Department of Energy and Climage Change Food costs For households earning the median income or less, food expenditure is the second largest bill after housing costs. For households with the lowest 30 per cent of income, Page 36

38 spending on food as a proportion of their income has increased over the last decade unlike wealthier households. Figure 27. Weekly spend on food ( ) and as a proportion of total household spend n.b expenditure in 2012 prices Council tax There is a wide variation in council tax bills between London Boroughs. Households living in a band D property in Kingston-upon-Thames will pay over 1000 more in council tax per year than a household living in a band D property in Westminster. Page 37
39 Kingston-upon-Thames Richmond-upon-Thames Harrow Havering Haringey Croydon Waltham Forest Sutton Bexley Barnet Hillingdon Merton Enfield Redbridge Hounslow Lewisham Ealing Brent Camden Barking & Dagenham Bromley Hackney Greenwich Islington Newham Lambeth Southwark Tower Hamlets Kensington & Chelsea Hammersmith & Fulham City of London Wandsworth Westminster Figure 28. Borough council tax charges for Band D properties including GLA precept 1,800 1,600 1,400 1,200 1, Childcare costs London has lower employment rates of women (64 per cent) compared to the rest of the country (67 per cent) and the majority of this difference is explained by low employment rates of women with dependent children. Part of the reason why women are unable to take up jobs in London is the high costs of childcare within our city. Nursery care for children under two is 25 per cent more expensive in London than the average across Britain at 5.33 per hour. A parent in London buying 50 hours of childcare per week for a child under two would face an average annual bill of nearly 14,000. Table 5. Cost of childcare in London compared to Great Britain by type of care provided Region/Natio n Nursery 25 hours (under 2) Nursery 25 hours (2 and over) Childmind er 25 hours (under 2) Childmind er (2 and over) Afterschool club 15 hours Childmind er afterschool pick up London Great Britain Source: Daycare Trust, Childcare costs survey 2013 Page 38
.")
40 Changes in London households expenditure over the past decade Reductions in incomes within households have led to households tightening up on their expenditure. On average, London households have reduced their spending by over the last decade (after counting for inflation). We would expect this to be a simpler consideration for those in higher income groups who may choose to cut back on optional expenditure such as the number of holidays taken abroad than for those households who may have to choose between paying different essential household bills. This section, explores how expenditure patterns have changed between different levels of income within households and where cuts to expenditure have been made. The first thing to note from figure 29, is that the weekly expenditure of households within the bottom 30 per cent of income has increased over the last decade. The largest increase in expenditure was from the poorest 10 per cent of households who have increased their weekly spend by an average of The largest cuts in total expenditure were made by the wealthiest 10 per cent of households who reduced their spending by an average of with the bulk of this reduction ( 84.78) coming from Other expenditure items which includes mortgage interest payments, holiday spending and cash gifts and donations. Figure 29. Changes in Expenditure by London household income decile Source: : ONS, Family Expenditure Survey/Living Costs and Food Survey covering financial years 01 06, and calendar years Page 39
41 We now turn to look at the detail of where households have reduced their expenditure over the last decade. Whilst all London households have reduced their expenditure in the Household Goods and Services Category for the bottom 20 per cent of households this category accounts for the largest reductions in their expenditure. The Household goods and services category encompasses items which can now be brought in Pound shops such as soaps and cleaning materials so some of the reduction in expenditure may well be a cheaper supply of these items. But this category also includes furniture, carpets and white goods so some of the reduction is likely to be from a make do for now attitude. For households in income deciles 3,4, 6 and 7 the largest reductions in spending have been within the recreation and culture category this includes money spent on TVs and computers, sports, visits to cinemas and theatres, gambling and package holidays. For households in income decile 5 the largest reductions in spending have been within the Other expenditure category. This may well arise as due to credit constraints fewer households were able to take out mortgages than a decade previously so fewer households will be incurring the costs of purchasing a home and repaying a mortgage but will instead be paying rent or living with their parents for longer. For households in income deciles 8 and 9 their largest reductions in expenditure came from the transport category. Figure 30. Changes in Expenditure by London household income decile and category of spend Source: ONS, Family Expenditure Survey/Living Costs and Food Survey covering financial years 01 06, and calendar years Page 40
42 Table 6. Change in amounts spent ( per week) between and (using 2012 prices) Decile 1 Decile 2 Decile 3 Decile 4 Decile 5 Decile 6 Decile 7 Decile 8 Decile 9 Decile 10 All Food & non-alcoholic drinks Alcoholic drinks, tobacco & narcotics Clothing & footwear Rent Maintenance and repair of dwelling Water Electricity, gas and other fuels Household goods & services Health Transport Communication Recreation & culture Education Restaurants & hotels Miscellaneous goods & services Other expenditure items Total change in spend N.B. Cells highlighted in red are those with the largest increase in spend; those in green are for the largest reductions in spend. Source: ONS, Family Expenditure Survey/Living Costs and Food Survey covering financial years 01 06, and calendar years If we look more closely at amount spent on rent by renting households and mortgage amounts paid by households with a mortgage for London and how this has changed over the past decade a complex story emerges. This story reflects many factors including the composition of households at different parts of the income distribution which will impact on the size and type of property that they are living in; that the quality of rented properties has increased over time; the types of mortgage products that were available and the increasing cost of housing. The amount that households spend on rent has increased for nearly all deciles, with the largest increases of 95 and 73 per week, for the highest income households. This may, in part, reflect the wider range of properties that are now available to rent in London including more exclusive properties that have come onto the market. Households with median incomes and those in deciles 1,3 and 8 have seen a large increase in the amount that they spend on rent up by at least 25 per week. Households in the second decile have also seen an increase in the amount that they are spending on rent but at a more modest level of 13 per week. Deciles 4 and 7 have seen minimal changes to the amount that they are spending on rent with changes of 5 or less per week. Those in decile 6 are spending less on rent now than they were a decade ago. Mortgage spending has reduced for the top and bottom deciles : down by 45 and 34 respectively. Median income households and those in decile 6 have also seen a decline in the amount that they are spending on their mortgage dropping by 28 and 14. The largest increases in spending on mortage payments of over 40 per week are for Page 41
43 households in deciles 4 and 8. Mortgage spending has also increased but at a more modest level for households in deciles 2,3 and 7. Figure 31. Changes in expenditure between 2001/03 and 2010/13 on net rent by renters, and mortgages by mortgage holders, by gross income decile for London Source: ONS Family Spending 2012 London s household composition- squeezing in London has a different household composition to the rest of the country with higher percentages of one person households and other household types and fewer couple households with no children. Part of the coping strategy for lower income families is for them to share with other people rather than set up a household of their own. In England and Wales, 1.9 million other households were identified in the 2011 Census: these included households of more than one family, households comprised of unrelated adults sharing and those including one family and other unrelated adults. 9.4 per cent of households in London are classified as other households more than twice the rate of households elsewhere in Britain. Page 42


44 Table 7. Household composition for Great Britain and London All households number One person household Aged 65 and over One family only Married or same-sex civil partnership couple Cohabiting couple Other All aged No children Dependent All 65 and over children children nondependent No Dependent children children Lone parent Dependent children GB 25,738, London 3,266, Source: ONS, Census 2011 London households were twice as likely as those in the rest of England to be other households with dependent children. Often these are households with a third generation, such as a grandparent, or other relatives living in the household. In Newham, these types of households made up more than one in ten of all households. All-student households and households comprising only people aged 65 or over from more than one family unit made up similar proportions of the total in London and in England as a whole both well under one per cent. However, other households without dependent children with more than one family unit were a much larger group, comprising nearly one in ten of all London s households. This is two and a half times the proportion in the rest of England, and within London, the proportion had grown by over 20 per cent since Many of these households are unrelated people sharing housing, though the category would also include three-generation households where the youngest are no longer dependent children, among others 20. Figure 32. Percentage of concealed families living in London by borough All children nondependent All children nondependent With dependent children Other household types All fulltime students All aged 65 and over Other 20 Rachel Leeser, 2011 Census Snapshot: Households and Families, GLA Intelligence Unit, Dec 2012 Page 43
London s Poverty Profile 2011
 London s Poverty Profile 2011 Trust for London and the New Policy Institute have updated a wide range of indicators related to poverty and inequality in London. These indicators use government data to
Data Management and Analysis Group. Child Poverty in London Income and Labour Market Indicators
 Data Management and Analysis Group Child Poverty in Income and Labour Market Indicators 60 50 40 30 1995 1996 1997 1998 1999 2000 2001 2002 2003 2004 2005 DMAG Briefing 2006/19 June 2006 Social Exclusion
FOCUSONLONDON 2011 POVERTY:THEHIDDENCITY
 FOCUSONLONDON 2011 POVERTY:THEHIDDENCITY GLA Intelligence Unit City Hall Queen s Walk More London SE1 2AA Author: Rachel Leeser POVERTY:THEHIDDENCITY intelligence@london.gov.uk 020 7983 4658 Follow us
Still Too Poor to Pay Council Tax Support in London /18 Update
 Still Too Poor to Pay Council Tax Support in London - 2017/18 Update Overview After producing three previous reports on the impact of the localisation of council tax benefit in London, Child Poverty Action
The Landline Tax and other unnecessary costs on London households and businesses using fixed line broadband services
 The Landline Tax and other unnecessary costs on London households and businesses using fixed line broadband services Prepared for UK Broadband Contents Executive Summary 03 Section 1: Research overview
INCOMEANDSPENDINGATHOME
 GREATERLONDONAUTHORITY FOCUSONLONDON 2010 INCOMEANDSPENDINGATHOME GLA Intelligence Unit City Hall Queen s Walk More SE1 2AA intelligence@london.gov.uk 020 7983 4658 Author: Richard Walker INCOMEANDSPENDINGATHOME
What can cities learn from Labour Market Intelligence? Paul Bivand Lovedeep Vaid
 What can cities learn from Labour Market Intelligence? Paul Bivand Lovedeep Vaid Using LMI to produce an economic assessment for Tower Hamlets Presented indicators (at the LA level and below) covering:
The Peabody Index. Tracking the financial experiences of London s social housing tenants. Scott Corfe
 The Peabody Index Tracking the financial experiences of London s social housing tenants Scott Corfe SOCIAL MARKET FOUNDATION FIRST PUBLISHED BY The Social Market Foundation, June 2018 11 Tufton Street,
This is Havering LONDON BOROUGH OF HAVERING. A Demographic and Socio-economic Profile. Some Key Facts and Figures. Version 3.4 (March, 2018) HAVERING
 HAVERING") LONDON BOROUGH OF This is Havering 2018 A Demographic and Socio-economic Profile Some Key Facts and Figures By London Borough of Havering Public Health Service Version 3.4 (March, 2018) Contents List of
LONDON BOROUGH OF This is Havering 2018 A Demographic and Socio-economic Profile Some Key Facts and Figures By London Borough of Havering Public Health Service Version 3.4 (March, 2018) Contents List of
Intelligence Briefing English Indices of Deprivation 2010 A London perspective. June 2011
 Intelligence Briefing 2011-06 June 2011 English Indices of Deprivation 2010 A London perspective For more information please contact: Rachel Leeser Intelligence Unit Greater London Authority City Hall
Poverty and Income Inequality in Scotland: 2013/14 A National Statistics publication for Scotland
 Poverty and Income Inequality in Scotland: 2013/14 A National Statistics publication for Scotland EQUALITY, POVERTY AND SOCIAL SECURITY This publication presents annual estimates of the percentage and
Notes to help you fill in the Residential Support Scheme (RSS) application
 application") SAMPLE APPLICATION Notes to help you fill in the Residential Support Scheme (RSS) application How do I apply? First complete the application form and ensure you have all supporting documents. Once complete,
SAMPLE APPLICATION Notes to help you fill in the Residential Support Scheme (RSS) application How do I apply? First complete the application form and ensure you have all supporting documents. Once complete,
Child poverty in Lewisham A briefing for London s councillors. Autumn 2018
 Child poverty in Lewisham A briefing for London s councillors Autumn 2018 Contents Introduction... 3 Rates of child poverty... 5 Low pay... 11 Employment... 14 Housing... 16 Crisis prevention and support...
MONITORING POVERTY AND SOCIAL EXCLUSION 2013
 MONITORING POVERTY AND SOCIAL EXCLUSION 213 The latest annual report from the New Policy Institute brings together the most recent data to present a comprehensive picture of poverty in the UK. Key points
DEMOGRAPHIC DRIVERS. Household growth is picking up pace. With more. than a million young foreign-born adults arriving
 DEMOGRAPHIC DRIVERS Household growth is picking up pace. With more than a million young foreign-born adults arriving each year, household formations in the next decade will outnumber those in the last
PENSIONS POLICY INSTITUTE. Automatic enrolment changes
 Automatic enrolment changes This report is based upon modelling commissioned by NOW: Pensions Limited. A Technical Modelling Report by Silene Capparotto and Tim Pike. Published by the Pensions Policy
Can the changes to LHA achieve their aims in London s housing market?
 Can the changes to LHA achieve their aims in London s housing market? A report by New Policy Institute for Shelter This report was written by New Policy Institute. It was commissioned by Shelter with funding
LOW INCOME LONDONERS AND WELFARE REFORM A DATA LED INVESTIGATION INTO THE CAUSES AND CONSEQUENCES OF POVERTY
 LOW INCOME LONDONERS AND WELFARE REFORM A DATA LED INVESTIGATION INTO THE CAUSES AND CONSEQUENCES OF POVERTY 1 PHASE ONE FINDINGS, JUNE 2017 Contents Foreword by Jane Mansour... 3 Executive Summary...
Demography and deprivation in Southwark and Tower Hamlets. A paper for the Wakefield and Tetley Trust by the New Policy Institute
 Demography and deprivation in Southwark and Tower Hamlets A paper for the Wakefield and Tetley Trust by the New Policy Institute August 2016 Table of Contents 1. Introduction and summary... 3 1.1. Introduction...
Household income distribution estimates: The example of Pay to Stay impacts in Local Authority areas in two English regions
 Household income distribution estimates: The example of Pay to Stay impacts in Local Authority areas in two English regions Chihiro Udagawa and Paul Sanderson August 2016 Household income distribution
Asda Income Tracker. Report: July 2016 Released: August Centre for Economics and Business Research ltd
 Asda Income Tracker Report: July 2016 Released: August 2016 M a k i n g B u s i n e s s S e n s e Centre for Economics and Business Research ltd Unit 1, 4 Bath Street, London EC1V 9DX t 020 7324 2850 w
Two Islingtons: Understanding the problem
 www.islington.gov.uk/fairness Two Islingtons: Understanding the problem Paper 1: What is the picture for Islington? Understanding the evidence base Introduction 1. It has become rather clichéd to say that
LONDON RESIDENTIAL REVIEW BREXIT AND THE PRIME LONDON PROPERTY MARKET AUTUMN 2016
 LONDON RESIDENTIAL REVIEW BREXIT AND THE PRIME LONDON PROPERTY MARKET AUTUMN 2016 BREXIT VOTE REINFORCES PRICING TRENDS STAMP DUTY REFORMS IMPACT LONDON MARKET SUB- 2 MILLION MARKET OUTPERFORMS LONDON
A Minimum Income Standard for London
 Loughborough University Institutional Repository A Minimum Income Standard for London This item was submitted to Loughborough University's Institutional Repository by the/an author. Citation: VALADEZ,
London labour market projections 2017
 Copyright Greater London Authority August 217 Published by Greater London Authority City Hall The Queen s Walk London SE1 2AA www.london.gov.uk enquiries 2 7983 41 minicom 2 7983 4458 ISBN 978-1-84781-66-3
Help to Buy: ISA (Issue 3)
") Please keep for future reference Page 1 of 3 Call in to any Santander branch The Financial Conduct Authority is a financial services regulator. It requires us, Santander UK plc, to give you this important
Please keep for future reference Page 1 of 3 Call in to any Santander branch The Financial Conduct Authority is a financial services regulator. It requires us, Santander UK plc, to give you this important
A Minimum Income Standard for London Matt Padley
 A Minimum Income Standard for London 2017 Matt Padley December 2017 About Trust for London Trust for London is the largest independent charitable foundation funding work which tackles poverty and inequality
Economic Standard of Living
 DESIRED OUTCOMES New Zealand is a prosperous society where all people have access to adequate incomes and enjoy standards of living that mean they can fully participate in society and have choice about
Economic Standard of Living
 DESIRED OUTCOMES New Zealand is a prosperous society, reflecting the value of both paid and unpaid work. All people have access to adequate incomes and decent, affordable housing that meets their needs.
Joint Negotiating Committee for Youth and Community Workers
 Joint Negotiating Committee for Youth and Community Workers Staff Side Pay and Conditions Claim 2014 Submitted by Unite, Unison, NUT and UCU June 2014 Contents Introduction...3 Summary of Claim...3 1.
The Impact of Welfare Reform in Kingston
 The Impact of Welfare Reform in Kingston October 2013 October 2016 Strategic Business Royal Borough of Kingston upon Thames Contents: Summary p2 Overview p4-15 Trends & Future Changes Across Kingston p16-33
London s Poverty Profile
 London s Poverty Profile Adam Tinson, Carla Ayrton, Karen Barker, Theo Barry Born and Otis Long 2017 London s Poverty Profile 2017 Adam Tinson, Carla Ayrton, Karen Barker, Theo Barry Born and Otis Long
Age UK Waltham Forest Profile: Deprivation in Waltham Forest 08/01/2013
 Age UK Waltham Forest Profile: Deprivation in Waltham Forest 08/01/2013 Population Waltham Forest (WF) has a population of some 258,249 1 persons living in 96,861 households. There are 57,000 people aged
Report of the National Equality Panel: Executive summary
 Report of the National Equality Panel: Executive summary January 2010 The independent National Equality Panel was set up to examine how inequalities in people s economic outcomes such as earnings, incomes
STILL TOO POOR TO PAY
 STILL TOO POOR TO PAY THREE YEARS OF LOCALISED COUNCIL TAX SUPPORT IN LONDON Sam Ashton, Marc Francis and Alice Woudhuysen STILL TOO POOR TO PAY: ThRee YeARS Of LOcALISed council TAx SuPPORT In LOndOn
Peterborough Sub-Regional Strategic Housing Market Assessment
 Peterborough Sub-Regional Strategic Housing Market Assessment July 2014 Prepared by GL Hearn Limited 20 Soho Square London W1D 3QW T +44 (0)20 7851 4900 F +44 (0)20 7851 4910 glhearn.com Appendices Contents
MONITORING POVERTY AND SOCIAL EXCLUSION IN SCOTLAND 2015
 MONITORING POVERTY AND SOCIAL EXCLUSION IN SCOTLAND 2015 This study is the seventh in a series of reports monitoring poverty and social exclusion in Scotland since 2002. The analysis combines evidence
HelptoBuy:ISA(Issue3)
") Page 1 of 4 Please keep for future reference Talk to us in branch HelptoBuy:ISA(Issue3) Key Facts Document (including Financial Services Compensation Scheme (FSCS) Information Sheet & Exclusions List)
Page 1 of 4 Please keep for future reference Talk to us in branch HelptoBuy:ISA(Issue3) Key Facts Document (including Financial Services Compensation Scheme (FSCS) Information Sheet & Exclusions List)
Skills for Health: Skills and Labour Market Intelligence Briefing for London, 2010
 Skills for Health: Skills and Labour Market Intelligence Briefing for London, 2010 All material in this report is, unless otherwise stated, the property of Skills for Health. Copyright and other intellectual
West Surrey Strategic Housing Market Assessment
 West Surrey Strategic Housing Market Assessment Summary Report December 2014 Prepared by GL Hearn Limited 280 High Holborn London WC1V 7EE T +44 (0)20 7851 4900 glhearn.com Contents Section Page 1 INTRODUCTION
Michelle Jones, Stephanie Tipping
 Economy READER INFORMATION Need Identified Lead Author Date completed Director approved Economy Michelle Jones, Stephanie Tipping To be signed off To be signed off Key needs Economic inactivity The employment
Detailed calculation of out of London Living wage: method, rationale, data sources and figures for the 2010/11 calculation.
 Detailed calculation of out of London Living wage: method, rationale, data sources and figures for the 2010/11 calculation. by Donald Hirsch The following account of the process involved in setting the
Local Government Pension Scheme (England and Wales) Actuarial valuation as at 31 March 2013 Report on data used for experience analysis
 Actuarial valuation as at 31 March 2013 Report on data used for experience analysis") Date: 2 February 2015 Authors: Ian Boonin FIA Michael Scanlon FIA Contents page 1 Introduction 1 2 Description of movements data provided 2 3 Checks carried out on the data 4 4 Summary of membership movements
Date: 2 February 2015 Authors: Ian Boonin FIA Michael Scanlon FIA Contents page 1 Introduction 1 2 Description of movements data provided 2 3 Checks carried out on the data 4 4 Summary of membership movements
The cost of a child in Donald Hirsch
 The cost of a child in 2013 Donald Hirsch August 2013 The cost of a child in 2013 Donald Hirsch August 2013 CPAG promotes action for the prevention and relief of poverty among children and families with
Consultation response
 Consultation response Age UK s Response to the Work and Pensions Committee Inquiry into changes to Housing Benefit September 2010 Name: Sally West Email: sally.west@ageuk.org.uk Age UK Astral House, 1268
MONITORING POVERTY AND SOCIAL EXCLUSION 2016
 MONITORING POVERTY AND SOCIAL EXCLUSION 2016 This latest annual report from the New Policy Institute brings together the most recent data to present a comprehensive picture of poverty in the UK. Key points
Policy paper GDPR in Local Government
 Policy paper GDPR in Local Government CONTENTS 1 Introduction and methodology Page 2 Analysis of Council Strategy Page 3-4 Recommendations and data Page 5 Conclusion Page 6 Introduction 2 The incoming
Changes to work and income around state pension age
 Changes to work and income around state pension age Analysis of the English Longitudinal Study of Ageing Authors: Jenny Chanfreau, Matt Barnes and Carl Cullinane Date: December 2013 Prepared for: Age UK
Asda Income Tracker. Report: December 2012 Released: January Centre for Economics and Business Research ltd
 Asda Income Tracker Report: December 2012 Released: January 2013 M a k i n g B u s i n e s s S e n s e Centre for Economics and Business Research ltd Unit 1, 4 Bath Street, London EC1V 9DX t 020 7324 2850
Calculating a Living Wage for London and the rest of the UK
 BRIEFING Calculating a Living Wage for London and the rest of the UK Conor D Arcy & David Finch November 2017 resolutionfoundation.org info@resolutionfoundation.org +44 (0)203 372 2960 Calculating a Living
Profiting from Parking
 Profiting from Parking London boroughs are now making enormous profits from on-street parking charges and fines for parking infringements. They also make large profits from Permit Parking Schemes and are
The Money Statistics. December.
 The Money Statistics December 2018 Welcome to the December 2018 edition of The Money Statistics, The Money Charity s monthly roundup of statistics about how we use money in the UK. If you have any questions,
INDICATORS OF POVERTY AND SOCIAL EXCLUSION IN RURAL ENGLAND: 2009
 INDICATORS OF POVERTY AND SOCIAL EXCLUSION IN RURAL ENGLAND: 2009 A Report for the Commission for Rural Communities Guy Palmer The Poverty Site www.poverty.org.uk INDICATORS OF POVERTY AND SOCIAL EXCLUSION
TRADE UNION MEMBERSHIP Statistical Bulletin
 TRADE UNION MEMBERSHIP 2016 Statistical Bulletin May 2017 Contents Introduction 3 Key findings 5 1. Long Term and Recent Trends 6 2. Private and Public Sectors 13 3. Personal and job characteristics 16
INCOME AND EXPENDITURE: PHILIPPINES. Euromonitor International March 2015
 INCOME AND EXPENDITURE: PHILIPPINES Euromonitor International March 2015 I N C O M E A N D E X P E N D I T U R E : P H I L I P P I N E S P a s s p o r t I LIST OF CONTENTS AND TABLES Chart 1 SWOT Analysis:
Economic standard of living
 Home Previous Reports Links Downloads Contacts The Social Report 2002 te purongo oranga tangata 2002 Introduction Health Knowledge and Skills Safety and Security Paid Work Human Rights Culture and Identity
Monitoring the Impact of Welfare Reform in Cambridgeshire. September 2013
 Monitoring the Impact of Welfare Reform in Cambridgeshire September 2013 16/10/2013 1 Contents: Page Background 3 Executive Summary 3 Summary Points 4 Monitoring information from districts 8 Monitoring
HelptoBuy:ISA(Issue3)
") Page 1 of 4 Please keep for future reference Talk to us in branch santander.co.uk HelptoBuy:ISA(Issue3) Key Facts Document (including Financial Services Compensation Scheme (FSCS) Information Sheet & Exclusions
Page 1 of 4 Please keep for future reference Talk to us in branch santander.co.uk HelptoBuy:ISA(Issue3) Key Facts Document (including Financial Services Compensation Scheme (FSCS) Information Sheet & Exclusions
Asda Income Tracker. Report: June 2012 Released: July Centre for Economics and Business Research ltd
 Asda Income Tracker Report: June 2012 Released: July 2012 M a k i n g B u s i n e s s S e n s e Centre for Economics and Business Research ltd Unit 1, 4 Bath Street, London EC1V 9DX t 020 7324 2850 w www.cebr.com
AUGUST THE DUNNING REPORT: DIMENSIONS OF CORE HOUSING NEED IN CANADA Second Edition
 AUGUST 2009 THE DUNNING REPORT: DIMENSIONS OF CORE HOUSING NEED IN Second Edition Table of Contents PAGE Background 2 Summary 3 Trends 1991 to 2006, and Beyond 6 The Dimensions of Core Housing Need 8
A minimum income standard for the UK in 2011
 A minimum income standard for the UK in 2011 Donald Hirsch www.jrf.org.uk A minimum income standard for the UK in 2011 Donald Hirsch July 2011 This is the 2011 update of the Minimum Income Standard for
For review, comment and to spark conversations.version as at 01 September 2016
 2.6 Local economy 2.6.1 Markets and sectors This section looks at some of Newcastle s economic strengths together with some of the risks facing the local economy. Note: Gross Value Added (GVA) is the standard
Economic Standard of Living
 DESIRED OUTCOMES New Zealand is a prosperous society, reflecting the value of both paid and unpaid work. All people have access to adequate incomes and decent, affordable housing that meets their needs.
The Money Statistics. April
 The Money Statistics April 2018 Welcome to the April 2018 edition of The Money Statistics The Money Charity s monthly round-up of statistics about how we use money in the UK. These were previously published
UNITED KINGDOM The UK Financial year runs from April to April. The rates and rules below are for June Overview of the system
 UNITED KINGDOM 2007 The UK Financial year runs from April to April. The rates and rules below are for June 2007. 1. Overview of the system Within the United Kingdom Jobseeker s Allowance is the main benefit
DISPOSABLE INCOME INDEX
 DISPOSABLE INCOME INDEX Q4 2017 A commissioned report for Scottish Friendly CREDIT CARD 1234 5678 9876 5432 JOHN SMITH Executive summary The Scottish Friendly Disposable Income Index uses new survey data
Asda Income Tracker. Report: March 2012 Released: April Centre for Economics and Business Research ltd
 Asda Income Tracker Report: March 2012 Released: April 2012 M a k i n g B u s i n e s s S e n s e Centre for Economics and Business Research ltd Unit 1, 4 Bath Street, London EC1V 9DX t 020 7324 2850 w
The Money Statistics. August
 The Money Statistics August 2018 Welcome to the August 2018 edition of The Money Statistics The Money Charity s monthly round-up of statistics about how we use money in the UK. These were previously published
The Impacts of Welfare Reform
 The local and regional impact of welfare reform The Impacts of Welfare Reform Steve Fothergill Centre for Regional Economic and Social Research Sheffield Hallam University Publications Hitting the Poorest
The Cumulative Impact of Welfare Reform in Hounslow
 The Cumulative Impact of Welfare Reform in Hounslow Contents Executive Summary... 4 The cumulative impact of welfare reform... 4 The impact of individual welfare reforms... 4 The impact of Universal Credit...
NAB QUARTERLY CONSUMER BEHAVIOUR SURVEY Q4 2017
 NAB QUARTERLY CONSUMER BEHAVIOUR SURVEY Q4 2017 INSIGHTS INTO THE MINDSET OF AUSTRALIAN CONSUMERS ANXIETIES AROUND FUTURE SPENDING AND SAVINGS PLANS, HOUSEHOLD FINANCES, THE ECONOMY, FINANCIAL CONCERNS
Asda Income Tracker. Report: December 2011 Released: January Centre for Economics and Business Research ltd
 Asda Income Tracker Report: December 2011 Released: January 2012 M a k i n g B u s i n e s s S e n s e Centre for Economics and Business Research ltd Unit 1, 4 Bath Street, London EC1V 9DX t 020 7324 2850
MONITORING POVERTY AND SOCIAL EXCLUSION 2015
 MONITORING POVERTY AND SOCIAL EXCLUSION 2015 This annual review by the New Policy Institute brings together indicators covering poverty, work, education and housing. It looks at changes over the last parliament
Understanding Landlords
 Understanding Landlords A study of private landlords in the UK using the Wealth and Assets Survey Chris Lord, James Lloyd and Matt Barnes July 2013 www.strategicsociety.org.uk! Published by the Strategic
2011 Community Development Halton, all rights reserved.
 May 2011 2011 Community Development Halton, all rights reserved. Copies of this document may be reproduced non-commercially for the purpose of community awareness or community development with appropriate
Housing and Welfare Reform
 Housing and Welfare Reform CIH South East Conference, Brighton 6 th March 2013 Andrew Parfitt Deputy Director of Housing Policy Andrew.parfitt@dwp.gsi.gov.uk Summary of reforms in relation to Housing (1)
Poverty figures for London: 2010/11 Intelligence Update
 Poverty figures for London: 2010/11 Intelligence Update 11-2012 Key points The number of Londoners living in poverty has seen little change. Children, particularly those in workless households, remain
Asda Income Tracker. Report: December 2015 Released: January Centre for Economics and Business Research ltd
 Asda Income Tracker Report: December 2015 Released: January 2016 M a k i n g B u s i n e s s S e n s e Centre for Economics and Business Research ltd Unit 1, 4 Bath Street, London EC1V 9DX t 020 7324 2850
Post-Secondary Education, Training and Labour Prepared November New Brunswick Minimum Wage Report
 Post-Secondary Education, Training and Labour Prepared November 2018 2018 New Brunswick Minimum Wage Report Contents Section 1 Minimum Wage Rates in New Brunswick... 2 1.1 Recent History of Minimum Wage
The Impacts of Welfare Reform
 The impact of welfare reform across Britain The Impacts of Welfare Reform Steve Fothergill Centre for Regional Economic and Social Research Sheffield Hallam University Publications Hitting the Poorest
The Deloitte Consumer Tracker Confidence pauses as consumers react to wider uncertainty
 2016 The Deloitte Consumer Tracker Confidence pauses as consumers react to wider uncertainty The latest Deloitte Consumer Tracker shows a fall in consumer confidence in the first quarter of 2016, a sign
Marmot Indicators 2015 A preliminary summary with graphs
 Marmot Indicators 2015 A preliminary summary with graphs Marmot Indicators 2015 Fair Society, Healthy Lives, The Marmot Review was published in 2010 i. The review set out the key areas that needed to be
Proposal for asset pooling in the LGPS 15 July 2016
 Proposal for asset pooling in the LGPS 15 July 2016 Name of pool London CIV The London CIV was formed as a voluntary collaborative venture by the London Local Authorities in 2014 and has led the way in
First-time buyers stumping up 209,000 to get on property ladder
 11/08/2018 @HalifaxBankNews NOT FOR BROADCAST OR PUBLICATION BEFORE 00.01 HRS ON 11 AUGUST 2018 First-time buyers stumping up 209,000 to get on property ladder First-time buyer numbers reach highest for
Baby Boomers and Housing Markets. Presentation by Clare Wall, SGS Associate 7 th National Housing Conference October 2012
 Baby Boomers and Housing Markets Presentation by Clare Wall, SGS Associate 7 th National Housing Conference October 2012 This report has been prepared on behalf of 7th National Housing Conference. SGS
CIH Response to Budget and Future Directions. 30 March 2011 Sam Lister, Policy and Practice Officer, CIH
 CIH Response to Budget and Future Directions 30 March 2011 Sam Lister, Policy and Practice Officer, CIH sam.lister@cih.org Political context The Context Work and Pensions is largest budget more than entire
Household Benefit Cap. Equality impact assessment October 2011
 Household Benefit Cap Equality impact assessment October 2011 Equality impact assessment for household benefits cap Brief outline of the policy or service 1. From 2013 the Government will introduce a cap
Analysis of poverty impact of Budget December 2008
 Analysis of poverty impact of Budget 2009 December 2008 Key points - For the first time in many years, the Budget tax/welfare package yields savings of 841 million. Only on social welfare measures are
APPENDIX 1 DETAILED LIST OF CHANGES & IMPACTS. Housing related changes
 APPENDIX 1 DETAILED LIST OF CHANGES & IMPACTS Housing related changes From April 2011: Cap on Local Housing Allowance (LHA) LHA is the housing benefit for private rented sector (where claim processed after
Table two: A timeline of welfare reform
 Table two: A timeline of welfare reform Reforms Implementation date Client groups affected Child trust funds: abolished May 2010 Young people Mortgage interest support: paid at Bank of England interest
Yukon Bureau of Statistics
 Yukon Bureau of Statistics 2 9 # $ > 0-2 + 6 & ± 8 < 3 π 7 5 9 ^ Highlights Income and Housing 20 National Household Survey According to the 20 National Household Survey (NHS), the median income in Yukon
CEPR CENTER FOR ECONOMIC AND POLICY RESEARCH
 CEPR CENTER FOR ECONOMIC AND POLICY RESEARCH The Wealth of Households: An Analysis of the 2016 Survey of Consumer Finance By David Rosnick and Dean Baker* November 2017 Center for Economic and Policy Research
MONITORING POVERTY AND SOCIAL EXCLUSION IN NORTHERN IRELAND 2016
 MONITORING POVERTY AND SOCIAL EXCLUSION IN NORTHERN IRELAND 216 This Findings from the New Policy Institute brings together the latest data to show the extent and nature of poverty in. It focuses on the
Welfare Reform Bill 2011
 Welfare Reform Bill 2011 Briefing for 2nd Reading Wednesday 9 th March Summary Shelter supports the principles of the new universal credit, which is the major piece of reform contained in the Welfare Reform
Household Benefit Cap. Equality impact assessment March 2011
 Household Benefit Cap Equality impact assessment March 2011 Equality impact assessment for household benefits cap Brief outline of the policy or service 1. From 2013 the Government will introduce a cap
2016 Census of Canada
 216 Census of Canada Incomes Results from the latest Census release show that Alberta had the highest median income among the provinces. Alberta s strong economic expansion in recent years, particularly
MOVING ON UP Improving employment outcomes for young black men in London
 MOVING ON UP Improving employment outcomes for young black men in London BRIEFING PAPER No 8 JUNE 2017 Moving on Up is an employment initiative helping young black men to find jobs and careers in London
Saving and Investing Among High Income African-American and White Americans
 The Ariel Mutual Funds/Charles Schwab & Co., Inc. Black Investor Survey: Saving and Investing Among High Income African-American and Americans June 2002 1 Prepared for Ariel Mutual Funds and Charles Schwab
DISPOSABLE INCOME INDEX
 DISPOSABLE INCOME INDEX Q1 2018 A commissioned report for Scottish Friendly CREDIT CARD 1234 5678 9876 5432 JOHN SMITH Executive summary The Scottish Friendly Disposable Income Index uses new survey data
Women s pay and employment update: a public/private sector comparison
 Women s pay and employment update: a public/private sector comparison Report for Women s Conference 01 Women s pay and employment update: a public/private sector comparison Women s employment has been