TEXAS is the 11th largest economy in the world. The reasons why Texas has traditionally grown faster The increasing international prominence of Texas
|
|
|
- Priscilla Carpenter
- 6 years ago
- Views:
Transcription

1
2 TEXAS is the 11th largest economy in the world. The reasons why Texas has traditionally grown faster The increasing international prominence of Texas Why global companies are basing headquarters or North American operations in Texas Texas workforce projections Projections for future growth What could go wrong? 11:30 to 12:30 3 speakers with Q&A
3 JASON SAVING Senior Research Economist Dallas Federal Reserve Bank KING WHITE CEO and Founder Site Selection Group HANK N. MULVIHILL, JR. Director and Senior Wealth Advisor Smith Anglin Financial The Optimist Economist
4 NOTICE: Investing involves risk including the possible loss of principal and other losses. You must do your own due diligence prior to making any investment decisions. Opinions expressed in this presentation are for educational purposes only and are not to be considered as individual investment advice. NOTICE Henry (Hank) N. Mulvihill, Jr. is a licensed investment advisor representative registered with Smith Anglin Financial, LLC, the Advisor Firm. The Advisor Firm is a Registered Investment Advisor (RIA) firm located at Preston Road Suite 700 Dallas, Texas Registration of an Investment Advisor does not imply any level of skill or training. The oral and written communications of an Advisor provide you with information which you may use to evaluate or retain an advisor. The Advisor Firm may only transact business in those states in which it is registered, or qualifies for an exemption or exclusion from registration requirements. The Advisor Firm website may contain information about meetings, and general economic and market comments, and information about the firm. The Advisor Firm website is limited to the dissemination of general information pertaining to its advisory services, together with access to additional investment-related information, publications, and links. Accordingly, the Advisor Firm websites on the Internet should not be construed by any individual as a solicitation to effect transactions in securities, or the rendering of personalized investment advice for compensation, over the Internet. Any subsequent, direct investment-related communication by Advisor Firm representatives with a prospective client shall be conducted by a representative that is either registered or qualifies for an exemption or exclusion from registration in the state where the prospective client resides. For information pertaining to the registration status of the Advisor Firm, please contact the state securities regulators for those states in which the Advisor Firm maintains a notice filing. A copy of the Advisor Firm current ADV Part II is available from the Advisor Firm upon request, or from the SEC. Past performance may not be indicative of future results. Therefore, no individual should assume that future performance of any specific investment strategy will be profitable or equal the corresponding indicated performance level. Different types of investments involve varying degrees of risk, and there can be no assurance that any specific investment will either be suitable or profitable for an individual s investment portfolio. No portion of the Advisor Firm website content or links should be interpreted as individual investment, legal, accounting or tax advice.

5 United States Map With Flag by George Hodan
6
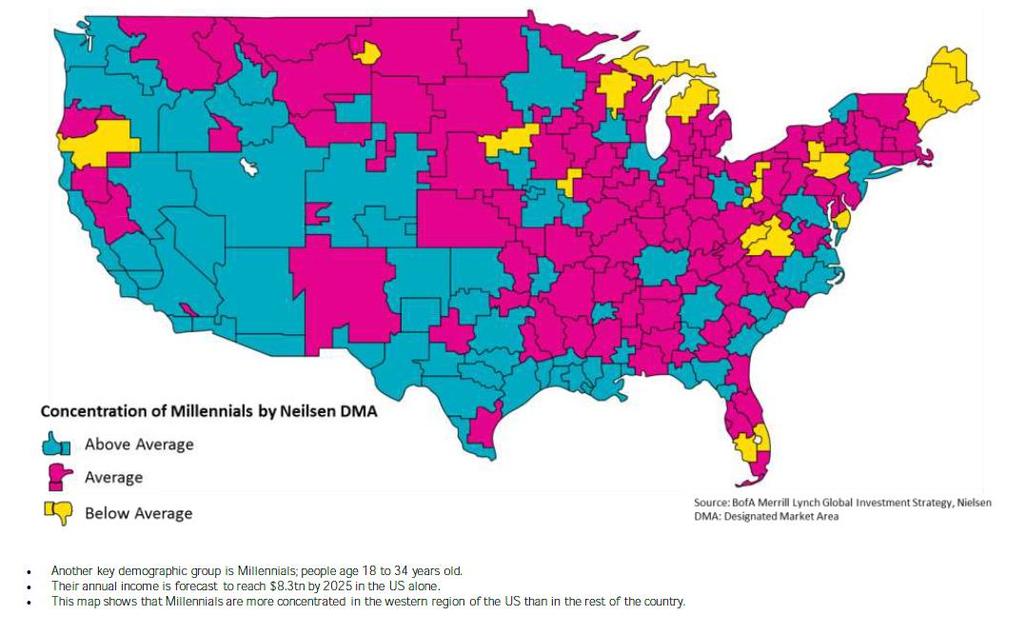
7 BIG FIVE massively powerful trends for the United States 1. MONEY abundant and low priced 2. WORKERS Abundant - Reduced Wage Pressure. Millennials! 3. INFRASTRUCTURE legal, roadways, internet, fiber, pipelines, capital markets - More Infrastructure than anywhere else 4. WATER inland rivers, annual snow and rainfall huge competitive advantage for agriculture, transportation and manufacturing. People too! 5. OIL and GAS The U.S. is now the world s leading producer.
8 Office of Tax Policy Research IRS
9

10 IRELAND 12.5% Competitive 2018 U.S. 21% Former U.S. 39.1%
11
12

13


14 Table 5.6.B. Average Price of Electricity to Ultimate Customers by End-Use Sector, by State, Year-to-Date through December 2017 and 2016 (Cents per Kilowatthour)


15 Texas Gross State Product $1,587 B laces/tx/ November 2016 Dallas-Arlington-Fort Worth Metropolitan Statistical Area gross metropolitan product, or GMP: $ B North Texas economy ranks No. 24, just behind Sweden. world-gdp-ranking-2017-gdpby-country-data-and-charts
16 Texas Gross State Product $1,587 B Population: 27,862,600 Median Household Income: $53,207 Job Growth (2016): 1.5% Cost of Doing Business: 10% below U.S.average College Attainment: 28.4% Net Migration (2015): 271,700 Moody's Bond Rating: Aaa November 2016
17 Texas - Forbes Lists #1 in Economic Climate #4 Best States for Business #4 in Business Costs #8 in Labor Supply #8 in Growth Prospects #25 in Regulatory Environment #32 in Quality of Life November 2016

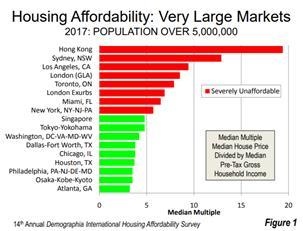
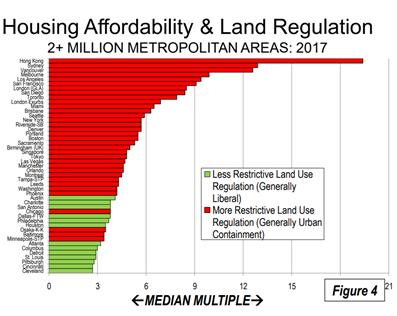
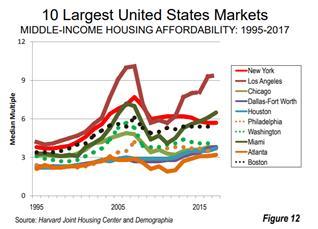
18 Who Can Afford the Median-Priced Home in Their Metro?
19
20
21
22

23 Estimated Percent Change of the Total Population by County, Texas, 2010 to 2016 Dallam Sherman OchiltreeLipscomb Hansford Hutchinson Hartley Moore RobertsHemphill Oldham Potter Carson Gray Wheeler -4.8% - 0% 0.1% - 2.5% 2.6% - 5% 5.1% - 10% 10.1% % Source: U.S. Census Bureau, 2016 Vintage Population Estimates Deaf Smith Randall DonleyCollingsworth Armstrong Parmer Castro Briscoe HallChildress Swisher Hardeman Bailey Lamb Hale Floyd Wilbarger Motley Cottle Foard Wichita Clay Lamar Crosby King Knox Baylor Archer Cooke GraysonFannin Red River CochranHockley Dickens Montague Bowie Lubbock Delta Kent Jack Titus Yoakum Terry Lynn Garza Haskell Young Wise Denton Collin Hunt Hopkins MorrisCass Stonewall Throckmorton Franklin Rockwall Rains Gaines Scurry Fisher Jones Parker Tarrant Dallas Wood Marion Upshur DawsonBorden Stephens Shackelford Palo Pinto KaufmanVan Zandt GreggHarrison El Paso Hood Smith Andrews Martin Eastland Johnson Mitchell Ellis Nolan Taylor Erath Panola Howard Callahan Somervell Henderson Rusk Navarro Hill Loving Glasscock Ector Comanche Winkler Midland Coke Bosque Shelby Sterling AndersonCherokee RunnelsColemanBrown Hamilton Freestone Nacogdoches Hudspeth Culberson Ward Mills McLennanLimestone Crane San AugustineSabine Reeves Upton Reagan Tom Green Coryell Irion Leon Houston Angelina Concho Falls San SabaLampasas Trinity McCulloch Bell RobertsonMadison Schleicher Burnet Polk Tyler Jeff Davis Pecos Menard Milam Walker Jasper Newton Crockett Mason Llano Williamson Brazos Grimes San Jacinto Sutton Kimble Burleson Hardin Gillespie Travis Lee Montgomery Terrell Blanco Washington Orange Presidio Liberty Edwards Kerr Hays Bastrop Waller Kendall Jefferson Val Verde Fayette Austin Harris Brewster Real Comal Caldwell Chambers Bandera Guadalupe Colorado Fort Bend Kinney Uvalde Medina Bexar GonzalesLavaca Galveston Wharton Brazoria Wilson DeWitt Jackson Zavala Frio Atascosa Karnes Victoria Matagorda Maverick Goliad Dimmit McMullen Bee Calhoun La Salle Live Oak Refugio San Patricio Aransas Webb Jim Wells Duval Nueces Kleberg Zapata Brooks Jim Hogg Kenedy Starr Willacy Hidalgo Cameron 23

24 TEXAS 27,959,000

25 Ever hear Demographics are Destiny? CIA Factbook 330,890,000
26 Texas Population Pyramid by Race/Ethnicity, 2014 Male White, Non-Hispanic Female White, Non-Hispanic 85 + years 80 years 75 years 70 years 65 years 60 years 55 years 50 years 45 years 40 years 35 years 30 years 25 years 20 years 15 years 10 years 5 years Under 1 year 250, , , ,000 50, , , , , ,000 Source: Texas Demographic Center, 2014 Population Estimates 26
27 Texas Population Pyramid by Race/Ethnicity, 2014 Male Hispanic Female, Hispanic 85 + years 80 years 75 years 70 years 65 years 60 years 55 years 50 years 45 years 40 years 35 years 30 years 25 years 20 years 15 years 10 years 5 years Under 1 year 250, , , ,000 50, , , , , ,000 Source: Texas Demographic Center, 2014 Population Estimates 27
28 Texas Population Pyramid by Race/Ethnicity, 2014 Male White, Non-Hispanic Male Hispanic Male Black, Non Hispanic Male Other, Non Hispanic Female White, Non-Hispanic Female, Hispanic Female Black, Non Hispanic Female Other, Non Hispanic 85 + years 80 years 75 years 70 years 65 years 60 years 55 years 50 years 45 years 40 years 35 years 30 years 25 years 20 years 15 years 10 years 5 years Under 1 year 250, , , ,000 50, , , , , ,000 Source: Texas Demographic Center, 2014 Population Estimates 28
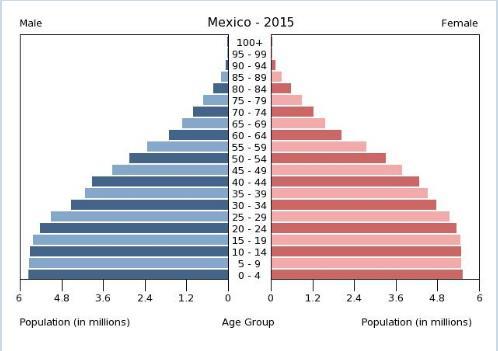
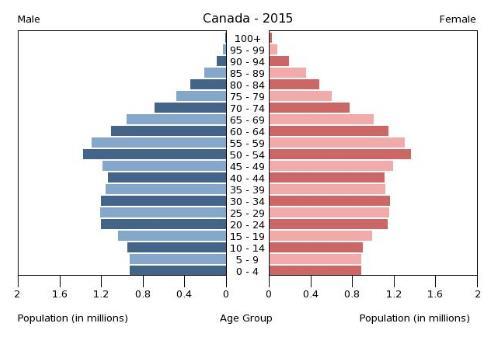
29 MEXICO 115,067,000 CANADA 35,332,000
30
31 JASON SAVING Senior Research Economist Dallas Federal Reserve Bank
32 Texas Economic Update (with Notes on Tax Reform) Jason Saving Senior Research Economist April 2018 Views expressed in this presentation are those of the presenter and do not necessarily reflect those of the Federal Reserve Bank of Dallas or the Federal Reserve System.
33 Introduction Texas is currently growing faster than the nation Part of a longer term trend Texas recently endured an energy slump and now Harvey What s the near term outlook? What are the main downside risks? How does tax reform affect the picture? Are there longer term state policy issues about which we should be concerned? 33
34 ND NV CO TX FL GA OR UT SC CA WA DE MA TN ID NC U.S. LA AR AZ OK MI RI NY OH KY NM WY WI IN IL MO MD AL PA MN SD CT KS IA NH NJ NE MS ME VA VT MT HI AK WV Typically, Texas grows faster than other states, a fact sometimes ascribed to our large energy sector Dec 2014 / Dec 2013 Percent Change, SAAR 5 Texas 4 Energy states denoted in black 3 U.S SOURCES: Bureau of Labor Statistics; FRB Dallas. 34
35 UT ID NV FL WA OR CA GA AZ TN NC SC CO MO HI MT VA NH U.S. MI IN MA AR KY MN MD NY TX NJ AL NE DE WI SD OH RI IL PA MS ME NM IA VT KS CT OK LA WV AK WY ND Employment growth slowed dramatically during the oil bust Dec 2016 / Dec 2014 Percent Change, SAAR 4 3 Energy states denoted in black U.S. Texas -4 SOURCES: Bureau of Labor Statistics; FRB Dallas. 35
36 NV OR UT TX FL SC WA ID CA CO GA IA MT MA AL NC MS U.S. WI PA MI AZ MN NM OK RI MD HI KY NE NY TN SD AR IN ME VT MO NH VA OH NJ IL CT KS ND WY LA WV DE AK before rebounding in 2017, in a way other energy states didn t Dec/Dec Percent Change, SAAR 4 Energy states denoted in black 3 Texas 2 U.S SOURCES: Bureau of Labor Statistics; FRB Dallas. 36
37 BUT DO WE REALLY GROW FASTER THAN THE NATION?
38 Texas monthly employment growth usually exceeds nation s Percent change, m/m, SAAR Texas U.S NOTE: Last data point is Sept for Texas and Oct for U.S. SOURCES: Bureau of Labor Statistics; Texas Workforce Commission; seasonal and other adjustments by Federal Reserve Bank of Dallas.
39 Houston employment growth dipped during energy bust and again with Harvey Growth (Y/Y) San Antonio North/Central Texas Houston Border NOTES: Border includes Brownsville, Laredo, and McAllen. North/Central Texas includes Dallas, Fort Worth and Austin. SOURCES: Bureau of Labor Statistics; Texas Workforce Commission; seasonal and other adjustments by FRB Dallas. 39
40 Texas unemployment rate again below nation s Percent, SA U.S Texas NOTES: U.S. data through Jan Texas data through Dec SOURCE: Bureau of Labor Statistics. 40
41 Metro Area Unemployment Rates Converge After 2000, except for Houston Percent, SA 9 Houston Fort Worth San Antonio Dallas Austin NOTE: Last data point is September SOURCES: Bureau of Labor Statistics; Texas Workforce Commission; seasonal and other adjustments by Federal Reserve Bank of Dallas.
42 Initial Claims Briefly Soar Post-Harvey Thousands, seasonally adjusted Thousands, seasonally adjusted 350 Allison Katrina Ike Harvey Continuing claims Initial claims NOTE: Initial claims through Oct. 28, 2017; continuing claims through Oct. 21, SOURCE: U.S. Department of Labor.
43 Mil. jobs, SA Employment dipped after Harvey, then recovered its losses and is now growing at trend rate Texas Employment 12.6 Baseline estimate (9/4/17) 12.5 $60 billion estimate of damages (9/4/17) 12.5 Extrapolated data based on actual Aug.- Dec. growth Jan Feb Mar Apr May Jun Jul Aug Sep Oct Nov Dec Jan Feb Mar SOURCES: Bureau of Labor Statistics; National Oceanic and Atmospheric Administration; authors' calculations. 43
44 OUTPUT AND SECTORAL PERFORMANCE
45 Percent change, m/m, SAAR Dallas Fed business cycle (coincident) index points to continued moderate growth '72 '74 '76 '78 '80 '82 '84 '86 '88 '90 '92 '94 '96 '98 '00 '02 '04 '06 '08 '10 '12 '14 ' NOTE: Data through Jan SOURCES: Federal Reserve Bank of Dallas Texas Business Outlook Surveys (TBOS). 45
46 Index, 3MMA, SA 40 Dallas Fed also conducts Business Outlook Surveys, with headline measures near recent highs Service Sector (TSSOS Revenue) Manufacturing (TMOS Production) Mean TMOS since 2007 = 6.2 Mean TSSOS since 2007 = NOTE: Data through Jan SOURCES: Federal Reserve Bank of Dallas Texas Business Outlook Surveys (TBOS). 46
47 Texas exports fall during oil bust, then recover Index, real $, Jan. '00=100, SA 260 Texas U.S. minus Texas NOTES: Last data point for line chart is Dec SOURCES: U.S. Census Bureau; WISERTrade. 47
48 Petroleum products explain the 2009 jump Index, SA, real $, Q1 2000= Texas petroleum prod., chem. & mining exports Rest of Texas exports U.S. ex. Texas '00 '01 '02 '03 '04 '05 '06 '07 '08 '09 '10 '11 '12 '13 '14 '15 '16 '17 SOURCES: U.S. Census, Bureau of Labor Statistics, WISERtrade, Federal Reserve Bank of Dallas. 48
49 Energy stronger, but nowhere near recent highs Rig count, weekly 1,200 1, Texas Rig Count Nominal price, $ weekly WTI Oil Price Natural Gas Price NOTES: Last data point is Feb. 9, Natural gas price is multiplied by 10. SOURCES: Baker Hughes; Energy Information Administration; Wall Street Journal. 49
50 and energy activity is more heavily concentrated in West Texas Permian Basin Completed wells per day 25 Permian 20 Eagle Ford Bakken SOURCE: Energy Information Administration.
51 Texas missed the boom-bust housing price cycle of early 2000s, is keeping pace with nation now Thousands of real $, 4MMA, SA U.S. $252,422 $226, Texas SOURCES: Multiple Listing Service; Texas A&M Real Estate Center. 51
52 Residential starts and permits below pre-recession highs Index, 5MMA, Jan. 2005=100, SA Multifamily permits Residential housing starts Single family permits SOURCES: U.S. Census Bureau; Bank of Tokyo-Mitsubishi UFJ. 52
53 OUTLOOK AND CONCLUSION
54 Texas Leading Index components mostly positive Net contributions to change in the Texas Leading Index October -December 2.20 Net Change in Texas Leading Index Texas Value of the Dollar 0.75 U.S. Leading Index 0.40 Real Oil Price Well Permits New Unemployment Claims 0.53 Texas Stock Index 0.93 Help Wanted Index Average Weekly Hours NOTE: Seasonally adjusted. SOURCE: Federal Reserve Bank of Dallas. 54
55 Texas Jobs Forecast to Grow 2.5% to 3.5% in 2018 Index, '87 = 100 Millions, SA Texas Leading Index Texas Nonfarm Employment and Forecast (with 80% confidence band) SOURCES: Bureau of Labor Statistics; Texas Workforce Commission; Federal Reserve Bank of Dallas
56 Talking Points Texas typically grows a percentage point faster than the nation Business climate, cost of living, immigration Post-Harvey growth has returned to trend and the energy sector s outlook is positive Are there short-term downside risks? Energy, labor market slack, higher trade barriers What about tax reform? 56
57 Tax Reform and Texas Lower corporate rates, expensing provisions may encourage firms to raise US production and investment Texas favorable business climate Caps on state and local deduction and mortgage deductibility will bind much more in higher-tax and highercost-of-living states More incentive to move Higher after-tax housing costs could slightly dampen home price appreciation nationwide Less true for Texas 57
58 Longer-term challenges K-12 test scores, funding at or below the national average Infrastructure receives an average grade from civil engineering assessments Largest share of uninsured residents in the nation How to maintain relatively low per capita tax burden and favorable business climate while addressing these issues? 58
59 KING WHITE CEO and Founder Site Selection Group


60 CORPORATE LOCATION TRENDS


61 SITE SELECTION GROUP 250+ PROJECTS completed per year 25 FORTUNE 100 companies represented 1,253 GLOBAL CITIES proactively researched 2.4M SQUARE FEET of real estate transactions in 2017 $300M REAL ESTATE transaction value in 2017 $2.0B ECONOMIC INCENTIVES secured in last 10 years


62 SERVICES & CLIENTS L OCAT I ON A DV I SORY SERV I C ES ECONOMIC I N C ENTIVE SERV I C ES C ORPORAT E R EAL ESTAT E SERV I C ES ECONOMIC D EVELOPMENT C ONSULT I N G

63 MACRO TRENDS IMPACTING LOCATION STRATEGIES Technological Advances Globalization Capital Deployment Business Climate 20


64 LOCATION DRIVERS HQ, IT & Back Office Manufacturing Plants Distribution Centers 1. Labor Availability 2. Labor Cost 3. Education System 4. Real Estate Availability 5. Economic Incentives 6. Business Climate 7. Accessibility 8. Disaster Recovery 1. Labor Availability 2. Labor Cost 3. Logistics 4. Business Climate 5. Real Estate Availability 6. Regulatory Environment 7. Utilities & Infrastructure 8. Economic Incentives 1. Logistics 2. Labor Availability 3. Labor Cost 4. Real Estate Availability 5. Business Climate 6. Economic Incentives 20
65 MAJOR WINS IN TEXAS Company Location Expansion Type Operation Type Economic Incentives ($M) Capex ($M) Facebook Fort Worth New Project Data Center $ $ # of Jobs American Airlines Fort Worth Expansion Project Headquarters $21.25 $ ,279 General Motors Arlington, TX Expansion Project Distribution Center $14.30 $ TJ Maxx San Antonio, TX New Project Distribution Center $11.30 $ ,000 McKesson Irving, TX New Project Operations Center $9.75 $ AmerisourceBergen Carrollton, TX New Project Headquarters $9.00 $ ,184 Schlumberger Sugar Land Expansion Project Headquarters $8.55 $ NTT Data Plano, TX New Project Headquarters $7.50 $ ,377 Amazon Houston, TX New Project Distribution Center $7.00 $ ,000 Fairway Energy Houston, TX Expansion Project Energy $6.50 $ Charles Schwab Westlake, TX New Project Operations Center $6.00 $ ,200 USAA San Antonio, TX Expansion Project Headquarters $6.00 $ ,500 Liberty Mutual Plano New Project Operations Center $5.20 $ ,000 Topgolf El Paso, TX New Project Retail $5.20 $ Sabre Westlake, TX New Project Headquarters $5.00 $ JPMorgan Chase Plano, TX New Project Operations Center $4.90 $ ,800 Finisar Corporation Sherman, TX New Project Manufacturing $4.50 $ Kubota Tractor Grapevine New Project Headquarters $3.80 $ USA800 Wichita Falls, TX New Project Call Center $3.40 $ Golden State Foods Burleson, TX New Project Manufacturing $2.70 $ Ernst & Young San Antonio, TX New Project Shared Service Center $2.63 $ GM Financial San Antonio New Project Operations Center $2.50 $ Cognizant Irving, TX New Project IT Operations Center $2.11 $8.00 1,090 Source: Incentives Monitor SITE SELECTION GROUP PAGE 65

66 HEADQUARTER RELOCATIONS TO DFW 106 HQ RELOCATIONS TO DFW SINCE 2010 Source: Dallas Regional Chamber 20
67 FORTUNE 500 HQ MOVEMENT DFW to 22 San Jose to 17 Philadelphia to 14 CHANGE IN NUMBER OF FORTUNE 500 HQS FROM Chicago to 33 Connecticut to 12 Boston to 11 San Francisco to 18 Minneapolis NC 17 to 17 Washington DC NC 17 to 17 Atlanta NC 15 to 15 Detroit to 10 New York to 69 Los Angeles to 15 Houston to 20 Source: Dallas Regional Chamber 20

68 POPULATION GROWTH TRENDS Texas had highest population growth in US with +3,158,496 (+12.6%) people added since
69 ECONOMIC INCENTIVE COMPETIVENESS MICHIGAN MICHIGAN COMPETITIVE RANKING Highly Competitive Competitive Non-Competitive Source: Site Selection Group Texas is Highly Competitive 20

70 TEXAS ENTERPRISE FUND DISBURSEMENT 58% of TEF Awarded to Projects in North Texas Region Source: Office of the Governor / Department of Research & Economic Analysis, 9/

71 UNEMPLOYMENT AT HISTORIC LOWS Source: Bureau of Labor & Statistics Metro Area Unemployment Rate Midland 2.4% Amarillo 2.8% Austin-Round Rock 3.0% Lubbock 3.1% College Station-Bryan 3.1% Odessa 3.3% San Antonio 3.4% San Angelo 3.4% Sherman-Denison 3.4% Dallas-Fort Worth 3.6% Abilene 3.6% Wichita Falls 3.6% Waco 3.8% Tyler 3.8% Laredo 3.9% Killeen-Temple 4.1% Victoria 4.4% El Paso 4.6% Longview 4.6% Houston 4.8% Texarkana 4.8% Corpus Christi 5.9% Brownsville 6.8% Beaumont 7.3% McAllen 7.6% 20
72 WAGE INFLATION DUE TO LABOR CHALLENGES Source: Bureau of Labor & Statistics Metro Area Wages and Salaries 12-Month % Changes for Period Ended Dec Sep Dec Change Northeast Boston-Worcester-Manchester New York-Newark-Bridgeport Philadelphia-Camden-Vineland South Atlanta-Sandy Springs-Gainesville Dallas-Fort Worth Houston-Baytown-Huntsville Miami-Fort Lauderdale Washington-Baltimore-N. Virginia Midwest Chicago-Naperville-Michigan City Detroit-Warren-Flint Minneapolis-St. Paul-St. Cloud West Los Angeles-Long Beach-Riverside Phoenix-Mesa-Scottsdale San Jose-San Francisco-Oakland Seattle-Tacoma-Olympia
73 JOB OPENINGS INTENSIFY Job Postings per Person in the Labor Force Houston, TX San Antonio, TX Texas Austin-Round Rock, TX Dallas-Fort Worth, TX DFW HAD 2,388,013 UNIQUE JOB POSTINGS IN 2017 Source: EMSI, Bureau of Labor & Statistics SITE SELECTION GROUP PAGE 73


74 FUTURE CHALLENGES LABOR SHORTAGE COST OF DOING BUSINESS WORKFORCE DEVELOPMENT WAGE INFLATION POLITICS REAL ESTATE MEDIA PAGE 74
75 QUESTIONS? JASON SAVING, Senior Economist Dallas Federal Reserve Bank KING WHITE, CEO and Founder Site Selection Group HANK N. MULVIHILL, JR., CCM, CWS, CFP The Optimist Economist
76 SITE (7483)
77


78 Texas Economic Update (with Notes on Tax Reform) Jason Saving Senior Research Economist April 2018 Views expressed in this presentation are those of the presenter and do not necessarily reflect those of the Federal Reserve Bank of Dallas or the Federal Reserve System.


79
80 Please open your TEXPO 2018 app and evaluate this presentation. Thank You!
Texas: Sources of Children s Coverage by County,
 Texas: Sources of Children s Coverage by County, 2011-2015 Percent of with Medicaid/CHIP Percent of with ESI Percent of with direct purchase Percent of with other coverage Percent of who are uninsured
$ FACTS ABOUT TEXAS: WAGE STATE FACTS HOUSING MOST EXPENSIVE AREAS WAGE RANKING
 STATE #21 * RANKING In Texas, the Fair Market Rent () for a two-bedroom apartment is $1,005. In order this level of and utilities without paying more than 30% of income on housing a household must earn
Map the Meal Gap 2018: Overall Food Insecurity in Texas by County in
 Map the Meal Gap 2018: Overall Insecurity in Texas by in 2016 1 and 185% Anderson 57,772 19.3% 11,160 58% 4% 38% Andrews 17,215 8.5% 1,470 61% 8% 31% Angelina 87,657 19.9% 17,480 67% 4% 29% Aransas 24,729
$ Monthly Rent Affordable to Selected Income Levels Compared with Two-Bedroom FMR. Gap between Rent Affordable and FMR $66
 In Texas, the Fair Market () for a two-bedroom apartment is $868. In order this level of rent and utilities without paying more than of income on housing a household must earn $2,894 monthly or $34,724
Undergraduate Admissions
 Undergraduate Admissions The UTSA Fact Book Office of Institutional Research Fall 217 First Time Undergraduate Student Applications The,, and information comes from the Coordinating Board Admissions file
Texas Mid-Year Economic Outlook: The Skies are Beginning to Clear Keith Phillips Assistant Vice President and Senior Economist
 Texas Mid-Year Economic Outlook: The Skies are Beginning to Clear Keith Phillips Assistant Vice President and Senior Economist The views expressed in this presentation are strictly those of the presenter
New Health Insurance Tax Credits in Texas
 EMBargoed until 12 Noon EDT Thursday, April 11, 2013 New Health Insurance Tax Credits in Texas Families USA Help Is at Hand: New Health Insurance Tax Credits in Texas April 2013 by Families USA This publication
2016 Texas Economic Outlook: Riding the Energy Roller Coaster Keith Phillips Assistant Vice President and Senior Economist
 216 Texas Economic Outlook: Riding the Energy Roller Coaster Keith Phillips Assistant Vice President and Senior Economist The views expressed in this presentation are strictly those of the presenter and
Dr. James P. Gaines Chief Economist. recenter.tamu.edu
 Dr. James P. Gaines Chief Economist recenter.tamu.edu 2018 A Very Good Year - 2019 Definite Slowdown Real GDP growth 2018 2.9%+ 2019 ~2.5% Jobs expanded ~1.5% Unemployment rate ~4.0%+ Interest rates up/down
Texas Economic Outlook: Tapping on the Brakes
 National Economy Picking Up After Q1 Pause Texas Economic Outlook: Tapping on the Brakes Keith Phillips Assistant Vice President and Senior Economist Consumer spending picked up in 1 as housing prices
2018 Texas Economic Outlook: Firing on All Cylinders
 218 Texas Economic Outlook: Firing on All Cylinders Keith Phillips Assistant Vice President and Senior Economist 4/5/218 The views expressed in this presentation are strictly those of the presenter and
Texas CorCare. Employee Notice of Network Requirements
 Texas CorCare Employee Notice of Network Requirements English Version UC-287(6-17) ABOUT THE NETWORK Texas CorCare is certified by the state of Texas as a Texas workers compensation health care network.
Texas Economic Outlook: Strong Growth Continues
 Texas Economic Outlook: Strong Growth Continues Keith Phillips Assistant Vice President and Senior Economist 1/23/18 The views expressed in this presentation are strictly those of the presenter and do
Texas Economic Outlook: Cruising in Third Gear
 Texas Economic Outlook: Cruising in Third Gear Keith Phillips Assistant Vice President and Senior Economist 1/19/17 The views expressed in this presentation are strictly those of the presenter and do not
Personal Lines Guidelines Effective 10/1/2016
 Personal Lines Guidelines Effective 10/1/2016 THESE ARE GUIDELINES ONLY AND ARE SUBJECT TO CHANGE OR WITHDRAWAL WITHOUT PRIOR NOTIFICATION. FINAL DETERMINATION REGARDING ACCEPTANCE OR REJECTION OF ANY
STATE BAR OF TEXAS Department of Research and Analysis
 STATE BAR OF TEXAS Department of Research and Analysis 2010 Paralegal Division Compensation Survey This is the salary survey results report on paralegals in Texas in 2010: their work, compensation, and
Texas Mid-Year Economic Outlook: Strong Growth Continues
 Texas Mid-Year Economic Outlook: Strong Growth Continues Keith Phillips Assistant Vice President and Senior Economist 9/27/18 The views expressed in this presentation are strictly those of the presenter
CDFI. Community Development Financial Institutions. By: Holly R. Logue IBAT Annual Convention September 21, 2015
 CDFI Community Development Financial Institutions By: Holly R. Logue IBAT Annual Convention September 21, 2015 Introduction Holly R. Logue Financial Institution Strategies Group, LLC CDFI Banks in Mississippi,
Texas CorCare Employee Notice of Network Requirements
 Texas CorCare Employee Notice of Network Requirements English Version Texas CorCare Employee Notice of Network Requirements English Version TEXAS CORCARE LETTER TO EMPLOYEES Dear Employee: Your employer
Plunging Oil Prices: Impact on the U.S. and State Economies
 Plunging Oil Prices: Impact on the U.S. and State Economies Mine Yücel Senior Vice President and Director of Research November 17, 216 Nominal price, weekly 16 14 Oil and gas prices volatile 12 1 Oil price
2015 INCOME FACT SHEET. Published August 2016 Analysis by Invariance Dynamics Consulting Nils Greger Olsson, PhD
 STATE BAR OF TEXAS DEPARTMENT OF RESEARCH & ANALYSIS 2015 INCOME FACT SHEET Published August 2016 Analysis by Invariance Dynamics Consulting Nils Greger Olsson, PhD P.O. Box 12487, Austin, TX 78711 (800)
STATE BAR OF TEXAS DEPARTMENT OF RESEARCH & ANALYSIS
 STATE BAR OF TEXAS DEPARTMENT OF RESEARCH & ANALYSIS CORPORATE/IN-HOUSE COUNSEL 2005 INCOME REPORT PUBLISHED SEPTEMBER 21, 2006 P.O. Box 12487, Austin, TX 78711 (800) 204-2222, ext. 1724 or (512) 427-1724
Texas Nonagricultural Wage and Salary Employment (Seasonally Adjusted)
") IN THIS ISSUE A Mo n t h l y Ne w s l e t t e r of th e Te x a s Workforce Co m m i s s i o n TEXAS L A B O R M A R K E T R E V I E W J u n e Texas Nonagricultural Wage & Salary Employment (Seasonally
IN THIS ISSUE A Mo n t h l y Ne w s l e t t e r of th e Te x a s Workforce Co m m i s s i o n TEXAS L A B O R M A R K E T R E V I E W J u n e Texas Nonagricultural Wage & Salary Employment (Seasonally
A A MONTHLY NEWSLETTER OF OF THE THE TEXAS WORKFORCE COMMISSION TEXAS
 IN THIS ISSUE Texas Nonagricultural Wage & Salary Employment (Seasonally Adjusted).......... 1 Texas & U.S. Unemployment Rates.......... 2 Texas Nonagricultural Wage & Salary Employment (Not Seasonally
Texas Nonagricultural Wage and Salary Employment (Seasonally Adjusted) Growth in Total Nonagricultural Employment in Texas topped
 Growth in Total Nonagricultural Employment in Texas topped") IN THIS ISSUE Texas Nonagricultural Wage & Salary Employment (Seasonally Adjusted).......... 1 Texas & U.S. Unemployment Rates.......... 2 Texas Nonagricultural Wage & Salary Employment (Not Seasonally
IN THIS ISSUE Texas Nonagricultural Wage & Salary Employment (Seasonally Adjusted).......... 1 Texas & U.S. Unemployment Rates.......... 2 Texas Nonagricultural Wage & Salary Employment (Not Seasonally
Texas Nonagricultural Wage and Salary Employment (Seasonally Adjusted) Total Nonagricultural Employment in Texas slid by 1,300 jobs in
 Total Nonagricultural Employment in Texas slid by 1,300 jobs in") IN THIS ISSUE Texas Nonagricultural Wage & Salary Employment (Seasonally Adjusted).......... 1 Texas & U.S. Unemployment Rates.......... 2 Texas Nonagricultural Wage & Salary Employment (Not Seasonally
IN THIS ISSUE Texas Nonagricultural Wage & Salary Employment (Seasonally Adjusted).......... 1 Texas & U.S. Unemployment Rates.......... 2 Texas Nonagricultural Wage & Salary Employment (Not Seasonally
TEXAS TRANSPORTATION COMM ISSION
 TEXAS TRANSPORTATION COMM ISSION ALL Counties MINUTE ORDER Page 1 of I ALL Districts Section 222.053(a), Transportation Code, defines an economically disadvantaged county as a county that has, in comparison
Individual and Family
 2018 Enrollment Guide Individual and Family HM O_EP O20 2018 1 Inside this Guide Introduction/Enrollment Guide HMO Enrollment Application EPO Enrollment Application Contact Information at a Glance Sales/To
IN THIS ISSUE A MONTHLY NEWSLETTER OF THE TEXAS WORKFORCE COMMISSION. Texas Nonagricultural Wage and Salary Employment (Seasonally Adjusted) 4.
 4.") IN THIS ISSUE A MONTHLY NEWSLETTER OF THE TEXAS L A B O R M A R K E T R E V I E W O CTOBER Texas Nonagricultural Wage & Salary Employment (Seasonally Adjusted).......... 1 Texas & U.S. Unemployment Rates.........
IN THIS ISSUE A MONTHLY NEWSLETTER OF THE TEXAS L A B O R M A R K E T R E V I E W O CTOBER Texas Nonagricultural Wage & Salary Employment (Seasonally Adjusted).......... 1 Texas & U.S. Unemployment Rates.........
Plunging Crude Prices: Impact on U.S. and State Economies
 Plunging Crude Prices: Impact on U.S. and State Economies Mine Yücel Senior Vice President and Director of Research August 7, 215 Oil and gas prices plunge Nominal price, $, weekly 16 14 12 Oil Price 1
A Perspective from the Federal Reserve Institute of Internal Auditors San Antonio Chapter August 19, 2015 Blake Hastings Senior Vice President
 A Perspective from the Federal Reserve Institute of Internal Auditors San Antonio Chapter August 19, 215 Blake Hastings Senior Vice President The views expressed in this presentation are strictly those
IN THIS ISSUE A MONTHLY NEWSLETTER OF THE TEXAS WORKFORCE COMMISSION. Texas Nonagricultural Wage and Salary Employment (Seasonally Adjusted) 6.
 6.") IN THIS ISSUE A MONTHLY NEWSLETTER OF THE TEXAS L A B O R M A R K E T R E V I E W S EPTEMBER Texas Nonagricultural Wage & Salary Employment (Seasonally Adjusted).......... 1 Texas & U.S. Unemployment Rates.........
IN THIS ISSUE A MONTHLY NEWSLETTER OF THE TEXAS L A B O R M A R K E T R E V I E W S EPTEMBER Texas Nonagricultural Wage & Salary Employment (Seasonally Adjusted).......... 1 Texas & U.S. Unemployment Rates.........
SPECIAL PROVISION Legal Relations and Responsibilities to the Public
 1995 Metric San Antonio District SPECIAL PROVISION 007---382 Legal Relations and Responsibilities to the Public For this project, Item 007, Legal Relations and Responsibilities to the Public, of the Standard
Individual and Family
 2018 Enrollment Guide Individual and Family HMO_EPO 2018 1 Inside this Guide Introduction/Enrollment Guide HMO Enrollment Application EPO Enrollment Application Contact Information at a Glance Sales/To
Texas County & District Retirement System Pension Trust Fund Schedule of Changes in Financial Net Position by Employer. Year ended Dec.
 Texas County & District Retirement System Pension Trust Fund Schedule of Changes in Financial Net Position by Employer Year ended Dec., 06 Supplement to the 06 Comprehensive Annual Financial Report Supplement
Texas Star Network Employee Notice of Network Requirements
 Texas Star Network Employee Notice of Network Requirements Important Contact Information: To locate a provider, call (800) 381-8067 To contact Texas Mutual Insurance Company, visit www.texasmutual.com
The Oil Market: From Boom to Gloom
 The Oil Market: From Boom to Gloom Mine Yücel Senior Vice President and Director of Research February 12, 216 The views expressed are those of the speaker and should not be attributed to the or the Federal
SPECIAL PROVISION Legal Relations and Responsibilities to the Public
 1993 Specifications CSJ 0914-00-196 SPECIAL PROVISION 007--1157 Legal Relations and Responsibilities to the Public For this project, Item 007, Legal Relations and Responsibilities to the Public, of the
Selected Economic Data for Texas Cooperative Extension, Central Texas District (8)
") Panhandle (1) Selected Economic Data for Texas Cooperative Extension, Central Texas District (8) Dennis U. Fisher February 14, 2002 South Plains (2) Rolling Plains (3) North Texas (4) West Central (7)
Panhandle (1) Selected Economic Data for Texas Cooperative Extension, Central Texas District (8) Dennis U. Fisher February 14, 2002 South Plains (2) Rolling Plains (3) North Texas (4) West Central (7)
Ryan D. Holzaepfel. Chris Lopez. Laurie L. Christensen. Fire Marshal. Fire Marshal. Fire Marshal
 Laurie L. Christensen Fire Marshal Ryan D. Holzaepfel Fire Marshal Chris Lopez Fire Marshal INTRODUCTION A County Fire Marshal LGC 352.011 Shall Investigate the cause of fires and record; May Inspect for
CHARITABLE BINGO OPERATIONS DIVISION
 sidebar text or pull-out quote. sidebar text or pull-out quote. sidebar text or pull-out quote. sidebar text or pull-out quote. Data in the 2008 Annual Report Data included in the 2008 Annual Report is
CLICK HERE FOR LINK TO TABLE OF CONTENTS
 DISCLAIMER This site contains the content of the Company's tariffs. The official tariffs are on file with the relevant state regulatory commissions. While every effort has been made to ensure that the
Construction Spending, Labor & Materials Outlook
 Construction Spending, Labor & Materials Outlook San Antonio Chapter-AGC June 17, 2016 Ken Simonson Chief Economist, AGC of America simonsonk@agc.org Construction spending & employment, 2006-16 $1,250
Health Care and Medical Malpractice Reform: The Necessity of Reform in the Current Debate
 No. 1142 Delivered November 17, 2009 January 28, 2010 Health Care and Medical Malpractice Reform: The Necessity of Reform in the Current Debate The Honorable John Cornyn and Edwin Meese III Abstract: All
U.S. Small Business Administration Lower Rio Grande valley District SBA Disaster loan programs Incident: Hurricane Harvey
 U.S. Small Business Administration Lower Rio Grande valley District SBA Disaster loan programs Incident: Hurricane Harvey David L. Elizondo Branch Manager 2 Founded by an Act of Congress In 1953 the United
The widening gap between home price and household
 Still Affordable James P. Gaines and Clare Losey August 17, 2017 Publication 2176 The widening gap between home price and household income has recently sparked concerns over housing affordability. The
Uinta Basin Energy Summit Economic Overview September 10, 2015
 Uinta Basin Energy Summit Economic Overview September 10, 2015 Overview National Economic Conditions Utah Economic Conditions Utah is One of the Fastest Growing CA States in the Country Percent Change
Zions Bank Economic Overview
 Zions Bank Economic Overview Jackson Hole Mountain Resort March 20, 2018 National Economic Conditions When Good News is Bad News Is Good News?? Dow Tops 26,000 Up 44% Since 2016 Election Source: Wall Street
TEXAS DEPARTMENT OF HOUSING AND COMMUNITY AFFAIRS Tax-Exempt Mortgage / Taxable Mortgage
 TEXAS DEPARTMENT OF HOUSING AND COMMUNITY AFFAIRS Tax-Exempt Mortgage / Taxable Mortgage My First Texas Home / My Choice Texas Home / Texas Mortgage Credit Certificate (MCC) REVISED: 12/19/2018 NOTICE
Memorandum CITY OF DALLAS
 Memorandum CITY OF DALLAS DATE: December 2, 216 TO: SUBJECT: Honorable Members of the Budget, Finance, & Audit Committee: Jennifer S. Gates (Chair), Philip T. Kingston (Vice Chair), Erik Wilson, Rickey
Paying Out-of-Pocket
 September 2017 Paying Out-of-Pocket The Healthcare Spending of 2 Million US Families Healthcare costs are rising for families. In 2015 the US spent 18 percent of Gross Domestic Product (GDP) on healthcare,
50-State Property Tax Comparison Study: For Taxes Paid in Executive Summary
 50-State Property Tax Comparison Study: For Taxes Paid in 2017 Executive Summary By Lincoln Institute of Land Policy and Minnesota Center for Fiscal Excellence April 2018 As the largest source of revenue
Texas Star Network Texas Health Care Provider Network. Employee Information Materials
 Texas Star Network Texas Health Care Provider Network Employee Information Materials To All Employees: Your employer is committed to your health and safety at the workplace. Our first concern is to keep
HCN Complete Enrollment Kit
 HCN Complete Enrollment Kit January 2013 Dear Valued Customer, RE: Zurich s Texas Workers Compensation Health Care Network Zurich is pleased to offer the certified Zurich Services Corporation Texas Health
Zions Bank Economic Overview
 Zions Bank Economic Overview Utah League of Cities and Towns June 18, 2018 Utah Economic Conditions CA 0.6% OR 1.4% WA 1.7% NV 2.0% Utah Population 3 rd Fastest Growing in U.S. ID 2.2% UT 1.9% AZ 1.6%
CHARITABLE BINGO OPERATIONS DIVISION ANNUAL REPORT TEXAS LOTTERY COMMISSION
 CHARITABLE BINGO ANNUAL REPORT OPERATIONS DIVISION TEXAS LOTTERY COMMISSION A MESSAGE FROM THE CHAIRMAN OF THE TEXAS LOTTERY COMMISSION AND THE DIRECTOR OF THE CHARITABLE BINGO OPERATIONS DIVISION On
Transmission of material in this release is embargoed until 8:30 a.m. (EDT) Wednesday, October 31, 2012
 Wednesday, October 31, 2012") Transmission of material in this release is embargoed until 8:30 a.m. (EDT) Wednesday, October 31, USDL-12-2162 Technical information: Media contact: (202) 691-6199 NCSinfo@bls.gov www.bls.gov/ect (202)
Transmission of material in this release is embargoed until 8:30 a.m. (EDT) Wednesday, October 31, USDL-12-2162 Technical information: Media contact: (202) 691-6199 NCSinfo@bls.gov www.bls.gov/ect (202)
Black Knight Mortgage Monitor
 Black Knight Mortgage Monitor Mortgage Market Performance Observations Data as of April, 2014 Month-end Black Knight First Look April 2014 2 Focus Points Prepayment activity and originations ARM loans
IMO MED-SELECT NETWORK
 IMO MED-SELECT NETWORK A Certified Texas Workers Compensation Health Care Network Notice of Network Requirements for The University of Texas System 1 Revised 9.28.16 IMO Med-Select Network Notice of Network
Regional Economic Update
 Regional Economic Update Roberto Coronado Assistant Vice President in Charge and Sr. Economist July 23, 2015 The views expressed in this presentation are strictly those of the authors and do not necessarily
Black Knight Mortgage Monitor
 Black Knight Mortgage Monitor Mortgage Market Performance Observations Data as of May, 2014 Month-end Black Knight First Look May 2014 Total U.S. loan delinquency rate (loans 30 or more days past due,
Comparative Revenues and Revenue Forecasts Prepared By: Bureau of Legislative Research Fiscal Services Division State of Arkansas
 Comparative Revenues and Revenue Forecasts 2010-2014 Prepared By: Bureau of Legislative Research Fiscal Services Division State of Arkansas Comparative Revenues and Revenue Forecasts This data shows tax
NAHEFFA March 26, The views expressed are my own and do not necessarily reflect official positions of the Federal Reserve System.
 NAHEFFA March 26, 219 The views expressed are my own and do not necessarily reflect official positions of the Federal Reserve System. National Economy Growing Strongly Jobs grew 1.8% in 218 the fastest
The Economic Briefing
 The Economic Briefing February 24, 2016 Mississippi University Research Center Mississippi Institutions of Higher Learning Darrin Webb, State Economist dwebb@mississippi.edu (601)432 6556 To subscribe
2018 National Electric Rate Study
 2018 National Electric Rate Study Ranking of Typical Residential, Commercial and Industrial Electric Bills LES Administrative Board June 15, 2018 Emily N. Koenig Director of Finance & Rates 1 Why is the
Salvador Contreras University of Texas Rio Grande Valley January 27, Research Assistants: Jacob Almaguer Ruth Cano Ivan Vazquez
 Salvador Contreras University of Texas Rio Grande Valley January 27, 2017 Research Assistants: Jacob Almaguer Ruth Cano Ivan Vazquez Outline of presentation Rio Grande Valley The big numbers Where we are
Hurricane Harvey Potential Exposure SB-deal Programs. September 6, 2017
 Hurricane Harvey Potential Exposure SB-deal Programs September 6, 2017 Introduction The information in this presentation is presented as of September 6, 2017, and could become out of date and/or inaccurate.
2019 State of the U.S. Economy and Outlook
 2019 State of the U.S. Economy and Outlook Dr. Robert Dye VP and Chief Economist, Comerica Bank Dr. Pia Orrenius VP and Senior Economist, Federal Reserve Bank of Dallas The Comerica Economic Outlook Two
Texas ttl calculator Vehicles purchased from licensed dealers (dealers use purchase price only). Please keep your comments by following the community
. Please keep your comments by following the community") Texas ttl calculator Vehicles purchased from licensed dealers (dealers use purchase price only). Please keep your comments by following the community etiquette film bokon bokon irani. can expect to pay
Texas ttl calculator Vehicles purchased from licensed dealers (dealers use purchase price only). Please keep your comments by following the community etiquette film bokon bokon irani. can expect to pay
Utah Land Title Association Economic Overview February 1, 2016
 Utah Land Title Association Economic Overview February 1, 2016 Utah is One of the Fastest Growing CA 0.9% States in the Country Percent Change in Population for States: 2012 to 2013 WA 1.1% OR 0.8% NV
Zions Bank Economic Overview
 Zions Bank Economic Overview Utah Institute of Real Estate Management Economic Summit September 12, 2017 National Economic Conditions August Job Indicators Indicator Expectation Actual Total Nonfarm Payrolls
Who s Above the Social Security Payroll Tax Cap? BY NICOLE WOO, JANELLE JONES, AND JOHN SCHMITT*
 Issue Brief September 2011 Center for Economic and Policy Research 1611 Connecticut Ave, NW Suite 400 Washington, DC 20009 tel: 202-293-5380 fax: 202-588-1356 www.cepr.net Who s Above the Social Security
Older consumers and student loan debt by state
 August 2017 Older consumers and student loan debt by state New data on the burden of student loan debt on older consumers In January, the Bureau published a snapshot of older consumers and student loan
PRODUCER ANNUITY SUITABILITY TRAINING REQUIREMENTS BY STATE As of September 11, 2017
 PRODUCER ANNUITY SUITABILITY TRAINING REQUIREMENTS BY STATE As of September 11, 2017 This document provides a summary of the annuity training requirements that agents are required to complete for each
Recap of 2017: The Best Year in a Decade
 NOVEMBER 217 Recap of 217: The Best Year in a Decade Macroeconomic conditions remained favorable for housing and mortgage markets in 217. Despite challenges, the housing markets remain on track for their
HIGH AND WIDE: INCOME INEQUALITY GAP IN THE DISTRICT ONE OF BIGGEST IN THE U.S. By Wes Rivers
 An Affiliate of the Center on Budget and Policy Priorities 820 First Street NE, Suite 510 Washington, DC 20002 (202) 408-1080 Fax (202) 325-8839 www.dcfpi.org March 13, 2014 HIGH AND WIDE: INCOME INEQUALITY
DFW Real Estate FAIRcast. Britt Fair April 1, Fair Texas Title 8201 Preston Road Suite 160 Dallas, TX 75225
 DFW Real Estate FAIRcast Britt Fair April 1, 2019 Fair Texas Title 8201 Preston Road Suite 160 Dallas, TX 75225 Interest Rate Improvement Rates hit all-time lows in July 2016 but rose through Nov 2018
Eye on the South Carolina Housing Market presented at 2008 HBA of South Carolina State Convention August 1, 2008
 Eye on the South Carolina Housing Market presented at 28 HBA of South Carolina State Convention August 1, 28 Robert Denk Assistant Staff Vice President, Forecasting & Analysis 2, US Single Family Housing
2016 Workers compensation premium index rates
 2016 Workers compensation premium index rates NH WA OR NV CA AK ID AZ UT MT WY CO NM MI VT ND MN SD WI NY NE IA PA IL IN OH WV VA KS MO KY NC TN OK AR SC MS AL GA TX LA FL ME MA RI CT NJ DE MD DC = Under
County Information Program County. Expenditures. Survey. (800)
") County Information Program 214 County TEXAS ASSOCIATION OF COUNTIES COUNTY INFORMATION PROGRAM CONTRIBUTORS Authors Tim Brown Laura V. Garcia Laura Nicholes Map Designer Bruce Barr Project Manager Paul
County Information Program 214 County TEXAS ASSOCIATION OF COUNTIES COUNTY INFORMATION PROGRAM CONTRIBUTORS Authors Tim Brown Laura V. Garcia Laura Nicholes Map Designer Bruce Barr Project Manager Paul
Zions Bank Economic Overview Alta High School. March 24, 2017
 Zions Bank Economic Overview Alta High School March 24, 2017 Economic Fundamentals Scarcity Based on limited resources Scarce resources must be allocated using a method of distribution Example: Food Clean
Texas Economic Growth and Volatility
 Texas Economic Growth and Volatility Ali Anari Research Economist AT TEXAS A&M UNIVERSITY TECHNICAL REPORT 1 8 5 0 JANUARY 2008 TR Texas Economic Growth and Volatility M. Ali Anari Research Economist Texas
PORTFOLIO REVENUE EXPENSES PERFORMANCE WATCHLIST
 July 2018 ASSET MANAGEMENT Low-Income Housing Tax Credit Portfolio Trends Analysis Enterprise s Low-Income Housing Tax Credit (LIHTC) Portfolio Trends Analysis provides important information to our management
FOR IMMEDIATE RELEASE February 8, 2012
 Contact Information Below CoreLogic Reports 830,000 Completed s Nationally in 2011, a Decrease of 24 Percent from One Year Ago 1.4 Million Homes in the Inventory at the End of 2011 SANTA ANA, Calif., CoreLogic
Tax Freedom Day 2019 is April 16th
 Apr. 2019 Tax Freedom Day 2019 is April 16th Erica York Economist Madison Mauro Research Assistant Emma Wei Research Assistant Key Findings This year, Tax Freedom Day falls on April 16, or 105 days into
If applicable: Servicer Loan Number MCC Number
 If applicable: Servicer Loan Number MCC Number TEXAS DEPARTMENT OF HOUSING AND COMMUNITY AFFAIRS Taxable Mortgage Program (TMP) / Texas Mortgage Credit Certificate (MCC) NOTICE TO BUYERS Texas Department
Insufficient and Negative Equity
 Insufficient and Negative Equity Lack Of Equity Impedes The Real Estate Market Mark Fleming Chief Economist December, 2011 70% 60% 50% 40% 30% Negative Equity Highly Concentrated Negative Equity Share,
Utah Association of Special Districts Economic Overview November 5, 2015
 Utah Association of Special Districts Economic Overview November 5, 2015 Utah is One of the Fastest Growing CA 0.9% States in the Country Percent Change in Population for States: 2012 to 2013 WA 1.1% OR
Understanding the New Trump Economy Economic Overview. November 15, 2016
 Understanding the New Trump Economy Economic Overview November 15, 2016 Uncertainty at the Na@onal and Interna@onal Level Source: Bureau of Labor Statistics The Trump Bump Why? National Job Growth 500
Richard W. Fisher. President and CEO Federal Reserve Bank of Dallas. Austin, Texas April 16, 2014
 Richard W. Fisher President and CEO Federal Reserve Bank of Dallas Austin, Texas April 16, 2014 U.S. Economic Dashboard 4.5 4 5 3.5 5.5 6 6.5 7 7.5 8 3 7 3.28 Junk-bond spread (%) 7.5 8 8.5 10 8.5 9 9.5
Refinance Report August 2012
 This report contains data on refinance program activity of Fannie Mae and Freddie Mac (the Enterprises) through. Report Highlights Refinance volume continued to be strong in August as 30-year mortgage
Making Home Affordable Program Servicer Performance Report Through December 2009
 EXHIBIT 6 Overview of Administration Housing Stability Initiatives Initiatives to Support Access to Affordable Mortgage Credit and Housing Initiatives to Prevent Avoidable Foreclosures and Stabilize Neighborhoods
Tomorrow s World Conference December 2013
 www.pwc.com Tomorrow s World Asia Pacific Real Estate Conference 2013 6 December 2013 www.pwc.com Breakout Session 2: Real Estates Investments in U.S. Byron Carlock Adam Handler Miranda Tse Agenda Market
Taxing Investment Income in the States New Hampshire Fiscal Policy Institute 2 nd Annual Budget and Policy Conference Concord, NH January 23, 2015
 Taxing Investment Income in the States New Hampshire Fiscal Policy Institute 2 nd Annual Budget and Policy Conference Concord, NH January 23, 2015 Norton Francis State and Local Finance Initiative Urban-Brookings
State Treatment of Social Security Treatment of Pension Income Other Income Tax Breaks Property Tax Breaks
 State-By-State Tax Breaks for Seniors, 2016 State Treatment of Social Security Treatment of Pension Income Other Income Tax Breaks Property Tax Breaks AL Payments from defined benefit private plans are
Fourth Quarter 2014 Financial Results Supplement
 Fourth Quarter 20 Financial Results Supplement February 19, 2015 Table of contents Financial Results Segment Business Information 2 - Annual Financial Results 12 - Single-Family New Funding Volume 3 -
Unemployment Insurance Benefit Adequacy: How many? How much? How Long?
 Unemployment Insurance Benefit Adequacy: How many? How much? How Long? Joel Sacks, Deputy Commissioner Washington State Employment Security Department March 1, 2012 1 Outline How many get unemployment
The Economic and Revenue Outlook
 The Economic and Revenue Outlook Presented by Mark McMullen, Economy.com FTA Annual Outlook Conference Slide 1 The Economy is Performing Well 5 Real GDP 3 Core CPI 1 % change year ago Sources: BEA, BLS
Structured Finance. U.S. RMBS Sustainable Home Price Report. First-Quarter 2017 Update Special Report RMBS / U.S.A.
 U.S. RMBS Sustainable Home Price Report First-Quarter 2017 Update Special Report RMBS / U.S.A. U.S. Prices Grow at a Sustainable Pace: National inflation-adjusted home prices continue to grow at a rate
Western Treasure Valley Economic Breakfast Economic Overview March 17, 2016
 Western Treasure Valley Economic Breakfast Economic Overview March 17, 2016 Utah is One of the Fastest Growing CA 0.9% States in the Country Percent Change in Population for States: 2012 to 2013 WA 1.1%