Evercore ISI Restaurants
|
|
|
- Joshua Gaines
- 6 years ago
- Views:
Transcription

1 Restaurants Matt McGinley (212) Josh Schwartz (212) Please see the analyst certification and important disclosures at the end of this report. and affiliates do and seek to do business with companies covered in its research reports. Investors should be aware that the firm may have a conflict of interest that could affect the objectivity of this report. Investors should consider this report as only a single factor in making their investment decision.
2 Coverage Summary Stock Ticker Rating Base Case % Chg to Base Investment Thesis Wendy's WEN Outperform $ % YUM! Brands YUM Outperform $ % Starbucks SBUX Outperform $ % YUM China YUMC In-Line $ % Domino's DPZ In-Line $ % McDonald's MCD In-Line $ % Jack In The Box JACK In-Line $ % Chipotle CMG In-Line $ % WEN has made substantial progress on streamlining the company, divesting non-core assets, and improving the quality of the store base. We like the momentum in the business from both a menu and store 'image activation' (remodel) standpoint. With increasing AUVs, LSD unit growth, high incremental margins and G&A reductions combined with leverage and buybacks, we expect a mid 20s EPS CAGR from '17-'20 and a 7%+ FCF yield in 2018 based on the current share price. Now with the spin being complete, YUM has a cleaner asset-light business model. YUM is now targeting a 98% franchised system by 2018 and to offset the resulting lower operating profits with signficiant G&A and CapEx reduction. The net result including buybacks is to grow EPS at 15% annually through Additionally, the hope is that the higher franchised target will allow YUM to increase focus on marketing and helping franchisees grow the business allowing YUM to reach 7% system sales growth target. Core holding in the large cap restaurant space. In the U.S., its technology innovation, rewards program, and improvement in food quality will likely result in mid single digit comp growth in its most established market. In Asia, we expect unit growth in China and changes in the ownership structure in Japan to enable operating profit to nearly triple in this segment by Even without increasing leverage, we expect operating profit to CAGR at double digits, and EPS to CAGR at mid-teens through YUM China is a unique asset which gives investors access to a pure-play owned China story. The growth opportunity in China is compelling given continued urbanization and a shift towards the consumer. KFC is the largest food concept while PHCD is the largest full-service concept. However, performance has been extremely volatile due to company-specific and macro issues. We believe that the trajectory is up and to the right but emerging competition and cost inflation pose significant risks. Domino's is the premier player in a mature, but fragmented U.S. pizza category. It is a technology company as much as it is a pizza company, which has resulted in impressive organic growth and share gains. The int'l growth opportunity is large, requires no capital and is very high margin. While we like the company, the valuation gives us pause as it is the most expensive name in the group. The global leader in the QSR space - driven by marketing and quality store locations accumulated over decades, MCD has the highest AUVs and the highest profit per store. After several years of challenging operating results, McDonald's streamlined its operating stucture, optimized the capital structure and improved execution. With this structure in place, MCD is now modernizing its U.S. store base to reaccelerate traffic growth which is necessary to achieve double digit EPS growth has gotten off to an uneven year for JIB brand competitively, but believe this is a stable regional QSR burger concept. Qdoba's comp has turned negative and margins have delevered putting in question the growth story. JACK is pulling all of its financial levers by increasing JIB franchising % to 90% (with a long-term goal of 95%), increasing leverage to 4.0x and increasing shareholder returns which should lead to high teens EPS growth. However, Qdoba weakness could pressure the stock price. Single greatest restaurant success story over the last 20 years until its foodborne illness incidents in 4Q15. More than a year removed, CMG's recovery flatlined at 20% below peak levels. While sales appear to have gained momentum recently, CMG will need to prove it can continue to regain sales while also offsetting wage inflation and expanding margins in order to justify its premium multiple. CMG still has the opportunity to double its store base albeit at much lower returns vs. pre-crisis levels. Panera Bread Co. PNRA In-Line $ % PNRA has invested heavily over the last few years to improve the customer experience by adding store labor and technology, and making continued progress on menu innovation. The continued rollout of delivery shows great promise, but with operated margins expected to be flat due to necessary topline investments and a difficult macro-environment, we think that there are profit growth headwinds preventing mid-to-high-teens growth in Dunkin' Brands DNKN Underperform $ % Solid regional franchise, but competition in morning daypart will likely challenge comps in '17. DNKN is lagging behind competition in execution and adaptation of technology. Its core market in the Northeast only has a few years left of growth, and while Dunkin' has good visibility over the next several years, there is a risk the store growth plan slows as the unit economics are not as compelling outside of its established markets. 2
3 Q1-05 Q3-05 Q1-06 Q3-06 Q1-07 Q3-07 Q1-08 Q3-08 Q1-09 Q3-09 Q1-10 Q3-10 Q1-11 Q3-11 Q1-12 Q3-12 Q1-13 Q3-13 Q1-14 Q3-14 Q1-15 Q3-15 Q1-16 Q3-16 Share of Wallet 1Q14 2Q14 3Q14 4Q14 1Q15 2Q15 3Q15 4Q15 1Q16 2Q16 3Q16 4Q16 1Q17e 2Q17e 3Q17e 4Q17e e 2018e Feb-02 Jul-02 Dec-02 May-03 Oct-03 Mar-04 Aug-04 Jan-05 Jun-05 Nov-05 Apr-06 Sep-06 Feb-07 Jul-07 Dec-07 May-08 Oct-08 Mar-09 Aug-09 Jan-10 Jun-10 Nov-10 Apr-11 Sep-11 Feb-12 Jul-12 Dec-12 May-13 Oct-13 Mar-14 Aug-14 Jan-15 Jun-15 Nov-15 Apr-16 Sep-16 Feb-17 April 4, 2017 Portfolio Manager Summary 6 Charts That Summarize Restaurants SSS Trends Sales expected to continue to be weak going into % 6% 5% 4.0% 4% 3.2% 3% 2.5% 2% 1% 0% -1% 5.4% 5.9% 4.8% 4.1% 2.3% 1.5% 0.3% 0.0%-0.1% 0.1% 1.8% 2.1% 1.3% 3.5% 1.1%1.1% 2.0% Grocery Deflation Grocery deflation could make it difficult for restaurants to take pricing. Value menus have returned with much vigor. 8% 6% 4% 2% 0% -2% -4% Basis Point Change In Margin In CDR and QSR labor inflation will be fully offset by food deflation. That is not the case among the average fast casual operator. 41 (80) (32) (30) 15x 12x Valuation EV/EBITDA - NTM QSR valuation at peak, and above relative averages vs. the S&P. CDR valuations have dipped after a post election bounce. 9x 6x 3x Comp 2-Yr Stacked Avg. Limited Service Casual Dining S&P x 10.8x 9.4x Restaurant Capacity / Demand Restaurant sales CAGR at 5%. This is mostly driven by inflation and unit growth. There is no indication that the industry is over stored. 10.0% 8.0% 6.0% 4.0% 2.0% 0.0% -2.0% -4.0% -6.0% Series3 Food at Home CPI Restaurants Less Affordable Food Away from Home CPI QSR Median Restaurant Share of Wallet There are secular changes occurring in the way people are spending at restaurants 5.25% 5.00% 4.75% 4.50% Fast Casual Median Casual Dining Median Overall 10% 8% 6% 4% 2% 0% -2% -4% YoY Change in Restaurant Sales Unit Inflation Traffic / Mix Share of Wallet Category Growth 3 Source: BLS, BEA, FactSet, Consensus Metrix, Census Bureau,

4 3Q83 3Q85 3Q87 3Q89 3Q91 3Q93 3Q95 3Q97 3Q99 3Q01 3Q03 3Q05 3Q07 3Q09 3Q11 3Q13 3Q15 Real Consumer Spending Yoy Change Jan-04 Sep-04 May-05 Jan-06 Sep-06 May-07 Jan-08 Sep-08 May-09 Jan-10 Sep-10 May-11 Jan-12 Sep-12 May-13 Jan-14 Sep-14 May-15 Jan-16 Sep-16 Q1-80 Q3-81 Q1-83 Q3-84 Q1-86 Q3-87 Q1-89 Q3-90 Q1-92 Q3-93 Q1-95 Q3-96 Q1-98 Q3-99 Q1-01 Q3-02 Q1-04 Q3-05 Q1-07 Q3-08 Q1-10 Q3-11 Q1-13 Q3-14 Q1-16 Financial Obligations % of DPI April 4, 2017 State of the Consumer Wallet Share: Goods vs. Services Healthcare and consumer services, including restaurants, recreation & travel outpace retail growth in consumer wallet share. 19.5% 19.0% 18.5% 18.0% 17.5% 17.0% 16.5% 16.0% Retail Goods (RA) Healthcare (LA) Consumer Services, Recreation & Travel (LA) 23.5% 23.0% 22.5% 22.0% 21.5% 21.0% 20.5% 20.0% 19.5% Household Debt & Debt Service Despite a low rate environment, the consumer has delevered post-recession. 19.0% 18.5% 18.0% 17.5% 17.0% 16.5% 16.0% 15.5% 15.0% 140% 130% 120% 110% 100% 90% 80% 70% 60% Household Debt % of DPI Financial Obligation % of DPI HH Debt % of DPI Savings Rate & Real Consumer Spending 12% 10% Real Consumer Spending YoY Change vs. Personal Savings Rate 12% 10% Household Wealth Consumer wealth slumped in the recession, but reached record highs in $500,000 Average Assets Per Household Real Estate Durable Goods Bonds Stocks 8% 6% 4% 2% 0% 4Q16 5.6% 4Q16 2.8% 8% 6% 4% 2% 0% Personal Savings Rate $400,000 $300,000 $200,000-2% Real Consumer Spending (LA) -2% $100,000 Personal Savings Rate (RA) -4% -4% $ Source: Bureau of Economic Analysis, Federal Reserve Board,
5 Q Q Q Q Q Q Q Q Q Q Q Q Q Q Q Q Q Q Q Q Q Q Q Q Q Q Q Q Q Q Q Q Q Q Aug-11 Oct-11 Dec-11 Feb-12 Apr-12 Jun-12 Aug-12 Oct-12 Dec-12 Feb-13 Apr-13 Jun-13 Aug-13 Oct-13 Dec-13 Feb-14 Apr-14 Jun-14 Aug-14 Oct-14 Dec-14 Feb-15 Apr-15 Jun-15 Aug-15 Oct-15 Dec-15 Feb-16 Apr-16 Jun-16 Aug-16 Oct-16 Dec-16 <$5k $5-10k $10-15k $15-25k $25-35k $35-50k $50-75k $75-100k $ k $ k >$200k April 4, 2017 Consumer Income, Spending, and Confidence Wage growth have accelerated slightly recently to just under 3% providing capacity for higher spending Household Income Distribution 20% 18% Dollar Spend by Income Quartile $3,000 Education 16% 14% 12% 10% 8% 6% 4% 2% 0% $2,500 $2,000 $1,500 $1,000 $500 Apparel Cash & Miscell Entertainment Health & Personal Care Food & Bev & Tobacco Insurance & Pensions Transport Median Wages & Hours Worked YoY 8% Median Weekly Wage (FT Workers) Avg. Hours Worked Per Employee $0 Bottom 20% 20-40% 40-60% 60-80% Top 20% Consumer Confidence 70% Housing 6% 4% 2% 0% -2% -4% 2.8% -0.2% 60% 50% 40% 30% 20% 10% 0% -10% -6% -20% 5 Source: Census Bureau, BLS,
6 01-Jan-16W 22-Jan-16W 12-Feb-16W 04-Mar-16W 25-Mar-16W 15-Apr-16W 06-May-16W 27-May-16W 17-Jun-16W 08-Jul-16W 29-Jul-16W 19-Aug-16W 09-Sep-16W 30-Sep-16W 21-Oct-16W 11-Nov-16W 02-Dec-16W 23-Dec-16W 13-Jan-17W 03-Feb-17W 24-Feb-17W 17-Mar-17W Mar-11 Jun-11 Sep-11 Dec-11 Mar-12 Jun-12 Sep-12 Dec-12 Mar-13 Jun-13 Sep-13 Dec-13 Mar-14 Jun-14 Sep-14 Dec-14 Mar-15 Jun-15 Sep-15 Dec-15 Mar-16 Jun-16 Sep-16 Dec-16 1Q10 2Q10 3Q10 4Q10 1Q11 2Q11 3Q11 4Q11 1Q12 2Q12 3Q12 4Q12 1Q13 2Q13 3Q13 4Q13 1Q14 2Q14 3Q14 4Q14 1Q15 2Q15 3Q15 4Q15 1Q16 2Q16 3Q16 4Q16 1Q17 QTD April 4, 2017 Restaurant Sales Indicators After signs of stabilization in January, restaurant sales weakened in February, and our survey shows continued moderation through March. Restaurant Retail Sales Growth Restaurant retail sales continued to moderate in 4Q, but have ticked up so far in 1Q17 through February. 6.8% 5.8% 5.0%5.1% 4.6% 2.8%2.7% 4.5% 3.2% 6.2% 7.3% 7.6% 9.0% 8.7% 8.0% 6.8% 6.6% 5.8% 5.5% 5.0% 4.4% Personal Consumption Expenditures - Restaurants Spending at limited service restaurants grew 4.8% in 4Q16 lower than the 7% in 4Q15. CDR spending increased by 3.3% in 4Q % 10.0% 8.0% 6.0% 4.0% 2.0% 0.0% -2.0% Limited Service Full Service Restaurant Survey Our restaurant survey shows continued moderation throughout March reaching the lowest levels since Sales growth has been muted since August Sales Continue to Fall National Restaurants Association Performance Survey The National Restaurants Association survey also show a slowdown in sales throughout the quarter Source: Census Bureau, Bureau of Economic Analysis, National Restaurants Association,
7 Nov-11 Feb-12 May-12 Aug-12 Nov-12 Feb-13 May-13 Aug-13 Nov-13 Feb-14 May-14 Aug-14 Nov-14 Feb-15 May-15 Aug-15 Nov-15 Feb-16 May-16 Aug-16 Nov-16 Feb-17 Dec-11 Feb-12 Apr-12 Jun-12 Aug-12 Oct-12 Dec-12 Feb-13 Apr-13 Jun-13 Aug-13 Oct-13 Dec-13 Feb-14 Apr-14 Jun-14 Aug-14 Oct-14 Dec-14 Feb-15 Apr-15 Jun-15 Aug-15 Oct-15 Dec-15 Feb-16 Apr-16 Jun-16 Aug-16 Oct-16 Dec-16 Feb-17 Non Farm Payroll Growth EvrISI Restaurant Survey Reading Average Gasoline Price per Gallon EVRISI Restaurant Survey Reading Feb-02 Jul-02 Dec-02 May-03 Oct-03 Mar-04 Aug-04 Jan-05 Jun-05 Nov-05 Apr-06 Sep-06 Feb-07 Jul-07 Dec-07 May-08 Oct-08 Mar-09 Aug-09 Jan-10 Jun-10 Nov-10 Apr-11 Sep-11 Feb-12 Jul-12 Dec-12 May-13 Oct-13 Mar-14 Aug-14 Jan-15 Jun-15 Nov-15 Apr-16 Sep-16 Feb-17 April 4, 2017 Potential Factors Impacting Restaurant Sales Contributing factors to the recent slowdown in restaurant sales include a slowdown in payroll growth, an increase in gas prices, growing gap between food at and away from home and now, the tax refund delay. Food at Home vs. Away from Home CPI Gap (bps) U.S. Cumulative Tax Refunds The gap is currently ~428bps, down slightly vs. the past three months but Tax refunds were slow to be issued resulting in a peak delay versus 10 still near multi-year highs. year average of 47mn returns 8% 6% 4% 2% 0% 300, , , , YTD Avg Employment Growth vs. EVR ISI Restaurants Survey Our restaurants survey ticked down as payroll growth has moderated. 2.5% -2% -4% Series3 Food at Home CPI Restaurants Less Affordable Food Away from Home CPI ,000 50,000 0 Jan Feb Mar Apr Gas Prices vs. EVR ISI Restaurants Survey Restaurant sales moderation intensified in 2Q16 coinciding with an increase in gas prices. However, gas prices have been relatively stable since last May. $ % 60 $ % 40 $ % 30 $ % 20 $ Non-Farm Payrolls YoY Growth EVR ISI Survey Reading Average Gasoline Prices Monthly Reading Source: Bureau of Economic Analysis,
8 Restaurant Industry - Fragmented Market Share, Consolidated Market Cap The restaurant industry is exceptionally fragmented both globally and in the U.S. We estimate that the global restaurant industry is $2.1T, and the U.S. is $815B in total foodservice sales. This means that the largest global chain, McDonald s, has just over 4% share in the U.S. and Globally. In the U.S., the top 100 chains have only ~25% market share, and going all the way down to the top 1500 restaurant concepts, only 45% of the total category is with chain concepts. There are ~350 publicly traded restaurants globally, and ~90 are in the U.S. In dollar terms, the combined market cap of all restaurant companies is $475B, but this market cap is highly consolidated in U.S. based companies. While U.S. based restaurant chains make up only 20% of global restaurant revenue, U.S. chains are two-thirds of the market capitalization of the global industry. McDonald s alone makes up 22% of publically traded global market cap. The five largest U.S. listed restaurants, McDonald s Starbucks, YUM!, Chipotle, and Restaurant Brands International, make up ~75% of U.S. restaurant market cap. U.S. Restaurant Market Cap 5 U.S. stocks comprise ~75% of the market cap of the ~90 U.S. listed restaurant chains. YUMC Chipotle RBI Next 10 Chipotle YUM! 4% 4% 8% Bottom ~75 9% $300B US Market Cap 26% Starbucks McDonald's 33% Japan UK Canada France 7% 11% 3% 4% System Sales By Concept Top 40 U.S. Chains** All Other 8% U.S. $475B Global Market Cap Total System Sales 66% U.S. System Sales Int'l System Sales All Other Restaurants 55% Top 5 9% Total System Sales $815 US Food Service Industry 4% 5% 8% U.S. System Sales # % #11-20 Int'l System Sales 1 McDonald's 82,715 35,837 46, Buffalo Wild Wings 3,643 3, Starbucks 25,560 13,936 11, Arby's 3,540 3, KFC 24,213 4,001 20, Papa John's 3,479 2, Burger King 18,554 9,000 9, IHOP 3,402 3, Subway 17,000 11,500 5, Jack in the Box 3,339 3, Pizza Hut 11,602 5,510 6, Outback Steakhouse 3,174 2, Domino's 10,193 4,709 5, Popeyes Louisiana Kitc 3,060 2, Wendy's 9,862 8,777 1, Denny's 2,736 2, Taco Bell 9,414 9, TGI Fridays 2,647 1,567 1, Dunkin' Donuts 8,303 7, Panda Express 2,569 2, Tim Hortons 6, , Red Lobster 2,536 2, Chick-fil-A 6,294 6, Hardee's 2,514 2, Applebee's 5,129 4, Cracker Barrel Old Cou 2,289 2, Panera Bread/Saint 4,837 4, Texas Roadhouse 2,191 2, Chipotle Mexican Gr 4,475 4, Cheesecake Factory, T 2,014 1, SONIC Drive-In 4,414 4, Jimmy John's Gourmet 2,005 2, Dairy Queen/Orange 4,337 3, Whataburger 2,001 2, Chili's Grill & Bar 4,124 3, Baskin-Robbins 1, , Little Caesars 3,850 3, Carl's Jr. 1,842 1, Olive Garden 3,805 3, Golden Corral 1,740 1,740 - Global Restaurant Market Cap U.S. listed restaurants make up 2/3 of global restaurant market cap. U.S. Restaurant Sales Consolidation The restaurant market is highly fragmented, with the largest chain with only 4% market share. # # Source: Technomic, Bloomberg, FactSet, ** 2015 data
9 Restaurants In Perspective: 12% of Retail, 3.7% of GDP U.S. Gross Domestic Product $17.9 Trillion Consumption $12.2 Trillion Government $3.2 Trillion Retail Sales $5.5 Trillion Retail Sales ex. Autos & Gas $3.3 Trillion Investment $3.0 Trillion Net Exports ($.5) Trillion Discretionary Mixed Staples Food 32% Consumer Electronics, Furniture, Home Improvement, Motor Vehicles 25% 18% ecomm, General Merch, Miscellaneous Retailers Clothing, Health & Personal Care, Gasoline 13% 12% Grocery Restaurants $1,780B $1,350B $995B $705B $656B 9 Source: Bureau of Economic Analysis,
10 April 4, 2017 U.S. Share of Stomach and Restaurants Per Capita Dollar Share of Stomach 55% of food today is consumed or prepared at home. Food-at-home has been losing share for decades mostly to food eaten at a quick service restaurant. $1.4T was spent on food at both grocery and in restaurants in the U.S. in % 90% 80% 70% 60% 14% 15% 16% 17% 18% 18% 4% 8% 12% 18% 19% 20% 20% 22% Gov't Full Service Limited Service AUV and Restaurants Per Capita There is one restaurant for every 458 people in the U.S. College Cafeteria Transportation Hospital Cafeteria Average Unit Volume $3,682 $2,188 $2,186 Restaurants Per Capita 71.3k 6k 56k 50% 40% 30% 20% 79% 74% 68% 62% 60% 59% 55% Schools Food - At Home Spend Per Capita Inflation Adjusted The average American spends 32% more than they did on food than they did 60 years ago ($4,600). Spending at home has remained flat, while restaurant spending has nearly doubled. $2,800 $2,600 $2,400 0% CAGR Business Café Fine Dining Fast Casual Casual Dining Lodging Recreation Fast Food $1,508 $1,087 $1,038 $1,025 $834 $706 $ k 17k 7.5k 1.8k 6k 9.83k 1k $2,200 Bars and Taverns $691 17k $2,000 $1,800 Supermarket $ k $1,600 Midscale $ k $1,400 $1,200 $1,000 Caterers Convenience Stores $179 $ k 7.3k 10 At Home Restaurants Source: Technomic, BEA,
11 Q1-94 Q4-94 Q3-95 Q2-96 Q1-97 Q4-97 Q3-98 Q2-99 Q1-00 Q4-00 Q3-01 Q2-02 Q1-03 Q4-03 Q3-04 Q2-05 Q1-06 Q4-06 Q3-07 Q2-08 Q1-09 Q4-09 Q3-10 Q2-11 Q1-12 Q4-12 Q3-13 Q2-14 Q1-15 Q4-15 Q3-16 Fast Casual Fast Food Midscale Casual Dining Fine Dining Bars and Taverns Retail Travel & Leisure YoY Unit Growth Business Schools Healthcare Vending Catering Gov't Other U.S. Restaurants (thousands) April 4, 2017 Restaurant Spend By Format and Growth Away From Home Food Consumption in the U.S. If we broaden the definition of the restaurant category to include everything in the Foodservice category, we believe more dollars are actually spent outside of the home than at grocery. For example, food items purchased at hotels (falls into leisure services), company and school cafeterias (falls into services), a sandwich bought at the deli counter of a grocery store would count as being consumed at home. We believe total foodservice spend is ~$815B, which would be about 60% of the dollars spent on food in the U.S. U.S. Restaurants By Format There are 695k restaurants and bars in the U.S. 45% of those restaurants are fast food concepts k $200 $150 $100 $50 $0 Limited Service $256B 32% Share 26.2% 5.4% 5.4% Full Service $290B 35% Share 22.2% 2.5% 5.5% 7.4% 9.7% All Other Away From Home $268B 33% Share 1.9% 4.6% 3.2% 3.0% 1.2% 1.2% 0.7% k 0 Fine Dining 42.0k Fast Casual 64.7k Bars and Taverns 87.8k Midscale 176.1k Casual Dining Fast Food YoY Growth in Unit Counts The growth in unit counts is highly cyclical. Limited service formats average 2.3% growth, while full service formats average 1.3% growth ran 30% higher than average. 5.0% 4.0% 3.0% 2.0% 1.0% Food Alcohol Series3 0.0% -1.0% Full Service Limited Service 11 Source: Technomic,
12 April 4, 2017 Restaurant Supply Restaurant Unit Counts Despite concept growth in fast casual and among some of the QSR chains, there is no indication that there is an excess supply of units. The unit growth rates seem to be pretty healthy in the U.S. restaurant industry, with the current casual dining growth rate of 1.3% being well below the historical averages of 2.2%. In QSR (including fast casual), the growth rates have accelerated out of the recession, but even these rates are comparable to the long run average of 2.2%. As an industry, the long-run nominal sales growth rate is around 5%. On average, roughly half of the growth in sales comes from inflation (pricing). The inflation driven growth has been fairly consistent over decades despite changes in the economy or food prices. The other big driver of growth in the industry is unit expansion, which accounted for more than 40% of quick service sales growth over the past 24 years, and ~36% in Casual Dining Revenue Drivers Unit growth in casual dining peaked in the 1990 s, where growth rates averaged 3.5%. In the past 5 years, unit growth has remained very subdued at 1.2%, ~100bps lower than average 10.0% 8.0% 6.0% 4.0% 2.0% 0.0% -2.0% -4.0% -6.0% 2016 Drivers of Revenue vs Long-Run Average The current rate of unit growth in CDR is lower than its historical average, and QSR current unit growth rates are equal to historical averages. 4.0% 3.5% 3.0% 2.5% 2.0% 1.5% 1.0% 0.5% 0.0% 10.0% 8.0% 6.0% 4.0% 2.0% 0.0% -2.0% -4.0% -6.0% 2.2% 1.3% Casual Dining 2.6% 2.3% 2.4% 0.5% 2.2% 2.2% 2.7% 2.7% 0.1% 1.2% Unit Inflation Traffic / Mix Unit Inflation Traffic / Mix 24 Year Avg Quick Service Quick Service Revenue Drivers Unit growth in quick service peaked in the 1990 s, where growth rates averaged 3.1%. Over the past 5 years, unit growth was at approximately the historical average industry rate of 2.1%. Unit Inflation Traffic / Mix Unit Inflation Traffic / Mix 12 Source: BLS,
13 Q1-91 Q2-92 Q3-93 Q4-94 Q1-96 Q2-97 Q3-98 Q4-99 Q1-01 Q2-02 Q3-03 Q4-04 Q1-06 Q2-07 Q3-08 Q4-09 Q1-11 Q2-12 Q3-13 Q4-14 Q1-16 Q1-05 Q3-05 Q1-06 Q3-06 Q1-07 Q3-07 Q1-08 Q3-08 Q1-09 Q3-09 Q1-10 Q3-10 Q1-11 Q3-11 Q1-12 Q3-12 Q1-13 Q3-13 Q1-14 Q3-14 Q1-15 Q3-15 Q1-16 Q3-16 Total Employed (000) Share of Wallet Basis Point Change In Wallet Share April 4, 2017 Restaurant Demand Restaurant Sales Growth The restaurant industry has had outsized growth over the last few years; we believe some of the factors related to being in the later stage of the economic cycle, and others related to a change in spending pattern. Restaurant spend is a pro-cyclical, employment driven category with total employment and disposable income the two largest factors at play. Prior to the last recession, access to revolving credit seemed to play a larger part in driving demand in the industry, but statistically, credit appears to be driving much less of the demand today. Strong employment out of the recession is clearly driving demand in the category. Fuel Savings and Spending Shift Fuel savings funded medical care, not restaurants There do appear to be factors outside of employment that are driving a change in spending habits in the category. Since the mid-2000s, restaurant sales have been materially and durably outpacing spend in retail. A part of this trend includes the overall shift in spending away from goods and into services. The restaurant category also tends to have more inflation than the rest of retail because labor makes up ~30% of sales, vs 10-15% for a typical retailer. Over the past three years, there has been a bigger shift in wallet share, where Americans are more willing to spend a greater percentage of disposable income on food away from home. The one factor that does not appear to be at play in driving demand is oil related savings oil related savings went mostly to fund higher medical care costs and into savings restaurant wallet share came at the expense of grocery. Employment & Eating Out A strong labor market results in more away from home consumption 150, , , , , , , , , ,000 Total Employed Food Away From Home $750 $700 $650 $600 $550 $500 $450 $400 $350 $300 $250 $200 Food Away From Home ($B) Restaurant Less Retail** Restaurant growth has been outpacing retail growth since % 4% 3% 2% 1% 0% -1% -2% -3% - (10) (20) (30) (40) (50) (42) (14) Fuel Related Grocery Restaurants Housing Medical Restaurant Share of Wallet Share of wallet shifted materially in 2014 and 2015 to restaurants 5.25% 5.00% 4.75% 4.50% Share of Wallet Category Growth 10% 8% 6% 4% 2% 0% -2% -4% YoY Change in Restaurant Sales 13 Source: BLS, BEA, Census Bureau, ** U.S. Census Bureau Retail Sales Ex. Autos and Gas


 Negative")


14 Framing The Industry QSR Fast Casual CDR Quick Service Restaurant (QSR) Mature segment, large national chains Low U.S. growth, more Int l growth Drive-thru dependent 50-70%* Equity Drivers / Debates Refranchising stores, capital structure Global growth opportunities Health of franchisee wage headwinds, access to capital to grow Fast Casual Newer concepts, higher growth Generally company owned / licensed Smaller stores without drive-thru Equity Drivers / Debates Pace of growth with or w/o franchise New concept crowding? The Chipotle of. Casual Dining (CDR) Negative traffic, low store growth Generally company owned Losing share to more convenient / faster options Equity Drivers / Debates Gas impacts creating near-term headwinds International growth enough to offset domestic weakness 14 Source: *NPD,
15 Industry Characteristics By Format Category Consolidation Quick Service Restaurant (QSR) Fast Casual Casual Dining (CDR) High very high in Burger and Mexican. Less so in Pizza and sandwich. The top 550 chains control 59% of the units and 82% of the revenue. Top chains average 320 units. Very High several categories like Chipotle and Panera skew the results. The top 350 chains control 64% of the units and 82% of the revenue. Top chains average 78 units. Very Low dominated by Mom & Pops. The top 580 chains control 11% of the units and 33% of the revenue. Top chains average 55 units. Unit Growth Low: growing ~1.5% Very High: growing ~9% Very Low: growing <1% Sales / Comp Growth 16 Sales Growth: ~4% Comp Growth: ~2% Sales Growth: 7%+ Comp Growth: 1-2% ex. Chipotle Very Low: growing <1% Comp Growth: ~0-1% Macro Drivers Largely employment driven. Least cyclicality in the restaurant space. Employment likely drives sales. An emerging category, but held up slightly better than QSR and CDR in last recession. Employment, credit availability, and less time to eat. Convenience Driven Category: Most sales occur at the drive thru Health Driven Category: most operators focus on quality of the ingredients / better for you perception Experience Driven Category: requires good people and frequent menu innovation Key Themes & Drivers Relevance Issue? Perception issue as being less healthy or fake is losing Millennials and Moms Value Can Move Sales: Increasingly promotional. Food deflation enabling the return of dollar price points. Very Much on Trend: riding the theme of natural and better for you. Probably not taking share from heavy QSR users Sales respond much less to promotion and innovation (new products). Traffic has been generally negative since the recession Most chains trying to highlight value: Kids eat free on Tuesday, 2 for $20, etc. Share of Stomach: Taking Share From At Home Share of Stomach: Taking Share From QSR and CDR. Share of Stomach: Chains losing share to local competition was a great year for the category, growing 8%, but public CDR chains averaged 3%. 15 Source: Technomic, Company Data,
16 Restaurant Channel Share Restaurant Revenue Share and Occasion Share Despite losing share to Fast Casual chains, QSR dominates the category in both total revenue and shopping occasions. Quick Service Restaurants Share of Occasions (Outer Ring) Fast Casual 62.2% 39.0% 3.7% 8.0% 9.6% Share of Revenue (Inner Ring) 8.1% 33.1% 7.9% 0.6% Midscale 19.6% Fine Dining Casual Dining 10-Year Market Share Change Fast casual concepts have been taking share from casual dining and QSR formats for a decade. 645 (166) (182) Fast Casual Midscale Casual Dining 19 (316) Fine Dining Quick Service Restaurants Total $ Spend Occasions Segment Level Fast Casual Average Ticket PP Share of Total $ Spend 10-YR Change in Share Share of Total Occasions 10-YR Change in Share Share of Segment $ Share of Segment Occasions Asian Noodle $ % % % 10.2% Bakery Café $ % % % 20.0% Burger $ % % % 8.6% Chicken $ % % % 10.6% Mexican $ % % % 23.8% Pizza $ % % % 2.2% Specialty $ % % % 7.0% Sandwich $ % % % 17.6% $ % % % 100.0% Midscale Asian $ % 1 0.0% 0 0.1% 0.1% Family Style $ % (157) 8.2% (139) 92.7% 93.3% Seafood $ % (0) 0.0% (0) 0.1% 0.1% Italian $ % (1) 0.1% (1) 2.0% 1.5% Mexican $ % (2) 0.0% (1) 0.4% 0.3% Specialty $ % (6) 0.4% (6) 4.7% 4.7% $ % (166) 8.8% (146) 100.0% 100.0% Casual Dining Asian $ % % 6 3.6% 3.8% Italian $ % (52) 2.6% (27) 12.7% 13.1% Mexican $ % (30) 1.0% (16) 4.5% 4.9% Seafood $ % (44) 1.2% (16) 8.4% 6.0% Specialty $ % (14) 0.7% (7) 3.5% 3.4% American $ % (34) 11.7% (27) 54.0% 58.2% Steak $ % (21) 2.1% (10) 13.3% 10.6% $ % (182) 19.7% (96) 100.0% 100.0% Fine Dining Asian $ % (0) 0.0% (0) 2.7% 1.9% Italian $ % (0) 0.0% (0) 1.3% 1.7% Seafood $ % (0) 0.1% (0) 9.3% 11.0% Steak $ % % % 85.4% $ % % % 100.0% Quick Service Restaurants Asian Noodle $ % (0) 0.2% (1) 0.4% 0.3% Bakery Café $ % (1) 0.0% (1) 0.0% 0.0% Burger $ % (252) 26.9% (389) 39.7% 41.3% Chicken $ % 1 4.5% (8) 8.7% 6.9% Coffee Café $ % % % 18.8% Family Casual $ % (126) 1.0% (115) 2.2% 1.5% Frozen Dessert $ % (1) 3.3% (8) 3.9% 5.1% Mexican $ % (2) 3.7% (10) 5.7% 5.7% Pizza $ % (48) 5.4% (49) 13.5% 8.3% Sandwich $ % (93) 5.8% (118) 9.9% 8.8% Specialty $ % (50) 2.1% (74) 3.0% 3.3% $ % (316) 61.4% (327) 100.0% 100.0% 16 Source: Technomic,
17 Contemporary CDR Upscale CDR Fine Dining Traditional CDR Fast Casual Midscale Quick Service April 4, 2017 Ownership vs Franchise Economics The ownership structure of a restaurant concept is the single most important determinant of its profitability and trading multiple for publically traded restaurants. Franchising tends to work best in QSR chains where the lack of table service means the experience is less defined by interaction with employees; QSR kitchens also tend to have fewer items and less variability, and this consistency allows for less oversight of the franchise. There are two overarching reasons why a company would or would not want to franchise. The first is that franchising enables growth at a faster rate because the franchisees fund the capex and may have local market knowledge greater than that of the national chain. As the national QSRs evolved and grew 30 to 50 years ago, most chains ran their own stores and also franchised in local markets. As the industry matured, the second reason for franchising evolved, which is the idea that it is better to de-risk the P&L and just collect a franchise fee. As the franchisee is responsible for buying food, hiring employees, and spending to maintain the restaurant (capex), moving to a franchised model is a more consistent profit steam, with limited working capital requirements, minimal capital spending, and much higher ROIC. This allows the franchisor to take on more financial risk and increase debt. Comparing Restaurant P&L s Owned vs Franchised Owned Restaurant P&L Pure Franchisor Model P&L Rate % $$$ Rate % $$$ Restaurant Sales 100% $1,000 Royalty Fees (~5%) 100% $50 Revenue vs Fee model - high operating contribution with ownership, less volatility with franchise Food & Paper 30% $300 Payroll & Employee 28% $280 Franchisor has no exposure to commodity, wage or rent Occupancy 7% $70 changes *** Other (ultil., maint., credit, etc.) 16% $160 Restaurant Operating Profit 19% $190 Restaurant Opex 0% $0 Advertising 5% $50 Advertising (administration) 5% $3 Fee model is generally limited to HQ expense and G&A 3% $30 G&A 4% $2 advertising administration D&A 1% $10 D&A 1% $1 Corporate SG&A 9% $90 Corporate SG&A 10% $5 Operating Profit 10% $100 Operating Profit 90% $45 Revenue model has much higher EBIT $$$, Franchisor model has a much higher rate Balance Sheet & Returns Balance Sheet & Returns Working Capital High Working Capital Low PP&E (or rent) High PP&E (or rent) Low Ability to Carry Debt Low(er) Ability to Carry Debt High ROIC Low ROIC Very High Trading Multiples Low Trading Multiples High Franchise % By Restaurant Sub-Industry 90% 80% 70% 60% 50% 40% 30% 20% 10% 0% 6.3% 15.6% 16.8% 35.8% 52.2% 59.0% 83.9% 17 Source: Technomic, *** Assumes the franchisor does not own the real estate, which they sometimes do.
18 QSR Franchised Restaurants -QSR* Restaurants -CDR* Specialty Stores Dollar Stores Department Stores Auto Parts Home Furnishing Branded Apparel Pharmacy Book Stores Grocers Office Products Discounters Cons. Electron. Home Improvement Clubs 2017 EV/EBITDA April 4, 2017 Ownership vs Franchise Economics The highly franchised QSR names trade at a 50% premium to the CDR names that tend to be company owned. The primary reason for the multiple differential is the highly franchised QSR names are de-risked businesses, where labor and commodity volatility are passed on to the franchisee. Other factors at play such as better margins, positive traffic, and a greater international growth opportunity also contribute to the higher multiple. The CDR names tend to do less well in a franchised model due to menu / cooking complexity, and the need for more oversight as customer experience or interaction with the employees is a larger component of success for the business. Restaurants have the highest variable margin (contribution margin) of any retail format. As most costs in a restaurant tend to be fixed, with the exception of food, the flow through to profit on an incremental sale is very high. Company owned QSR restaurants have a contribution margin close to 60%, which is 26% food, where we d estimate that 75% of the variable costs are fixed. As CDRs generally have higher food costs and more labor, as a group, it s contribution rate is closer to 55%. The Franchised QSR model is almost pure profit to the franchisor, with exceptionally higher flow through to profit with any change in sales. We estimate the contribution margin for QSR franchised names to be ~80-90%. Restaurant & Retail Variable Margin 100% 80% 60% 40% 20% 0% EV/EBITDA and % of U.S. Store Franchised The highly franchised QSR names trade at a 50% premium to the casual diners that tend to have a lower franchised store base 22.0x 20.0x 18.0x 16.0x 14.0x 12.0x 10.0x 8.0x 6.0x CMG Owned CDR CAKE TXRH CBRL DRI PLAY BLMN EAT SBUX PNRA BWLD DPZ QSR PZZA YUM DNKN MCD WEN JACK SONC DIN Highly Franchised QSR 4.0x 0% 20% 40% 60% 80% 100% % of U.S. Stores Franchised 18 Source: FactSet, Technomic,.
19 Feb-11 May-11 Aug-11 Nov-11 Feb-12 May-12 Aug-12 Nov-12 Feb-13 May-13 Aug-13 Nov-13 Feb-14 May-14 Aug-14 Nov-14 Feb-15 May-15 Aug-15 Nov-15 Feb-16 May-16 Aug-16 Nov-16 Feb-17 1Q14 2Q14 3Q14 4Q14 1Q15 2Q15 3Q15 4Q15 1Q16 2Q16 3Q16 4Q16 1Q17e 2Q17e 3Q17e 4Q17e e 2018e April 4, 2017 The Three Things That Matter Most to The Restaurant Industry Sales Labor Costs Food Costs Outlook: Easy comps, but not expected to get better until 2H were exceptional years for SSS growth, as commodity pricing in 2014 enabled some price increases in early 2015 that was additionally aided by good trends in the economy (notably employment), that helped demand. While the SSS trend decelerated over the course of 2015, the overall comp growth rate was 3.5%. In 2016, comps slowed to 1.1% largely on these compares from 14 & 15. In the context of persistent labor inflation, most of the current growth will be pricing needed to offset higher labor costs in many markets. In 2017, comps are expected to remain flat at ~1%, with performance weighted to back half with 2% comps at limited service and flat comps at CDRs. Outlook: Not Good, But Manageable Labor inflation is occurring as there is less slack in labor as employment trends have improved. While there hasn t been an increase in the federal minimum wage, 24 states mandated minimum wage increases in 2015, and 16 did so in 2016 in addition to many cities mandating even larger increases. Given most QSRs are highly franchised, this is less of an impact among that group, but will be a larger impact among highlyowned chains. Average CDR chain has labor as a % of sales at ~32%, while QSR labor margins average 27%. On a state weighted basis, wages increased 3.6% increase in 2016, and then accelerated to 3.8% in We expect this to be about a ~50bps headwind to margin in 16. And the lowering of the salary threshold for overtime (impacting managers) will further increase labor costs. Outlook: Moving to Neutral Processed food moving to neutral, but restaurants are still raising price. There is currently a large disconnect between pricing / category inflation, and what was occurring with processed food deflation. Depending on the commodity basket, most restaurants are calling for food inflation to be flat to slightly up in Restaurants are also planning on 2-3% pricing to offset higher labor costs. With food representing ~25-30% of sales, this would be roughly bps benefit in 2017 after a 200bps benefit in % Restaurant SSS Trend State Minimum Wage Increases $ % Restaurant CPI & Processed Food PPI 6% 5% 4.0% 4% 3.2% 3% 2.5% 2% 1% 0% -1% 5.4% 5.9% 4.8% 4.1% 2.3% 1.5% 0.3% 0.0%-0.1% 0.1% 1.8% 2.1% 1.3% 3.5% 1.1%1.1% 2.0% $9.00 $8.50 $8.00 $7.50 $ % 3.0% 2.5% 2.0% 1.5% 1.0% 0.5% 12% 10% 8% 6% 4% 2% 0% -2% -4% -6% Comp 2-Yr Stacked Avg. $ Population Weighted State Minimum Wage YoY Change 0.0% -8% CPI Food Away From Home PPI Processed Food 19 Source: BEA, BLS,


20 QSR Menu Strategies Limited-Time-Offers 10% of Sales Core Menu 70-80% of Sales Value 10-20% of Sales Often premium or seasonal items designed to create urgency with customers Successful limited time offers can drive both ticket and traffic Items may start as LTOs, but if successful can transition to the normal menu examples include the Dorito-locos taco (maybe the most successful recent LTO) and the Buttery Jack Burger Can be inconsistent and therefore unnecessarily add complexity and waste marketing dollars These items are the most well-known, often highest sellers i.e. Big Mac, Whopper, Egg McMuffin, single and double stacks, etc Core menu items are largely sold and consumed in bundled offers The core menu is seldom discounted as QSRs are weary to anchor customers into a lower price for these products From the core menu, breakfast is the fastest growing daypart for those offering breakfast Bundled or disruptive value seems to be the most popular, as QSRs are offering full bundled meals for less than $4 (Wendy s 4 for $4, Hardee s $4 Real Deal, BK 5 for $4) These deals drive transactions and attract different customers reducing cannibalization Some cannibalization likely exists reducing ticket and also may anchor customers into a price such as the Subway $5 Footlong As commodities have declined, QSRs are increasingly competing in value 20 Source: Company Data,

21 Mobile Commerce and Industry Adoption Technology employment is increasingly becoming a differentiator and driver of sales for restaurants. At this point, nearly all of the QSRs have an app, but the restaurants that were the earliest adopters, and those that have fully integrated technology into their business in terms of payment and ordering have benefitted the most. The original apps evolved from being purely informational (store locations, menu information), to a medium for more effective direct marketing, to becoming a payment medium and /or part of a loyalty program, to an ordering and payment platform. For the restaurant: The employment of technology can reduce labor expense or, at a minimum, enable more efficient labor by shifting labor from order taking to order processing (MCD in Europe). It can increase order accuracy in menus with order complexity (PNRA), and orders made via an app or kiosk frequently include increased attachments and higher ticket. For example, customers are more inclined to add a desert when the order is not given to a teller. When funds are pre-loaded onto an account, the pre-load saves on interchange in low-ticket purchases, and can potentially help the restaurant to achieve a negative working capital balance. For the customer: It provides a convenience factor by allowing the customer the ability to input the order at the location / time of their choosing, but it also enables the customer to save time by avoiding the line (SBUX, PNRA). When integrated with a rewards program, technology can drive loyalty and also creates a material differentiator or barrier versus local competition who are unable to employ such technology (DNKN). While it is impossible to quantitatively suggest what level of spend or what features will drive a certain level of sales, the early adopters are clearly winning. We view SBUX technology as best in class versus DNKN, who apologized for the quality of its app last year. We believe technology is a contributing factor to Starbucks HSD comps versus Dunkin s LSD comps. Domino s is also bestin-class with features like text to order, while Pizza Hut offers limited features again, the comp differential is profound between the two chains. Mobile Order and Payment Mobile Payment, Rolling Out Mobile Order Used for marketing, offers and restaurant location Best in class. More than 60% of orders are ordered online also can order via social media. Early adopter. 25% of transactions are mobile and 8% are mobile order and pay. Offers mobile order and pay and easy pickup. 24% of transactions are digital. Later adopter vs. competitors. Less than 50% of orders are made online. Allows for mobile order and pay but masked by food safety issues. Allows for mobile order and pay. App allows for payment. To go ordering rolled out in June Mobile ordering is only available in select locations currently being rolled out to the entire system. App only provides offers, menu information and locations. App only provides offers, menu information and locations. Uses Apple Pay. App only provides offers, menu information and locations. 21 Source: Company Data,
22 Restaurant Coverage Exposure to Minimum Wage Increases On average, the domestic systems of our coverage universe are expected to experience an average increase of 3.9% for minimum wage employees vs. 3.8% for the U.S. However, in the restaurant space, this distinction between company owned and franchised is very important, because for franchised locations, the corporate will not directly be impacted by wage increases. The only companies in our coverage universe with significant direct exposure to increasing minimum wages are CMG, PNRA, and to a lesser extent JACK, as its smaller concept, Qdoba, is ~50% owned Average Weighted Minimum Wage Increase Based on U.S. Total Stores 2017 Average Weighted Minimum Wage Increase For U.S. Company-Owned Stores JACK 5.0% SBUX 5.6% SBUX DNKN 4.8% 4.7% CMG 4.8% YUM 4.3% JACK 4.7% CMG Avg 4.2% 3.9% AVG 4.2% PNRA 3.5% DPZ 4.2% MCD DPZ 3.1% 3.0% WEN 3.2% WEN 2.6% PNRA 3.0% 0.0% 1.0% 2.0% 3.0% 4.0% 5.0% 6.0% 0.0% 1.0% 2.0% 3.0% 4.0% 5.0% 6.0% 22 Source: Department of Labor, Census Bureau, Tetrad, Thinknum,
23 Restaurant Exposure to Labor Inflation By Concept Fast Casual and Casual Dining Restaurants are primarily in the U.S. and company-owned, so they are very exposed to wage inflation. QSRs are largely franchised and more geographically diversified, which reduces exposure to minimum wage increases. % Domestic Quick Service % Domestic and Owned Bojangles 100% 46% Jack in the Box 100% 26% Papa Johns 69% 15% Sonic Corp 100% 10% Papa Murphy's 100% 8% Wendy's 93% 5% YUM Brands 43% 4% McDonalds 39% 3% Domino's Pizza 39% 3% Popeyes Louisiana Kitchen 76% 2% Wingstop 100% 2% Dunkin Brands Group 56% 0% Restaurant Brands International 39% 0% QSR Mean 73% 9% QSR Median 76% 4% % Domestic Fast Casual % Domestic and Owned Chipotle Mexican Grill 99% 99% Zoes Restaurants 100% 99% Habit Restaurant 100% 95% Potbelly's Corp 100% 91% Fiesta Restaurants Group 100% 89% Noodles and Company 100% 86% Shake Shack 60% 54% Panera Bread Co 99% 45% El Pollo Loco 100% 44% Starbucks 54% 37% Fast Casual Mean 91% 74% Fast Casual Median 100% 87% % Domestic Casual Dining % Domestic and Owned BJ's Restaurants 100% 100% Bob Evan's 100% 100% Chuy's Holdings 100% 100% Cracker Barrel 100% 100% Dave and Buster's 100% 100% Del Frisco's Grill 100% 100% Kona Grill 100% 100% Darden Restaurants 98% 97% The Cheescake Factory 94% 94% Ruby Tuesdays 100% 89% Texas Roadhouse 98% 83% Bloomin' Brands 85% 78% Fogo de Chau 74% 74% Brinker International 79% 63% Buffalo Wild Wings 93% 51% Ruth's Chris Steakhouse 86% 46% Denny's 100% 10% DIN 95% 0% Casual Dining Mean 95% 77% Casual Dining Median 99% 91% 23 Source: Company Data, Consensus Metrix,
24 Commodity Pricing If current commodity prices were to hold, commodities are expected to be slightly up this year. Beef Chicken Pork Cheese Coffee Corn Wheat Weighted Average Price Change vs. Today 1 Week -2.2% -0.1% -2.8% 5.8% 1.2% 2.2% 0.4% 0.7% 1 Month 4.0% 13.7% -6.3% 2.3% -1.4% -2.8% -1.7% 2.6% 3 Month 8.6% 15.3% 18.8% -8.1% 1.6% 3.5% 4.5% 6.4% 6 Month 20.8% 36.7% 22.1% -2.6% -8.1% 8.2% 6.1% 14.6% YoY -19.0% -2.2% 14.6% -7.8% -1.1% -5.8% -20.5% -8.8% YoY Price Changes Today -19.0% -2.2% 14.6% -7.8% -1.1% -5.8% -20.5% -8.8% 1M Ago -7.6% 8.1% 9.5% -1.5% 18.9% 5.7% -4.6% 1.6% 3M ago -8.8% -1.5% 8.7% 4.6% 8.2% -1.9% -13.2% -2.9% 6M Ago -11.8% -2.4% -23.7% -6.6% 21.9% -13.5% -21.7% -10.3% 12M Ago -16.4% -14.4% 10.5% -8.8% -9.7% -8.4% -11.3% -10.4% Projected YoY Weighted Average Commodity Basket Change using Current Prices Commodity deflation is expected to be a slight benefit in 1H17, but this is expected to reverse in 2H % Projected YoY Commodity Changes Assuming current prices, cheese and wheat are expected to experience the most deflation in 2017, while corn is expected to be flat and the remaining commodities are expected to be inflationary. 14% 0.1% -1.4% 5.5% 3.3% -16% 4% -7% -7% 6% -1% -5% 3% 4% -5% 2% -14% -2% -8% 3% -8.3% 1Q17e 2Q17e 3Q17e 4Q17e e Beef Chicken Pork Cheese Coffee Corn Wheat Weighted Average e 24 Source: FactSet, USDA,,
25 FX The dollar has strengthened since the election, and assuming current rates, FX should be a low single digit headwind in While it was hoped that 2017 would finally be the year that FX would not be an issue (or potentially even a tailwind), the dollar strengthened to 15-year highs after the election. While it has since given up some of those gains, FX remains volatile with many various factors (presidential tweets for example) resulting in significant fluctuations. At current prices of the Trade Weighted Dollar Index, FX will be a 2% headwind in 2017 vs. a 1% headwind in 2016 and a 16% headwind in Currencies that are expected to weaken the most against the dollar in 2017 include the Euro, Pound, Yuan and Yen. Excluding YUMC, YUM has the most exposure to FX by operating income in our coverage, and likely an even larger exposure at an EPS level due to their mostly domestically levered balance sheet. Coverage Universe International Exposure MCD, YUM, SBUX and DPZ have the most international exposure. % of Stores % of Op Profit % of Stores with Currency in Int'l Int'l Euro Yuan CAD Yen YUMC 100% 100% 0% 100% 0% 0% YUM 57% 53% 3% 16% 3% 4% MCD 61% 50% 13% 6% 4% 8% SBUX 46% 29% 3% 8% 6% 5% DPZ 56% 28% ~5% 3% 3% < 1% DNKN 44% 8% ~2% 2-3% < 1% 2-3% WEN 7% < 5% 0% 0% 6% < 1% CMG 1% < 1% < 1% 0% < 1% 0% PNRA < 1% < 1% 0% 0% < 1% 0% JACK 0% 0% 0% 0% 0% 0% YoY Change in FX Rates (Positive change equates to a weaker dollar). 15% 10% 5% 0% -5% -10% -15% -20% -3% -16% -1% -4% 4% -14% -3% 1% -13% -7% -11% -8% -5% -2% -3% -5% 1% -13% 12% -5% 5% 2% 1% -1% -1% -2% -17% -16% Euro Canadian Dollar Pound Yuan Yen AUD Trade Weighted Index 1Q17e e 25 Source: Federal Reserve, Company Data,
26 Summary of Restaurant P&L Impact of Proposed Tax Changes Owned Restaurant Model P&L Today P&L With Reforms Franchised Restaurant Model P&L Today P&L With Reforms Impact Same Store Sales??? Magnitude of Impact Comments Complete unknown. Sales seem to have improved modestly post-election, but the sustainability of the trend is unknown. Over the longer-term, infrastructure spending, drilling, and mining might help demand. Unit Growth??? Complete unknown. Franchisees might be more inclined to throw capital at growth if they had better visibility on labor costs. A more franchise friendly DOL and NLRB likely make franchisees feel better about investing in their business Total Sales ??? TBD If economic activity accelerates, would be higher. Food & Paper Labor Occupany & Other Restaurant Profit G&A Negative, Higher Positive, Less Regulation Higher, but good Flat or down Higher, but good Small Short-term, none. Longterm, large Depends on growth rate Smaller Depends Interest* Negative Large Possible negative for some imported foods if a border tax system is implemented. Largest drags likely among companies that use coffee and avocados. Less likelihood of federal minimum wage increase, and unfavorable regulation like Browning- Ferris and Salaried Exempt Rules. If capital expenditures are immediately expensed, this would push down operating profit. If discounted using time value, this would create value for the company, but ultimately, more about timing of deductibility. Food might be a modest headwind, while expensing capex hurts profit, but creates tax shield If capital investments are allowed to fully be expensed, this would either flow through G&A or Occupancy & Other (if the restaurant is owned). Under several of the plans being discussed, interest expense on future loans would not be deductible. Pre-Tax Profit Lower Smaller Reported PTOP likely be lower if import costs increased, and if capex is expensed Tax Rate** 30% 15% 38% 23% Positive, Lower Highly franchised restaurants tend to carry a lot of debt, and elimination of the deductibility of interest would have a very negative impact. Under Republican plan the corporate rate would drop to 20% and future repatriated income from outside the US would not be taxed. Tax Positive Large Net Income Mixed Lower tax rate materially helps casual dining restaurants because they have less interest expense. Lower tax rate on the franchised side almost completely offset by losing deductibility of interest. % Change 5.6% -1.9% Mixed * We assume a 3x interest coverage ratio, which is at the lower end. ** Owned restaurants with tipped labor pay federal tax about 20% lower than the federal corporate tax rate due to the FICA tip credit. We assume that stays. ** Assume the statutory corporate tax rate drops from 35% to 20% (Trump calls for 15%). 26 Source:
27 April 4, 2017 Individual Tax Cut Impact Individual tax cuts have historically accelerated restaurant sales. Topline Impact Conclusion: Nearly impossible to quantify and the timing will be hard to predict. Fewer regulations, individual tax cuts, and infrastructure spending is generally stimulative, but the timing and magnitude of benefit are hard to predict. For comp growth: During the Reagan Era tax cuts real restaurant growth rates were 1pt higher, and during the Bush Era tax cuts real growth rates were 50bps higher than the average growth over the last 50 years. For unit growth: Franchisees who had become rather apoplectic over the state of the industry in light of wage increases and regulation that seemed likely to increase under a Democratic legislative and executive branch, now might be more inclined to invest in unit growth if regulatory visibility improves. Economic Recovery Tax Act of 1981 ( ERTA ): The ERTA was signed into law in August 1981, and real restaurant sales growth accelerated by 80bps in 1982 and 490bps in 1983 before decelerating by a combined (300)bps over the next two years, which may have been partially due to subsequent tax increases signed into law in 1982 and The Bush Tax Cuts : The EGTRRA was signed in 2001, but phased in reductions for all tax brackets and provided for lower capital gains through This had little immediate impact on economic growth and restaurant sales growth held steady in The JGRRTA, signed in 2003, accelerated the cuts and in the same year, nominal restaurant sales growth accelerated 140bps to 5.8% and then to 6.5% in 2004, and generated similar growth until the economic crisis began in Nominal & Real Restaurant Growth 15% 1981 Tax Cut 1986 Tax Cut Bush Tax Cuts Real Restaurant Sales Growth Rates. 3.8% 3.6% 10% 3.4% 3.2% 5% 3.0% 2.8% 0% 2.6% 2.4% -5% 2.2% Nominal Restaurant Sales Growth Real Restaurant Sales Growth 2.0% Avg. Growth Rate '67-'16 Reagan Era Cuts '82- '88 Bush Era '02-'06 27 Source: Census Bureau, BLS,
28 Changes in the Corporate Tax Code The tax implications from changes in the tax code could be quite profound for restaurants and would impact several areas of the P&L. Reduction in corporate tax rates: The big offset to the loss of interest deductibility would be the reduction in the corporate statutory rate from 35% to 20% under the House plan proposed by the Republicans, and 15% proposed by Trump. Given casual dining restaurants tend to be more company owned, carry less debt, and tend to be more domestic, they would be the largest beneficiaries. This would also be a material benefit the franchised restaurants with international income if the plan holds to not tax income earned, but repatriated back to the US. Elimination of the interest tax deduction. This would be a material drag on profit for the highly franchised restaurants with high leverage ratios. Some proposals suggested this would only be on future debt issuance, but would raise the cost of using debt funding and would negatively impair valuations. To the extent a private equity bid has existed on buying both franchise restaurants or buying chains, if interest tax deduction were eliminated, it would lower the return assumptions and lower the amount of debt that would likely be issued in an LBO. Food costs on imported goods could increase under a territorial tax scheme. A territorial tax or destination based consumption tax would have the effect of taxing goods where they are consumed rather than produced. This would have the effect of taxing imports rather than exports. While the dollar value of U.S. food imports is $110B representing a fraction of overall food spend, the products most directly impacted would be those where very little is produced in the U.S. such as with coffee and avocados Among our coverage, we estimate the move to a 20% federal corporate tax rate would be a 15% benefit to earnings on average, but it interest deductibility was eliminated it would actually reduce EPS for WEN and YUM EPS Accretion with 20% Corporate Tax Rate and Elimination of Interest Deduction Domestic concepts, like CMG, would benefit the most from a tax decline. We estimate that the average 2018 EPS accretion among our coverage universe would be 14%. However, the elimination of interest deduction bringing down the average accretion to 9%. 25% 20% 15% 10% 5% 0% -5% -10% -15% -20% 22.0% 22.0% 16.6% 13.6% 18.9% 15.1% 18.1% 18.3% 10.5% 14.1% 13.0% 12.7% 6.6% 9.8% 9.5% 7.9% 2.8% 2.8% -1.0% -2.8% CMG PNRA SBUX JACK DNKN DPZ MCD YUMC WEN YUM EPS Accretion - 20% Corp Tax Dilution from Interest Deduction Elimination EPS Accretion with No Int Deduction and 20% Corp Tax 28 Source: Company Data,
29 Restaurant Industry Valuation & Price Performance Valuations in QSR/Limited Service multiples are back near all-time highs, but are trading at historical average multiples relative to the S&P. Casual dining multiples recovered as well but have since faded due to lackluster performance and are below relative historical averages. Initial optimism around owned domestic restaurant stocks has since faded due to a downturn in traffic, which coupled with labor inflation. will likely cap margin expansion over the near-term. On an EV/EBITDA basis, limited service restaurants trade at a 29% premium to historical averages, and are near peak multiples. Relative to the S&P, limited service EBITDA multiples are trading equal to historical averages. While this looks expensive, there are multiple factors why QSR restaurants should trade at a premium: The industry shift towards a more highly franchised model means less operating and cash flow volatility Declining capex means more FCF going to dividends and buybacks. Fast casual segment is experiencing outsized growth with limited risk of disintermediation Margins and returns are the highest in the consumer universe Restaurant NTM EV/EBITDA 15x 12x 9x 6x 3x 13.8x 10.8x 9.4x Restaurant stocks have outperformed the S&P over the past ten years, but this outperformance was primarily during Limited service concepts have outperformed the S&P by ~80 points while CDRs have outperformed by 10pts over the past ten years. Since the election, restaurant stocks are on average up 12%, vs. 10% for the S&P with QSRs being up 9%, Fast Casuals being up 10% and CDRs being up 15%. Limited Service Casual Dining S&P 500 QSR and CDR Relative Price Performance Restaurant NTM Price to Earnings Limited Service CDR S&P x 20.0x 15.0x 10.0x 23.6x 19.1x 17.5x x Limited Service Casual Dining S&P 500 Limited Service Casual Dining S&P 29 Source: FactSet,
30 Price to Earnings FY2 April 4, 2017 Coverage Universe Valuation & Projected Returns We project mid-teens total shareholder returns for our coverage universe driven by mid-single digit top-line growth, operating leverage, financial leverage and buybacks. We define Total Shareholder Return ( TSR ) as projected EPS CAGR plus the current dividend yield. The median TSR for our coverage universe is 17.3% while the average TSR, excluding Chipotle, which is projected to generate EPS growth of more than 90% (due to EPS decline from foodborne illness issues), the average is 17.1%. We believe that our coverage universe on average, will generate lowsingle digit unit growth and low-single digit comp growth resulting in midsingle digit topline growth. For highly franchised QSRs, this topline growth largely drops to the bottom line. For highly-owned QSRs, we believe that this topline growth coupled with levering of non-labor related fixed costs (occupancy, G&A, etc ) will be sufficient to offset wage inflation resulting in margin expansion. Overall, we project high-single digit EBIT growth for our coverage universe. This combined with financial leverage and low-to-mid single digit projected annual share count reductions result in low-double digit EPS growth. Seven of the nine companies in our coverage universe issue dividends (1-3% yields) resulting in a median mid-double digit TSR. While restaurants overall have the highest valuation of any consumer sector, these companies also have the highest combined earnings and dividend growth, justifying this valuation Total Shareholder Return* 93.1% 28.9% 20.5% 18.7% 17.8% 17.2% 15.7% 12.5% 11.5% 11.3% CMG WEN DPZ JACK SBUX YUM PNRA YUMC MCD DNKN Restaurant Valuation and Growth Rate Compared to Other Consumer Sectors. 28x 26x 24x 22x 20x 18x 16x 14x 12x Home Furnishing Dept Stores Auto Dealers Discounters HH & PC Luxury Off Price Food Auto Parts Beverages Specialty Apparel Athletic Restaurants Home Improvement 10x 6% 8% 10% 12% 14% 16% Earnings and Dividend CAGR to 2018 *Total Shareholder Return defined as EPS CAGR plus current Dividend Yield Source: FactSet,
31 Restaurants Valuation Summary April 4, Week Market Stock Movement EV/EBITDA PE FCF Yield Growth CAGR Total Debt/ SI % of Float Name Ticker Price High Low Rating Cap EV YTD 52 Week Election 2017e 2018e 2017e 2018e 2017e Div Yield Units EBITDA EPS EBITDA Current Quick Service Bojangles BOJA $ $ $ NA $733 $ % 15.4% 20.4% 11.0x 10.2x 20.3x 17.3x 5.1% 0.0% 8.4% -0.1% 13.5% 2.1x 8.3% Carrol's TAST $ $ $ 9.60 NA $503 $ % -4.5% 23.6% 7.7x 7.3x 14.0x 12.0x 7.4% 0.0% 5.7% 5.2% 13.5% 2.5x 4.0% Domino's Pizza DPZ $ $ $ In-Line $8,946 $10, % 39.5% 10.7% 19.7x 17.4x 35.9x 29.4x 2.8% 1.0% 7.5% 13.0% 21.4% 4.4x 7.1% Dunkin Brands Group DNKN $ $ $ Underperform $5,025 $7, % 13.8% 13.3% 15.0x 14.1x 22.9x 20.6x 5.4% 2.4% 2.9% 5.9% 9.9% 5.4x 7.9% Jack in the Box JACK $ $ $ In-Line $3,224 $4, % 58.7% 5.9% 11.8x 11.0x 23.0x 18.9x 5.1% 1.6% 3.4% 8.2% 19.4% 3.1x 6.1% McDonalds MCD $ $ $ In-Line $106,150 $130, % 2.0% 13.2% 13.8x 13.6x 21.3x 19.8x 4.3% 2.9% 2.0% 1.2% 8.7% 2.8x 0.9% Papa Johns PZZA $ $ $ NA $2,953 $3, % 44.4% 0.0% 15.5x 14.5x 28.4x 25.6x 3.8% 1.0% 4.3% 5.1% 10.8% 1.5x 13.0% Papa Murphy's FRSH $ 5.03 $ $ 3.56 NA $85 $ % -56.4% 28.6% 8.3x 7.5x NA NA 5.5% 0.0% 1.9% 1.8% NA 4.4x 23.8% Restaurant Brands International QSR $ $ $ NA $26,236 $36, % 42.3% 20.6% 17.8x 16.3x 30.7x 23.3x 5.1% 1.4% 5.9% 9.8% 23.1% 6.4x 2.2% Sonic Corp SONC $ $ $ NA $1,104 $1, % -28.9% 5.6% 11.2x 10.8x 20.1x 17.9x 4.7% 2.2% 1.3% -4.8% 4.3% 3.6x 15.7% Wendy's WEN $ $ $ 9.15 Outperform $3,348 $5, % 23.4% 21.1% 14.1x 12.8x 29.3x 21.2x 5.2% 2.1% 2.0% 7.6% 31.8% 6.6x 6.1% Wingstop WING $ $ $ NA $808 $ % 15.3% 3.4% 24.0x 20.4x 43.8x 35.6x 2.7% 0.0% 12.1% 14.7% 16.5% 4.2x 26.5% YUM Brands YUM $ $ $ Outperform $22,487 $30, % 7.4% 2.4% 15.5x 15.0x 23.9x 20.5x 4.4% 1.9% 3.4% 1.6% 12.5% 4.7x 2.2% YUM China YUMC $ $ $ In-Line $10,453 $10, % NA 2.3% 8.4x 7.9x 18.8x 16.7x 5.2% 0.0% 6.1% 7.0% 10.7% 0.0x 2.1% Mean 2.9% 13.3% 13.0% 14.3x 13.1x 26.1x 21.8x 4.7% 1.3% 4.7% 5.3% 15.5% 4.0x 9.5% Median 0.3% 15.3% 13.2% 14.1x 13.6x 23.5x 20.5x 5.1% 1.4% 3.4% 5.2% 13.5% 4.2x 7.1% Fast Casual Chipotle Mexican Grill CMG $ $ $ In-Line $12,986 $12, % -2.6% 21.0% 23.4x 19.3x 56.6x 42.4x 2.3% 0.0% 9.0% 78.4% 202.3% 0.0x 16.5% Fiesta Restaurants Group FRGI $ $ $ NA $635 $ % -29.5% -7.7% 7.7x 7.2x 21.3x 19.3x 1.7% 0.0% 10.8% 2.7% -2.8% 0.8x 7.9% Habit Restaurant HABT $ $ $ NA $494 $ % -5.1% 20.2% 14.0x 11.5x 60.9x 54.5x NA 0.0% 25.6% 10.9% 1.8% 0.2x 11.3% El Pollo Loco LOCO $ $ $ NA $446 $ % -15.5% 8.9% 8.4x 7.7x 10.5x 9.5x 3.0% 0.0% 6.0% 4.1% -2.8% 1.6x 13.7% Noodles and Company NDLS $ 5.95 $ $ 3.16 NA $157 $ % -49.2% 52.6% 7.7x 6.9x 20.7x 18.5x 5.3% 0.0% -0.4% 16.1% 1.8% 3.3x 15.7% Panera Bread Co PNRA $ $ $ In-Line $6,032 $6, % 32.7% 47.1% 14.3x 12.9x 37.0x 31.4x 1.9% 0.0% 3.6% 9.3% 15.5% 1.0x 15.7% Potbelly's Corp PBPB $ $ $ NA $349 $ % 1.4% 12.5% 7.4x 6.7x 29.7x 25.9x 0.8% 0.0% 8.7% 8.1% 9.2% 0.0x 5.9% Shake Shack SHAK $ $ $ NA $1,266 $1, % -9.3% 2.4% 21.7x 17.3x 66.4x 53.4x 0.0% 0.0% 28.1% 27.8% 16.7% 0.0x 53.0% Starbucks SBUX $ $ $ Outperform $85,170 $86, % -4.2% 6.7% 15.2x 13.3x 27.5x 23.4x 3.3% 1.7% 8.5% 11.8% 14.6% 0.6x 1.0% Zoes Restaurants ZOES $ $ $ NA $343 $ % -55.6% -18.9% 15.0x 12.2x 431.2x 150.4x NA 0.0% 16.7% 14.0% 21.1% 1.3x 32.3% Mean 5.8% -13.7% 14.5% 13.5x 11.5x 76.2x 42.9x 2.3% 0.2% 11.7% 18.3% 27.7% 0.9x 17.3% Median 3.4% -7.2% 10.7% 14.2x 11.8x 33.3x 28.7x 2.1% 0.0% 8.9% 11.3% 11.9% 0.7x 14.7% Casual Dining BJ's Restaurants BJRI $ $ $ NA $877 $1, % -4.9% 11.5% 8.2x 7.5x 22.6x 19.7x 4.0% 0.0% 5.4% 2.4% 4.1% 1.2x 9.0% Bloomin Brands BLMN $ $ $ NA $2,035 $2, % 14.7% 13.3% 7.0x 7.0x 14.1x 13.2x 6.7% 1.6% -0.5% 0.0% 7.6% 2.5x 9.1% Brinker International EAT $ $ $ NA $2,140 $3, % -5.5% -11.6% 8.2x 8.1x 14.1x 13.0x 9.3% 3.1% -5.3% -5.7% -2.7% 2.9x 16.8% Buffalo Wild Wings BWLD $ $ $ NA $2,455 $2, % 1.8% 1.6% 8.3x 7.9x 26.2x 22.5x 6.4% 0.0% 0.7% 5.4% 14.9% 0.7x 10.6% The Cheescake Factory CAKE $ $ $ NA $3,015 $3, % 18.1% 18.5% 10.7x 10.1x 20.8x 19.0x 4.3% 1.5% 5.2% 2.5% 8.5% 0.3x 18.3% Chuy's Holdings CHUY $ $ $ NA $498 $ % -5.0% 4.8% 10.4x 9.4x 26.2x 23.6x 1.0% 0.0% 16.0% 11.2% 7.7% 0.0x 12.2% Cracker Barrel CBRL $ $ $ NA $3,826 $4, % 4.5% 17.1% 10.3x 9.7x 19.3x 17.9x 5.2% 2.9% 1.8% 7.6% 8.6% 1.1x 18.7% Darden Restaurants DRI $ $ $ NA $10,332 $10, % 24.1% 26.1% 9.7x 9.2x 19.0x 17.6x 5.3% 2.7% 2.1% 7.4% 9.0% 0.5x 9.1% Dave and Buster's PLAY $ $ $ NA $2,551 $2, % 55.1% 46.7% 10.1x 9.1x 24.9x 22.1x 2.8% 0.0% 12.5% 13.1% 14.2% 1.1x 13.1% Del Frisco's Grill DFRG $ $ $ NA $426 $ % 11.0% 26.6% 8.6x 7.8x 21.7x 19.5x 2.7% 0.0% 4.4% 6.3% 6.1% 0.0x 1.5% Denny's DENN $ $ $ 9.84 NA $869 $1, % 18.5% 11.1% 10.8x 10.3x 21.3x 18.8x 6.7% 0.0% 1.2% 4.1% 9.0% 2.5x 2.5% Dine Equity DIN $ $ $ NA $960 $2, % -42.4% -30.6% 9.2x 9.1x 10.8x 9.8x 9.6% 7.2% 1.5% -4.4% -4.4% 5.3x 8.3% Fogo de Chau FOGO $ $ $ NA $463 $ % 1.1% 34.7% 9.6x 8.7x 17.9x 16.5x 3.7% 0.0% 13.9% 8.1% 6.9% 2.6x 4.5% Kona Grill KONA $ 6.35 $ $ 5.75 NA $64 $ % -51.0% -40.2% 5.8x 4.8x NA NA NA 0.0% 6.2% 24.1% -37.1% 2.3x 20.9% Red Robin RRGB $ $ $ NA $733 $1, % -9.8% 16.2% 7.2x 6.9x 20.6x 17.7x 7.0% 0.0% -2.7% 4.2% 7.6% 2.4x 27.1% Ruth's Chris Steakhouse RUTH $ $ $ NA $638 $ % 8.3% 28.3% 9.9x 9.4x 18.8x 17.6x 4.2% 1.8% 4.1% 5.4% 8.1% 0.4x 2.0% Texas Roadhouse TXRH $ $ $ NA $3,138 $3, % -0.2% 11.1% 10.8x 9.7x 23.8x 20.9x 2.7% 1.9% 3.2% 10.7% 12.0% 0.2x 9.4% Casual Dining Mean -2.8% 2.3% 10.9% 9.1x 8.5x 20.1x 18.1x 5.1% 1.3% 4.1% 6.0% 4.7% 1.5x 11.4% Casual Dining Median 1.0% 1.8% 13.3% 9.6x 9.1x 20.7x 18.3x 4.8% 0.0% 3.2% 5.4% 7.7% 1.1x 9.4% 31 Source: FactSet, All companies are Not Rated except for SBUX, WEN, JACK, DPZ, YUM, YUMC, CMG, MCD, PNRA, DNKN. All estimates for Not Rated companies are consensus.
32 QSR AUV and Average Daily Transactions Comparison QSR AUV Comparison The $2 million AUV level is typically the benchmark for the most productive of QSRs. QSR Average Daily Transaction Comparison At a $6 average ticket, $2 million AUV translates into ~850 average daily transactions. Chick-fil-A Panera Bread McDonald's Chipotle Wendy's Taco Bell Panda Express Jack in the Box Popeye's Burger King SONIC Drive-In Hardee's Starbucks Arby's KFC Dunkin' Donuts Domino's Jimmy John's Papa John's Little Caesars Dairy Queen Pizza Hut Subway Baskin-Robbins $1,530 $1,510 $1,487 $1,483 $1,417 $1,267 $1,253 $1,213 $1,125 $1,037 $926 $923 $917 $885 $861 $837 $784 $704 $425 $234 $2,511 $2,505 $2,424 $3,280 Chick-fil-A McDonald's Taco Bell Panera Bread Wendy's Jack in the Box Hardee's Chipotle SONIC Drive-In Starbucks Burger King Dunkin' Donuts Popeye's KFC Panda Express Arby's Dairy Queen Jimmy John's Little Caesars Subway Domino's Papa John's Baskin-Robbins Pizza Hut ,057 1, Source: Technomic, 2015 Data,.
33 Chipotle (CMG), In-Line, Base Case $375 Investment Thesis Recovery is Slower than Expected: After almost a year removed from the final outbreak, sales levels remain 20% below peak. While this represents an improvement compared to levels reached in December and January, it is not inspiring, and we believe current levels are close to a new normal. We expect sales to be down mid-to-high double digits from peak, and after cycling through weak compares in 2017, expect low single digit growth moving forward. Cost cuts allow CMG to regain some margin but comp growth key to further expansion: As a result of settling into a potential new normal, CMG is adjusting staffing levels and as a result expects to push restaurant margins up 500bps to 20% in 2017 even with AUVs of ~$2 million and higher food safety costs. However, further comp growth will be necessary to get back to low-to-mid-20s restaurant margins especially with wage inflation. Valuation Reflects a Growing Belief that Chipotle will not make a full recovery: Chipotle is trading at 42x our 2018 PE, which we believe represents a normalized year for earnings. This is optimistic and gives Chipotle credit for returning to near peak AUV and margin levels. We believe that the upside of such a multiple does not justify the risk. Scenario Analysis May be entering a new normal $800 $700 $600 $500 $400 $300 $ $200 Apr-15 Oct-15 Apr-16 Oct-16 Apr-17 Oct-17 $590 $375 $225 Catalysts Comp volatility: Customer losses improve from 20% currently to low doubles / high singles Restaurant margins: Significant cuts result in 20%+ margins G&A cuts: G&A still high and there may be opportunity for reductions. Risks Comp continues at current pace or worsens: Customers return at a slower pace and comp declines continue to be <(20%) Margin rate uncertain: Margins delever and management increases spending to reverse decline, and potentially slows down unit growth Another outbreak occurs Bull Case - $590 Base Case - $375 Bear Case - $225 38x 18 EPS of $ x 18 EPS of $ x 18 EPS of $7.50 We re Back Baby! Comps recover significantly through 2017 as marketing efforts and passage of time brings back customers. Comp growth accelerates to mid-double digits in 2017 and restaurant margins go to ~23-24% and Chipotle accelerates the pace of unit growth. AUVs return to pre-crisis levels in New Normal. Customer recovery stabilizes towards the end of the fourth quarter resulting in (20%) customer losses due to food safety issues and emerging competition. Base AUVs return to approximately $2 million and restaurant level margins are 20% in New stores continue to open up at lower AUVs and margins Growth Story Gone Wrong. The brand is tarnished and customers continue to slowly trickle back. Sales fail to recover and AUVs are ~$2 million in Margins continue to lag as promotion is required to drive traffic. Chipotle unit growth slows and CMG receives a more normalized market multiple.
34 Chipotle (What it Was) Prior to its food safety issues, Chipotle was by most metrics the most successful restaurant concept of the 21 st century. Chipotle revolutionized fast casual dining by providing customers higher-quality allnatural products in an assembly line format, which maximizes efficiency. The menu is simple and rarely changes, but is fully customizable resulting in thousands of possible combinations. Since 2005, Chipotle has added more than 1,500 locations with a compounded annual growth rate of more than 15%, and with recent growth of ~11%. AUVs increased at a 6% CAGR (with average comp growth of 9%) resulting in an AUV of $2.5 million as of September 2015, representing one of the highest of all QSRs despite not offering breakfast. Comps accelerated in 2014 as increases in commodity costs forced Chipotle to push through significant price increases yet, transactions also rose resulting in a 17% comp in Comp slowed in 2Q15 and 3Q15 as the company was lapping very difficult compares as well as potential customer fatigue, lack of product innovation and newer restaurants which were less productive that may have weighed on comp. However, CMG still was generating some of the most productive and profitable restaurants in the industry. Comp Growth Chipotle s has generated one of the highest comps in the industry and showed its immense pricing power in 2014 with 16.8% comp driven equally by transactions and check increase. 16.8% 13.7% 10.2% 10.8% 11.2% 9.4% 5.8% 7.1% 8.1% 5.6% 2.2% 0.2% Sales Growth From 2005 through LTM 9/15 sales grew at a 20%+ CAGR consisting of 15% unit CAGR and 6% AUV growth ,836 1,518 1,332 1,085 2,270 2,731 3,215 4,108 4,574 4,501 3, LTM /15 Restaurant Margins Restaurant level margins grew to an industry-leading level of 28% by LTM Sep % 22.0% 21.5% 24.9% 26.7% 26.0% 27.1% 26.6% 27.2% 27.7% 26.4% 18.2% -19.5% LTM / % LTM /15 34 Source: Company Data,
35 Chipotle Food Safety Issues and the New Normal Chipotle experienced significant food safety issues in 4Q15 causing comps to drop by (30%+) at the trough while these issues have been resolved,we believe the brand was tarnished resulting in impaired AUVs Beginning in July, and cresting in 4Q15, more than 500 people in at least 12 states were sickened with E. Coli, Norovirus and Salmonella linked to Chipotle food products. This series of outbreaks has done serious damage to the company s brand and reputation especially due to its focus on allnatural better-for-you ingredients. What started as a brand perception issue related to the foodborne illness incidents that caused traffic decline, seems to have evolved into an issue where the inability to recover traffic was partly driven by complexity that caused poor execution. Reducing complexity in any system is generally a good thing to enable an enterprise for focus on more value added tasks, and if this reduction in complexity actually improves customer service and pairs up with 2017 s marketing initiatives, the potential exists that CMG could begin to recover the AUV that they lost. Almost one full year from the first Chipotle foodborne illness outbreak, the continued weakness in comp likely represents a new steady state for the business. Outside of cycling the worst of the crisis in 1Q17, we believe future customer recoveries will be minimal making the 4Q exit rate of an ~(18-20)% decline in AUVs relative to pre-crisis levels likely the new norm. CMG 4Q comp was (4.8%) (or -5.3% excluding deferred revenue) and with October, December and January all comping (20%) below pre-safety levels. The recovery has appeared to flat-line and CMG will be seeking to improve the customer experience, continue to market heavily, and focus on digital to recover sales. While we believe that CMG can make some progress with these initiatives, we do not believe sales will significantly inflect and expect low-single digit improvement from 4Q16 run rates resulting in approximately a % comp in 1Q17 and an 8% comp in 2017, lower than the company s high-single digit target. Thereafter, we expect low single digit positive comps resulting in ~$2 million AUVs in 2018, vs. $2.5 million prior to the food safety issues. EVR ISI Comp vs. Consensus Our long-run comp estimates are still short of Consensus as we believe that CMG is beginning to enter a new normal. Comp Growth vs. Peak Levels Comps vs. peak levels have flat-lined, potentially signaling a new normal. 0% 10.4% 4.3% 2.6% 13.5% 7.5% 8.0% 6.5% 5.0% 4.0% -5% -10% -4.8% -14.6% -23.6% -21.9% -15% -20% -25% -23% -24% -22% -20% -21% -18% -20% -20% -20% -17% -15% -15% -29.7% -30% 1Q15 2Q15 3Q15 4Q15 1Q16 2Q16 3Q16 4Q161Q17e2Q17e3Q17e4Q17e 2017e2018e Comp Growth Consensus 35 Source: Company Data,
36 Chipotle: Margins in the New Normal We do not believe that CMG will get to their stretch goal of 20% RLMs due to lower comps and wage inflation. The more certain margin enhancements included lower avocado costs (100bps) as prices have already dropped, lower marketing and promos as a percentage of sales (4.7% of sales in 2016 going down to somewhere in the ~3% range in 2017) due to burrito giveaways, BOGOs and Chiptopia from Higher risk portions of margin enhancements include lower negotiated contract prices, other restaurant P&L improvements (much of this item consists of improved labor scheduling as stores are still inefficient), and sales leverage from high single digit comps. RLM Bridge 22.0% 20.0% 18.0% 16.0% 20.0% 18.7% Up until the food safety issues, CMG has been in growth mode, which has probably caused some escalation of expenses. Since CMG owns all of its restaurants, a significant portion of these expenses will be at the store level. The company had been insistent that it was not going to cut staffing now that tone has changed and we expect labor declines throughout 2017 resulting in a (3%) labor decline per store. However, mid-single digit labor inflation will likely act as an offset to these cuts. CMG has also reduced capex per store by 8% and has decreased its store growth target from 240 in 2016 to in % 12.0% 10.0% 13.5% Q416 RLM Lower Cost Lower Mktg / Negotiated Avocados Promo Contracts Higher Risk Other Rest P&L Sales Growth CMG FY17 RLM Target EVR ISI FY17 RLM YoY Expense per Store Growth Historical and Projected EPS 15.0% 10.0% 11.9% $ % 4.7% 3.3% 0.0% -5.0% -2.8% -2.0% -6.0% -6.3% -10.0% -7.6% -11.0% -15.0% e Labor per Avg Store Other OpEx per Avg Store G&A per Avg Store $1.17 $8.00 $10.65 $ e 2018e 2018e Consensus 36 Source: Company Data, FactSet, Consensus Metrix,
37 Domino s (DPZ), In-Line, Base Case $195 Investment Thesis Exceptional technology and marketing driven company: Domino s is the digital leader in online / mobile ordering with 50%+ of sales transacted online. Some international markets are over 70% online. U.S. QSR Pizza category is consistent, but losing share to other QSR formats. QSR pizza is highly fragmented, with 45% of the market controlled by local competition. This enables share gains among the larger national competitors who have scale in technology investment and marketing. Consistent approach and execution: Domino s has found a winning formula it does not offer limited time offers and pricing remains consistent. Technology, product quality, operational efficiency and now a loyalty program drive the business. This has resulted in 20%+ two-year stacked comp growth over the past four quarters. Large international unit growth opportunity; globally under-developed category. Large international unit growth opportunity Scenario Analysis Breakout needs continued U.S. growth and FX easing $240 $220 $200 $180 $160 $140 $120 $100 $ $80 Apr-15 Oct-15 Apr-16 Oct-16 Apr-17 Oct-17 $230 $195 $132 Catalysts Loyalty program provides the fuel necessary to hold comps up Continued food deflation increases franchisee profitability Unit growth acceleration in international with conversions of local brands Risks Comp Growth: US comps most correlated with employment. Change in payrolls could slow comps. Labor: Labor in DPZ stores has delevered due to wage inflation in NYC market. Further labor inflation could weigh on margins further. FX: 10% move would reduce revenue by $15mn and EPS by $0.24 Valuation: Expensive relative to history and relative to its highly franchised peers. Bull Case - $230 Base Case - $195 Bear Case - $132 23x 2017e EBITDA of $585 21x 2017e EBITDA of $558 16x 2017e EBITDA of $530 The Moon Hits Your Eye Like A Big Pizza Pie. Loyalty working with technology keeps the U.S. comping at a HSD rate with favorable commodities pushing store level margins to high-20s. International segment adds stores at a low double digit rate and domestic unit growth reaccelerates. Investors grab a fresh slice of DPZ. This Domino Does Not Fall. Strong marketing and tech spend continue to allow DPZ to outcomp the industry, but comps fall to MSD in 2017 as the company can t comp HSD forever. DPZ continues to invest in the business helping growth but reducing operating leverage. International continues to thrive despite dollar headwinds. Things Get Cheesy. Compares stiffen as gains push comps to low single digits. Dairy prices reverse and labor costs damages store level EBITDA. International unit growth slows and global turmoil makes the dollar a safe haven, reducing international profits. 37
38 4Q09 1Q10 2Q10 3Q10 4Q10 1Q11 2Q11 3Q11 4Q11 1Q12 2Q12 3Q12 4Q12 1Q13 2Q13 3Q13 4Q13 1Q14 2Q14 3Q14 4Q14 1Q15 2Q15 3Q15 4Q15 1Q16 2Q16 3Q16 4Q16 April 4, 2017 DPZ Taking Share in the U.S. The QSR pizza category in the U.S. is very mature and established, with limited category growth. For the last decade the total category experienced no growth, with a slight acceleration since The pizza category is very fragmented with local competition making up nearly half of the market, while the four largest national chains make up nearly the other half; the local competition has definitively been losing share. The Domino s U.S. business has been a real success story over the last 5 years. In 2009, Domino s relaunched the brand domestically focusing on a simple playbook - menu simplification, a focus on quality ingredients, with a simple pricing structure not reliant on limited time offers. Following that, significant technology investments as well as stores being remodeled into the Pizza Theatre format, all combined to drive system-wide sales up 50% in the following years. 60% of Domino s sales are initiated online vs. less than 20% in 2009 representing a significant advantage over local competition. This has helped domestic comp growth accelerate from less than 4% in 2012 to above 10% in This productivity increase has significantly enhanced franchisee profitability while also driving a 70% increase in domestic EBIT since Pizza Category Market Share The QSR Pizza category is highly fragmented, with local competition making up 41% of the total market. Share gains in the category are coming at the expense of local competition and the largest share holder, Pizza Hut. Mom & Pop 41.3% Pizza Hut 17.1% Domino's 15.7% 2011-'16 Market Share Change (bps) 2010-'16 CAGR Mom & Pop (607) -1.2% Pizza Hut (168) -0.3% Next 6 Largest (65) -0.2% Papa John's % U.S. System Sales and Comp Growth System sales have surged 50% since 2009 driven primarily by same store sale increases. $6,500 $6,000 $5,500 $5,000 $4,500 $4,000 $3,500 $3,000 $2,500 $2,000 % of Sales Initiated Online QSR pizza has the highest penetration of online sales of any restaurant category averaging ~55% 60% 50% 40% 30% 20% e U.S. Sales U.S. Comp 14% 12% 10% 8% 6% 4% 2% 0% Next 6 Largest 7.1% Papa John's 8.5% Little Caesar's 10.3% Little Caesar's % Domino's % US Pizza QSR 0.5% 10% Papa John's Pizza Hut Domino's 38 Source: Company Data, NPD, Nation s Restaurant News,
39 1Q13 2Q13 3Q13 4Q13 1Q14 2Q14 3Q14 4Q14 1Q15 2Q15 3Q15 4Q15 1Q16 2Q16 3Q16 4Q16 NTM PE April 4, 2017 DPZ Valuation and Returns DPZ has among the highest valuations among highly-franchised QSRs, and despite a 20% future shareholder return, DPZ s valuation appears full even as it successfully cycles comps. Domestic Same Store Sales Domino s has proven it can successfully cycle comps and loyalty is providing the fuel 16% 14% 12% 10% 8% 6% 4% 2% 0% 6% 7% 5% 4% 5% 5% 8% 11% 15% 13% 11% 10% 6% 10% 13% 12% 2017 PE vs Total Shareholder Return DPZ looks to be modestly overvalued based on its future TSR. 38x 34x 30x 26x 22x SONC 18x DNKN MCD PNRA PZZA SBUX YUM JACK DPZ QSR WEN 14x 7% 15% 23% 31% Future Total Shareholder Return* Total Shareholder Returns 11% EBIT growth coupled with leverage, buybacks (some funded by additional debt) and to a lesser extent dividends result in a nearly 20% total shareholder return. 7.8% 0.9% 18.6% 19.5% 5.0% 2.3% 11.2% 10.8% (0.4)% (0.4%) 4.5% Domestic Op Inc Int'l Op Income Growth Supply Chain Op Inc Growth Other Op Expenses EBIT Growth Int Expense Net Income / Leverage Growth Buybacks EPS Growth Dividend TSR 39 Equal to EPS CAGR plus current dividend yield. For QSR, SONC and PZZA, equal to consensus 2016e-2019e EPS CAGR plus dividend yield. Source: FactSet, Consensus Metrix, Estimates
40 Dunkin Brands (DNKN), Underperform, Base Case $49 Investment Thesis Strong Regional Brand With National Aspirations: Mature and dominant coffee chain in the Northeast. Most future growth will need to come from new markets where the Dunkin brand is less established. Very Competitive Daypart: Renewed focus by QSR competition on the breakfast daypart has led DNKN to lose share, and negative traffic after price increases shows a lack of pricing power.. New markets are not productive putting long term growth opportunity at risk. AUVs in DNKN s new South Central and West regions have AUVs that are 30% lower than Northeast and Mid-Atlantic stores with single digit store margins. If these economics continue, franchisee demand for new stores will decline jeopardizing DNKN s growth strategy. Valuation priced at highly franchised QSR average: At 15x 2017 EV/EBITDA, valuation is comparable to franchised peers despite lower growth, comp headwinds and competitive position. Total shareholder return (EPS growth plus dividend yield) is acceptable at 11%, with leverage, buybacks and dividends contributing to 60% of growth. Scenario Analysis Competitive Daypart Limits Comp Growth $70 $60 $50 $40 $54.60 $62 $30 Apr-15 Oct-15 Apr-16 Oct-16 Apr-17 Oct-17 $49 $41 Catalysts Comp change has minimal EPS impact, but has a large impact on future growth perception. Higher mobile order adoption Indication that restaurant profitability and growth is improving in markets in the Western U.S. Levered recap Risks Geographical Risk: Strongest in New England, growth in new markets may be slow Cost Pressure: Franchise profitability impacted by labor and coffee pricing Leverage: Optimal capital structure, but refi risk with rate increases Bull Case - $55 Base Case - $49 Bear Case - $41 16x 17 EBITDA of $485mn 14x 17 EBITDA of $474mn 13x 17 EBITDA of $450mn Unit and Comp Growth Percolate. Fears of breakfast daypart remaining challenged are overblown and DNKN is able to generate consistent 2-4% comps. Unit growth continues in the Western U.S. and the Dunkin brand does well in new markets. Coke partnership and K-Cup growth generates additional profit growth. 40 Grinding LSD comp and unit growth. Traffic remains squarely negative as franchisees continue to take price in order to offset wage inflation. Comp growth is flat to low-single digit, and unit growth also slows to low-single digit causing EPS growth which trails peers causing EBITDA multiple to slightly fall. Growth Turns Into A Donut. Comps run down lowsingle digit for 2017, as menu innovation and the mobile order rollout go bust. However, comps turn negative, and New England infill opportunity ends, and new market growth slows to a low single digit rate. EPS grows mid-single digits driven only by modest unit growth and buybacks.
41 1Q14 2Q14 3Q14 4Q14 1Q15 2Q15 3Q15 4Q15 1Q16 2Q16 3Q16 4Q16 (millions) April 4, 2017 DNKN U.S. Business Challenges Dunkin Donuts is a regional brand which is facing comp headwinds. Nearly 50% of revenues for the Dunkin brand occur in the Northeast and 30% occur in the Mid-Atlantic. Unlike its coffee shop peers, Dunkin evolved into a company with a menu mix more heavily skewed toward beverages over the course of several decades vs. its original incarnation as a coffee shop. As would be expected, Dunkin does very well with beverages as a percentage of mix, and it does very well with the morning daypart with over 65% of sales generated before 11AM. However, it has not been successful in expanding outside of the morning daypart. Dunkin has mostly tried to do that by rewarding its most frequent guests, Perks members, point based incentives for visiting later in the day or for purchasing food items. Despite a 1.4x increase in membership of the Perks loyalty program over the past two years, comps remain below 2% and traffic has been down 200+bps. DNKN has also have lagged the peer average for eight of the nine past quarters despite outperforming in 4Q (2-year stack underperformed by 500bps). Competitors have increasingly emphasized the breakfast daypart and seem to have taken traffic and share from DNKN. Franchisees also responded to current wage inflation with price increases, further reducing traffic and demonstrating the lack of pricing power in the brand. Dunkin Comp Gap to Peers Dunkin is struggling to maintain comps amid peers who are likely taking share 6.0% 4.0% 2.0% 0.0% -2.0% -4.0% -6.0% 2.0% (173) 0.5% 1.2% (54) (67) 1.9% 1Q14 2Q14 3Q14 4Q14 1Q15 2Q15 3Q15 4Q15 1Q16 2Q16 3Q16 4Q16 DNKN Comp Gap vs. Industry (bps) 20 DNKN US Comp (Consensus) (200) (400) (600) Sales By Daypart As would be expected, Dunkin sales highly skew to the morning daypart due to its beverage mix. 5% 30% 65% Evening (7-Close) Afternoon (11-6PM) Morning (4-11AM) Stores By Region Dunkin Donuts is a very regional brand with 79% of system-wide revenue coming from the Northeast and Mid-Atlantic. Midwest Southeast 8% 32% West 11% 2% Northeast U.S. Systemwide Revenue of $8.2B 47% Perk Members There are 4.6 million DD perks members, and YoY growth in 1Q was 64% - yet comp still trended downward % 3.0% 2.5% 2.0% 1.5% 1.0% 0.5% 0.0% -0.5% -1.0% Mid-Atlantic Perk Members Comp 41 Source: Company Data,
42 DNKN Future Store Growth in the U.S. May Be Impaired By Lower Productivity We view the lower average unit volumes and lower margin rates in the markets where Dunkin expects the most growth to be an impediment to its growth plans. With average unit volumes 25% lower than Dunkin stores in the Northeast, the store level profitability can be 2/3 lower than the profitability in a core market. As a result, Dunkin reduced the initial franchise fee from $80-90,000 in more established markets to $40,000 in areas with more limited representation of the brand. In California, the company has previously offered a graduating royalty that starts at 0.9% in the first year of the store operation, and escalated by a point annually for 6 years before reaching the normal company rate of 5.9%. We find it problematic for Dunkin brand s future rate of growth that it will need to rely on less developed markets in the South and West. Currently, 65% of the growth in the brand is coming from core and established markets, and at current growth rates we believe these markets will be exhausted in 2 and 6 years, respectively. The risk of cannibalization increases in these markets as they become more saturated. While 18% of the store base today is in emerging markets, and in the west, if we believe in the long-run targets, it will represent 85% of future growth. As the returns are lower in these markets, growth may slow from the projected 4.4% growth in 2017 making organic growth and current store performance a more important factor in DNKN s long-term algorithm. Dunkin Store Saturation The Northeast is near saturation and future growth will come from Emerging and Western U.S. markets Est. Current Stores Est. Remaining Store Opportunity Current Store Growth Rate % of Year to Current Saturation Growth* % of Future Growth Est. Current Pop. Density Future Pop. Density Density % Decline Core 4, % 2% 1:8,650 1:8,200 (8)% Established 2, % 9% 1:18,600 1:14,600 (27)% Emerging 1,334 2, % 33% 1:66,500 1:23,000 (69)% West 430 4, % 56% 1:302,000 1:25,000 (94)% Total 8,828 8, % 100% 1:35,000 1:18,300 (51)% AUV By Format By Region Largely based on brand awareness and existing competition, Dunkin stores have productivity 25% lower than stores in established markets $1,400 $1,300 $1,200 $1,100 $1,000 $900 $800 $700 $600 25% 20% 15% 10% 5% Northeast Mid-Atlantic Midwest Southeast South Central / West Free Standing Shopping Center Gas & Conv. 21.3% 21.1% 15.7% 14.2% Western Stores Have 25% Lower Productivity Store Level Operating Margin By Region We estimate store level margins to be 1/3 lower in the Midwest and Southeast, and 2/3 lower in the West than in the Northeast 7.6% 19.8% 0% Northeast Mid-Atlantic Midwest Southeast South Central / West Total U.S. 42 Source: Company Data,
43 YoY Leverage (BPS) # of Units AUV ($000s) April 4, 2017 DNKN FDD Update The 2015 DNKN Franchise Disclosure Document showed smaller AUVs and lower margins for South Central / West stores despite unit growth this refutes the maturing market argument. AUVs by Region Overall AUVs were flat but declined by (3)% in South Central / West stores. $1,500 Store Margin by Region Store margin declined by 30bps with South Central/West store margin declining by 80bps. 30% $1,200 24% 21.1% 21.3% 19.5% 18% 14.9% 14.1% $900 12% 6% 6.8% $ (50) (100) Northeast Mid-Atlantic Midwest Southeast South Central / West (30) (40) (100) (20) (30) (26) 15 (80) Total U.S. Labor and CoGS Leverage by Region Labor deleverage of 60bps offset CoGS leverage of 20bps resulting in lower margins. (8) (79) (37) 0% Northeast Mid-Atlantic Midwest Southeast South Central / West $ $ $965 Total U.S South Central / West AUV and Unit Growth AUVs for South Central / West stores declined despite unit growth. This runs contrary to the idea the area is maturing as a market. $1,000 $980 $960 (150) CoGS Labor Store Margin Northeast Mid-Atlantic Midwest Southeast South Central / West Total U.S Units AUV $ Source: Dunkin Donuts Franchise Disclosure Statements,
44 Jack in the Box (JACK) In-Line, Base Case $103 Investment Thesis Primarily a refranchising story with good visibility into G&A reductions, buybacks, and EPS growth. JIB franchise % is expected to go from 81% currently to ~86% in 2017 and ~93% by G&A is also being reduced to 2-2.5% of system-wide sales, and JACK is levering its balance sheet by 1x+ turn. We expect JACK to return nearly $0.5Bn to shareholders in 2017 representing ~15% of the market cap while also growing EPS at a mid-double digit CAGR through 2020e. Jack brand seems stronger, but traffic remains negative: Investments in improving food quality and better marketing seem to be doing well for the brand. The QSR category remains extremely promotional forcing Jack to speak more to value than it that it has historically done, but ticket driven by price has been the primary driver of SSS, while traffic remains negative. Pricing outpacing negative traffic may not be a durable strategy. Qdoba a unit growth story, with low AUVs: Qdoba has a below-industry AUV of $1.2mn, mid-teens RLMs and a geographically dispersed footprint likely not appropriate for a 700+ restaurant system. While significant unit growth potential exists, the inability to drive comp and recent margin deterioration call into question if future growth will generate sufficient future return to justify investment. Reasonable valuation with upside from re-franchising: JACK is trading at 12x FY17 EBITDA and 23x FY17 PE. JIB refranchising is EPS accretive, but Qdoba performance could weigh on the multiple. Scenario Analysis $140 $130 $120 $ $110 $100 $90 $80 $70 $60 $50 Apr-15 Oct-15 Apr-16 Oct-16 Apr-17 Oct-17 $133 $103 $73 Catalysts Comp Recovery: Traffic recovers to flat and check pushes 3% comps. Qdoba recovers: Issues prove to be more transient than secular, and marketing, remodels, and loyalty drive LSD comps. Refranchising/ G&A / Unit Growth: Refranchising initiatives complete, G&A cut by $40-$50 million, Qdoba unit growth of 10-12%, JIB restarts growth. Risks Competition: Increased competition and promotional landscape causes continued share loss and comp decline. Qdoba generates low returns. Comps continue to be negative, margins compress and new units generate lackluster returns. Wage and Commodity Inflation: Commodities reverse and the company is unable to offset wage inflation, which reduces margins. Bull Case - $133 Base Case - $103 Bear Case - $73 14x 17e EBITDA of $380 12x 17e EBITDA of $361 10x 17e EBITDA of $340 No Longer on the Value Menu. Comps recover to 3% at JIB and initiatives at Qdoba push comps to 3% in 2H17. RLMs expand as it benefits from a commodity environment and JACK accelerates G&A cuts, refranchises to 95% and increases leverage and buybacks to generate double-digit EBITDA growth and 20% EPS growth. 44 The Value is Starting to Show. JIB comps recover to 2-3%, Qdoba comps flat in 2017, and RLMs recover as disruption fades. JIB completes refranchising and cuts G&A to the midpoint of its 2.3% system sales range. Qdoba resumes unit growth at 8-9% and JACK generates high-single digit EBITDA growth and high teens EPS growth in but 2018 EBITDA falls short of $400mn target. Ain t Got Jack. Comps remain flat at JIB as transaction declines offset check. Qdoba continues to comp negative and RLMs remain in the low teens as commodities provide little benefit, labor delevers and new units have lower AUVs. The company completes its initiatives but generates unimpressive returns on Qdoba expansion and stock rerates. Source: Company Data,
45 JACK Financial Levers JACK is pulling all of its financial levers refranchising JIB, increasing leverage and reducing core G&A, which will significantly increase capital returns and result in a projected e EPS CAGR of 17%. JIB Franchising % JIB franchise % is being increased to a near target of 90% (from 82% currently) with a longer-term target of 95%. Core G&A Reduction JACK is reducing core G&A (exc. advertising) from 3.9% to % of system sales we project G&A reduction of $42million. 100% 95% 90% 85% 80% 75% 70% 75.7% 79.3% 80.8% 81.6% 81.5% 85.6% 93.0% 94.1% 94.2% 4.5% 4.0% 3.5% 3.0% 2.5% 2.0% 1.5% 1.0% 0.5% $146 $162 $146 $ % 3.9% 3.4% 2.7% $107 $103 $ % 2.1% 2.0% 2.0%-2.5% $200 $175 $150 $125 $100 $75 $50 $25 65% 0.0% $0 60% e 2018e 2019e 2020e JIB Franchised % Overall Franchised % G&A % of Syst Sales Core G&A Total Debt/EBITDA JACK intends to increase its leverage from 3.0x today to 4.0x (assuming 90% franchised) and potentially 5.0x (assuming 95% franchised). Future Capital Returns We project that JACK will return nearly ~$0.9 billion to shareholders from representing ~28% of the current market cap. 5.0x $ x 3.0x 3.4x 3.8x 3.8x 3.6x 4.0x $325 $440 $417 $375 $244 $248 $279 $250 $200 $200 $40 $42 $44 $ e 2018e 2019e 2020e 90% 95% Refranch Refranch Guide Guide e 2018e 2019e 2020e Dividends Buybacks Debt Issuance 45 Source: Company Data,
46 1Q11 2Q11 3Q11 4Q11 1Q12 2Q12 3Q12 4Q12 1Q13 2Q13 3Q13 4Q13 1Q14 2Q14 3Q14 4Q14 1Q15 2Q15 3Q15 4Q15 1Q16 2Q16 3Q16 4Q16 1Q17 April 4, 2017 JIB Comping Positive but Traffic is Negative While JIB has recently outperformed the industry, this has been driven by 3%+ check increases offset while transactions have been and continue to be negative. Comps have accelerated punctuated by a 3.1% system comp in 1Q17, but JIB has been negatively impacted by competitive pressures and a weak industry as well as MCD s launch of All- Day-Breakfast as it was one of the only concepts to sell breakfast food in all day parts. Promotional activity in the industry seem to be at all-time highs, but JIB has chosen not to significantly focus on value while also taking 3% price allowing them to generate 3-5% ticket growth, which has likely had a negative impact on traffic. We expect comps to recover from February lows, as some issues are temporary (delay in tax refund receipts and flooding in CA) as well as a focus on a more high-low strategy by emphasizing high quality items along with its Declaration of Delicious campaign while pulsing in value offers. Longer-term, JIB is looking to position itself as a QSR+ brand similar to a Chick Fil-A or In N Out. JIB is a super-regional brand, and the fact that 31% of its stores are in TX also may negatively impact performance due to weak economic conditions associated with the decline in oil. Additionally, 42% of its stores are in CA, which may pressure margins as minimum wages increased by ~11% at the beginning of However, the company has stated that it does not view JIB has a purely regional brand and intends to restart growth. JIB Unit Count Comparison Jack-in-the-Box is more of a regional concept than its competitors Quarterly System Comp and Transaction Growth JIB comps fell as MCD gained traction with its All-Day Breakfast launch but is now cycling this change 4.0% 3.0% 2.0% 1.0% 0.0% -1.0% -2.0% -3.0% -4.0% -5.0% 1.4% -2.0% 0.0% -1.4% 1.1% -2.4% 2.0% -1.5% 3.1% -1.8% -0.3% 2.8% 2.6% -4.3% 1Q16 2Q16 3Q16 4Q16 1Q17 2Q17e 3Q17e 4Q17e System Comp Est. System Traffic -1.2% -0.4% MCD Comp vs. JIB Transactions Growth JIB comps fell as MCD gained traction with its All-Day Breakfast launch but is now cycling this change % 8.0% 6.0% 4.0% 2.0% % % % -6.0% 46 McDonald's Burger King Wendy's Sonic Carl's Jr / Hardee's Jack-in-the-Box JIB Transactions MCD U.S. Source: Company Data,
47 Qdoba Growth Potential but Facing Operational Issues Qdoba comps have turned negative vs. long-term targets of 4-5%. In 2016, Qdoba s focus on product innovation resulted in positive traffic but average check fell (0.4%) resulting in a company-owned comp of 1.7%. However, comps have turned negative with an expected (1)-(2)% comp in the first half with an expectation of flat comps in 2017 driven by product innovation and loyalty. Some of the comp weakness has been due to execution and restaurant complexity issues, but these will likely take time to resolve. JACK set a longer-term system comp target of 4-5% driven by a product innovation, a remodel cycle, technology and outsourced delivery but this is a long way away. At the same time, margins have fallen significantly to low-teens including D&A. Qdoba s productivity still significantly lower than CMG and less than half prior to its food safety issues Qdoba s AUV of $1.2 million pales in comparison to CMG s 2014 AUV despite having a higher ticket. In order to narrow the gap, Qdoba needs to increase brand awareness. The concept is currently spread very thin with 712 locations in 48 states, and increasing concentration in existing successful areas should help. We do not believe that Qdoba will approach CMG AUV levels any time soon. Restaurant margins including D&A are higher, but this is due to CMG s recent 20% decline in AUVs Qdoba s guided to a 10-12% long-term growth rate but lowered the 2017 guide to 8%. Growth will primarily be in-fill as the company s current footprint is rather scattered, but will also be capital intensive resulting in $70-$90 million of new store capex in 2018e- 2020e % 9.8% 1.9% Historical and Projected Unit Count Company-Owned Franchised Quarterly Comp Composition 7.0% 6.6% 6.1% 3.1% 7.4% 6.4% 5.4% 1.5% 3.7% -1.3% -1.1% -0.8% -1.1% -0.3% 1.3% 1.0% 1.2% % 0.4% 0.0% 0.3% 0.0% 0.7% 1.0% 1.0% 1.5% -1.4% 0.5% 0.7% -2.0% -1.5% -2.5% -3.5% 1Q15 2Q15 3Q15 4Q15 1Q16 2Q16 3Q16 4Q16 1Q17 2Q17e 3Q17e 4Q17e Transactions Average Check Catering U.S. AUV Comparison $1,221 $2,000 $1,555 $1,205 Qdoba CMG* Taco Bell Baja Fresh Avg Check Comparison $11.75 Qdoba 20.7% Qdoba Exc. D&A 40% lower 5% higher $11.30 CMG* Store Margin Comparison 200bps lower 18.7% CMG* * 2017 figures used for CMG Source: Company Filings,
48 EV/2017e EBITDA NTM PE 2017 PE April 4, 2017 JACK Comparative Valuation JACK s valuation is below peers on an EBITDA and earnings but this is due to the asset-heavy nature and operational issues of Qdoba. EV / EBITDA Multiples JACK s EV/EBITDA is at the lower end of its highly-franchised peers 2017 PE vs Comp JACK looks to be slightly undervalued based on future comp growth 40x 19.7x 17.8x 35x PNRA DPZ 15.5x 15.5x 15.0x 14.1x 13.8x 11.8x 11.2x 30x 25x DNKN WEN YUM QSR PZZA SBUX SONC 20x MCD JACK 18x 16x 14x 12x 10x DPZ QSR YUM PZZA DNKN WEN MCD JACK SONC 2017 EV/EBITDA vs. Future EBITDA Growth JACK s future EBITDA growth does not look to justify its low future EBITDA multiple. MCD YUM DNKN PZZA WEN PNRA JACK QSR SONC SBUX 8x 2.0% 4.0% 6.0% 8.0% 10.0% 12.0% 14.0% Future EBITDA Growth* 15x -1% 0% 1% 2% 3% 4% 5% 6% 2017e Comp Growth 2017 PE vs. Future Total Shareholder Return* JACK s is appears to be undervalued based on its future shareholder return*. 38x 34x 30x 26x 22x SONC 18x DNKN MCD PNRA PZZA SBUX YUM JACK DPZ QSR WEN 14x 7% 15% 23% 31% Future Total Shareholder Return* 48 * For companies in our coverage universe, Future Total Shareholder Return defined as 2016e-2020e EPS CAGR plus current dividend yield. For QSR, SONC and PZZA equal to consensus e EPS CAGR plus current dividend yield. Future EBITDA Growth equal to EBITDA CAGR for companies in our comp universe. For QSR, SONC and PZZA equal to consensus 2016e-2019e EBITDA CAGR Source: FactSet, Consensus Metrix Estimates
49 McDonald s (MCD), In-Line, Base Case $132 Investment Thesis Sustainable traffic growth has proven elusive: After four consecutive years of U.S. customer count declines, MCD is simplifying its value focus, improving food quality and implementing Experience of the Future. This three-pronged strategy is focused on enhancing both the product and experience of MCD with items like signature burger and chicken products while also offering mobile order and pay and delivery. However, the U.S. QSR market remains more competitive than the Int l Lead Segment where this strategy worked, and it remains to be seen if these initiative can turnaround U.S. traffic. High Quality Consumer Name: High quality and well-known consumer equity with strong recurring cash flows due to its highly franchised and geographically diversified asset base and low leverage. Limited operational volatility makes equity volatility more similar to consumer staples than the average restaurant stock. The 3% dividend yield provides downside protection and equity support. Absent a levered recapitalization, returns are likely to trail its restaurant peers: We expect returns to equal ~7% of the market cap over the near-term equating to $23B in returns over the next three years. MCD s leverage ratio is presently ~3x, which is very low compared to other highly franchised restaurants. The argument against higher debt levels is that by owning its real estate and charging percentage rents, MCD has more operating leverage in its model than a typical franchised chain. Scenario Analysis EPS Growth rather than Comp Key to Breakout $160 $140 $120 $100 $ $80 Mar-15 Sep-15 Mar-16 Sep-16 Mar-17 Sep-17 Catalysts Comp acceleration despite tough compares in MCD able to push through pricing when coupled with commodity deflation results in an increase in operating margin. Dollar weakens, global economy improves reversing losses from 2015 causing outsized growth Additional G&A Cuts / increases leverage. Risks Share Losses: MCD reverts to a share donor as it reaches an AUV ceiling and does not increase footage growth Domestic Wage Inflation: Wage inflation without offsetting pricing pressures franchisee margins FX and Global Risk: 66% of sales and 50% of profit are outside US. Bull Case - $149 Base Case - $132 Bear Case - $106 15x 17e EBITDA of $9.9Bn 14x 17e EBITDA of $9.5Bn 12x 17e EBITDA of $9.4Bn $154 $132 $105 I m Lovin it. Comps accelerate in the U.S. due to Experience of the Future, value simplification and product improvements. International Lead continues to exhibit strength with global comps of 3-4%. Commodities remain favorable, MCD cuts G&A more than target and margins lever resulting in low-to-middouble digit EPS growth and multiple expands. 49 Special Sauce. Traffic stabilizes at 0-1% as MCD loses some share and takes a little price to get to ~2% comp growth. With commodity flat, pricing and some wage inflation, margins are also flat resulting in low-to-mid single digit EBIT Growth. Buybacks increase EPS growth to mid-to-high single digits and MCD receives a slightly lower multiple than restaurant peers. Hamburglar Returns. ADB proves to be a one-time bump, and EOTF fails to stem traffic declines. Margins compress and MCD trims its store base in the U.S. and around the world. Global headwinds negatively impact MCD international operations and buybacks result in flat to low-single digit EPS growth. Source: Company Data,
50 1Q07 3Q07 1Q08 3Q08 1Q09 3Q09 1Q10 3Q10 1Q11 3Q11 1Q12 3Q12 1Q13 3Q13 1Q14 3Q14 1Q15 3Q15 1Q16 3Q16 FY2 EV/EBITDA Relative FY2 EV/EBITDA April 4, % 10% -2% -4% -6% -8% MCD: Snapshot - Where MCD Is At System Wide Comp Trends MCD struggled globally for several years amid complexity and bureaucracy that crept into the system. 8% 6% 4% 2% 0% Years of Global Deceleration United States High Growth Markets 1Q15 2Q15 Turn Around Plan MCD reverts to a share donor as it reaches an AUV ceiling and does not increase footage growth 3Q15 4Q15 1Q16 Can Modernization accelerate comps? 2Q16 3Q16 International Lead Markets Foundational and Corporate MCD US Comp Gap vs QSR Burger Peers MCD recently gained back share due to all-day breakfast, but those share gains appear to be fading as some of the benefit may be temporary Q16 McDonald s is the world s largest restaurant system, and is a fairly ubiquitous part of the QSR experience globally. While the company has the highest AUVs of its burger chain peers globally, it struggled with complexity and bureaucracy from 2012 to early 2015, and the traffic struggled to exhibit growth. These issues culminated in management change and a restructuring of the business in mid MCD has reported some very encouraging progress in its turnaround after years of underperformance relative to peers. Some of the factors that drove the turnaround are in place like all-day breakfast, the relaunch of the value menu with a 2 for $2 price point and 2 for $5, and menu simplification. Other initiatives like the Experience of the Future platform that requires reimages and technology store investments, the launch of a mobile app, and installation of selforderings kiosks, which will be projects for 2017 and beyond. Turnaround has taken hold in international markets, with the focus turning to the domestic markets. Turnaround strategy to be focused on disciplined value, product improvements and most importantly customer experience enhancements. MCD is implementing Experience of the Future across the U.S. system (completed by 2020) allowing for kiosk ordering, better pickup and table service as well as launching mobile order and pay, a revamped loyalty program and 3 rd party delivery. MCD FY2 EV/EBITDA and Relative Valuation MCD valuation slipped as its highly franchised peers were experiencing multiple expansion. MCD valuation expanded greatly due to topline and margin expansion valuation has come in due to domestic comp pressure x 1.8x x 1.5x x x 0.9x x 0.6x FY2 EBITDA FY2 Relative EBITDA 50 Source: Company Data, FactSet, Technomic,
51 MCD Valuation and Earnings Algorithm MCD is currently trading at an NTM EBITDA and PE multiples that are 21% and 13% above its 5-year averages due to margin expansion, franchising and strength in the overall market. In order to breakout of current levels, we believe MCD will have to generate low-single digit comps and sustain double-digit earnings growth. We believe that this level of growth is possible in the near-term, but high single digit growth is more likely in the long-term driven by a 3-4% EBIT CAGR and buybacks. 24x 22x 20x 18x 16x 14x 12x 10x Historical EV/NTM EBITDA and NTM PE 21.3x 13.9x 8x Mar-12 Mar-13 Mar-14 Mar-15 Mar-16 Mar-17 NTM PE NTM EV/EBITDA $9 $8 $7 $6 $5 $4 $3 $2 $1 $ e EBIT Bridge 14.4% $5.54 Projected EPS and Growth $ % $ % $ % $ % $ % e 2018e 2019e 2020e 2021e Non-GAAP EPS YoY Growth 15% 12% 9% 6% 3% 0% 650 $9,106 $7, (7) (108) (319) (595) EBIT U.S Owned Profits U.S. Franchised Profits Int'l Lead Owned Profits Int'l Lead Franchised Profits High Growth Owned Profits High Growth Lead Profits Foundational Profits G&A and Other 2020 EBIT Source: Company Data,
52 Panera Bread Company, In-Line, Base Case $230 Investment Thesis Delivery and Panera 2.0 drives mid-single digit comps: 2.0 initiatives which include kiosks, table delivery and better Rapid Pick-Up have accelerated comps resulting in 300+bps of outperformance vs. peers. Delivery is expected to further accelerate comp growth as it is rolled out to 35-40% of the system by then end of 2017 and can lift AUVs by potentially 10%. This coupled with 2.0 and catering growth should allow PNRA to continue to beat the industry but cannibalization within channels could prevent substantial acceleration. 2.0, delivery, and technology investments and wage inflation have pressured margins: Despite the strong comp, restaurant level margins have declined by nearly 300bps since 2013 causing net earnings to drop and EPS to grow midsingle digits due to buybacks. Delivery is labor intensive, and even with a strong comp, restaurant margins may expand, but PNRA should lever other fixed costs. Valuation Prices in High Likelihood of Bull Case: Due to the recent surge in stock price, partially aided by M&A speculation, PNRA trades at 14x 2017 EBITDA and PE, a significant premium to peers on a PE basis despite having higher ownership (more volatile earnings streams). Without M&A, significant margin expansion would be required to justify this valuation. Scenario Analysis Margin and Comp Working Together Key to Breakout $300 $275 $250 $225 $200 $175 $150 $125 $ $100 Apr-15 Oct-15 Apr-16 Oct-16 Apr-17 Oct-17 $266 $230 $160 Catalysts Delivery: Delivery drives comp acceleration from current levels. Restaurant Margins: Commodity deflation continues, labor inflation eases and comp causes margins to recover back to pre-2014 levels. New unit growth accelerates as delivery and lower investment increases opportunity. Risks Pricing driving comp: Customers react negatively to pricing increases reducing transaction growth. Labor: Lower franchise percentage makes PNRA earnings more susceptible to labor inflation. Higher price point: May result in greater susceptibility to economic downturn / trade down. Bull Case - $266 Base Case - $230 Bear Case - $160 33x 17 EPS of $ x 17 EPS of $ x 16 EPS of $7.25 Fast Quality. 2.0 initiatives and delivery accelerate comps to 5%+, and franchise comps also expand due to 2.0 conversions. The company expands delivery to most of the system. Labor expense growth eases, which compounded by commodity deflation and fixed cost leverage, causes 30-50bps of restaurant margin expansion and 20% EPS growth. 52 Keeping it Casual. Comps grow at approximately 4% in 2017e, and 3-4% moving forward. Restaurant margins are slightly up in 2017e as continued wage inflation and investment offset comp growth, and EBITDA grows high- single digits causing low-to-middouble digit EPS growth. Investment continues in the out-years limiting EPS potential. Panera 0.0. Panera s pricing offsets 2.0 initiatives, and delivery doesn t have a significant impact causing comps to decelerate back to <3%, and transactions to decline. This coupled with higher labor and technology investment causes margins to delever resulting in mid-single digit earnings growth in 2017e. The multiple compresses to 22x. Source: Company Filings,
53 * * * April 4, 2017 PNRA Capacity Problem and Solution Panera was one of the first fast-casual concepts offering customers restaurant-quality food at a lower-price point in a fast-casual format The company was able to grow AUVs by 70% from 2001 through 2016, and surpassed the $2.7 AUV level in 2016 while also increasing unit count by 8x. However, PNRA because a victim of its own success as restaurants reached capacity resulting in long lines and higher levels of incorrect orders. Transaction growth went negative in 2013 and was essentially flat in 2014 while company-owned comp growth was below 3% in both years. In response, PNRA launched its Panera 2.0 initiative which introduced kiosks in stores, increased labor to address throughput issues and allowed PNRA to satisfy the demand of its current omni-channel initiatives. PNRA also launched rapid pickup in all stores where customers can order and pay online as well as delivery which is currently the most significant comp growth driver. While these initiatives have reaccelerated comp growth to above 4%, it has also reduced restaurant margin by ~350bps causing a reduction in operating margin with 2017 being the first year in which EPS is expected to surpass 2013 levels. Company-Owned Comp Growth and Traffic As stores reached capacity, comps and traffic suffered. 8% 6% 4% 2% Historical and Projected AUVs From 2001 to 2015, AUVs grew by 60% resulting in a CAGR of 4%, but developed a traffic issue as stores reached near-capacity levels. $1,577 $2,685 Historical and Projected Restaurant Margin To increase capacity, stores needed an investment in labor and margin which reduced margin. Investment to Boost Traffic 19.6% 20.1%20.7% 19.8%19.9% 18.5% 18.9% 19.3%20.2% 19.6% 17.9% 16.3% 16.6%16.8% 16.3% 16.7% 0% -2% -4% Traffic Struggled Company-Owned Comp Transaction Growth 53 *2013 adjusted for 53 rd week Source: Company Data,
54 PNRA Comps, Margins and Valuation The company has been able to outperform the industry by 400+ basis points over the past four quarters driven primarily by 2.0 transformations, the rollout of delivery and some pricing. The success of these initiatives can also be seen in the comp gap between company owned and franchise comp gap which is at 400+bps, near record levels. Delivery is currently in ~20% of company owned stores, and PNRA expects to launch delivery to 35-40% of the system or stores in Delivery sales have shown to be 10% of sales in test stores with 80-90% of sales being incremental. However, traffic, traditional transaction growth or entrée growth, has declined recently despite increased rollout of delivery and maturation of 2.0 stores. While we believe this is primarily due to softness in the industry, there is likely some cannibalization between initiatives. Restaurant margins declined by 300bps from as the company significantly invested in labor as part of its 2.0 initiatives. Margins have increased in 2016 largely due to commodity deflation and refranchising. We expect wage inflation and labor costs associated with delivery to offset future comp leverage. NTM PE multiple has increased by nearly 20% since October and is also 20% above highs, and is 6% above its relative NTM PE vs. the S&P. Company Owned Comp Composition We expect comp to be primarily driven by pricing, catering and delivery but there appears to be some cannibalization between initiatives. 1Q16 2Q16 3Q16 4Q e Pricing 2.9% 2.2% 2.4% 1.8% 2.3% 2.0% Est. Catering / Mix 0.9% 1.6% 0.7% 0.8% 1.0% 0.8% Easter Shift -0.5% 0.5% 0.0% 0.0% 0.0% 0.0% Delivery (est) 0.0% 0.1% 0.5% 1.0% 0.4% 1.5% Other Entrée Growth 2.9% -0.2% -0.2% -0.6% 0.5% -0.2% Total Company-Owned Comp 6.2% 4.2% 3.4% 3.0% 4.4% 4.1% Company-Owned Comp and Traffic PNRA has generated 3%+ comps for the past 5 quarters, but traffic has dipped we believe initiatives are sufficient to drive 3.5%+ comp growth. 7% 6% 5% 4% 3% 2% 1% 0% -1% -2% 1.5% 1.5% 0.1% 2.4% 0.8% depending on comp growth. 19.6% 17.9% 3.8% 1.2% 3.6% 1.7% 1.1% 1.0% 1.1% 16.3% 6.2% 4.2% 2.4% 4.2% 2.4% 0.4% 16.7% 16.8% 3.4% 3.0% 0.9% 1.0% -0.7% -1.5% 1Q15 2Q15 3Q15 4Q15 1Q16 2Q16 3Q16 4Q16 Comp Growth Transaction Growth Entrée Growth Restaurant Margins After three years of margin declines, 2016 margins are expected to increase slightly and we expect margins to be flat to barely up moving forward 17.1% e 2018e Source: Company Data,
55 Catering Comp Contribution (bps) 1Q15 2Q15 3Q15 4Q15 1Q16 2Q16 3Q16 4Q YoY Increase (%) April 4, 2017 PNRA - Quantifying the Bull Case on The Business The Bull Case: Big cumulative impact from 2.0, catering and delivery drives outsized comps, while CPG grows into a large business. At 4Q16 s 12% catering growth rate, it would contribute ~80bps to comp in 16: If catering accelerated to 20% growth catering would contribute ~130bps of comp. Delivery: Assuming delivery is rolled out to an incremental 20% of company-owned stores, contributes 10% to system sales with minimal cannibalization provides bps to comp. We get the bull case at a 7% comp: But, delivery is still early in its rollout, we need to assume 2% base growth (pricing), and don t contemplate negative transaction growth which occurred in 6 straight quarters from 4Q12 to 1Q14. CPG is the gravy on the bull case: The move to a co-pack would move up the margin rates, and in the $1B business scenario adds $4.50. Conclusion: We don t believe the bull case conclusions on growth are necessarily incorrect. But, we think that from a discounting standpoint, too much emphasis is put into very near term impacts versus the long tail of growth that we expect. Future EPS Sensitivity on Restaurant Margins The Bull Case also revolves around recovering margins to where they were prior to the most recent investment cycle. We believe that margins will only lever slightly as initiatives like delivery and wage inflation will require incremental labor and marketing investments. However, if the company were to get back to 20% RLMs in 2020, we estimate an EPS of more than $15 (vs. EVRISI at $12), but this would still imply an 18x PE ratio. $18 $16 $14 $12 $10 $8 $6 $4 $2 $0 $ RLM: 20.2% 32.6x $ e EVR RLM: 16.9% 27.6x $9.05 $ e EVR RLM: 17.1% 25.5x 2018e RLM: 18% EPS 23.4x $ e RLM: 19% PE $ x 2020e EVR RLM: 17.1% $ x 2020e RLM: 20% 35.0x 30.0x 25.0x 20.0x 15.0x 10.0x 5.0x 0.0x Catering Growth and Comp Contribution Catering continues double digit growth % 9% 12% 14% 11% 14% 11% 12% 10% 12% 15% 12% 9% 6% 3% 0% Projected Potential Comp Buildout If delivery rolls out to 90% of its stores over four years, PNRA s comp could reach 7% by 2018 with in-store business providing a 4% comp 4.2% 1.0% 0.9% 5.7% 2.0% 1.2% 0.8% 1.0% 1.5% 1.5% 6.4% 6.8% 2.5% 3.2% 0.9% 0.6% 1.0% 1.0% 2.0% 2.0% 55 Catering Growth Estimated Comp Contribution e 2018e 2019e Base Comp Catering Comp 2.0 Comp Delivery Source: Company Data,
56 Starbucks, SBUX, Outperform, Base Case $66 Investment Thesis Strong topline growth: We believe Starbucks can generate multiple years of mid-single digit comp growth driven by increasing beverage innovation, loyalty penetration, food attachment and technology utilization. We believe the Starbucks focus on adding higher quality food is in its early stages, with the opportunity to continue to help ticket. Pricing power due to premium brand: Starbucks likely has the best pricing power in the restaurant space even if they decide to use it. Even though the company typically only takes 1-2% price annually, we think demand is relatively inelastic on this premium, yet low ticket item. New Roastery and Reserve stores reinforce brand perception further cementing pricing power. Asia is an under-developed region and strong growth opportunity. Revenues can double and EBIT can nearly triple in Asia due to strong topline growth (especially in China) and leverage of fixed expenses. Focus on Americas margin rate, misses corporate margin gains. Double digit unit growth in CAP and continued comp growth should significantly lever fixed expenses resulting in an expected bps in margin. This coupled with continued operating leverage in Channel Development (primarily in CoGS and other opex) and Americas topline growth should offset continued labor and technology investments in the U.S. This will result in higher margin rate for the company even if Americas segment margins don t move or are under pressure. Scenario Analysis $80 $70 $60 $50 $40 $58.14 $30 Apr-15 Oct-15 Apr-16 Oct-16 Apr-17 Oct-17 $76 $66 $46 Catalysts Comps: Beverage innovation coupled with technology (rewards, payments, personalization) and food attachment reaccelerates comps. Margin Growth: SBUX eases back investment levering comps and increasing margin. Asian Opportunity: China comps accelerate, Japan recovers resulting in outsized growth. Risks Maturing US assets: Growth initiatives stall and comps decline to low -single digits. Coffee price volatility: Commodities reverse, coupled with store investment result in lower margins. Macro Risk: Starbucks comps fall if consumer health weakens. Multiple highly susceptible to contraction if growth slows. Bull Case - $76 Base Case - $66 Bear Case - $46 28x 17e EPS of $ x 18e EPS of $ x 17 EPS of $2.28 Field of Creams. Food attachment and MSR continue to grow,coupled with some pricing resulting in comps recovering to high-single digits. Company scales back investment in Americas, doubles its stores in Asia as China copies the path of Japan, and channel development goes international. Starbucks grows EBIT at a mid teens rate and EPS at 20%+. 56 Grande Expectations. Starbucks comps recover to midsingle digits. Investments still high, but Starbucks grows in Asia resulting in EBIT margin expansion. Channel development continues to grow EBIT at a double-digit rate. Moving forward, revenues continue to grow in low double digits, EBIT margin expands, and EPS grows in the high teens. Ordered a Venti, Got a Short. MSR and food attachment flatten out and company exercises some pricing power. Macro-factors negatively impact the company and investment continues causing margins to delever. China and Japan economies weigh on revenue growth and CAP slows, EBIT margins flatten and EPS grows low-double digits. Multiple contracts due to lower growth. Source: Company Data,
57 1Q12 2Q12 3Q12 4Q12 1Q13 2Q13 3Q13 4Q13 1Q14 2Q14 3Q14 4Q14 1Q15 2Q15 3Q15 4Q15 1Q16 2Q16 3Q16 4Q16 1Q17 FY12 FY13 FY14 FY15 FY16 (BPS) U.S. Rewards Members (Millions) % Growth April 4, 2017 SBUX Comp Growth Outpacing Industry While Starbucks Americas (largely U.S.) comp has slowed it has outpaced QSR and we believe SBUX should continue to outpace the industry Since 2012, Starbucks has averaged comp growth of 7%. Additionally, SBUX has been able to grow transactions at an average rate of nearly 4% over this period. Starbucks is not a new concept, and to generate this type of transaction growth on this scale is impressive. While comps have slowed recently due to difficult compares, a tough macro environment and bottleneck problems from MO&P,, it has significantly outpaced DNKN (630bp comp differential in FY15 and 540bps differential in FY16), as well as the industry. We believe that the recent slowdown is more of an exception than the trend and believe Starbucks has enough drivers to sustain mid-single digit comps. We believe that Starbucks will revert to mid-single digit comp growth as we believe beverage innovation, My Starbucks Rewards growth, food attachment, pricing and improvement in the recent macro conditions. High teens MSR membership growth and technology included suggested selling and personalization yield bps of comp growth. Food attachment has decreased to 100bps of comp, but could accelerate as SBUX launches new items especially during the afternoon hour, and based on current low attachment on food items (~1/3 of orders). These factors coupled with SBUX pricing power gives us confidence that mid single digit comp growth should persist. 10.0% 8.0% 6.0% 4.0% 2.0% 0.0% -2.0% 9.0% 8.0% Starbucks Americas Comps vs. the Industry 7.0%7.0%7.0% 9.0% 9.0% 8.0% 5.0% 6.0%6.0% 5.0%5.0% 7.0% 8.0%8.0% 9.0% 7.0% 4.0% 5.0% 3.0% 8.0% 7.0% MSR U.S. Members and Growth 6.0% % % U.S. Rewards Members Comp Model YoY Growth % 25% 20% 15% 10% 5% 0% MSR / Tech Food Core / Pricing -4.0% Transactions Ticket DNKN QSR Average 57 Source:, Company Filings
58 e 2018e 2019e 2020e April 4, 2017 SBUX: Disproving the Bear Case The key debate or pushback on owning SBUX equity is around how the earnings algorithm changes if the comps remain structurally lower than the mid-to-high single digit growth rates experienced over the last several years. Some investors have remarked that despite strong recent comps over the last few years, profit flow-through was weak, which could be a bigger problem if comps slow. SBUX generated 30%+ contribution margins in the Americas since 2011 and expanded Americas operating margins by more than 500bps since We d argue that the consistency in the contribution margin is a good indication that SBUX has a strong grasp on how it wants to manage its profit flow through. Unlike in the early 2000s, when the overall business returns were declining, and the incremental return began to decline given its heavy U.S. store exposure, the company is much more diversified today with a booming Asia and Channel Development business. Even if margins in the Americas fall, growth in SBUX other segments should be sufficient to generate strong EPS growth. Total Company Contribution Margin Total Company Contribution Margin has been solid since % 60% 40% 20% 0% -20% Our take is that SBUX likely has more levers at its disposal than they are given credit for, and 15-20% EPS growth remains a reasonable earnings growth expectation. Americas Contribution Margin The Americas segment has had significant profit flow-through despite investments in labor and technology % Historical and Projected Restaurant Margin Americas Operating Margin has increased by more than 500bps since e 2018e 2019e 2020e e 2018e 2019e 2020e 58 *2013 adjusted for 53 rd week Source: Company Data,
59 Millions of 10,000kg Bags April 4, 2017 SBUX CAP and Channel Development Opportunity China represents a significant growth opportunity for SBUX, and we believe it can double China store count over the next five years. From , we project CAP revenues and EBIT CAGR of 15% and 22%, respectively. Channel development also has solid growth potential with e revenue and EBIT CAGRs of 7% and 11%, respectively Chinese Coffee Imports $1,546 Channel Development Revenues $1,731 $1,933 $2,054 $2,218 $2,373 $2,537 $2, e 2018e 2019e 2020e 2021e CAP EBIT Walk Channel Development EBIT and Margin 2,000 1,800 1,600 1,400 1,200 1, EBIT* 333 Owned Stores Increased Sales 239 Licensed Revenues Increased Sales 179 CoGS Leverage (27) Store Operating Costs Leverage 38 Other Op Costs Leverage 89 G&A Leverage 67 D&A Leverage 210 Income from Equity Investees 47 Other 1, EBIT $1,600 $1,200 $800 $400 $0 41.8% 36.0% 37.8% 45.4% 45.3% 46.4% 47.4% 48.5% $1,315 $1,202 $1,100 $1,005 $933 $807 $654 $ e 2018e 2019e 2020e 2021e 55.0% 44.0% 33.0% 22.0% 11.0% 0.0% 59 EBIT EBIT Margin Source: Euromonitor, International Coffee Organization,, Company Filings * Adjusted for 53 rd week.
60 Wendy s (WEN), Outperform, Base Case $16 Investment Thesis Tremendous inflection in FCF presents attractive payout: FCF trends from $31mn in 16 to $ mn in 17 to an estimated $214mn by 2018 driven by factors within the company s control mostly reductions in G&A and CapEx as well as higher net rental income and reduced deferred tax payments. On 2018 FCF, WEN currently trades above a 6.7% FCF yield, a 200bps premium to its peers. Longer-term free cash flow target of $275mn will be more reliant on unit expansion (3% annually) and achieving comp growth within the 2-3% targets. QSR burger category is saturated and competitive: WEN has found success recently by highlighting food quality, and using LTOs that promote core menu items. While this has resulted in traffic that is much better than its QSR Burger peers, this is a saturated and competitive category where comps will likely be low-single digit and unit growth will be modest for the category over the long run. With refranchising expected to be complete in 2016, Wendy s needs buy-in from franchisees to reimage current restaurants and restart unit growth. Reimage / Remodel Program: Wendy s has increased its reimaged goal is to 70% of units reimaged and is targeting domestic net new stores by 2020 demonstrating the willingness of franchisees to invest in the brand. ~32% of the WEN North American store base is in these newer formats, with franchisees buying into these remodels despite relatively low paybacks. This provides a signal that 2-3% domestic unit growth is attainable post The international growth target (nearly doubling units by 2020) is less certain. Scenario Analysis FCF and Comp Key Drivers of Stock Movement: $24 $21 $18 $15 $12 $9 $13.50 $6 Apr-15 Oct-15 Apr-16 Oct-16 Apr-17 Oct-17 $22 $16 $10 Catalysts Comp growth: High-low strategy succeeds and comps grow >3% Reimaging and Rebuilds: Franchisees buy-in, 10% reimages per year, >100 net new stores added per year Continued FCF Inflection Potential monetization of Arby s Risks Comps fall flat: Intense competition causes comps to decelerate to negative Franchisees don t buy in: Reimages could lag 10% targets, and store counts could continue to decline Wage inflation: Reduces store margins and franchisee demand for new stores Bull Case - $22 Base Case - $16 Bear Case - $10 23x 18 FCF/Share of $0.96 (4.3% FCF Yield) 17x 18 FCF/Share of $0.92 (5.9% FCF Yield) 12.5x 18 FCF/Share of $0.80 (8% FCF Yield) It s Better Here. Comps recover and accelerate to >3%. Franchisees continue to buy into reimages, and unit count growth also accelerates to greater than 3%. AUVs outpace comps, and investors get more confidence in WEN s 2020 FCF target of $275mn. The company releverages its capital structure, and WEN receives a FCF yield comparable to its peers. 60 Wait Just a Little Longer. Wendy s balanced marketing message helps comps recover to 2%+ and restaurant margins hold steady. Franchisees continue to reimage restaurants at the current rate and unit count grows LSD. Visibility to 15%+ FCF growth after 2017 causes investors focus on 2018 but still give WEN a higher FCF yield due to leverage and lower unit growth. Where s the Beef? Competition intensifies, 4 for $4 loses its luster, and comps stay flat. Franchisees are slow to reimage and the company has to drop royalty rates further to gain buy-in. Franchisees are also hesitant to grow units due to flat comp and labor inflation FCF falls short of $200mn resulting in a high single digit free cash flow yield. Source: Company Data,
61 WEN EBITDA Growth We expect EBITDA to CAGR at 8% through 2020, two-thirds driven by G&A and rental income which are largely under Wendy s controllable. Wendy s affirmed EBITDA margin guidance of 38-40% by 2020, and we expect EBITDA margins of 38.4% by 2020, at the lower end due to lower than expected unit growth and flat RLMs. G&A reductions represent the largest factor in this EBITDA growth as WEN guided to 1.5% of system sales by 2020, or $180mn - we believe this target is somewhat aggressive as concepts like YUM, DNKN and DPZ have higher G&A targets as a % of system sales, and also have higher franchised percentages. We expect rental income to increase by $25mn, $22mn of which occurs in The remaining portion of the EBITDA increase is from unit growth, comp and restaurant margins. WEN is targeting 2-3% comp growth, and we believe this is an achievable target, even if it may be slightly higher than the QSR average, due to WEN s balanced marketing message between core and value and a continued benefit from reimages was also the first year when WEN increased unit count, and expects to add 1,000 net new units by 2020, representing a 3.6% CAGR. We expect the company to meet the low end of its domestic target, but be short of its international target, as this represents a show-me story. We also, expect restaurant margins to remain relatively flat at ~19% as labor inflation offsets productivity improvements and comp. General and Administrative Expenses WEN is targeting a somewhat aggressive G&A target of 1.5% of system sales implying a $65mn decline from 2016 levels. $400 $300 $ % 2.6% 2.5% 2.1% 1.8% 1.7% 1.5% 1.5% 3.0% 2.5% 2.0% 1.5% Unit Growth The company is targeting 1,000 net new units ( domestic). We expect closer to 800 units resulting in a 3% CAGR Domestic Net Adjusted EBITDA Bridge Adj. EBITDA expected to grow at an 8% CAGR from International Net 40 1, Total % 2.1% Domestic CAGR Target EVR ISI Prior Target (46) 3.6% 3.0% 63 Total CAGR 514 $100 $261 $257 $246 $216 $195 $189 $183 $ % 0.5% $ e 2018e 2019e 2020e Mgmt Target 0.0% 2016 Adj. EBITDA* Franch Fees - Unit Growth Franch Fees - Comp / Other Net Rental Income Lower Restaurant Profits Lower G&A 2020e Adj. EBITDA 61 G&A Expense % of System Sales *2016 Adj EBITDA excludes ~$10mn of lease buyout gains. Source: Company Data,
62 WEN Free Cash Flow Growth WEN s new 2020 FCF target of $275 is ~9x current levels and is driven largely by controllable factors. WEN pushed out its FCF guide from $200-$250mn in 2018 to $275mn in While bears may view this as evidence that the company is walking away from their 2018 FCF target, we view this as being consistent with WEN s new guidance structure of guiding near-term (guided to 2017 FCF of $ mn, vs. $150-$200 previously) and long-term (the 2020 guide), but not everything in between. Most of the FCF inflection remains driven by a decline in capex (guided to $65mn by 2020), reversal of working capital drag (mostly due to the sale of restaurants), and deferred tax payments. And of the $132mn increase in EBITDA, two-thirds of that increase is driven by reduced G&A and increased rental income. Comp growth will impact the ability to generate higher FCF over the long-run, but doesn t materially alter the FCF inflection in 17 due to WEN s highly franchised system. While the QSR burger category is very competitive, we think WEN is running the right strategy to drive comp. 1pt of comp growth in is worth ~$35 million of EBITDA and $22 million of FCF in 20, so the comp would need to be meaningfully divergent from our 2.5% comp estimate to bring FCF below previously guided 2018 levels Free Cash Bridge Much of the FCF expansion comes from capex decline, G&A reduction, elimination of deferred tax payments and working capital. Free Cash Flow and CapEx FCF has been depressed due to near-term capex. FCF is expected to inflect in 2017, largely due to a decline in capex, and we expect a CAGR of 16%, resulting in FCF of $271mn, falling just short of WEN s target of $275mn. $224 $106 $298 -$34 $252 $10 $150 $34 $161 $216 $238 $271 $85 $80 $75 $ e 2018e 2019e 2020e CapEx 2020 Free Cash Flow Sensitivity While 2020 FCF algorithm is more sensitive to comp than 2018 targets, comp would have to meaningfully miss targets for FCF to fall below $200mn. FCF (19) 271 $605 $570 $535 $500 $465 $238 $260 $282 $304 $ % 2.0% 3.0% 4.0% 5.0% 2016 Cash Flow Plus NWC Change 2016 Deferred Tax Payment EBITDA Growth Capex Decline Cash Interest Increase Cash Taxes / Other 2020 EVR ISI FCF Comp Growth 2020e EBITDA 2020e FCF 62 Source: Company Data,
63 NTM PE April 4, 2017 WEN Valuation 2017 PE vs. Future Total Shareholder Return WEN is undervalued vs. peers based on future earnings potential 38x 34x 30x 26x 22x SONC 18x DNKN MCD PNRA PZZA SBUX YUM JACK DPZ QSR WEN 2018 Free Cash Flow Yield* Despite the run in the share price, WEN still offers investors one of the highest FCF yield per share of its peers. 6.7% 6.7% 5.1% 5.1% 4.9% 4.7% 4.7% 4.6% 3.2% 2.8% 14x 7% 15% 23% 31% Future Total Shareholder Return* SONC WEN QSR DNKN YUM JACK MCD PZZA DPZ PNRA Coverage Universe Market Stock Movement EV/EBITDA PE FCF Yield Div Yield Growth CAGR Total Debt/ Name Ticker Price Rating Cap EV 30D YTD 2017e 2018e 2017E 2018e 2017e 2016 Units Sales EPS TSR EBITDA Chipotle Mexican Grill CMG $ In-Line $12,986 $12, % 20.0% 23.0x 18.9x 56.6x 42.4x 2.3% 0.0% 8.6% 12.9% 93.1% 93.1% 0.0x Dunkin Brands Group DNKN $ Underperform $5,025 $7, % 4.1% 15.0x 14.1x 22.9x 20.6x 5.4% 2.4% 2.7% 2.9% 9.0% 11.3% 5.4x Domino's Pizza DPZ $ In-Line $8,946 $10, % 16.9% 19.7x 17.4x 35.9x 29.4x 2.8% 1.0% 7.0% 9.3% 19.5% 20.5% 4.4x Jack in the Box JACK $ In-Line $3,224 $4, % -8.7% 11.8x 11.0x 23.0x 18.9x 5.1% 1.6% 4.0% -0.1% 17.1% 18.7% 3.1x McDonalds MCD $ In-Line $106,150 $130, % 6.5% 13.8x 13.6x 21.3x 19.8x 4.3% 2.9% 2.2% -6.6% 8.6% 11.5% 2.8x Panera Bread Co PNRA $ In-Line $6,422 $6, % 37.8% 15.1x 13.6x 37.0x 31.4x 1.8% 0.0% 3.5% 7.2% 15.0% 15.0% 1.0x Starbucks SBUX $ Outperform $85,170 $85, % 5.3% 15.1x 13.2x 27.5x 23.4x 3.3% 1.7% 8.3% 9.8% 16.0% 17.7% 0.6x Wendy's WEN $ Outperform $3,348 $5, % 0.3% 14.1x 12.8x 29.3x 21.2x 5.2% 2.1% 3.0% -1.9% 26.8% 28.8% 6.6x YUM Brands YUM $ Outperform $22,487 $30, % 0.3% 15.5x 15.0x 23.9x 20.5x 4.4% 2.0% 3.5% -9.0% 15.2% 17.2% 4.7x YUM China YUMC $ In-Line $10,453 $10, % NA 8.4x 7.9x 18.8x 16.7x 5.2% 0.0% 5.9% 5.8% 12.5% 12.5% 0.0x Quick Service Mean 4.3% 9.2% 15.9x 14.4x 30.8x 25.3x 3.8% 1.5% 4.7% 2.7% 24.5% 26.0% 3.2x Quick Service Median 1.3% 5.3% 15.1x 13.6x 27.5x 21.2x 4.3% 1.7% 3.5% 2.9% 16.0% 17.7% 3.1x 63 * Calculated as 2018 projected free cash flow (cash flows from operations less capex) per share divided by the current share price. Source: Company Data,, FactSet
64 YUM! Brands (YUM), Outperform, Base Case $75 Investment Thesis Post 2018, YUM will be an asset-light company with cash flows diversified by brand and geography with a long runway for growth. At 98% franchised, YUM will have low earnings volatility and low capital intensity with 60% of restaurants located outside of the U.S. System-sales goal of 7% annual growth might be a stretch, but unit growth has a long duration with the opportunity to grow 2-3x the current footprint. Clear visibility on EPS growth with most accretion driven by items within YUM s control. Refranchising will drop the G&A by $300mn, reduce to capex to $100mn or 5% of EBITDA, which will result in 100% NI to FCF conversion. This cash conversion and buybacks provide the majority of earnings growth to reach its $3.75 EPS target in 2019, or 15% EPS annual growth from 2016 pro forma EPS. KFC and Taco Bell two strong global brands Pizza Hut not so much: KFC should generate 3-4% unit growth and 7% operating profit growth. It is a concept that exports well, and comps have been positive since the recession. Taco Bell focuses on value and innovation; longer run growth in the brand outside of the U.S. might take time to build awareness. Pizza Hut is the largest global pizza chain, but is experiencing a multi-year turn-around in the US and global growth. Current year valuation at 15.5x EBITDA seems full, but high teens annualized returns are a justifiable reward given the visibility on this path to $100 $90 $80 $70 $60 $50 $63.64 $40 Apr-15 Oct-15 Apr-16 Oct-16 Apr-17 Oct-17 $90 $75 $58 Catalysts G&A and CapEx cuts materialize: While the cuts are significant, company disclosure on type and timing was not. If reductions come sooner than later, investors will have more confidence in earnings targets Pizza Hut Recovers: If Pizza Hut is able to execute on its turnaround plan, it can stop losing share and join the mom and pop share taking party. Taco Bell Int l Growth Story: Int l units accelerate and performance is strong giving YUM a third global brand. Risks Pizza Hut Inflects Downward: A further weakening would likely cause growth to stop and potentially increased closures. Commodities Reverse: Multiple YUM concepts are depending on deflation to offset wage increases. FX: Majority of YUM s units are international, a strong dollar would cause revenues and profits to decline Bull Case - $90 Base Case - $75 Bear Case - $58 20x YUM 17 EBITDA of $2.1Bn 18x YUM 17 EBITDA ($1.95Bn), 16x YUM 17 EBITDA ($1.85Bn), Yo Quiero YUM. System unit growth and comps result in high single digit system growth. KFC accelerates its growth story. Pizza Hut takes share from mom and pops and grows low single digits, while Taco Bell executes on mid-single digit comps and accelerates int l growth. G&A and capex cuts materialize earlier than expected. 64 Finger-Lickin Good. The company achieves its system unit growth targets by KFC grows system revenues at 5-6%, Pizza Hut grows profits low single digits due to some unit expansion, and Taco Bell comp continues at 2-3%, while units expand, but international is slow to catch on. G&A and capex reductions are more back-weighted into 2017 and South of the Border Performance. KFC comp decelerates, Pizza Hut continues to lose share. Taco Bell comps slow to industry levels of 1-2%. Pizza Hut continues to comp negative and the company has to close stores. Commodities increase causing margins to further compress. Dollar continues to strengthen and net new unit growth slows. Source: Company Data,

65 YUM! Brands Snapshot Brand Strength Strong Strong Weak Global Growth Oppty. High Low Medium System Sales $23B $10B $13B Units - U.S. / Non U.S. 4,160 / 17,140 = 21,300 20% / 80% 6,500 / 325 = 6,825 ~95% / 5% 7,700 / 9,200 = 16,900 ~46% / 54% Unit CAGR 3.5% 4.3% 3.3% Units Added Annually ~700 ~300 ~ e Comp Growth 2.5% 3.0% 1% % Franchise* 93% 86% 96% Key Points Strong global brand: Chicken as an ingredient has ubiquity globally. Brand translates well around the world. Largest Store Growth Opportunity.: Could grow units 2-3x, leaving decades of growth. Nearly all of growth is outside U.S. New focus on value and marketing: Brand has be strong with focus on value (bundled offers) and better marketing has moved to comps back to positive. Very strong U.S. concept: Accounts for nearly half of the U.S. Mexican QSR segment. Mostly a U.S. Concept: Mexican fare has not exported well historically. Beginning to do more, but category would need to develop globally for a large unit count opportunity. Likely 8,500 U.S. units over time. Very Innovation and Value Driven Brand: Customers react to new products and value. Low average check of $5.35 drives very high frequency. Lagging Concept, But Improving Recently: #1 global pizza chain. U.S. underperformed for years and continuing to lose share. China has big issues, most other stores are in EM. Mature U.S. category, global unit grower: Limited U.S. unit growth opportunity, global category is underdeveloped and likely understored Turnaround Opportunity: Lags significantly behind large peers in the U.S. and globally, but YUM has been successful in turning around Taco Bell and Pizza Hut in the past. 65 Source: Technomic, Company Data,
66 YUM Earnings Algorithm Historical and Projected G&A Expense YUM is targeting $300 million of G&A targets from 2015 pro forma levels resulting in near-industry low levels of 1.5% of system sales. Shareholder Returns The company s targeted $6.5-$7.0 billion of shareholder returns from represent ~30% of current market cap. $6,300 6,081 2, % 2.5% $5,400 1,500 1, % 1.7% 1.5% 1.7% 2.0% 1.5% 1.0% $4,500 $3,600 $2,700 $1,800 1,953 2,370 2,175 1, , e 2018e 2019e 2019 Target 0.5% 0.0% $900 $0 $1,087 $1, PF 2017e 2018e 2019e 2020e Dividends Buybacks FCF G&A % of System Sales 2016PF-2019e EPS Bridge We believe that YUM will be short of its $3.75 EPS target (due in part to recent FX moves) but most of the levers (G&A, Capex, Buybacks) are within the company s control. $0.99 $3.72 $3.75 $4.32 Post-2019 TSR Mid single digit system sales growth results in high single digit EBIT growth and low double digit net income growth (leverage). Buybacks result in MSD EPS growth with dividends boosting TSR to mid-to-high-teens. 5% 15% 2% 17% $0.34 $2.45 $0.43 ($0.49) 6% 2% 8% 2% 10% System Sales Growth Operating Leverage EBIT Growth Financial Leverage Net Income Growth Buybacks EPS Growth Dividend TSR 66 Source: Company Data,
67 2017 NTM PE 2017 NTM PE Tax Rate April 4, 2017 YUM Valuation Post 2019 A 24x 2019 PE ratio results in a $90 share price, or a $75 share price today resulting in a 19% annualized return EV/EBITDA Comparison YUM s 2019 EV/EBITDA comparison is higher than current peer multiples. Shareholder Returns However, this premium multiple is justified given YUM s lower tax rate and capital intensity. 40% DNKN 19.7x 17.8x 16.8x 15.5x 15.5x 15.0x 14.1x 13.8x 11.2x 35% 30% YUM 2019 DPZ MCD WEN PZZA SONC 25% QSR 20% DPZ QSR YUM 2019 YUM PZZA DNKN WEN MCD SONC PE Ratio vs. System Sales Growth A 24x PE multiple appears conservative given YUM s 6% system sales growth (which is lower than YUM long-term System Sales Growth) 40.0x 15% 0.0% 5.0% 10.0% 15.0% 20.0% 25.0% 30.0% CapEx / EBITDA PE Ratio vs. Total Shareholder Return* A 24x PE ratio also appears to be conservative given YUM s projected midto-high teens total shareholder return which we believe is higher quality than most peers given its future 98% franchise percentage. 40.0x 35.0x 30.0x WEN PZZA QSR DPZ 35.0x 30.0x PZZA DPZ QSR WEN 25.0x 20.0x MCD SONC DNKN YUM x 20.0x DNKN MCD SONC YUM x 2% 4% 6% 8% 10% 12% 14% 2018 System Sales Growth 15.0x 10% 15% 20% 25% 30% 2018 Total Shareholder Return* 67 Source: Company Data, FactSet, Consensus Metrix, *Defined as EPS growth plus dividend yield
68 Defining the YUM Bear Case We believe there is not much downside to YUM with comp and FX being the primary items out of the company s control, and these items are not likely to have a substantial impact on EPS. The majority of EPS growth is due to factors within the company s control that include G&A reduction, D&A reduction due to the migration to a 98% franchised system and buybacks We believe the unit growth targets have low risk as both KFC and Pizza Hut have a lot of white space internationally and Taco Bell has multiple years of runway in the U.S. We estimate that 1pt of comp in impacts EPS by ~$0.25 or 7%. However, this risk is mitigated by (1) being concept diversified there is low risk that all concepts experience a slowdown at the same time, (2) being geographically diversified lower risk that all geographies experience a slowdown at the same time (3) conservatism in targets we expect a 2.5% comp target for KFC (vs. 3% currently), 3% comp for Taco Bell (3% currently) and 1-2% for Pizza Hut (-1% currently). We estimate that a 2% move in the dollar impacts FX by $0.08. The dollar has strengthened considerably since 2014 with most of that occurring in While the dollar reached highs post-election, this still only results in a 3% move on a trade-weighted basis. We are not currency speculators, but a similar future move to 2015 would result in a Euro/USD exchange rate below $0.90 to 1 Euro. Overall a 1% (vs. 2.5% in the base case) comp coupled with a 3% strengthening in the dollar (from current levels) would result in an expected 2019 EPS of ~$3.25. Assuming a 20x multiple results in a 2018 year-end share price of $65, or approximately equal to today EPS Sensitivity on Comp Growth 2019 EPS Sensitivity on FX. $3.13 $3.37 $3.61 $3.86 $4.11 $4.37 $4.15 $4.06 $3.98 $3.89 $3.80 $3.72 $3.64 $3.55 $3.46 $3.38 $ % 1.0% 2.0% 3.0% 4.0% 5.0% Comp Growth -10% -8% -6% -4% -2% 0% 2% 4% 6% 8% 10% 2018 U.S. Dollar Move 68 Source: Company Data,
69 YUM! China (YUMC), In-Line, Base Case $30 Investment Thesis China business a growth opportunity with many risks: A volatile business based on exogenous factors generally out of YUM s control. In an ideal state, YUM China has exposure to a developing and fragmented industry with an emerging and increasingly wealthy consumer base. In reality, the market is evolving quickly, and not always to YUM s benefit. The greatest threat is the rise of online delivery aggregators, which somewhat levels the playing field between YUMC (more of a threat to PHCD than KFC) and smaller independent chains. Unit growth opportunity large, restaurant margin likely has upside: YUMC believes the unit growth opportunity is ~3X its current 7.5k units in China, but growth rates are impaired by store closures. Transition to VAT system versus the prior business tax should help margins by at least 2 points, but low comp growth may pressure margins over the long-run if costs inflate faster than sales. Earnings algorithm: We expect 5% unit growth and LSD comps to translate into low-dd operating profit growth and mid-teen EPS growth. We expect 40%+ of EBITDA to fund Capex, with buybacks requiring repatriation at the U.S. Federal Rate Scenario Analysis Growth Likely, but not for the Faint at Heart $40 $35 $30 $25 $26.60 $20 Apr-15 Oct-15 Apr-16 Oct-16 Apr-17 Oct-17 $40 $30 $21 Catalysts Management and Investor Focus: Spin enables both management and investors to focus on this pure-play Chinese consumer business. Average Unit Volume (AUV) recovery or decline: AUVs have declined from competition, with future growth largely coming from lower-tier cities that may have lower volumes. Restaurant Level Margins (RLM): Change from business tax to VAT a structural notch up in rate. Material labor and cost inflation could be longrun drag on RLM. Risks Frequency of exogenous events: YUMC has had issues with bird flu, suppliers, O2O networks, stock market swings, and anti-western protests. Commodities Reverse: Food deflation reversal FX: 100% of revenue is in Yuan, with U.S. repatriation required for buybacks and potential dividends. Bull Case - $40 Base Case - $30 Bear Case - $21 11x YUMC 17 EBITDA of $1.35Bn 9x YUMC 17 EBITDA of $1.2Bn 7x YUMC 17 EBITDA of $1.0Bn The Year of the Rooster: Comps stabilize and KFC comps mid-single digits, units accelerate while RLMs pace to reach 20% on scale and the VAT change. PHCD accelerates unit count and regains momentum causing comps to recover to mid-single digits as customers gravitate back to the brand after positioning around value. Company RLMs expand to high teens while EBITDA grows at low-double digits while EPS CAGRs at highteens to low 20s. Multiple expands due to stability. 69 Poultry In Motion: Comps continue to display volatility but averages out to KFC at ~3% and PHCD at 1%. KFC unit growth increases to 5% and margins increase to around 17% in 2017, but are flat thereafter as wage inflation offsets comp and fixed costs. PHCD margins delever after 2017 due to wage inflation resulting in midteens RLMs overall. Due to topline and G&A leverage, EBITDA CAGRs at 9% and EPS CAGRs at 14-15%, but multiple remains at ~9x on volatility fears. Battered & Boneless: Another event occurs (whether it be macro or company-specific), and both KFC and PHCD comp negative. This causes RLMs to recede back to pre-vat 2015 levels equating to company-level restaurant margins of ~13%. Closures decrease net growth, and lackluster comps cause incremental margin degradation moving forward. EBITDA grows low single digits and EPS grows mid-single digits. Source: Company Data,
70 YUM! China Brands Snapshot Yum China Concepts KFC Pizza Hut Casual Dining All Other Segments Pizza Hut Home Service, Little Sheep, East Dawning (Taco Bell Future) Brand Strength Strong Medium Weak Units / % of Yum China ~5,100 / 68% 1,600+ / 23% ~350+ Pizza Hut Home Service ~235 Little Sheep ~15 East Dawning Cities / Provinces 1,114 / / 30 NA Est. System Sales / % of Yum China 2017 Net Units Added / Growth Rate ~$6.5Bn / 75% ~$1.9Bn / 21% ~$300mn / 4% 280 / 5.4% ~140 / 8.2% ~50 / 8% 2017e Comp Growth** 3.0% 1% NA 2017e AUVs $1,200 $1,100 NA 2017e Restaurant Margin 17.3% 14.1% 10.2% 2017e Operating Profit / % of Yum China* $748mn / 81% $176mn / 19% ($20)mn % Owned ~76% 98% ~90% Key Points: Largest China Concept: KFC is the largest chained restaurant in China with 2x the units of its next closest competitor. Single Digit Unit Growth: We project 5% unit growth due to the size of the concept. Tailwinds include urban population growth, transportation hubs and shopping malls. Choppy Performance: After three years of negative comp sales, comps are expected to be positive but have been volatile. Largest Casual Dining Concept: Pizza Hut is mostly a premium casual dining restaurant in China Performance has been negative but has recently improved: Pizza Hut comps have declined in 10 straight quarters due to economic softness and increased competition especially from online aggregators. However, SSS has improved from double digit negative to low single digit negative Pizza Hut Home Service has potential: Pure pickup and delivery concept similar to pizza chains in the states. While small, has doubled unit count over the past few years. (Recently rolled into Pizza Hut). Other concepts have minimal growth potential and likely will not have significant impact on YUM financials moving forward. Have mentioned Taco Bell potential but way too early to impact financials. 70 Source: Company Data,
71 April 4, 2017 YUM China Market Outlook and Current State Discretionary Spending per Capita (Urban) Discretionary spending per capita has increased at a 10% CAGR over the past 15 years and similar growth is expected in the near future. 35,000 30,000 China Restaurant Industry Structure Independent vs. Chain The restaurant structure is dominated by small independent restaurants and is extremely fragmented. Chain, 1.5% 25,000 20,000 15,000 10,000 5,000 0 YUM China Unit Counts and Growth Rate New unit count slowed in 2016, and we expect a slight acceleration to net new units (6% growth) per year ,243 6,715 7,176 7,562 8,073 8,563 9,063 9, % 7% 6% 5% 4% 3% 2% 1% Independent, 98.5% YUM China System Wide Sales After slowing to low single digits (MSD ex FX), we expect high single digit system sales growth moving forward. $12,000 $10,000 $8,000 $6,000 $4,000 $2,000 $8,145 $8,270 $8,237 $8,213 $8,728 $9,504 $11,183 $10,314 25% 20% 15% 10% 5% 0% e 2018e 2019e 2020e KFC Pizza Hut Casual Dining Other % Growth 0% $ e 2018e 2019e 2020e System Sales YoY Growth -5% 71 Source: CEIC, Chinese Gov t Data, Euromonitor, Company Data,
72 YUM China Comp Volatility YUM China s comp growth has been exceptionally volatile over the past four years due to a multitude of company-specific and macroeconomic issues. While we do not expect the same level of volatility moving forward, we believe that a high level of volatility is to be expected in an emerging market growth story. However, YUMC is currently facing significant online competition and has recently underperformed peers. KFC Historical and Projected Comp Growth 30% 20% 10% 0% -10% -20% 13% 9% 0% -8% -14% -4% 11% 21% -14% -18% -14% -12% 3% 6% 12% 3% -1% 1% 2% 3% -30% -40% -24% -26% 1Q12 2Q12 3Q12 4Q12 1Q13 2Q13 3Q13 4Q13 1Q14 2Q14 3Q14 4Q14 1Q15 2Q15 3Q15 4Q15 1Q16 2Q16 3Q16 4Q e 2018e PHCD Historical and Projected Comp Growth 20% 18% Comp Growth Two-Year Stack 15% 10% 5% 0% -5% -10% -15% 10% 5% 7% -2% 7% 5% 4% 8% 0% -11% -9% -6% -4% -1% -8% -12% -11% -4% -3% 0% 1% -20% 1Q12 2Q12 3Q12 4Q12 1Q13 2Q13 3Q13 4Q13 1Q14 2Q14 3Q14 4Q14 1Q15 2Q15 3Q15 4Q15 1Q16 2Q16 3Q16 4Q e 2018e 72 Source: Company Data, Comp Growth Two-Year Stack
73 YUM China Growing Pains and Profit Conversion Historical and Projected AUVs AUVS appear to have stabilized after declining by ~29% since 2012,we project AUV CAGR of 2.1%. $1,248 $1,581 $1,619 $1,365 $1,272 $1,199 $1,115 $1,098 $1,112 $1,127$1,143 YUM China PF Restaurant Margins* RLMs have recently recovered due to the VAT, but we believe that YUM China will fall short of its 17% RLM goal 19.1% 16.5% 14.9% RLM Target: 17.0% 12.6% 12.3% 11.6% 16.0% 15.9% 15.7% 15.7% 15.3% e 2018e 2019e 2020e YUM China Earnings Algorithm Mid-double digit EPS growth driven by high-single/low-double digit operating profit growth and buybacks e 2018e 2019e 2020e EBITDA and FCF Conversion We expect current FCF conversion rates of ~35% to expand as YUM capex remains flat and EBITDA expands. 6.9% 1.8% (0.0%) 8.7% 8.8% 5.7% 14.5% EBITDA CAGR: 9% FCF CAGR: 15% $985 $1,112 $1,203 $1,302 $1,414 $1,525 Sales Margin Expansion Operating Profit Higher Tax Rate Net Income Buybacks EPS CAGR $398 $428 $564 $660 $728 $ e 2018e 2019e 2020e FCF Adj EBITDA 73 * Inclusive of 3% royalty fee. Source: Company Data,
74 Disclosures ANALYST CERTIFICATION The analysts, Matt McGinley and Josh Schwartz, primarily responsible for the preparation of this research report attest to the following: (1) that the views and opinions rendered in this research report reflect his or her personal views about the subject companies or issuers; and (2) that no part of the research analyst s compensation was, is, or will be directly related to the specific recommendations or views in this research report. DISCLOSURES This report is approved and/or distributed by Evercore Group LLC ( Evercore Group ), a U.S. licensed broker-dealer regulated by the Financial Industry Regulatory Authority ( FINRA ), and International Strategy & Investment Group (UK) Limited ( ISI UK ), which is authorised and regulated in the United Kingdom by the Financial Conduct Authority. The institutional sales, trading and research businesses of Evercore Group and ISI UK collectively operate under the global marketing brand name ( ). Both Evercore Group and ISI UK are subsidiaries of Evercore Partners Inc. ("Evercore Partners"). The trademarks, logos and service marks shown on this report are registered trademarks of Evercore Partners. The analysts and associates responsible for preparing this report receive compensation based on various factors, including Evercore Partners total revenues, a portion of which is generated by affiliated investment banking transactions. seeks to update its research as appropriate, but various regulations may prevent this from happening in certain instances. Aside from certain industry reports published on a periodic basis, the large majority of reports are published at irregular intervals as appropriate in the analyst s judgment. generally prohibits analysts, associates and members of their households from maintaining a financial interest in the securities of any company in the analyst s area of coverage. Any exception to this policy requires specific approval by a member of our Compliance Department. Such ownership is subject to compliance with applicable regulations and disclosure. also prohibits analysts, associates and members of their households from serving as an officer, director, advisory board member or employee of any company that the analyst covers. This report may include a Tactical Call, which describes a near-term event or catalyst affecting the subject company or the market overall and which is expected to have a short-term price impact on the equity shares of the subject company. This Tactical Call is separate from the analyst s long-term recommendation (Buy, Hold or Sell) that reflects a stock s forward 12-month expected return, is not a formal rating and may differ from the target prices and recommendations reflected in the analyst s long-term view. Applicable current disclosures regarding the subject companies covered in this report are available at the offices of, and can be obtained by writing to Evercore Group LLC, Attn. Compliance, 666 Fifth Avenue, 11th Floor, New York, NY Evercore Partners and its affiliates, and / or their respective directors, officers, members and employees, may have, or have had, interests or qualified holdings on issuers mentioned in this report. Evercore Partners and its affiliates may have, or have had, business relationships with the companies mentioned in this report.. Additional information on securities or financial instruments mentioned in this report is available upon request. 74
75 Disclosures 75
76 Disclosures 76
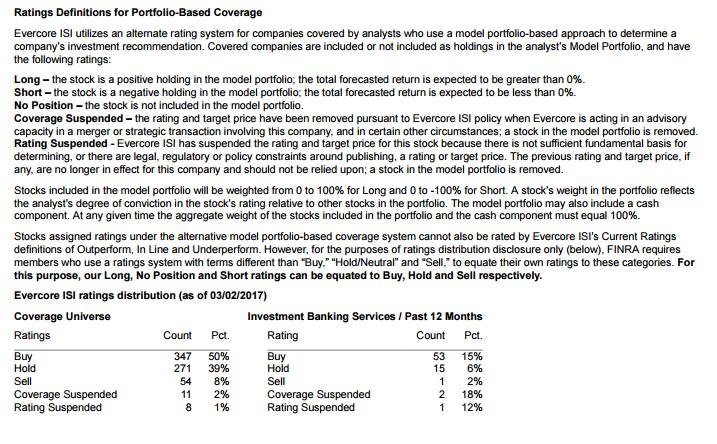
77 Disclosures 77
Quarterly Concept Dashboard 2Q:14 Benchmarking for $1B+ Chains and Other Select Concepts System Stats, Unit Sales & Margins, Build Costs, Valuations
 Quarterly Concept Dashboard 2Q:14 Benchmarking for $1B+ Chains and Other Select Concepts System Stats, Unit Sales & Margins, Build Costs, Valuations Casual Buffalo Wild Wings Cheesecake Factory Chili's
Industry Data Report New Unit Investment
 Data, Analysis & Insight for a Stronger Industry Building Bridges between Franchisees, Franchisors & Financiers Industry Data Report New Unit Investment 2018-2019 RR s New Unit Investment Industry Data
Dine Brands Global, Inc. Investor Presentation March 2019
 Dine Brands Global, Inc. Investor Presentation March 2019 Disclosures Forward-Looking Information: The content contained in this presentation is as of March 5, 2019. The Company assumes no obligation to
McDonald's Corp (MCD)
") Americas/United States Equity Research Restaurants Rating OUTPERFORM Price (18-Dec-17, US$) 174.20 Target price (US$) (from 178.00) 185.00 52-week price range (US$) 174.20-119.48 Market cap(us$ m) 142,278
Americas/United States Equity Research Restaurants Rating OUTPERFORM Price (18-Dec-17, US$) 174.20 Target price (US$) (from 178.00) 185.00 52-week price range (US$) 174.20-119.48 Market cap(us$ m) 142,278
Dine Brands Global, Inc. Investor Presentation December 2018
 Dine Brands Global, Inc. Investor Presentation December 2018 Disclosures Forward-Looking Information: The content contained in this presentation is as of December 4, 2018. The Company assumes no obligation
QUIC RESEARCH REPORT. Consumers & Healthcare. Restaurant Brands International (TSX:QSR) Stock Pitch A Company as Rich as its Dark Roast Coffee
 Stock Pitch A Company as Rich as its Dark Roast Coffee") QUIC RESEARCH REPORT Consumers & Healthcare Restaurant Brands International (TSX:QSR) Stock Pitch A Company as Rich as its Dark Roast Coffee Daniel Morris Julie Vincent Jon Allion Simon Rezene Michael
QUIC RESEARCH REPORT Consumers & Healthcare Restaurant Brands International (TSX:QSR) Stock Pitch A Company as Rich as its Dark Roast Coffee Daniel Morris Julie Vincent Jon Allion Simon Rezene Michael
Restaurant Industry Overview and Valuation
 A Specialized Investment Bank Restaurant Industry Overview and Valuation Pacific Financial Plaza 860 Newport Center Drive Newport Beach CA 92660 949.219.5296 July 2007 949.720.9194 fax WWW.CBCAPITAL.COM
November 20 th, Company: Sonic Corp. (NASDAQ SONC) Action: Long Price Target: $34.00 Students: Peiheng Xu, Devon Pennington, Elise Radolf
 Action: Long Price Target: $34.00 Students: Peiheng Xu, Devon Pennington, Elise Radolf") November 20 th, 2015 Company: Sonic Corp. (NASDAQ SONC) Action: Long Price Target: $34.00 Students: Peiheng Xu, Devon Pennington, Elise Radolf Long: SONC Company Overview Domestic Drive-in Leader Market
November 20 th, 2015 Company: Sonic Corp. (NASDAQ SONC) Action: Long Price Target: $34.00 Students: Peiheng Xu, Devon Pennington, Elise Radolf Long: SONC Company Overview Domestic Drive-in Leader Market
AVERAGE LISTING CAP RATE BY REGION & TERM REMAINING
 AVERAGE LISTING CAP RATE BY REGION & TERM REMAINING 7.50% 7.00% 6.50% 5.50% 5.00% 4.50% 4.00% 0-10 11-20 0-10 11-20 0-10 11-20 0-10 11-20 0-10 11-20 0-10 11-20 0-10 11-20 0-10 11-20 0-10 11-20 Applebee's
Investor Presentation JANUARY 2016
 Investor Presentation JANUARY 2016 FORWARD-LOOKING STATEMENTS Forward-Looking Statements This presentation contains forward-looking statements that are subject to risks and uncertainties. All statements
The Cheesecake Factory Incorporated
 March 20, 2015 The Cheesecake Factory Incorporated (CAKE-NASDAQ) Current Recommendation SUMMARY DATA NEUTRAL Prior Recommendation Outperform Date of Last Change 01/12/2011 Current Price (03/19/15) $48.82
INVESTOR PRESENTATION JANUARY 2018
 INVESTOR PRESENTATION JANUARY 2018 0 FORWARD-LOOKING STATEMENTS Forward-Looking Statements This presentation contains forward-looking statements that are subject to risks and uncertainties. All statements
INVESTOR PRESENTATION JUNE 2018
 INVESTOR PRESENTATION JUNE 2018 0 FORWARD-LOOKING STATEMENTS Forward-Looking Statements This presentation contains forward-looking statements that are subject to risks and uncertainties. All statements
30 th Annual Raymond James Institutional Investors Conference March 11, 2009
 30 th Annual Raymond James Institutional Investors Conference March 11, 2009 Safe Harbor Statement Under the Private Securities i Litigation i i Reform Act of 1995 Our presentation includes, and our response
Darden Restaurants, Inc.
 Darden Restaurants, Inc. DRI: Reports Solid Performance; Expectations Were Pretty High Despite Evidence Segment Is Slowing Our View: We reiterate our OW rating following shares coming under pressure because
Jack in the Box Inc. Cowen & Company 7 th Annual Consumer Conference
 Jack in the Box Inc. Cowen & Company 7 th Annual Consumer Conference January 12, 2009 Jack in the Box Inc. Safe Harbor Statement This presentation includes plans and estimates for the future, which are
Delivering a Best-in-Class Guest Experience and Exceptional Shareholder Returns. Fall 2015 Investor Presentation
 Delivering a Best-in-Class Guest Experience and Exceptional Shareholder Returns Fall 2015 Investor Presentation Important Additional Information Cracker Barrel Old Country Store, Inc. (the Company ) urges
4Q and Full Year 2016 Earnings Presentation. February 8, 2017
 4Q and Full Year 2016 Earnings Presentation February 8, 2017 Cautionary Language Regarding Forward-Looking Statements & Non-GAAP Measures This presentation contains forward-looking statements within the
Lipton Financial Services Restaurant and Retail Review
 DUNKIN BRANDS GROUP Date : August 8, 2017 DNKN: Company Overview (2016 10K) Dunkin Brands Group, Inc. oversees one of the world s leading franchisor operations consisting of 20,242 stores worldwide at
An Investment Analysis Case Study
 An Investment Analysis Case Study This case is a group project that is due on April 2, before class at 10.30. Stating the obvious: Each group will turn in one report (sounds obvious, but might as well
Comprehensive Plan to Enhance Shareholder Value. December 19, 2013
 Comprehensive Plan to Enhance Shareholder Value December 19, 2013 Forward-Looking Statements During the course of this presentation, Darden Restaurants officers and employees may make forward-looking statements
Restaurants. Industry Focus. Restaurant Industry Initiation. Citigroup Global Markets. North America Restaurants (Citi) 5 December pages
 5 December pages") North America Restaurants (Citi) Industry Focus 36 pages Restaurants Restaurant Industry Initiation Restaurant Initiation We are initiating coverage of the restaurant industry. We rate Burger King a Buy/Medium
North America Restaurants (Citi) Industry Focus 36 pages Restaurants Restaurant Industry Initiation Restaurant Initiation We are initiating coverage of the restaurant industry. We rate Burger King a Buy/Medium
Q Financial Results. May 4, 2017
 Q1 2017 Financial Results May 4, 2017 Safe Harbor The information made available in this presentation contains forward-looking statements which reflect the Company s current view of future events, results
My Largest Short Position: Wingstop. Whitney Tilson April 7, 2017
 My Largest Short Position: Wingstop Whitney Tilson April 7, 2017 Kase Capital Management Is a Registered Investment Advisor Carnegie Hall Tower 152 West 57th Street, 46th Floor New York, NY 10019 (212)
UNITED STATES MAP REGIONS
 UNITED STATES MAP REGIONS WEST MIDWEST NORTHEAST MOUNTAIN MID-ATLANTIC SOUTH WEST MOUNTAIN MIDWEST SOUTH MID-ATLANTIC NORTHEAST Washington Oregon California Montana Idaho Wyoming Nevada Utah Colorado Arizona
November 2012 Investor Presentation
 November 2012 Investor Presentation FORWARD-LOOKING STATEMENTS This presentation and our accompanying comments include forward-looking statements. These statements relate to future events or our future
Macquarie Investor Day Presentation
 RESTAURANT BRANDS NEW ZEALAND LIMITED Macquarie Investor Day Presentation Sydney 4 May 2017 Russel Creedy Group CEO Presentation Outline RBD Who Are We FY17 Trading Results Hawaiian Acquisition Growth
Q4 and FY 2017 Financial Results. March 9, 2018
 and Financial Results March 9, 2018 Safe Harbor The information made available in this presentation contains forward looking statements which reflect the Company s current view of future events, results
Jacky Lo Chief Finance Officer, Yum China
 Jacky Lo Chief Finance Officer, Yum China Cautionary Language Regarding Forward-Looking Statements Forward-Looking Statements. Our presentation may contain forward-looking statements within the meaning
Dine Brands Global, Inc. Investor Presentation. March 5, 2018
 Dine Brands Global, Inc. Investor Presentation March 5, 2018 2 Disclosures Forward-Looking Information: The content contained in this presentation is as of February 21, 2018. The Company assumes no obligation
Investment Club Fall 2017
 Investment Club Fall 2017 President Sarah Graney (sgraney@nd.edu) Vice President Devon Krapcho (dkrapcho@nd.edu) Board Member Alyssa Loffredo (aloffred@nd.edu) Board Member Rafa Campos (rphilipp@nd.edu)
Sphera Franchise Group. Interim results: Jan-Sep 2017
 Sphera Franchise Group Interim results: Jan-Sep 2017 1 Disclaimer This presentation is not, and nothing in it should be construed as, an offer, invitation or recommendation in respect of shares issued
MCDONALD S COMPANY REPORT
 MASTERS IN FINANCE QUICK SERVICE RESTAURANTS INDUSTRY 23 MAY 2018 STUDENT: DIOGO GÓIS 27229@novasbe.pt Velocity Growth Plan Continues And we re lovin it Recommendation: BUY We start the analysis of McDonald
Fourth Quarter & Full Year 2017 Results Presentation. February 8, 2018
 Fourth Quarter & Full Year 2017 Results Presentation February 8, 2018 1 Cautionary Statement on Forward-Looking Statements & Non-GAAP Measures This presentation contains forward-looking statements within
MANAGEMENT S DISCUSSION AND ANALYSIS OF FINANCIAL CONDITION AND RESULTS OF OPERATIONS
 MANAGEMENT S DISCUSSION AND ANALYSIS OF FINANCIAL CONDITION AND RESULTS OF OPERATIONS Unless otherwise noted, the section references to (i) us, our, we, the Company and YUM refer to YUM Brands, Inc. and
Starbucks (SBUX): Secret Menu. July John M. Zolidis
: Secret Menu. July John M. Zolidis") Starbucks (SBUX): Secret Menu July 2 2018 John M. Zolidis An earlier version of this presentation was given at ValueX Vail on June 28, 2018 Presentation Outline Summary of the set-up and current issues
Starbucks (SBUX): Secret Menu July 2 2018 John M. Zolidis An earlier version of this presentation was given at ValueX Vail on June 28, 2018 Presentation Outline Summary of the set-up and current issues
Fourth Quarter 2018 Results Presentation. January 31, 2019
 Fourth Quarter 2018 Results Presentation January 31, 2019 1 Cautionary Statement on Forward-Looking Statements & Non-GAAP Measures This presentation contains forward-looking statements within the meaning
1Q 13. In augmentation. Growth Strengthening Results Sustainability PRESENTATION INVESTOR RELATIONS 1Q In augmentation
 Growth Strengthening Results Sustainability PRESENTATION INVESTOR RELATIONS 1Q-2013 1 CORPORATE* Subfranchise Starbucks Chile BRANDS COUNTRIES COMING SOON Mexico Chile Colombia Argentina BRAZIL COMING
Investor Presentation
 Investor Presentation October, 2008 Andrew F. Puzder, President & CEO Ted Abajian, EVP and CFO CKE Restaurants, Inc. (NYSE: CKR) DISCLOSURE REGARDING FORWARD-LOOKING STATEMENTS Matters discussed in this
PNC Investment Perspective
 March/April 2014 PNC Investment Perspective Decoupling of Developed and Emerging Markets? Jim Dunigan Mr. Dunigan is Executive Vice President and Managing Executive, Investments for PNC Asset Management
November 18th, 2016 Company: Action: Price Target: Students:
 November 18 th, 2016 Company: Casey s General Stores, Inc. (NASDAQ: CASY) Action: Long Price Target: $145 Students: Yamel Cotero, Jonathan Evans, Ian Ricks Long: CASY Company Overview Casey s is the 5
All numbers used in this presentation, regarding future performance are based on analysts independent forecast of AmRest results.
 All numbers used in this presentation, regarding future performance are based on analysts independent forecast of AmRest results. 1 Executive Summary Definitive agreement to acquire Spanish Restaurant
Jack in the Box Inc. Reports Third Quarter FY 2015 Earnings; Updates Guidance for FY 2015; Declares Quarterly Cash Dividend
 Investor Contact: Carol DiRaimo, (858) 571-2407 FOR IMMEDIATE RELEASE Media Contact: Brian Luscomb, (858) 571-2291 Reports Third Quarter FY Earnings; Updates Guidance for FY ; Declares Quarterly Cash Dividend
Jack in the Box Inc. Reports First Quarter FY 2015 Earnings; Updates Guidance for FY 2015
 Investor Contact: Carol DiRaimo, (858) 571-2407 FOR IMMEDIATE RELEASE Media Contact: Brian Luscomb, (858) 571-2291 Jack in the Box Inc. Reports First Quarter FY 2015 Earnings; Updates Guidance for FY 2015
German Investment Seminar 2011 Commerzbank AG New York January 10-11, 2011
 German Investment Seminar 2011 Commerzbank AG Mark Langer Chief Financial Officer Dennis Weber Head of Investor Relations New York January 10-11, 2011 German Investment Seminar, Commerzbank HUGO BOSS January
Executive Cotton Update U.S. Macroeconomic Indicators & the Cotton Supply Chain
 Executive Cotton Update U.S. Macroeconomic Indicators & the Cotton Supply Chain May 2018 www.cottoninc.com Macroeconomic Overview: The International Monetary Fund (IMF) publishes comprehensive sets of
Annual Shareholders Meeting. November 13, 2014
 Annual Shareholders Meeting November 13, 2014 Sandy Cochran President and Chief Executive Officer FY2014 Business Review Safe-Harbor Statement Cracker Barrel Old Country Store, Inc. ( the Company ) urges
Micky Pant CEO, Yum China
 Micky Pant CEO, Yum China Cautionary Language Regarding Forward-Looking Statements Forward-Looking Statements. Our presentation may contain forward-looking statements within the meaning of Section 27A
2015 INSOLVENCY AND RESTRUCTURING FORUMS. Retail insolvency. A practitioner s guide to key issues and challenges
 Retail insolvency A practitioner s guide to key issues and challenges Agenda Introduction Quick overview of retail in Canada So now what do you do with an insolvent retailer? Questions Key retail macro-economic
PBPB total shareholder return (TSR) 1 year 3 year Since IPO 2 PBPB TSR (11.1%) (28.4%) (62.5%)
 1 year 3 year Since IPO 2 PBPB TSR (11.1%) (28.4%) (62.5%)") June 22, 2017 Sent via email Potbelly Corporation 111 N. Canal St., Ste. 850 Chicago, IL 60606 Potbelly Corporation Board of Directors: Ancora Advisors LLC is a significant shareholder of Potbelly Corporation
June 22, 2017 Sent via email Potbelly Corporation 111 N. Canal St., Ste. 850 Chicago, IL 60606 Potbelly Corporation Board of Directors: Ancora Advisors LLC is a significant shareholder of Potbelly Corporation
Investor Presentation. Wells Fargo Conference October 2012
 Investor Presentation Wells Fargo Conference October 2012 Disclaimer This presentation contains forward-looking statements, as defined by federal and state securities laws. Forwardlooking statements include
PANERA BREAD COMPANY
 UVA-F-1575 Rev. Sept. 3, 2009 As the end of 2007 drew near, Panera Bread Company was facing a brand-new challenge. Until recently, strong margins had allowed Panera to finance its rapid growth largely
AmRest Holdings SE Presentation for Investors March 19th 2013
 AmRest Holdings SE 2012 Presentation for Investors March 19th 2013 Teleconference Details AmRest FY 2012 results are included in the FY 2012 Financial Report which is available to download from Investor
QUARTERLY FINANCIAL REPORT
 QUARTERLY FINANCIAL REPORT Page Key Trends...2 Executive Summary...3 Economic Indicators...4 General Fund...8 Public Safety & Justice...10 Land Use, Housing & Transportation...11 Health & Human Services...14
Robert D. Cruz, PhD, Chief Economist
 Robert D. Cruz, PhD, Chief Economist Office of Economic Development and International Trade Miami-Dade County cruzr1@miamidade.gov / www.miamidade.gov/oedit Office of Economic Development and International
THERE IS NO MORE DOWNSIDE
 HOWARD PENNEY SHAYNE LAIDLAW THERE IS NO MORE DOWNSIDE BEST IDEA: LONG MCDONALD S (MCD) July 8, 2015 HEDGEYE 1 DISCLAIMER DISCLAIMER Hedgeye Risk Management is a registered investment advisor, registered
Jefferies Consumer Conference June 2017
 Jefferies Consumer Conference June 2017 Important Information Forward Looking Statements Some of the statements contained in this presentation constitute forward looking statements within the meaning of
RECOVERY CONTINUES FOR LOGISTICS REAL ESTATE
 RECOVERY CONTINUES FOR LOGISTICS REAL ESTATE World events trigger soft patch The global economic soft patch in the first half of 2011 was primarily caused by the cost of oil reaching $114 per barrel, rising
THE CLASSIFIED BALANCE SHEET
 ACTIVITY 11 Purpose: THE CLASSIFIED BALANCE SHEET Identify account classifications typically used on the balance sheet STARBUCKS (SBUX) 9/28/2008 BALANCE SHEET ($ in millions) ASSETS LIABILITIES Cash and
Sysco 2Q16 Earnings Results. February 1, 2016
 Sysco 2Q16 Earnings Results February 1, 2016 Forward-Looking Statements Statements made in this presentation or in our earnings call for the second quarter of fiscal 2016 that look forward in time or that
Decline in Economic Activity Larger Than Advance GDP Estimate February 27, 2009
 Northern Trust Global Economic Research 5 South LaSalle Chicago, Illinois 663 northerntrust.com Asha G. Bangalore agb3@ntrs.com Decline in Economic Activity Larger Than Advance GDP Estimate February 27,
DOMINO S INVESTOR PRESENTATION AUGUST 2018
 DOMINO S INVESTOR PRESENTATION AUGUST 2018 LEGAL STUFF This presentation and our accompanying comments include forward-looking statements. These statements may relate to future events or our future financial
Jack in the Box Inc. Reports First Quarter FY 2013 Earnings; Updates Guidance for FY 2013
 Investor Contact: Carol DiRaimo, (858) 571-2407 FOR IMMEDIATE RELEASE Media Contact: Brian Luscomb, (858) 571-2291 Reports First Quarter FY 2013 Earnings; Updates Guidance for FY 2013 SAN DIEGO, February
U.S. Economic Update and Outlook. Laurel Graefe, REIN Director Federal Reserve Bank of Atlanta October 2, 2013
 1 U.S. Economic Update and Outlook Laurel Graefe, REIN Director Federal Reserve Bank of Atlanta October 2, 213 Following the deepest recession since the 193s, the economic recovery is well under way, though
There has been considerable discussion of the possibility
 NationalEconomicTrends February Housing and the R Word There has been considerable discussion of the possibility that ongoing troubles in the housing market could push the economy into recession 1 But
Q Financial Results. August 3, 2017
 Q2 2017 Financial Results August 3, 2017 Safe Harbor The information made available in this presentation contains forward-looking statements which reflect the Company s current view of future events, results
Panera Bread Company. Stock Report Jan. 3 rd, 2014 Sympol: PNRA. 12-Month Target $207. Ray s Recommendation Buy by Ray Xiao
 Ray s Recommendation Buy by Ray Xiao rui.xiao@tufts.edu Price $175 12-Month Target $27 Sector Consumer Sub-sector Restaurant Summary This company owns, operates, and franchises retail bakery-cafes in the
October 22, Dear Mr. Craigie:
 October 22, 2018 The Independent Members of the Board of Directors Bloomin Brands, Inc. 2202 North West Shore Boulevard Tampa, Florida 33607 Attention: Mr. James R. Craigie Lead Independent Director Dear
Economic and Market Outlook
 Economic and Market Outlook Third Quarter 2018 Investment Products: Not FDIC Insured No Bank Guarantee May Lose Value Past performance is no guarantee of future results. Financial term and index definitions
RESEARCH Q CAP RATE REPORT. CALKAIN RESEARCH Worldgate Dr Ste 150 Herndon, VA calkain.com
 RESEARCH Q4 2018 CAP RATE REPORT CALKAIN RESEARCH 12930 Worldgate Dr Ste 150 Herndon, VA 20170 703.787.4714 calkain.com RESEARCH In many respects, the closing quarter of 2018 could almost be a replay of
Investor Presentation. Russ Bendel Chief Executive Officer. Ira Fils Chief Financial Officer. May 2015 AND
 Investor Presentation May 2015 Russ Bendel Chief Executive Officer AND Ira Fils Chief Financial Officer Forward Looking Statements Forward Looking Statements This presentation contains forward looking
Unemployment approaching Fed-set NAIRU Civilian unemployment rate, NAIRU=Non-Accelerating Inflation Rate of Unemployment
 Unemployment approaching Fed-set NAIRU Civilian unemployment rate, NAIRU=Non-Accelerating Inflation Rate of Unemployment Percent 12 10 8 6 4 2 0 1981 1983 1985 1987 1989 1991 1993 1995 1997 1999 2001 2003
29 th Annual ROTH Conference March 13, 2017
 29 th Annual ROTH Conference March 13, 2017 David Burke, Chief Executive Officer Phyllis Knight, Chief Financial Officer Safe Harbor The information made available in this presentation contains forward-looking
The Federal Reserve has set the target range for the federal
 NationalEconomicTrends October Monetary Policy Stance: The View from Consumption Spending The Federal Reserve has set the target range for the federal funds at to 5 percent and intends to keep this near
BOB EVANS REPORTS FISCAL 2015 FOURTH-QUARTER AND FULL-YEAR RESULTS; PROVIDES FISCAL YEAR 2016 OUTLOOK
 BOB EVANS REPORTS FISCAL FOURTH-QUARTER AND FULL-YEAR RESULTS; PROVIDES FISCAL YEAR 2016 OUTLOOK Q4 net sales total $332.4 million, an increase of $6.0 million, or 1.8 percent. GAAP net income of $0.24
Single-family home sales and construction are not expected to regain 2005 peaks
 Single-family home sales and construction are not expected to regain 25 peaks Millions of units 8. 7. 6. 5. Housing starts (right axis) 4. Home sales (left axis) 3. 2. 1. 198 1985 199 1995 2 25 21 215
February 8, 2012 Robert Johnson Director of Economic Analysis
 Positive Surprises in Store for 2012? Macro Overview February 8, 2012 Robert Johnson Director of Economic Analysis 1 U.S. Economic Data 2011: Soft, but no recession, Growth Accelerated Through the Year
ECONOMIC AND FINANCIAL HIGHLIGHTS
 ECONOMIC AND FINANCIAL HIGHLIGHTS LABOR MARKET Contributions to Change in Nonfarm Payrolls 2 Unemployment and Labor Force Participation Rate 3 MANUFACTURING ISM Manufacturing Index 4 CONSUMERS Light Vehicle
Sphera Franchise Group. Interim results: Jan-Sep 2018
 Sphera Franchise Group Interim results: Jan-Sep 1 Disclaimer This presentation is not, and nothing in it should be construed as, an offer, invitation or recommendation in respect of shares issued by Sphera
With the tax filing season in full swing, these summary
 NationalEconomicTrends March Income Taxes: Who Pays and How Much? With the tax filing season in full swing, these summary figures may provide some perspective on the issue of who is paying federal individual
MBA Forecast Commentary Joel Kan
 MBA Forecast Commentary Joel Kan Economy & Labor Markets Strong Enough, First Rate Hike Expected in December MBA Economic and Mortgage Finance Commentary: November 2015 This month s outlook largely mirrors
Page 1/12. Yum China Reports Fourth Quarter and Full Year 2017 Results. February 7, :30 PM ET
 Yum China Reports Fourth Quarter and Full Year 2017 Results February 7, 2018 4:30 PM ET SHANGHAI, Feb. 7, 2018 /PRNewswire/ -- (the "Company" or "Yum China") (NYSE: YUMC) today reported unaudited results
Donny Lau Senior Director, Investor Relations & Corporate Strategy
 NEWS Donny Lau Senior Director, Investor Relations & Corporate Strategy Yum! Brands Reports Second-Quarter GAAP Operating Profit Growth of 32%; Delivered Core Operating Profit Growth of 7%; Raises Full-Year
Boston Pizza Royalties Income Fund TSX : BPF.UN Investor Presentation February 8, 2018
 Boston Pizza Royalties Income Fund TSX : BPF.UN Investor Presentation February 8, 2018 Forward Looking Information Certain information in this presentation may constitute forward looking information" that
JPM US Equity Income Fund
 J.P. Morgan Asset Management Investment Summit 2016 JPM US Equity Income Fund HALF IMAGE PLACEMENT HOLDER (HORIZONTAL) Resize image to cover grey box Clare Hart, Managing Director, Portfolio Manager #JPMsummit
ECONOMIC & REVENUE UPDATE
 January 11, 2018 Summary summary The U.S. labor market gained 148,000 net new jobs in December. U.S. housing starts in November 2017 were 12.9% above their year-ago level. Consumer confidence declined
Dougherty & Company Institutional Investor Conference
 Dougherty & Company Institutional Investor Conference September 19, David Burke, Chief Executive Officer Phyllis Knight, Chief Financial Officer Safe Harbor The information made available in this presentation
Hedgeye Best Ideas Conference Call
 Hedgeye Best Ideas Conference Call Friday, November 11, 2011 THIS PRESENTATION WAS PREPARED BY: THE HEDGEYE RISK MANAGEMENT RESEARCH TEAM Disclaimer Hedgeye Risk Management is not a broker dealer and does
The Economic & Financial Outlook
 The Economic & Financial Outlook Beata Caranci SVP & Chief Economist TD Economics September 217 Key Themes Synchronized global economic acceleration has put monetary policy normalization in focus Canada
Diversifying growth is beneficial
 Craig Holke Investment Strategy Analyst WEEKLY GUIDANCE ON ECONOMIC AND GEOPOLITICAL EVENTS December 4, 2018 Resilient U.S. Economy Continues Its Solid Growth Key takeaways» The U.S. economy continues
Economic and Market Outlook
 Economic and Market Outlook Fourth Quarter 2018 Investment Products: Not FDIC Insured No Bank Guarantee May Lose Value Past performance is no guarantee of future results. Financial term and index definitions
Investor Presentation. January 2017
 Investor Presentation January 2017 Forward-Looking Statements Forward-Looking Statements This presentation contains forward-looking statements that are subject to risks and uncertainties. All statements
Table Of Contents. Table Of Contents. OAK ASSOCIATES, ltd.
 Table Of Contents Table Of Contents Tables A: Scenarios 1 B & C: S&P Earnings Forecasts 2 D & E: Top 12 & Bottom 12 3 F: S&P Industry Overweights 4 G: S&P Industry Underweights H: S&P Industry Performance
Boston Pizza Royalties Income Fund TSX : BPF.UN Investor Presentation February 14, 2019
 Boston Pizza Royalties Income Fund TSX : BPF.UN Investor Presentation February 14, 2019 Forward Looking Information Certain information in this presentation may constitute forward looking information"
2015: FINALLY, A STRONG YEAR
 2015: FINALLY, A STRONG YEAR A Cushman & Wakefield Research Publication U.S. GDP GROWTH IS ACCELERATING 4% 3.5% Percent Change Annual Rate 2% 0% -2% -4% -5.4% -0.5% 1.3% 3.9% 1.7% 3.9% 2.7% 2.5% -1.5%
 Page 1 of 7 Release Yum! Brands Inc. Announces 2011 EPS Growth of 7%, Or $0.63 Per Share, Excluding Special Items; Driven by Outstanding China and Emerging Market Performance LOUISVILLE, Ky., Apr 20, 2011
The Economic Impact Of Travel on Massachusetts Counties 2015
 The Economic Impact Of Travel on Massachusetts Counties 2015 A Study Prepared for the Massachusetts Office of Travel and Tourism By the Research Department of the U.S. Travel Association Washington, D.C.
Early View CPG Off to a Slow Start, but What s Next?
 Early View 2017 CPG Off to a Slow Start, but What s Next? May 2017 Executive Summary January and February are typically softer months for CPG and edibles, but 2017 is showing sharper-than-normal declines.
The Multiple Mystery: At what P/E should the market trade?
 October 1, 2009 United States: Portfolio Strategy US Equity Views The Multiple Mystery: At what P/E should the market trade? Investor focus has shifted from earnings to valuation. We are now most often
Keith Siegner Vice President, Investor Relations, Corporate Strategy and Treasurer. % Change. Same-Store Sales
 Yum! Brands Reports Second-Quarter GAAP Operating Profit Growth of 1%; Delivered Second-Quarter Core Operating Profit Growth of 19%; Maintains Full-Year Core Operating Profit Growth Guidance Louisville,