Sphera Franchise Group. Interim results: Jan-Sep 2018
|
|
|
- Myles George
- 5 years ago
- Views:
Transcription


1 Sphera Franchise Group Interim results: Jan-Sep 1
2 Disclaimer This presentation is not, and nothing in it should be construed as, an offer, invitation or recommendation in respect of shares issued by Sphera Franchise Group SA ("Sphera"), or an offer, invitation or recommendation to sell, or a solicitation of an offer to buy shares in Sphera. Neither this presentation nor anything in it shall form the basis of any contract or commitment. This presentation is not intended to be relied upon as advice or recommendation to investors or potential investors and does not take into account the investment objectives, financial situation or needs of any investor. All investors should consider this presentation in consultation with a professional advisor of their choosing when deciding if an investment is appropriate. Sphera has prepared this presentation based on information available to it, including in-formation derived from public sources that have not been independently verified. No representation or warranty, express or implied, is provided in relation to the fairness, accuracy, correctness, completeness or reliability of the information, opinions or conclusions ex-pressed herein. This presentation should not be considered a comprehensive representation of Sphera's business, financial performance or results. This presentation may contain forward-looking statements. These statements reflect Sphera s current knowledge and its expectations and projections about future events and may be identified by the context of such statements or words such as anticipate, believe, estimate, expect, intend, plan, project, target, may, will, would, could or should or similar terminology. Sphera undertakes no obligation to update or revise these forward looking statements to reflect events or circumstances that arise after the date made or to reflect the occurrence of unanticipated events. Inevitably, some assumptions may not materialize, and un-anticipated events and circumstances may affect the ultimate financial results. Projections are inherently subject to substantial and numerous uncertainties and to a wide variety of significant business, economic and competitive risks. Therefore, the final results achieved may vary significantly from the forecasts, and the variations may be material. 2
 continued strong growth from KFC, increasing contributions from KFC Italy and Taco Bell Total store openings: 13 (8x KFC, 4x PHD, 1x TB) in 9-mth, of which 5 in Q3 An additional 5 stores opened")
3 Sphera Q3 / 9-mth key events All-store sales up 23.4% with same-store sales growth of 8.6% (Q3: overall +26.6%, same-store +9.6%) continued strong growth from KFC, increasing contributions from KFC Italy and Taco Bell Total store openings: 13 (8x KFC, 4x PHD, 1x TB) in 9-mth, of which 5 in Q3 An additional 5 stores opened so far in Q4- (1x KFC, 2x Pizza Hut Delivery, 1x Taco Bell) Network size: 30-Sep-, 15-Nov- store opening target expected to be in plan Strong Operational performance with all brands performing well in league tables measuring operational metrics and customer feedback KFC delivery services extended in Bucharest and Cluj; now operating 12 stores in Bucharest covering 70% of the city, with growing contribution to sales Pizza Hut Dine-In new menu rolled out in all restaurants, supported by strong marketing campaign with TV coverage resulting in significant bounce back of sales by high single-digit growth CSR activities ongoing including team spending time supporting SOS villages Interim results* Jan-Sep Q3- RONm Y/Y* Margin RONm Y/Y* Margin Sales % % Restaurant profit 74.6 (0.1)% 13.5% % 13.9% Normalized EBITDA 53.3 (7.4)% 9.7% % 10.4% EBITDA 52.4 (9.1)% 9.5% % 10.4% Net Profit 32.4 (22.7)% 5.9% % 6.8% *) Comparison between H1- consolidated results and H1- pro forma results. 3
4 Macro environment becomes increasingly challenging Retail sales have cooled down notably amid rampant inflation 6% 5% 4% 3% 2% 1% 0% -1% -2% -3% Annualized CPI -4% Jan-15 Jan-16 Jan-17 Jan-18 CPI has eased a bit from the 5.4% peak in June, but inflationary stimuli remain in place 30% 25% 20% 15% 10% 5% Annualized average and minimum gross salaries (Y/Y% growth rates) Average gross salary Minimum gross salary 0% Jan-15 Jan-16 Jan-17 Jan-18 Salary pressure expected to remain high, with another 9.5% hike in the minimum salary to be enforced in Dec-18 Retail sales (mainly food & drinks) - Y/Y% 50% 45% 40% 35% 30% 25% 20% 15% 10% 5% 0% Jan-15 Jan-16 Jan-17 Jan-18 Retail sales Y/Y growth improved marginally in Q3 vs Q2 Unemployment rate 8% 7% 6% 5% 4% 3% 2% 1% 0% Jan-15 Jan-16 Jan-17 Jan-18 Unemployment rate hit a minimum record of 4.1% in Sep-18 4
5 Sales performance by brands
 contributed 10.")

6 Brand performance: KFC Romania Sales growth analysis All-store performance All-store sales growth of 20.9% Y/Y in 9-mth supported mainly by same-store growth of 10.5%; In Q3, all-store sales advanced 20.4%, with samestore sales improving by 11.4%; The 9 net openings (since Jan-) contributed 10.7pp to the Y/Y growth in 9-mth, with all but two in cities with existing KFC stores; 30% 25% 20% 15% 10% 5% 0% 26.4% 17.7% 18.0% 2016 Q1 20.6% 18.8% Q2 Q3 14.0% Q4 19.6% 20.1% 20.4% Q1 Q2 Q3 Same-store performance Same-store sales growth of 10.5% Y/Y in 9-mth on the back of continued strong performance from the Drive-Thru format, as well as a better performance of the restaurants located outside Bucharest; Average ticket was up 9.9% and transactions were up 0.6% in 9-mth vs 9-mth ; 18% 16% 14% 12% 10% 8% 6% 17.0% 12.5% 10.7% 15.6% 14.0% 9.9% 11.8% 8.5% 11.4% 4% 2% 0% 2016 Q1 Q2 Q3 Q4 Q1 Q2 Q3 6
7 Brand performance: Pizza Hut Sales growth analysis All-store performance All-store sales growth of 9.9% Y/Y in H1, with virtually all growth being contributed by the 9 stores opened starting Jan- (of which 7 in existing cities); In Q3, all store sales advanced 11.4% Y/Y, while same-store sales improved 1.1% 30% 25% 20% 15% 10% 28.0% 15.5% 16.8% 16.6% 14.9% 14.1% 9.8% 8.4% 11.4% 5% 0% 2016 Q1 Q2 Q3 Q4 Q1 Q2 Q3 14% 13.0% Same-store performance Same-store sales grew 0.2% Y/Y in 9-mth, helped by improved performance of the Dine-In format, while Delivery lost ground after the opening of another two units in cities with existing delivery stores; Average ticket was up 8.2% and transactions were down 7.4% in 9-mth vs 9-mth ; 12% 10% 8% 6% 4% 2% 0% 3.1% 1.4% 5.6% 5.4% 0.6% 1.6% 1.1% -2% -4% 2016 Q1 Q2 Q3 Q4 Q1-2.0% Q2 Q3 7
8 Development


")


 Of which 3 stores")
9 Development Restaurant openings in Total stores BoY Openings 9-mth Total stores end-q3 QTD (1) Openings Total YTD (2) Initial Plan (2) Total Expected YE (2) (1) As at 15-Nov-. (2) Of which 3 stores were part of the plan. 9

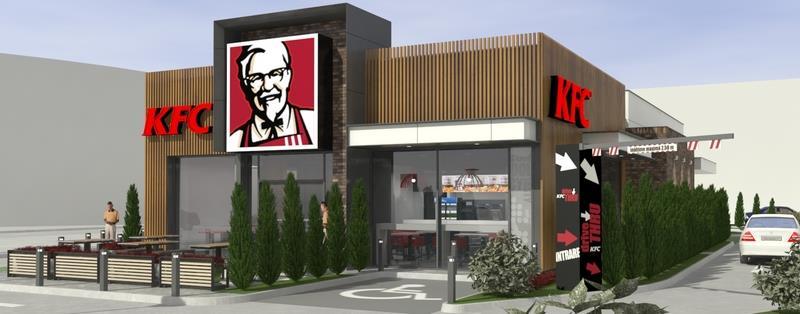
10 KFC Italy Padova 10


11 Pizza Hut Delivery Brasov 11

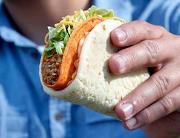
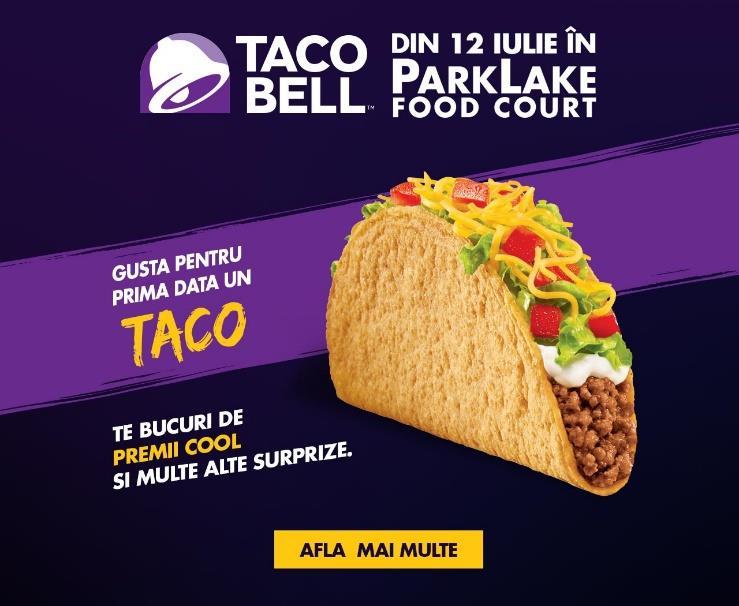
12 TB Bucharest Park Lake 12
13 Brand news


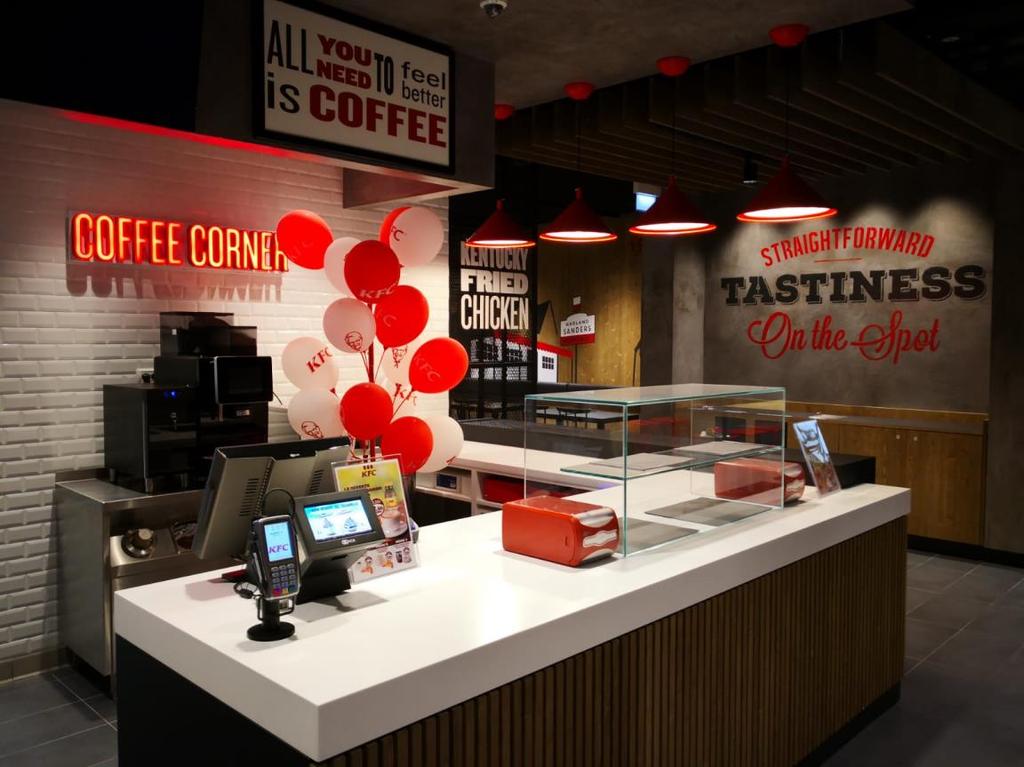
14 Brand news Q3- highlights KFC focused on building innovation for the summer and created new occasions to visit for our customers, successfully launching new recipes for a Teriyaki-inspired product platform maintaining strong double digit same-store sales growth Disruptive value was communicated for the back-to-school period by launching a new recipe for Booster with an entry price point of 5 lei, maintaining a similar level of transactions compared to LY while increasing same-store sales Continuous activities to build KFC as a digital brand by launching a social entertainment channel in July, a platform where people come for entertainment and where KFC feeds them relevant content; Social Me was the name of the first content series that was shaped as a brand manifesto and became a phenomenon in the digital space with over 7 million views Click to run Garlic sauce in retail Successful September test launch of our famous garlic sauce in Lidl in a 325 g bottle Volume forecasted by the retailer for a one-month campaign was sold out in one week Discussions with various retailers to launch the sauce as a permanent product in 2019 Self-ordering kiosks & digital menu boards Pilot kiosks were implemented in three stores Positive feedback from clients and 80% of eat-in and take-away orders done through the kiosk Roll-out of digital menuboards completed in 21 stores 14


15 Brand news SOCIAL ME - Campaign results +37.8m impressions delivered +7.4m views registered to date +3.5m engagements generated Click to run +67 ads promoted m sec of content viewed = 4.4 years in real life Best practice at Instagram Summer School (on IGTV) 15

16 Brand news Q3- highlights Pizza Hut launched a national promotion in Q3 that offered prizes with the purchase of a Flatbread pizza with the aim of increasing transactions through attracting new users and bringing back lapsed clients; the decreasing transaction trend went through a slow down over the summer; Successfully launched the Pizza Hut re-positioning in Q3 through a 360 communication campaign to announce the new menu designed by chef Nico Lontras and the improved brand attributes; customer feedback was positive and same-store sales growth was high single-digit in September with positive transaction growth for the first time this year Pizza Hut Delivery launched the same innovation campaign for the summer, Flatbread and was present on TV with a tail on the brand commercial, enjoying a high sales mix of the product; due to new store openings and cannibalization of existing trade areas, same-store sales took a negative turn Overall online orders exceeding 34% of delivery sales with mobile app contributing with one-third Taco bell continued to build brand equity and sales by opening its third store in the market and recruited new fans through its online platform Proud supporters of beginners Q3 awards: 1 st place for best use of photography in Webstock for Pizza Hut Replate Waste ; 2 nd place for innovation in Webstock for KFC Studycoin 2 nd place for best use of video in Webstock for Social Me ; 2 nd place in Webstock for the KFC Instagram account *Webstock is the biggest social media festival in Romania 16


17 Marketing Q3- campaigns 17
18 Financials
19 Pro forma financials Note: Jan-Sep pro forma results are identical to consolidated results Jan-Sep pro forma results include ARS performance for the full period Jan-Sep consolidated results do not include ARS performance for Jan-May period
20 Financial performance: Q3- Statement of comprehensive income Pro forma sales up 26.6% Y/Y on strong performance from KFC Romania/Moldova (+20.4% Y/Y) and Pizza Hut (+11.4% Y/Y) and increasing contributions from the new businesses (KFC Italy and Taco Bell); Restaurant operating profit up 17.3% Y/Y, with margin down 1.1pp, especially on food, advertising and other operating expenses, while cost of labour improved; G&A expenses up 43.5% Y/Y, reaching 6.2% of sales the lowest level since Q3-; EBITDA up 9.4% Y/Y while EBITDA margin contracted 1.6pp to 10.4% of sales, virtually due to higher restaurant expenses; excluding KFC Italy and Taco Bell, EBITDA would have been up 13.2% Y/Y (11.9% of sales) Net profit up 0.5% lower Y/Y, with net profit margin down 1.8pp to 6.8% of sales. Y/Y% % din Vanzari Data in RON'000 Q3- Q3- / Q3- Q3- Δ% Restaurant sales 201, , % Restaurant expenses 173, , % 86.1% 85.0% 1.1% Food and material 71,829 56, % 35.6% 35.3% 0.4% Payroll and employee benefits 40,981 33, % 20.3% 20.9% -0.5% Rent 14,453 11, % 7.2% 7.2% 0.0% Royalties 11,846 8, % 5.9% 5.6% 0.3% Advertising 12,235 9, % 6.1% 5.7% 0.4% Other operating expenses, net 16,981 12, % 8.4% 8.0% 0.4% Depreciation and amortization 5,166 3, % 2.6% 2.4% 0.2% Restaurant operating profit 28,003 23, % 13.9% 15.0% -1.1% General and administration expenses, net 12,424 8, % 6.2% 5.4% 0.7% Operating profit 15,579 15, % 7.7% 9.6% -1.8% Finance costs % 0.5% 0.4% 0.0% Finance income (30) % 0.0% 0.0% 0.0% Profit before tax 14,638 14, % 7.3% 9.1% -1.9% Income tax expense % 0.5% 0.6% -0.1% Profit for the period 13,649 13, % 6.8% 8.5% -1.8% EBITDA 21,011 19, % 10.4% 12.1% -1.6% Normalised EBITDA 21,026 19, % 10.4% 12.1% -1.6% 20
21 Financial performance: Q3- Quarterly trends in key indicators Net sales Restaurant operating profit 22.5% 20.8% 26.6% 22.5% 21.6% 23.4% 24.6% 15.3% 11.4% 13.9% 15.3% 13.3% 13.5% 15.1% Q1 Q2 Q3 Q1 Q2 Q3 Target FY Quarter YTD Q1 Q2 Q3 Q1 Q2 Q3 Target FY Quarter YTD 7.3% 7.2% G&A expense 7.3% 7.2% 7.1% 11.1% Normalised EBITDA 11.1% 10.4% 9.2% 9.7% 11.2% 6.8% 7.5% 6.2% Q1 Q2 Q3 Q1 Q2 Q3 Target FY Quarter YTD Q1 Q2 Q3 Q1 Q2 Q3 Target FY Quarter YTD 21
22 Financial performance: Jan-Sep (Consolidated) vs Jan-Sep (Pro-forma) Statement of comprehensive income Pro forma sales up 23.4% Y/Y on strong performance from KFC Romania/Moldova (+20.7% Y/Y) and Pizza Hut (+9.9% Y/Y) and increasing contributions from the new businesses (KFC Italy and Taco Bell); Restaurant operating profit down 0.1% Y/Y, with margin down 3.2pp, especially on food and salary costs, as well as impact from new openings and new areas of business; G&A expenses up 30.5% Y/Y, reaching 6.8% of sales; Normalized EBITDA* fell 7.4% Y/Y and normalized EBITDA margin contracted 3.2pp to 9.7% of sales, virtually due to higher restaurant expenses; EBITDA fell 9.1% Y/Y and EBITDA margin contracted 3.4pp to 9.5% of sales, virtually due to higher restaurant expenses; Net profit was 22.7% lower Y/Y and net profit margin fell by 3.5pp to 5.9% of sales. Y/Y% % of Sales Data in RON'000 Sep-18 Sep-17 / Sep-18 Sep-17 Δ% Restaurant sales 551, , % Restaurant expenses 476, , % 86.5% 83.3% 3.2% Food and material 197, , % 35.8% 35.0% 0.7% Payroll and employee benefits 113,731 88, % 20.6% 19.8% 0.8% Rent 40,014 32, % 7.3% 7.2% 0.0% Royalties 32,497 25, % 5.9% 5.7% 0.2% Advertising 30,421 23, % 5.5% 5.2% 0.3% Other operating expenses, net 48,378 35, % 8.8% 7.9% 0.8% Depreciation and amortization 14,742 10, % 2.7% 2.3% 0.3% Restaurant operating profit 74,568 74, % 13.5% 16.7% -3.2% General and administration expenses, net 37,661 28, % 6.8% 6.5% 0.4% Operating profit 36,907 45, % 6.7% 10.3% -3.6% Finance costs 2,071 1, % 0.4% 0.3% 0.1% Finance income % 0.0% 0.0% 0.0% Profit before tax 34,955 44, % 6.3% 10.0% -3.6% Income tax expense 2,549 2, % 0.5% 0.6% -0.1% Profit for the period 32,406 41, % 5.9% 9.4% -3.5% EBITDA 52,394 57, % 9.5% 12.9% -3.4% Normalised EBITDA* 53,340 57, % 9.7% 12.9% -3.2% *) Excluding a non-recurring cost for litigation worth RON 0.95m. 22
 vs Jan-Sep (Pro-forma) Breakdown of results by Group companies Data in RON'000 USFN (RO) ARS USFN (MD) USFN (IT) CFF SFG Cons.Adj SFG Cons.")
 40,014 Royalties 25,470 5,173 410")
 64 18,789 (17,576) 74,568 General and administration expenses, net 22,366 7,700 201 2,839 1,942 20,190 (17,576) 37,661 Operating")
23 Sphera USFN (RO) USFN (MD) USFN (IT) ARS CFF Cons.Adj Sphera USFN (RO) USFN (MD) USFN (IT) ARS CFF Cons.Adj Financial performance: Jan-Sep (Consolidated) vs Jan-Sep (Pro-forma) Breakdown of results by Group companies Data in RON'000 USFN (RO) ARS USFN (MD) USFN (IT) CFF SFG Cons.Adj SFG Cons. Restaurant sales 424,966 89,210 6,843 21,394 8,054 18,789 (17,693) 551,562 Dividend revenue ,798 (61,798) 0 Restaurant expenses 354,726 86,016 5,868 22,510 7,990 0 (117) 476,993 Food and material 159,752 24,583 2,878 6,807 3, ,211 Payroll and employee benefits 77,684 26,262 1,074 6,658 2, ,731 Rent 29,301 7, , (2) 40,014 Royalties 25,470 5, , ,497 Advertising 20,824 7, , (61) 30,421 Other operating expenses, net 32,085 11, , (54) 48,378 Depreciation and amortization 9,611 3, , ,742 Restaurant operating profit 70,240 3, (1,116) 64 18,789 (17,576) 74,568 General and administration expenses, net 22,366 7, ,839 1,942 20,190 (17,576) 37,661 Operating profit 47,874 (4,506) 773 (3,955) (1,879) (1,401) 0 36,907 Finance costs 1, (1,610) 2,071 Finance income 1, (1,610) 118 Profit before tax 47,888 (5,131) 759 (4,636) (2,220) (1,706) 0 34,955 Income tax expense 2,230 1, (1,038) ,549 Profit for the period 45,659 (6,251) 625 (3,597) (2,297) (1,732) 0 32,406 EBITDA 57,749 (799) 1,036 (2,945) (1,467) (1,181) 0 52,394 Normalised EBITDA* 58,696 (799) 1,036 (2,945) (1,467) (1,181) 0 53,340 Y/Y Sales growth by companies Contribution to Sales growth by companies Contribution to EBITDA by companies 25.0% 20.0% 23.4% 20.9% 25.0% 20.0% 23.4% 16.4% 15.0% 10.0% 11.6% 9.9% 15.0% 10.0% 5.0% 5.0% 2.9% 1.8% 1.8% 0.3% 0.0% 0.0% 0.2% 23


24 Financial performance: Jan-Sep (Consolidated) vs Jan-Sep (Pro-forma) Restaurant operating expenses and margin Y/Y% % of Sales Data in RON'000 Sep-18 Sep-17 / Sep-18 Sep-17 Δ% Restaurant expenses 476, , % 86.5% 83.3% 3.2% Food and material 197, , % 35.8% 35.0% 0.7% Payroll and employee benefits 113,731 88, % 20.6% 19.8% 0.8% Rent 40,014 32, % 7.3% 7.2% 0.0% Royalties 32,497 25, % 5.9% 5.7% 0.2% Advertising 30,421 23, % 5.5% 5.2% 0.3% Other operating expenses, net 48,378 35, % 8.8% 7.9% 0.8% Depreciation and amortization 14,742 10, % 2.7% 2.3% 0.3% Restaurant operating profit 74,568 74, % 13.5% 16.7% -3.2% Contribution to change in restaurant opex ratio Operational expenses increased 28.1% Y/Y to RON 477.0m in 9-mth, reaching 86.5% of sales; As percentage of sales, operational expenses increased by 3.2pp Y/Y to 86.5% in 9-mth, of which: +0.8pp from payroll expenses +0.8pp from other operating expenses +0.7pp from cost of food and materials Contribution to change in restaurant profit 24

25 Financial performance: Jan-Sep (Consolidated) vs Jan-Sep (Pro-forma) G&A expenses Y/Y% % of Sales Data in RON'000 Sep-18 Sep-17 / Sep-18 Sep-17 General and administration expenses (net), of w hich: 37,661 28, % 6.8% 6.5% Payroll and employee benefits 21,496 11, % Third-party services 5,200 8, % Depreciation and amortization 745 1, % Rent 2,566 1, % Banking charges 2,004 1, % Transport 1,985 1, % Other expenses 3,664 2, % Contribution to growth in G&A expense General and administration expenses increased 30.5% Y/Y to RON 37.7 million in 9-mth (6.8% of sales, up from 6.5% in 9-mth ) G&A ratio stood at 6.2% of sales in Q3- compared to 5.4% in Q3-. Note: Other expenses include a non-recurring cost for litigation worth RON 0.95m. 25
26 Consolidated financials
27 Sphera Consolidated financial performance Statement of comprehensive income Consolidated sales up 37.4% Y/Y on strong performance from KFC Romania (+20.9% Y/Y), while the consolidation of ARS (Pizza Hut restaurants), starting with June, contributed 13.4pp in the consolidated sales growth rate; Restaurant operating profit up 8.7% Y/Y, with margin down 3.6pp, especially on salary costs and impact from new openings and new areas of business; G&A expenses up 53.8% Y/Y, up 0.7pp to 6.8% of sales, driven mainly by the consolidation of ARS and the KFC Italy and Taco Bell operations; Normalized EBITDA fell 1.2% Y/Y and normalized EBITDA margin contracted 3.8pp to 9.7%, mainly due to higher restaurant expenses; EBITDA fell 3.0%% Y/Y and EBITDA margin contracted 4.0pp to 9.5%, mainly due to higher restaurant expenses; Net profit was 20.9% lower Y/Y and net profit margin fell by 4.3pp to 5.9%. Y/Y% % of Sales Data in RON'000 Sep-18 Sep-17 / Sep-18 Sep-17 Δ% Restaurant sales 551, , % Restaurant expenses 476, , % 86.5% 82.9% 3.6% Food and material 197, , % 35.8% 35.9% -0.1% Payroll and employee benefits 113,731 76, % 20.6% 19.1% 1.5% Rent 40,014 28, % 7.3% 7.1% 0.2% Royalties 32,497 22, % 5.9% 5.7% 0.2% Advertising 30,421 20, % 5.5% 5.2% 0.3% Other operating expenses, net 48,378 31, % 8.8% 7.8% 1.0% Depreciation and amortization 14,742 8, % 2.7% 2.1% 0.5% Restaurant operating profit 74,568 68, % 13.5% 17.1% -3.6% General and administration expenses, net 37,661 24, % 6.8% 6.1% 0.7% Operating profit 36,907 44, % 6.7% 11.0% -4.3% Finance costs 2,071 1, % 0.4% 0.3% 0.1% Finance income % 0.0% 0.0% 0.0% Profit before tax 34,955 43, % 6.3% 10.7% -4.4% Income tax expense 2,549 2, % 0.5% 0.5% -0.1% Profit for the period 32,406 40, % 5.9% 10.2% -4.3% EBITDA 52,394 53, % 9.5% 13.5% -4.0% Normalised EBITDA 53,340 53, % 9.7% 13.5% -3.8% *) Excluding a non-recurring cost for litigation worth RON 0.95m. 27
28 Sphera Consolidated financial performance Statement of financial position Data in RON' Sep Dec-17 Data in RON' Sep Dec-17 Assets Equity and liabilities Non-current assets 212, ,123 Total equity 136, ,544 Property, plant and equipment 136, ,220 Equity attributable to equity holders of the parent 136, ,525 Intangible assets 68,506 67,471 Issued capital 581, ,990 Deposits for rent guarantee 4,434 1,288 Share premium (520,578) (520,578) Deferred tax assets 3,144 2,144 Retained earnings 75,471 43,191 Foreign currency translation reserve (16) (78) Current assets 90,425 73,291 Non-controlling interests Inventories 8,781 8,509 Trade and other receivables 11,816 8,454 Non-current liabilities 62,305 42,191 Prepayments 4,227 3,673 Interest-bearing loans and borrowings 57,615 39,520 Cash and short-term deposits 65,601 52,655 Trade and other payables 4,690 2,671 Assets held for sale Current liabilities 103, ,874 Trade and other payables 68,588 77,682 Total assets 302, ,609 Interest-bearing loans and borrowings 34,818 25,192 Total liabilities 165, ,065 Total equity and liabilities 302, ,609 28
Sphera Franchise Group. Interim results: Jan-Sep 2017
 Sphera Franchise Group Interim results: Jan-Sep 2017 1 Disclaimer This presentation is not, and nothing in it should be construed as, an offer, invitation or recommendation in respect of shares issued
Interim Financial Report For the nine-month period ended 30 September 2018 (Q3-2018)
") Interim Financial Report For the nine-month period ended 30 September 2018 (Q3-2018) Report date: Name of the issuing entity: Statutory seat: Visiting address: 15-Nov-2018 Sphera Franchise Group SA Bucharest,
Interim Financial Report For the nine-month period ended 30 September 2018 (Q3-2018) Report date: Name of the issuing entity: Statutory seat: Visiting address: 15-Nov-2018 Sphera Franchise Group SA Bucharest,
Conference Call Presentation for 2016 Preliminary Unaudited Consolidated Annual Financial Results
 Conference Call Presentation for 2016 Preliminary Unaudited Consolidated Annual Financial Results LEGAL DISCLAIMER This presentation is not, and nothing in it should be construed as, an offer, invitation
Sphera Franchise Group S.A. Intention to Float Announcement
 NOT FOR RELEASE, PUBLICATION OR DISTRIBUTION, IN WHOLE OR IN PART, DIRECTLY OR INDIRECTLY, IN OR INTO OR WITHIN THE UNITED STATES OF AMERICA, AUSTRALIA, CANADA, JAPAN, SOUTH AFRICA OR ANY OTHER JURISDICTION
Yum China Reports First Quarter 2018 Results. May 1, :30 PM ET
 Yum China Reports First Quarter 2018 Results May 1, 2018 4:30 PM ET SHANGHAI, May 1, 2018 /PRNewswire/ -- Yum China Holdings, Inc. (the "Company" or "Yum China") (NYSE: YUMC) today reported unaudited results
4Q and Full Year 2016 Earnings Presentation. February 8, 2017
 4Q and Full Year 2016 Earnings Presentation February 8, 2017 Cautionary Language Regarding Forward-Looking Statements & Non-GAAP Measures This presentation contains forward-looking statements within the
Q Results presentation
 Q1 2016 Results presentation 12 May 2016 1 Disclaimer This presentation (the "Presentation") has been prepared and is issued by, and is the sole responsibility of Telepizza Group, S.A. ( Telepizza" or
Fourth Quarter & Full Year 2017 Results Presentation. February 8, 2018
 Fourth Quarter & Full Year 2017 Results Presentation February 8, 2018 1 Cautionary Statement on Forward-Looking Statements & Non-GAAP Measures This presentation contains forward-looking statements within
Page 1/12. Yum China Reports Fourth Quarter and Full Year 2017 Results. February 7, :30 PM ET
 Yum China Reports Fourth Quarter and Full Year 2017 Results February 7, 2018 4:30 PM ET SHANGHAI, Feb. 7, 2018 /PRNewswire/ -- (the "Company" or "Yum China") (NYSE: YUMC) today reported unaudited results
MANAGEMENT S DISCUSSION AND ANALYSIS OF FINANCIAL CONDITION AND RESULTS OF OPERATIONS
 MANAGEMENT S DISCUSSION AND ANALYSIS OF FINANCIAL CONDITION AND RESULTS OF OPERATIONS Unless otherwise noted, the section references to (i) us, our, we, the Company and YUM refer to YUM Brands, Inc. and
MANAGEMENT S DISCUSSION AND ANALYSIS OF FINANCIAL CONDITION AND RESULTS OF OPERATIONS
 MANAGEMENT S DISCUSSION AND ANALYSIS OF FINANCIAL CONDITION AND RESULTS OF OPERATIONS Unless otherwise noted, the section references to (i) us, our, we, the Company and YUM refer to YUM Brands, Inc. and
DP Eurasia N.V. Interim Results for the Period ended 30 June 2017
 DP Eurasia N.V. Interim Results for the Period ended 30 June 2017 Disclaimer This Presentation is not an offer to buy or sell any securities. Save where otherwise indicated, the Company is the source of
Jacky Lo Chief Finance Officer, Yum China
 Jacky Lo Chief Finance Officer, Yum China Cautionary Language Regarding Forward-Looking Statements Forward-Looking Statements. Our presentation may contain forward-looking statements within the meaning
Ziggo N.V. Q Results. October 19, 2012
 Ziggo N.V. Q3 2012 Results October 19, 2012 Disclaimer This document does not constitute or form a part of any offer or solicitation to purchase or subscribe for securities in the United States or any
W W E Q 4 A N D F U L L Y E A R R E S U LT S F E B R U A R Y 8,
 W W E Q 4 A N D F U L L Y E A R 2 0 7 R E S U LT S F E B R U A R Y 8, 2 0 8 Forward-Looking Statements This presentation contains forward-looking statements pursuant to the safe harbor provisions of the
ANNUAL REPORT Excellence in all we do!
 ANNUAL REPORT 2017 Excellence in all we do! REPORTS AND FINANCIAL STATEMENTS All amounts are presented in RON thousand, unless specified otherwise. CONSOLIDATED DIRECTORS REPORT CORPORATE INFORMATION
Micky Pant CEO, Yum China
 Micky Pant CEO, Yum China Cautionary Language Regarding Forward-Looking Statements Forward-Looking Statements. Our presentation may contain forward-looking statements within the meaning of Section 27A
[Insert Subheading] Click to edit Master text styles. Shop Direct Limited. Q1 FY18 Results. Three months ended 30 September 2017.
![[Insert Subheading] Click to edit Master text styles. Shop Direct Limited. Q1 FY18 Results. Three months ended 30 September 2017.](/thumbs/75/71763350.jpg "[Insert Subheading] Click to edit Master text styles. Shop Direct Limited. Q1 FY18 Results. Three months ended 30 September 2017.") [Insert Subheading] Click to edit Master text styles Shop Direct Limited Q1 FY18 Results Three months ended 30 September 2017 7 December 2017 1 Disclaimer This presentation (the Presentation ) has been
[Insert Subheading] Click to edit Master text styles Shop Direct Limited Q1 FY18 Results Three months ended 30 September 2017 7 December 2017 1 Disclaimer This presentation (the Presentation ) has been
Q Financial Results. May 4, 2017
 Q1 2017 Financial Results May 4, 2017 Safe Harbor The information made available in this presentation contains forward-looking statements which reflect the Company s current view of future events, results
Q results. Analyst & investor presentation. November 21, 2017
 Q3 2017 results Analyst & investor presentation November 21, 2017 Q3 2017 Development at a Glance: Fully on Track 18 new units opened year to date (Q3 6 openings) and pipeline fully secured Strong growth
2018 Liberty Investor Meeting
 2018 Liberty Investor Meeting Steve Kaufer, CEO and President November 14, 2018 Forward-Looking Statements. Our presentation today, including the slides contained herein, contains "forward-looking statements"
Del Taco Restaurants, Inc. Reports Fiscal Fourth Quarter and Fiscal Year 2017 Financial Results
 NEWS RELEASE Del Taco Restaurants, Inc. Reports Fiscal Fourth Quarter and Fiscal Year 2017 Financial Results 3/14/2018 System-wide comparable restaurant sales growth of 2.4% in Fiscal Fourth Quarter Announces
Foxtons Interim results presentation For the period ended June 2017
 Foxtons Interim results presentation For the period ended June 2017 Important information This presentation includes statements that are, or may be deemed to be, forward-looking statements. These forward-looking
UNITED STATES SECURITIES AND EXCHANGE COMMISSION WASHINGTON, D.C FORM 8-K
 UNITED STATES SECURITIES AND EXCHANGE COMMISSION WASHINGTON, D.C. 20549 FORM 8-K CURRENT REPORT Pursuant to Section 13 or 15(d) of the Securities Exchange Act of 1934 Date of Report (Date of earliest event
Del Taco Restaurants, Inc. (Exact name of registrant as specified in its charter)
") UNITED STATES SECURITIES AND EXCHANGE COMMISSION WASHINGTON, DC 20549 FORM 8-K CURRENT REPORT Pursuant to Section 13 or 15(d) of the Securities Exchange Act of 1934 Date of Report (Date of earliest event
UNITED STATES SECURITIES AND EXCHANGE COMMISSION WASHINGTON, DC 20549 FORM 8-K CURRENT REPORT Pursuant to Section 13 or 15(d) of the Securities Exchange Act of 1934 Date of Report (Date of earliest event
Sea Limited Reports Fourth Quarter and Full Year 2017 Results
 Sea Limited Reports Fourth Quarter and Full Year 2017 Results Singapore, 28 February 2018 Sea Limited (NYSE: SE) ( Sea or the Company ) today announced its financial results for the fourth quarter and
September Quarter 2017 Results
 September Quarter 2017 Results November 2, 2017 Disclaimer This presentation contains forward-looking statements. These statements are made under the safe harbor provisions of the U.S. Private Securities
Earnings Call Presentation Q3 2018
 Earnings Call Presentation Q3 2018 Forward Looking Statements This presentation and the accompanying oral presentation contain forward-looking statements that are based on our management s beliefs and
Q Results Presentation
 Q3 2017 Results Presentation September 2017 November 2, 2017 Copyright 2017 AutoWeb, Inc. 2 Safe Harbor Statement and Non-GAAP Disclosures The statements made in the accompanying conference call or contained
Donny Lau Senior Director, Investor Relations & Corporate Strategy
 NEWS Donny Lau Senior Director, Investor Relations & Corporate Strategy Yum! Brands Reports Second-Quarter GAAP Operating Profit Growth of 32%; Delivered Core Operating Profit Growth of 7%; Raises Full-Year
Investors: Michael D. Neese VP, Investor Relations (804)
") NEWS RELEASE For Immediate Release August 17, 2016 Investors: Michael D. Neese VP, Investor Relations (804) 287-8126 michael.neese@pfgc.com Media: Joe Vagi Manager, Corporate Communications (804) 484-7737
NEWS RELEASE For Immediate Release August 17, 2016 Investors: Michael D. Neese VP, Investor Relations (804) 287-8126 michael.neese@pfgc.com Media: Joe Vagi Manager, Corporate Communications (804) 484-7737
Shutterfly Announces Fourth Quarter and Full Year 2017 Financial Results
 Shutterfly Announces Fourth Quarter and Full Year 2017 Financial Results January 30, 2018 REDWOOD CITY, Calif.--(BUSINESS WIRE)--Jan. 30, 2018-- (NASDAQ:SFLY), the leading online retailer and manufacturer
3Q 2Q 2016 RESULTS DISCUSSION
 3Q 2Q 2016 RESULTS DISCUSSION Disclaimer This presentation and the associated slides and discussion contain forward-looking statements. These statements are naturally subject to uncertainty and changes
3Q18 EARNINGS RELEASE. Earnings Release 3Q18 1 / 16
 EARNINGS RELEASE 3Q18 1 / 16 Monterrey, Mexico, October 25 th, 2018. Grupo Famsa, S.A.B. de C.V. (BMV: GFAMSA), a leading Mexican commercial conglomerate in the retail, consumer and savings sector, announced
Ziggo Q Results. October 14, 2011
 Ziggo Q3 2011 Results October 14, 2011 Disclaimer Various statements contained in this document constitute forward-looking statements as that term is defined by U.S. federal securities laws. Words like
An Exciting New Growth Platform
 Legal Disclaimer This presentation may contain written and oral statements that constitute forward-looking statements within the meaning of the Private Securities Litigation Reform Act of 1995, as amended.
2017 Interim Results. 14 September 2017
 2017 Interim Results 14 September 2017 1 Disclaimer NOT FOR PUBLICATION OR DISTRIBUTION IN WHOLE OR IN PART IN, INTO OR FROM ANY JURISDICTION WHERE TO DO SO WOULD CONSTITUTE A VIOLATION OF THE RELEVANT
1H 19 Investor Presentation February 2019
 1H 19 Investor Presentation February 2019 1 About Raiz Raiz (formerly Acorns) is a mobile first micro-investing platform via mobile phone or web app, which allows customers to invest in a portfolio of
AnaCap Financial Europe S.A. SICAV-RAIF
 AnaCap Financial Europe S.A. SICAV-RAIF Presentation of the consolidated financial results of AnaCap Financial Europe S.A. SICAV-RAIF for the nine months ended 30 September 2018 27 November 2018 Disclaimer
For personal use only
 Market Office Announcement ASX Limited Date: 9 November 2018 THINK CHILDCARE LIMITED ( TNK ) ACQUIRES 5 CHILDCARE CENTRES AND REDUCES YEAR ON YEAR OCCUPANCY GAP TO 0.5% TNK has contracted to acquire five
For personal use only. Beacon Lighting Group Limited RESULTS PRESENTATION F Y 20 14
 For personal use only Beacon Lighting Group Limited RESULTS PRESENTATION F Y 20 14 AGENDA 1. BACKGROUND 2. RESULTS OVERVIEW 3. TRADING PERFORMANCE 4. CASH FLOW, BALANCE SHEET, DIVIDEND 5. GROWTH STRATEGY
[Insert Subheading] Click to edit Master text styles. Shop Direct Limited. Q1 FY19 Results. Three months ended 30 September 2018.
![[Insert Subheading] Click to edit Master text styles. Shop Direct Limited. Q1 FY19 Results. Three months ended 30 September 2018.](/thumbs/88/117149975.jpg "[Insert Subheading] Click to edit Master text styles. Shop Direct Limited. Q1 FY19 Results. Three months ended 30 September 2018.") [Insert Subheading] Click to edit Master text styles Shop Direct Limited Q1 FY19 Results Three months ended 30 September 2018 22 November 2018 1 Disclaimer This presentation (the Presentation ) has been
[Insert Subheading] Click to edit Master text styles Shop Direct Limited Q1 FY19 Results Three months ended 30 September 2018 22 November 2018 1 Disclaimer This presentation (the Presentation ) has been
First Quarter 2018 Results for the period ending March 31, 2018
 First Quarter 2018 Results for the period ending March 31, 2018 TWM Consolidated April 30, 2018 Topics in This Report Revenue Analysis EBITDA Analysis Income Statement Analysis Cash Flow Analysis Balance
1Q 2018 FINANCIAL RESULTS MAY 9, 2018
 1Q 2018 FINANCIAL RESULTS MAY 9, 2018 Key market events during 1Q 2018 January 9 Romania Macroeconomic Outlook in 2018 - Debate with Financial-Banking Analysts, a debate focused on the macroeconomic outlook
ZILLOW GROUP, INC. Q EARNINGS PREPARED REMARKS. NOVEMBER 03, p.m. Pacific Time. RJ Jones, VP of Investor Relations:
 ZILLOW GROUP, INC. Q3 2015 EARNINGS PREPARED REMARKS NOVEMBER 03, 2015 -- 2 p.m. Pacific Time RJ Jones, VP of Investor Relations: Thank you. Good afternoon and welcome to Zillow Group s third quarter 2015
Autobytel Q Results Presentation. May 4, 2017
 Autobytel Q1 2017 Results Presentation May 4, 2017 Safe Harbor Statement and Non-GAAP Disclosures The statements made in the accompanying conference call or contained in this presentation that are not
Del Taco Restaurants, Inc. (Exact name of registrant as specified in its charter)
") UNITED STATES SECURITIES AND EXCHANGE COMMISSION WASHINGTON, DC 20549 FORM 8-K CURRENT REPORT Pursuant to Section 13 or 15(d) of the Securities Exchange Act of 1934 Date of Report (Date of earliest event
UNITED STATES SECURITIES AND EXCHANGE COMMISSION WASHINGTON, DC 20549 FORM 8-K CURRENT REPORT Pursuant to Section 13 or 15(d) of the Securities Exchange Act of 1934 Date of Report (Date of earliest event
Investor Presentation
 Investor Presentation (NASDAQ: TRIP) Q3 2012 Safe Harbor Statement Forward-Looking Statements. Our presentation today, including the slides contained herein, contains "forward-looking statements" within
Q Earnings Conference Call
 Q2 207 Earnings Conference Call July 25, 207 Christopher North, President and CEO Mike Pope, CFO Safe Harbor Disclaimer This presentation contains "forward-looking" statements within the meaning of Section
FORWARD-LOOKING STATEMENTS
 WWE Q4 AND FULL YEAR 208 RESULTS FEBRUARY 7, 209 FORWARD-LOOKING STATEMENTS This presentation contains forward-looking statements pursuant to the safe harbor provisions of the Securities Litigation Reform
FORWARD-LOOKING STATEMENTS
 WWE Q3 208 RESULTS OCTOBER 25, 208 FORWARD-LOOKING STATEMENTS This presentation contains forward-looking statements pursuant to the safe harbor provisions of the Securities Litigation Reform Act of 995,
Foxtons Preliminary results presentation For the year ended December 2018
 Foxtons Preliminary results presentation For the year ended December 2018 Important information This presentation includes statements that are, or may be deemed to be, forward-looking statements. These
Foxtons Interim results presentation For the period ended 30 June 2018
 Foxtons Interim results presentation For the period ended 30 June 2018 Important information This presentation includes statements that are, or may be deemed to be, forward-looking statements. These forward-looking
Companhia Brasileira de Distribuição
 (FreeTranslation into English from the Original Previously Issued in Portuguese) Companhia Brasileira de Distribuição Individual and Consolidated Interim Financial Information for the Quarter Ended and
For personal use only
 FY16 FULL YEAR RESULTS REVIEW Agenda GROUP RESULTS OVERVIEW BUSINESS UNIT REVIEW OUTLOOK Eastlands Shopping Centre BSA completed the mechanical services upgrade and extension to one 29/08/2016 BSA Limited
The leading European Entertainment network
 The leading European Entertainment network Agenda 1 2 3 4 2014 9 month 2014 highlights Group financials Business segments Outlook 2014 2 1 2 3 4 Significant progress made in digital o o One of the largest,
MANAGEMENT S DISCUSSION AND ANALYSIS OF FINANCIAL CONDITION AND RESULTS OF OPERATIONS
 MANAGEMENT S DISCUSSION AND ANALYSIS OF FINANCIAL CONDITION AND RESULTS OF OPERATIONS Unless otherwise noted, the section references to (i) us, our, we, the Company and YUM refer to YUM Brands, Inc. and
Click here to edit the name of your presentation. Fourth Quarter and Full Year Earnings Results
 Click here to edit the name of your presentation Fourth Quarter and Full Year 2016 Earnings Results 1 Safe Harbor Forward-Looking Statements This presentation contains forward-looking statements, within
W W E I N V E S T O R P R E S E N TAT I O N - J A N U A R Y
 W W E I N V E S T O R P R E S E N TAT I O N - J A N U A R Y 2 0 1 7 Forward-Looking Statements This presentation contains forward-looking statements pursuant to the safe harbor provisions of the Securities
R E S U LT S 1 ST Q U A R T E R M A Y
 BRD - GROUP R E S U LT S 1 ST Q U A R T E R 2 0 1 8 M A Y 2 0 1 8 DISCLAIMER The consolidated and separate financial position and income statement for the period ended March 31, 2018 were examined by the
Dealertrack Technologies Reports Record Revenue for Fourth Quarter and Full Year 2014
 Dealertrack Technologies Reports Record Revenue for Fourth Quarter and Full Year 2014 Page 1 MEDIA CONTACT: Alison von Puschendorf (877) 327-8422 x7366 alison.vonpuschendorf@dealertrack.com INVESTOR CONTACT:
H RESULTS PRESENTATION
 H1 2018 RESULTS PRESENTATION 03.09.2018 H1 2018 RESULTS PRESENTATION DISCLAIMER This presentation (the "Presentation") has been prepared and is issued by, and is the sole responsibility of Telepizza Group,
Q Earnings Conference Call
 Q1 2018 Earnings Conference Call May 1, 2018 Christopher North, President and CEO Mike Pope, CFO Safe Harbor Disclaimer This presentation contains "forward-looking" statements within the meaning of Section
Q EARNINGS PRESENTATION
 Q1 2014 EARNINGS PRESENTATION May 6, 2014 FORWARD LOOKING STATEMENTS AND OTHER IMPORTANT CAUTIONS Statements in this presentation which are not statements of historical fact, including but not limited
3M FY 2016/17 Financial results. 22 February
 3M FY 206/7 Financial results 22 February 207 0 Table of contents. Key Highlights 2. Financial Update Appendix Notice to recipients This presentation and any materials distributed in connection herewith
MAISONS DU MONDE: FIRST-HALF 2018 RESULTS
 PRESS RELEASE MAISONS DU MONDE: FIRST-HALF 2018 RESULTS A solid first half in a challenging environment Updated full-year 2018 targets Sales up 11% to 507m including Modani, and up 9.8% at constant scope
Full year results presentation Year ended 31 March June 2018
 Full year results presentation Year ended 31 March 2018 7 June 2018 Disclaimer Not for publication, transmission, distribution or release, directly or indirectly, in or into any jurisdiction in which the
Performance Food Group Company Reports Third-Quarter Fiscal 2016 Results: Provides Full-Year Fiscal 2016 Adjusted EBITDA Growth Outlook of 10% to 12%
 NEWS RELEASE For Immediate Release May 4, 2016 Investors: Michael D. Neese VP, Investor Relations (804) 287-8126 michael.neese@pfgc.com Media: Joe Vagi Manager, Corporate Communications (804) 484-7737
Earnings Presentation. October 27, 2011
 Q1 Fiscal Year 2012 Earnings Presentation & Financial Results Supplement October 27, 2011 Safe Harbor Statement This presentation contains statements about our future expectations, plans and prospects
O KEY GROUP ANNOUNCES AUDITED FINANCIAL RESULTS FOR FY2016
 Press Release 30 March 2017 O KEY GROUP ANNOUNCES AUDITED FINANCIAL RESULTS FOR FY2016 O KEY Group S.A. (LSE: OKEY, the Group ), one of the leading Russian food retailers, announces its full year 2016
Hong Kong Economic Update
 Irina Fan Senior Economist irinafan@hangseng.com Joanne Yim Chief Economist joanneyim@hangseng.com May 28 Hong Kong Economic Update Hong Kong s March export growth stayed low at 7.6 yoy, as exports to
NEWS. Tim Jerzyk Senior Vice President, Investor Relations
 NEWS Tim Jerzyk Senior Vice President, Investor Relations Yum! Brands Reports First-Quarter EPS Growth of 21%, or $0.76 Per Share, Excluding Special Items; Strong Sales and Operating Profit Growth Across
Sea Limited Reports Fourth Quarter and Full Year 2018 Results
 Sea Limited Reports Fourth Quarter and Full Year 2018 Results Singapore, February 27, 2019 Sea Limited (NYSE: SE) ( Sea or the Company ) today announced its financial results for the fourth quarter and
2Q RESULTS DISCUSSION
 2Q 2017 2016 RESULTS DISCUSSION Financial Statement - Summary PLN m 2Q 2016 2Q 2017 % of Sales 2Q 2016 % of Sales 2Q 2017 Y/Y Change Net sales 5 341 6 084 14% EBITDA Normalized 110 120 2,1% 2,0% 9% One-off
9M 2018 RESULTS PRESENTATION
 9M 2018 RESULTS PRESENTATION 12.11.2018 9M 2018 RESULTS PRESENTATION DISCLAIMER This presentation (the "Presentation") has been prepared and is issued by, and is the sole responsibility of Telepizza Group,
Another quarter of strong revenues and net profit growth
 Third quarter 2005 Another quarter of strong revenues and net profit growth Financial highlights: Revenue of 250.0 million, up 373% on the prior year and 118% on the previous quarter 538,000 integrated
Illumina Q Financial Results April 25, Illumina, Inc. All rights reserved.
 Illumina Q1 2017 Financial Results April 25, 2017 2017 Illumina, Inc. All rights reserved. Safe Harbor Statement This communication may contain statements that are forward-looking. Forward-looking statements
Interim Results for the 26 weeks ended 29 June 2014
 Interim Results for the 26 weeks ended 29 June 2014 1 The Team David Wild Chief Executive Officer Sean Wilkins Chief Financial Officer 2 Highlights of H1 2014 11.3% UK LFL UK on-line accounting for 69.7%
Q Investor Presentation May 8, 2018
 Q1 2018 Investor Presentation May 8, 2018 Safe Harbor Disclosure and Definitions This presentation contains forward-looking statements. The use of words such as "anticipates," "estimates," "expects," "plans"
F I N A N C E U P D A T E G R O W T H W I T H D I S C I P L I N E
 F I N A N C E U P D A T E G R O W T H W I T H D I S C I P L I N E Jacky Lo, CFO Cautionary Statements Forward-Looking Statements. This presentation contains forward-looking statements within the meaning
H1 16 interim results. 22 September 2015
 H1 16 interim results 22 September 2015 Important notice 2 This presentation may include certain forward-looking statements, beliefs or opinions, including statements with respect to the Company s business,
2018 First Quarter Results May 14, Samsonite International S.A. Stock Code 1910
 2018 First Quarter Results May 14, 2018 Samsonite International S.A. Stock Code 1910 Disclosure Statement Page 2 This presentation and the accompanying slides (the Presentation ) which have been prepared
Bank of America Merrill Lynch Technology Conference
 Bank of America Merrill Lynch Technology Conference NASDAQ - TRIP 5/9/2012 Safe Harbor Statement Forward-Looking Statements. Our presentation today, including the slides contained herein, contains "forward-looking
Cheetah Mobile Announces Third Quarter 2018 Unaudited Consolidated Financial Results
 Cheetah Mobile Announces Third Quarter 2018 Unaudited Consolidated Financial Results Beijing, China, November 21, 2018 Cheetah Mobile Inc. (NYSE: CMCM) ( Cheetah Mobile or the Company ), a leading mobile
1H FY16 RESULTS PRESENTATION
 FY16 RESULTS PRESENTATION March 2016 Contents 1 Results Overview 2 Key Line Items 3 Country Results 4 Cash Flow, Balance Sheet, Dividend 5 Growth Strategy Update 6 FY16 Outlook 7 Questions A Appendices
Q4 and FY 2017 Financial Results. March 9, 2018
 and Financial Results March 9, 2018 Safe Harbor The information made available in this presentation contains forward looking statements which reflect the Company s current view of future events, results
RESTAURANT BRANDS 2016 ANNUAL RESULT (52 weeks) $m
 $m") 14 April NZX RESTAURANT BRANDS ANNUAL RESULT (52 weeks) (53 weeks) Total Group Store Sales 387.6 359.5 +7.8 Group Net Profit after Tax 24.1 23.8 +1.0 Dividend (cps) 21.0 19.0 +10.5 Key points Group Net
14 April NZX RESTAURANT BRANDS ANNUAL RESULT (52 weeks) (53 weeks) Total Group Store Sales 387.6 359.5 +7.8 Group Net Profit after Tax 24.1 23.8 +1.0 Dividend (cps) 21.0 19.0 +10.5 Key points Group Net
CARA OPERATIONS LIMITED Management s Discussion and Analysis For the 13 and 39 weeks ended September 24, 2017
 CARA OPERATIONS LIMITED Management s Discussion and Analysis For the 13 and 39 weeks ended September 24, 2017 The following Management s Discussion and Analysis ( MD&A ) for Cara Operations Limited ( Cara
Sea Limited Reports Second Quarter 2018 Results
 Sea Limited Reports Second Quarter 2018 Results Singapore, 22 August 2018 Sea Limited (NYSE: SE) ( Sea or the Company ) today announced its financial results for the quarter ended June 30, 2018. Sea again
FULL YEAR RESULTS PRESENTATION 2014
 FULL YEAR RESULTS PRESENTATION 2014 Russel Creedy Grant Ellis CEO CFO PRESENTATION OUTLINE Highlights Results Overview KFC Pizza Hut Starbucks Coffee Carl s Jr. Outlook HIGHLIGHTS Commentary Group Revenues
Vizrt Group AS Reports Q4 and full year 2017 Results
 Vizrt Group AS Reports Q4 and full year 2017 Results - 1 - Bergen, Norway, February 26, 2018. Vizrt Group AS. Vizrt today reported its financial results for the fourth quarter and the full year of 2017.
Performance Food Group Company Reports First-Quarter Fiscal 2018 Results
 NEWS RELEASE For Immediate Release November 8, 2017 Investors: Michael D. Neese VP, Investor Relations (804) 287-8126 michael.neese@pfgc.com Media: Joe Vagi Manager, Corporate Communications (804) 484-7737
Financial Highlights (1)
") Disclaimer The information in this document has not been independently verified and no representation or warranty, expressed or implied, is made as to, and no reliance should be placed on, the fairness,
Disclaimer The information in this document has not been independently verified and no representation or warranty, expressed or implied, is made as to, and no reliance should be placed on, the fairness,
Company Presentation. September 2016
 Company Presentation September 216 Forward Looking Statement Disclaimer This presentation contains forward-looking statements that involve risks and uncertainties. These include statements regarding the
Fourth Quarter 2017 Results. February 8, 2018
 Fourth Quarter 207 Results February 8, 208 Safe Harbor Disclosure Please review our SEC filings on Form 0-K and Form 0-Q The statements contained herein that are not historical facts are forward-looking
Steve Schmitt Vice President, Investor Relations & Corporate Strategy
 NEWS Steve Schmitt Vice President, Investor Relations & Corporate Strategy Yum! Brands Reports Second-Quarter EPS of $0.69, a Decline of 5%, Excluding Special Items; Expects Strong Second Half in China;
Shutterfly Announces Third Quarter 2018 Financial Results
 Shutterfly Announces Third Quarter Financial Results October 30, REDWOOD CITY, Calif.--(BUSINESS WIRE)--Oct. 30, -- (NASDAQ:SFLY), the leading retailer and manufacturing platform dedicated to helping capture,
W W E Q R E S U LT S J U LY 2 7,
 W W E Q 2 2 0 1 7 R E S U LT S J U LY 2 7, 2 0 1 7 Forward-Looking Statements This presentation contains forward-looking statements pursuant to the safe harbor provisions of the Securities Litigation Reform
1Q17 Highlights. Sales recovery in Brick and Mortar Stores, with same-store sales growth of 2.5% in 1Q17.
 April 26, 2017 Via Varejo S.A., Brazil s largest electronics, home appliances and furniture retailer, announces its results in the first quarter of 2017 (1Q17). On November 1, 2016, the Company started
BOB EVANS REPORTS FISCAL 2017 FIRST-QUARTER RESULTS AND RAISES FISCAL 2017 EPS GUIDANCE
 BOB EVANS REPORTS FISCAL 2017 FIRST-QUARTER RESULTS AND RAISES FISCAL 2017 EPS GUIDANCE Q1 2017 net sales total $306.3 million; GAAP net income of $0.46 per diluted share, non-gaap net income (1) of $0.48