SOCIAL PROTECTION COMMITTEE ANNUAL REPORT 2018
|
|
|
- Georgia Horton
- 5 years ago
- Views:
Transcription
 AND DEVELOPMENTS IN SOCIAL PROTECTION POLICIES REPORT ON KEY SOCIAL CHALLENGES AND MAIN")
1 SOCIAL PROTECTION COMMITTEE ANNUAL REPORT SPC ANNUAL REVIEW OF THE SOCIAL PROTECTION PERFORMANCE MONITOR (SPPM) AND DEVELOPMENTS IN SOCIAL PROTECTION POLICIES REPORT ON KEY SOCIAL CHALLENGES AND MAIN MESSAGES
2
3 European Commission Directorate-General for Employement, Social Affairs and Inclusion 1049 Brussels BELGIUM Manuscript completed in September 2018 Neither the European Commission nor any person acting on behalf of the Commission is responsible for the use that might be made of the following information. Luxembourg: Publications Office of the European Union, 2018 Cover image: Shutterstock European Union, 2018 Reuse is authorised provided the source is acknowledged. The reuse policy of European Commission documents is regulated by Decision 2011/833/EU (OJ L 330, , p. 39). For any use or reproduction of photos or other material that is not under the EU copyright, permission must be sought directly from the copyright holders. PDF ISBN ISSN doi: /43136 KE-BG EN-N
4 SOCIAL PROTECTION COMMITTEE ANNUAL REPORT 2018 REVIEW OF THE SOCIAL PROTECTION PERFORMANCE MONITOR AND DEVELOPMENTS IN SOCIAL PROTECTION POLICIES Report on key social challenges and main messages
5 TABLE OF CONTENTS Acknowledgments... 4 Main messages... 5 I. Introduction... 9 II. Progress on the Europe 2020 poverty and social exclusion target III. Overview of developments in the social situation in the European Union 13 SPPM dashboard Latest indications from available 2017 EU-SILC data IV. Analysis of the key social challenges and good social outcomes in EU Member States and a review of latest developments in social protection policies Preventing poverty and social exclusion through inclusive labour markets, adequate and sustainable social protection and high quality services Adequate and sustainable pensions Accessible, high-quality and sustainable health care Adequate social protection for long-term care needs V. Special focus on health
6 Abbreviation EU28 EU27 EA18/19 BE BG CZ DK DE EE IE EL ES FR HR IT CY LV LT LU HU MT NL AT PL PT RO SI SK FI SE UK Full name European Union (28 countries) European Union (27 countries) Euro area (18/19 countries) Belgium Bulgaria Czech Republic Denmark Germany Estonia Ireland Greece Spain France Croatia Italy Cyprus Latvia Lithuania Luxembourg Hungary Malta Netherlands Austria Poland Portugal Romania Slovenia Slovakia Finland Sweden United Kingdom 3
7 Acknowledgments The present report has been prepared as part of the mandate given to the Social Protection Committee (SPC) by the Treaty on the Functioning of the European Union (TFEU) to monitor the social situation in the European Union and the development of social protection policies (art. 160 of TFEU). The report is prepared by the Secretariats of the Committee and its Indicators' Sub-group. The Directorate-General for Employment, Social Affairs and Inclusion provided the SPPM dashboard calculations used in the report with the extensive assistance and data provision of Eurostat. The principal authors are Paul Minty and Georgi Karaghiozov, with specific support from Bent-Ole Grooss and David Arranz. The members of the SPC and its Indicators Sub-Group contributed extensively to the drafting of the report and its key messages. The report was approved by the SPC on 17 September The Council of the European Union endorsed the key messages of the report on 6 November The list of SPC Members appears on the following link: The list of members of the SPC Indicators Subgroup appears on the following link: 4
8 Main messages (endorsed by the Council of the European Union on 6 November) 1. Delivering on its mandate as per article 160 of the TFEU, the SPC has produced for the Council its annual review of the social situation in the EU and the social policy developments in the Member States, based on the most recent data and information available. On this basis, the SPC highlights the following findings and common priorities for social policy reforms which should guide the preparatory work for the 2019 Annual Growth Survey. 2. The social situation in the EU continues to benefit from the economic recovery and the reform efforts made by Member States in recent years. Of particular note is the continued improvement in the labour market, with further reductions in unemployment, including youth and long-term unemployment, as well as continued improvement in the labour market participation of older workers. The improvement in the employment situation has resulted in rises in real gross household disposable income and reductions in the share of the population in (quasi-)jobless households. There are also reductions in the share of the population suffering from severe material deprivation and in the share of children at risk of poverty or social exclusion in many Member States. 3. The latest edition 1 of the Social Protection Performance Monitor (SPPM) also points to a continued general improvement in the social situation in the EU with around two thirds of the social indicators in the SPPM flagging up a noticeably higher number of Member States with positive changes than negative ones. However, the economic growth and the improvement of the labour market have, so far, had a rather mixed and sometimes limited impact on the other social indicators. 4. Despite the generally positive developments, the EU is far from achieving the Europe 2020 target of lifting at least 20 million people from the risk of poverty and social exclusion. In 2016 there were around 0.8 million more people at such risk in the EU compared to , with a total of 118 million or close to 1 in 4 Europeans. The overall trend masks persistent divergence between Member States. Substantially higher AROPE rates compared to 2008 and persistently high levels of income inequality are still observed in several countries, especially among those most affected by the economic crisis. 1 Indicators based on EU-SILC refer to the latest available data for all Member States, which is generally for the survey year 2016; indicators based on EU-LFS refer to The reference year, due to data availability, for the Europe 2020 social inclusion target adopted in
9 5. For the EU as a whole the following main negative trends, or "social trends to watch" are identified for the most recent period. Deterioration with regard to the depth of poverty in many Member States, and with regard to in-work poverty in several countries, despite improving labour market conditions. Rises in the at-risk-of-poverty rates for people residing in (quasi-)jobless households, pointing to weaknesses in the adequacy of social benefits in several countries. 6. The lack of inclusiveness of the economic recovery is a concern, with income inequality remaining persistently high at EU-level and the poverty gap widening in many countries. Addressing this issue will require further action within a number of different policy areas, such as fostering equal opportunities across all policy domains, improving the design of tax and benefit systems, as well as stepping up the active inclusion approach, which combines adequate income support, integrated active labour market policies and access to quality social services. 7. Although the risk of poverty or social exclusion of the elderly is still significantly lower than for the general population in the majority of the Member States, there are signs of a decline in the relative income of the elderly. To a large extent this reflects the reversal of the general trend observed in the period following the crisis years in which their situation relative to the rest of the population improved, while now the relative income situation of the working age population is doing better as the labour market situation and incomes from work have improved. 8. The rising share of the working poor in several Member States shows that having a job is not always a guarantee against the risk of poverty. The working poor represent around a third of working-age adults who are at-risk-of-poverty, and the recent trend highlights growing divergence between Member States. Income from employment often needs to be complemented by adequate benefits. Provision of affordable childcare, housing support and access to training can also have an important role to improve the living standards of the in-work poor. 9. New forms of employment, and the associated gaps in access to social protection and lower incomes resulting from their spreading, may put growing parts of the population at higher risk of poverty and social exclusion and risk undermining the social and financial sustainability of social protection. Social protection systems need to ensure access to adequate protection for all persons in employment and, in particular, be better tailored to the needs of the various types of selfemployed and non-standard workers. 10. While there are clear signs of improving child poverty and youth exclusion rates, in 2016 there were around 25 million children in the EU28 living at risk of poverty or social exclusion, some 0.5 million fewer than the previous year and accounting for around 1/5 of all people living in poverty or social exclusion. As highlighted during a dedicated in-depth thematic review, which the SPC undertook in 2018, reducing child poverty and breaking the poverty cycle across generations call for integrated strategies that combine prevention, adequate income support and access to quality services. In particular, access to affordable quality early childhood education and care, along with 6
10 well-designed work-life balance policies, is key to improve children's life prospects, while at the same time supporting the labour market participation of their parents, notably mothers. 11. People with disabilities, with a migrant background and ethnic minorities, including Roma, often face multiple disadvantages in relation to participation in the labour market and in society, as reflected in the number of Member States having challenges related to the poverty or social exclusion of those persons. Supportive measures to enter the labour market (for those who can work) complemented by improved accessibility, social services and preventive approaches are needed to strengthen all individuals' capacities to participate actively in society and the economy. 12. Housing exclusion and homelessness are a growing concern across a number of Member States. Policies, such as social housing and affordable rental housing programmes, targeted housing allowances, as well as the energy-efficient renovation of existing housing stocks are required to address the problem. Adressing homelessness needs integrated and sustainable solutions that combine prevention and support. 13. Pension systems have been one of the areas with the most reforms in recent years, driven by the need to improve the long-term fiscal sustainability while maintaining retirement income adequacy. The 2018 Pension Adequacy Report (PAR), prepared jointly by the SPC and the European Commission, brings into focus several outstanding issues: it highlights that, while narrowing, the pension gap between men and women, mainly due to the gender pay and employment gaps, remains large and is likely to persist, and that people in non-standard or selfemployment often face less favourable conditions for accessing and accruing pension rights. It also shows that inequalities among older people persist and the risk of poverty or social exclusion increases with age. The ongoing economic recovery leaves more fiscal space to address adequacy concerns. Further reform efforts, while taking into account the varying country specificities, should reflect both social and economic concerns, including by ensuring that older people have adequate pensions and access to public or subsidised services. Pension policy reforms and related employment, training, health and safety measures should aim to reconcile long-term sustainability and adequacy of pensions through supporting longer working lives. 14. Healthcare systems should seek to provide universal access to healthcare for all, including through increased coverage and greater provision of information on services available. Obstacles to access healthcare faced by the most vulnerable, including high out-of pocket costs in some Member States, should be addressed. Health inequalities should be reduced. Shifting the focus towards primary care and prevention, as well as promoting healthier life-style habits are needed to ensure both the sustainability of the healthcare systems and positive health outcomes for all. 15. Population ageing increases the demand and need for long-term care. The shift to formal care is likely to accelerate due to changes in the family structure and changes in the world of work. Measures to address these challenges could include creating a shift from institutional to community care and home care and improved policies for prevention, rehabilitation and independent living. Special attention should be given to support for informal caregivers. 7
11 16. Improving the performance of social protection systems, as well as social investment, will be an important aspect in achieving upward convergence in the EU. Current and future reforms in social protection should seek continuous improvement of social outcomes. In doing so, there is a need to promote cross-sectoral cooperation and an integrated approach involving all relevant policy areas. Fit-for-purpose social protection systems also contribute to the smooth functioning of the labour market and to inclusive growth. The principles enshrined in the European Pillar of Social Rights provide a strong consensual basis for social protection systems and social inclusion measures which invest effectively and efficiently in people and support them in coping with challenges throughout the life course
12 I. Introduction The present report has been prepared as part of the mandate given to the Social Protection Committee (SPC) by the Treaty on the Functioning of the European Union (TFEU) to monitor the social situation in the European Union and the development of social protection policies (art. 160 of TFEU). The SPC is an advisory policy committee which provides a representative forum for multilateral social policy coordination, dialogue and cooperation at EU level. It brings together policy makers from all EU Member States and the Commission in an effort to identify, discuss and implement the policy mix that is most fitted to respond to the various challenges faced by Member States in the area of social policies. It uses the social open method of coordination as the main policy framework combining all major social policy strands - social inclusion, pensions, health and longterm care - and focuses its work within these strands. The main objective of the 2018 SPC Annual Report is to deliver on the mandate of the Committee and, through its analysis, to provide input to the Council on identifying the main social policy priorities to recommend to the Commission in the context of the preparation of the 2018 Annual Growth Survey. On the basis of the Social Protection Performance Monitor (SPPM) and Member States' social reporting, the report aims at i) analysing the social situation 3, especially the progress towards the Europe 2020 target on reducing poverty and social exclusion and the latest common social trends to watch, and ii) identifying the key structural social challenges facing individual Member States as well as their good social outcomes, and reviewing the most recent social policy developments in Europe. Separate annexes to the report provide a more detailed review of social developments and the SPPM country profiles for each Member State. This year s report also contains a special focus on the results of a recent exercise analysing the area of health from a social protection perspective, on the basis of a Joint Assessment Framework in this area. The main report presents the horizontal results of this exercise, while a dedicated annex provides the country-specific conclusions of the JAF Health analyses together with a short introduction on the type of national healthcare system and recent reforms in each country. 3 The figures quoted in this report are based on data available around mid-june 2018, unless otherwise stated. This means that for EU-SILC based indicators the most recent data generally available for all Member States are for the 2016 survey and that is the reason why this reference year is generally used throughout the report for these indicators. 9
13 II. Progress on the Europe 2020 poverty and social exclusion target In 2010, the EU Heads of States and Governments committed to lifting at least 20 million people out of being at risk of poverty or social exclusion 4, in the context of the Europe 2020 strategy. This commitment stressed the equal importance of inclusive growth alongside economic objectives for the future of Europe, and it introduced a new monitoring and accountability scheme 5. Within the framework of the Europe 2020 strategy, Member States set national poverty and social exclusion targets (Table 1). However, the individual poverty-reduction ambitions of the Member States sum to a figure lower than the EU level commitment to reduce poverty and social exclusion by 20 million and are not always based on the headline composite indicator, the at-risk-of-poverty-orsocial-exclusion rate (AROPE). In 2016, 12 Member States registered significant falls in the share of the population at risk of poverty or social exclusion (most notably IE, HU, LV and MT) and only 2 observed significant rises (IT and RO). Overall figures for the EU population at risk of poverty or social exclusion point to a fall of around a million between 2015 and Underlying the overall fall are continued strong reductions in the population experiencing severe material deprivation (down around 2.5 million, and with latest estimates suggesting a stronger fall of 4.4 million between 2016 and 2017) and to a lesser extent in the number of people living in (quasi-)jobless households (down 0.7 million). In contrast, the population at risk of poverty remained broadly unchanged, following the noteworthy increases over the preceding years (Figure 1). With regard to the Europe 2020 poverty and social exclusion target, in 2016 there were still around 0.8 million more people living at risk of poverty or social exclusion in the EU compared to , with a total of 118 million or close to 1 in 4 Europeans. Figure 1 shows time series since 2005 for the EU27 aggregate 7. The overall trend masks persistent divergence between Member States. Substantially higher AROPE rates compared to 2008 are still observed in several countries, especially among those most affected by the economic crisis (CY, EL, ES and IT). For half of Member States, the AROPE rate in 2016 is not significantly different to the 2008 figure, while in several countries it is substantially lower, most notably in LV, PL and RO (Figure 2). 4 The EU poverty and social exclusion target is based on a combination of three indicators the at-risk-of-poverty rate, the severe material deprivation rate, and the share of people living in (quasi-)jobless (i.e. very low work intensity) households. It considers people who find themselves in any of these three categories and, while very broad, it reflects the multiple facets of poverty and social exclusion across Europe. This definition extends the customary concept of income poverty to cover the non-monetary dimension of poverty and labour market exclusion. 5 COM (2010) 758 final 6 The reference year, due to data availability, for the target adopted in Note that figures here refer to the EU27 aggregate, since time series for the EU28 aggregate are not available back to
14 Table 1. Europe 2020 poverty and social exclusion target - national targets National 2020 target for the reduction of poverty or social exclusion (in number of persons) EU28 20,000,000 BE 380,000 BG CZ 100, ,000 persons living in monetary poverty* DK Reduction of the number of persons living in households with very low work intensity by 22,000 by 2020* DE Reduce the number of long-term unemployed by 320,000 by 2020* EE IE EL 450,000 Reduction of the at risk of poverty rate after social transfers to 15%, equivalent to an absolute decrease by 36,248 persons* Reduce the number of person in combined poverty (either consistent poverty, at-risk-of-poverty or basic deprivation) by at least 200,000* ES 1,400,000-1,500,000 FR 1,900,000 HR Reduction of the number of persons at risk of poverty or social exclusion to 1,220,000 by 2020 IT 2,200,000 CY 27,000 (or decrease the percentage from 23.3% in 2008 to 19.3% by 2020) LV LT LU 6,000 HU 450,000 MT 6,560 Reduce the number of persons at the risk of poverty and/or of those living in households with low work intensity by 121 thousand or 21 % until 2020* 170,000 (and the total number of people at risk of poverty or social exclusion must not exceed 814,000 by 2020) NL Reduce the number of people aged 0-64 living in a jobless household by 100,000 by 2020* AT 235,000 PL 1,500,000 PT 200,000 RO 580,000 SI 40,000 SK 170,000 FI SE 140,000 (Reduce to 770,000 by 2020 the number of persons living at risk of poverty or social exclusion) Reduction of the % of women and men aged who are not in the labour force (except full-time students), the long-term unemployed or those on long-term sick leave to well under 14%* UK Nine national indicators ( 2 statutory and 7 non-statutory) underlying measures to track progress in tackling the disadvantages that affect outcomes for children and families* Source: National Reform Programmes. Notes: * denotes countries that have expressed their national target in relation to an indicator different to the EU headline target indicator (AROPE). For some of these Member States (BG, DK, EE, LV) it is expressed in terms of one or more of the components of AROPE, but for the others (DE, IE, NL (age range differs), SE and UK (target not yet defined)) the target is neither in terms of the AROPE nor the standard definition of one or more of its components. 11
15 Figure 1. Evolution of the Europe 2020 poverty and social exclusion target, EU27 8 (figures in 1000s) Source: Eurostat (EU-SILC) Note: AROPE - at-risk-of poverty-or-social-exclusion rate; AROP - at-risk-of-poverty rate; (Quasi-)jobless HHs - share of population living in (quasi)-jobless households (i.e. very low work intensity (VLWI) households); SMD - severe material deprivation rate. For the at-risk-of-poverty rate, the income reference year is the calendar year prior to the survey year except for the UK (survey year) and Ireland (12 months preceding the survey). Similarly, the (quasi-)jobless households rate refers to the previous calendar year while for the severe material deprivation rate the current survey year. The 2017 figure for SMD is provisional. Figure 2. At-risk-of-poverty-or-social-exclusion rate (in %), evolution (in pp) and EU28 EU27 EA18 EA19 BE BG CZ DK DE EE IE EL ES FR HR IT change in pp ~ ~ ~ ~ ~ ~ -0.7 ~ ~ ~ -1.8 ~ -0.7 ~ change in pp n.a. ~ ~ ~ ~ n.a. ~ ~ ~ ~ n.a. 4.5 CY LV LT LU HU MT NL AT PL PT RO SI SK FI SE UK change in pp ~ n.a ~ ~ ~ ~ ~ change in pp ~ 3.0 ~ ~ ~ ~ -5.4 ~ -2.5 ~ ~ ~ Source: Eurostat (EU-SILC) Notes: i) Only significant changes have been highlighted in green/red (positive/negative changes). "~" refers to stable performance (i.e. insignificant change), "n.a." refers to data not (yet) being available; ii) For BG, major break in the time series in 2014 for the material deprivation indicators, so for SMD and AROPE the change is used for the longer period compared to Also a break in 2016 for EU-SILC based indicators, but comparisons of changes are still valid; iii) For DK, breaks in series for the period which mainly affect indicators related to incomes and to a lesser degree variables highly correlated with incomes ("n.a." shown for the period compared to 2008 for these); iv) For EE, major break in series in 2014 for variables in EU-SILC. Hence change used for the longer period compared to 2008; v) For HR, no long-term comparison for EU-SILC-based indicators compared to 2008 as no EU-SILC data published by Eurostat 8 Note figures here refer to the EU27 aggregate, since time series for the EU28 aggregate not available back to
16 before 2010; ix) For LU, major break in series in 2016 for EU-SILC based indicators ("n.a." shown for latest year comparisons, and long-term comparison is for period ); x) For NL, improvement to the definition of income in 2016 has some impact on comparison of income-based indicators over time; xiii) For UK, changes in the EU-SILC survey vehicle and institution in 2012 might have affected the results on trends since 2008 and interpretation of data on the longer-term trend must therefore be particularly cautious; III. Overview of developments in the social situation in the European Union 9 The EU economy is now showing moderate but solid growth, following the previous period of strong growth over Employment has now been growing for four and a half years, and over the latest quarters, employment in the EU has reached the highest levels ever recorded with more than 236 million people in jobs, and with permanent jobs and full-time employment being the main contributors to employment expansion over the last year. Even though large differences remain between EU countries, unemployment decreased in all Member States in 2017, and the unemployment rates in the EU and euro area are approaching their pre-crisis levels at a steady pace. Youth unemployment in particular is falling steadily. With employment responding promptly to economic growth, the financial situation of EU households continues to show some moderate improvement overall, mainly driven by an increase in income from work, but in general economic growth and the improvement of the labour market have, so far, had a rather mixed and sometimes limited impact on the other social indicators. Against this background, social conditions generally continue to improve, but challenges remain, especially regarding progress towards the Europe 2020 target to reduce poverty and social exclusion, the increase in in-work poverty risk and the rise in the risk of poverty of people living in (quasi-)jobless households. The latest 2018 update of the Social Protection Performance Monitor dashboard 10, which is mainly based on 2016 EU-SILC data 11 and 2017 LFS data, points to a continued general improvement in the social situation. 12 Member States registered significant falls in the share of the population at risk of poverty or social exclusion in 2016 and only 2 significant rises, with overall figures for the EU population at risk of poverty or social exclusion pointing to a fall of around a million between 2015 and Main recent trends Changes over the latest annual reference period 12 provide continued signs of a general improvement in the social situation, with most indicators mainly flagging up positive changes 9 A more detailed review of the latest social developments, based on a more extensive examination of the trends in the indicators in the SPPM dashboard together with supplementary indicators, is provided in Annex 1 to this report. 10 The SPPM dashboard is a tool which uses a set of key EU social indicators for monitoring developments in the social situation in the European Union (for details on the methodology see the appendix "SPPM dashboard methodology") 11 For preliminary analysis of the partially available EU-SILC 2017 data see the later section entitled Latest indications from available 2017 EU-SILC data. 12 Generally , but for the SMD rate, LTU rate, early school leavers, youth unemployment ratio, NEETs, and ER (55-64) the change refers to the period
17 across Member States (Figure 3). In particular, positive developments in the social situation can be observed in the following areas: rises in real gross household disposable income in 19 MS along with significant reductions in the severe material deprivation rate in 12 MS, the material and social deprivation rate 13 in 14 MS, and in the housing cost overburden rate in 11 MS. This reflects that, in aggregate, household incomes and financial conditions of EU households have further improved, benefitting from stronger economic activity and improved labour markets; a reduction in the risk of poverty or social exclusion for the overall population in 12 MS, driven mainly by falls in severe material deprivation and in the share of the population living in (quasi-)jobless households. There are also reductions in the share of children at risk of poverty or social exclusion in many Member States (13); further reductions in long term unemployment (in 16 MS) and in youth exclusion, with significant falls the share of young people who are neither in employment nor in education or training (NEET) in 10 MS, reflecting improvements in the labour market; continued improvements in the labour market participation of older workers (as evidenced by increases in the employment rate for year olds in 21 MS). Nevertheless, across the EU the following main negative trends, or trends to watch (i.e. where around a third or more of all Member States show a significant deterioration in the given indicator), can still be identified for the most recent period 14 : Deterioration with regard to the depth of poverty risk (as measured by the poverty gap, i.e. how poor the poor are) in 8 MS, and with regard to in-work poverty risk in several (7) countries; Rises in the at-risk-of-poverty rates for people residing in (quasi-)jobless households in 8 MS, pointing to a continued deterioration in the adequacy of social benefits in several countries. At the same time, there are signs of a decline in the relative income of the elderly, with significant falls in the median relative income ratio of the elderly in 13 countries (although in contrast, the aggregate replacement ratio improved in some 9 MS). This decline in the income situation of the elderly is a reversal of the general trend observed in the years following the crisis, and reflects to a large extent the evolution of the relative income situation of the working age population as the labour market situation and incomes from work have improved. 13 The new Material and Social Deprivation indicator updates the previous list of deprivation items and adds new, more relevant items to the list. For a full discussion, see the SPC Annual Report of 2017, page Note that these trends generally refer to EU-SILC , i.e. income data for the period
18 Figure 3: Areas of deterioration (social trends to watch) and improvement for the period * Source: Social Protection Performance Monitor * For EU-SILC based indicators the changes generally actually refer to for income and household work intensity indicators. For LFS-based indicators (LTU rate, early school leavers, youth unemployment ratio, NEETs (15-24), ER (55-64)) and SMD figures (not yet final for 2017 for several MS) the changes refer to the period Figure 4 highlights the countries where significant improvements or deteriorations have taken place in the most recent period by showing the number of social indicators in the SPPM dashboard for which a given country has registered a significant change in the figures for the latest year. The Member States with the highest number of significant positive recent changes are Bulgaria, Cyprus, Hungary, Latvia, and Portugal, all recording improvements on more than 10 indicators and (except for BG) with very few indicators showing a deterioration. In contrast, improvements in Austria, Finland, France, and Sweden were much more limited, with significant improvements only registered on 4 indicators or less. Almost all Member States recorded a larger number of indicators showing a significant improvement than a deterioration, although Italy and 15
19 the Netherlands stand out as having a larger number of indicators showing a deterioration (with significant declines on 8 indicators in Italy). These results should be considered in parallel with the longer-term situation of Member States with regard to the number of indicators which show a deterioration or improvement compared to 2008 (Figure 6). Figure 4. Number of SPPM key social indicators per Member State with a statistically significant improvement or deterioration from 2015 to 2016* Note: Bars refer to the number of SPPM indicators which have registered a statistically and substantively significant deterioration or improvement between 2015 and * For EU-SILC based indicators changes actually refer to for income and household work intensity indicators. For some indicators (SMD rate, LTU rate, early school leavers, youth unemployment ratio, NEETs, ER (55-64)) the changes refer to the period There are a total of 25 dashboard indicators relevant for this reference period. Figures not shown for LU due to significant break in series for EU-SILC based indicators in Main longer-term trends Looking at the longer-term developments since 2008 and the beginning of the Europe 2020 strategy, for some social indicators the situation still remains noticeably worse as a result of the 16
20 economic crisis, despite recent improvements (Figure 5). The areas with the most substantial deterioration compared to 2008 are: an increased share of the population living in (quasi-)jobless households in around half of MS, together with rises in the poverty risk for people living in (quasi-)jobless households in 15 MS; increased income inequality (in 11 MS) and a rise in the depth of poverty risk (with the poverty risk gap up in 14 MS) and also in the risk of in-work poverty (in 9 MS); However, the dashboard indicators show there have also been a number of improvements, notably in the employment of older workers and in the relative situation of the elderly. The labour market situation of older workers has improved markedly, as evidenced by increases in the employment rate for the age group in almost all Member States. At the same time, compared to 2008, the relative income situation of the elderly (aged 65 and over) shows clear signs of improvement in around two-thirds of Member States, with decreases in the number of elderly living at risk of poverty or social exclusion in 16 MS as well as an improvement in their income situation with respect to the rest of the population (as evidenced by rises in the aggregate replacement ratio in 16 MS, and the median relative income ratio of elderly people in 16). However, this trend should be interpreted with caution, as it does not necessarily show an improvement in absolute terms. As pension income remained stable during the economic crisis while the working age population suffered from substantial income loss (wage decreases, job loss, and decreases in benefit levels), the relative, but not necessarily the absolute, position of the elderly has improved, highlighting the important role of pension systems. Other areas which have seen an improvement include an increasing number of healthy life years among the population aged over 65 in many Member States, a reduction in the at-risk-ofpoverty or-social-exclusion rate of persons aged 16+ with disabilities, and significant decreases in the number of early school leavers in Europe (with reductions in 16 MS). Overall, there are now significant improvements compared to 2008 in gross household disposable income in many Member States. Figure 6 shows the number of indicators in the SPPM dashboard for which a given country has registered a significant deterioration or improvement over the period 2008 to 2016/17. The Member States with the most worrisome developments remain Cyprus, Greece, Italy and Spain, with deterioration still on 10 or more indicators compared to 2008, and with relatively few indicators showing an improvement. In contrast, Austria, the Czech Republic, France, Malta and the UK have only registered significant deterioration on 2 or fewer indicators along with improvement generally on a larger number of indicators. Around half of Member States now show a higher number of improvements than declines, most notably Latvia, Poland and the UK. Note that these results mainly refer to the period 2008 to 2016 for EU-SILC based indicators and that the 2017 data available for some countries (see the later section on Latest indications from available 2017 EU-SILC data ) indicate positive trends that might impact on the assessment based on Figure 6. 17
21 Figure 5. Areas of deterioration (Social trends to watch) and improvement for the period * Source: Social Protection Performance Monitor Note: i) For AT, break in series in 2011 for persistent poverty risk (so trend not considered for the period compared to 2008); ii) For BE, major break in 2011 in the self-reported unmet need for medical examination (so trend not considered for the period compared to 2008); iii) For 2014 BG registered a major break in the time series for the material deprivation indicator (SMD) and AROPE indicator, so longer-term changes are presented for the period only; iv) For DK, breaks in series for the period which mainly affect indicators related to incomes and to a lesser degree variables highly correlated with incomes (so trends not considered for the period compared to 2008 for these); v) For 2014 EE registered a major break in series for EU-SILC variables, so longer-term changes for these are presented for the period only; vi) For HR, no EU-SILC data published by Eurostat before 2010; vii) For LU, major break in series in 2016 for EU-SILC based indicators, so long-term comparison is for the period ); viii) For NL, improvement to the definition of income in 2016 has some impact on comparison of income-based indicators over time; ix) For RO, breaks in series in 2010 for LFSbased indicators, so changes used for longer term change; x) For UK, changes in the survey vehicle and institution in 2012 might have affected the results on trends since 2008 and interpretation of data on the longer-term trend must therefore be particularly cautious; xi) * For some indicators (SMD rate, LTU rate, early school leavers, youth unemployment ratio, NEETs, ER (55-64)) the changes generally refer to the period
22 Figure 6. Number of SPPM social indicators per Member State with a significant deterioration or improvement between 2008 and 2016* Source: Social Protection Performance Monitor Note: i) For AT, break in series in 2011 for persistent poverty risk (so trend not considered for the period compared to 2008); ii) For BE, major break in 2011 in the self-reported unmet need for medical examination (so trend not considered for the period compared to 2008); iii) For 2014 BG registered a major break in the time series for the material deprivation indicator (SMD) and AROPE indicator, so longer-term changes are presented for the period only; iv) For DK, breaks in series for the period which mainly affect indicators related to incomes and to a lesser degree variables highly correlated with incomes (so trends not considered for the period compared to 2008 for these); v) For 2014 EE registered a major break in series for EU-SILC variables, so longer-term changes for these are presented for the period only; vi) For HR, no EU-SILC data published by Eurostat before 2010; vii) For LU, major break in series in 2016 for EU-SILC based indicators, so long-term comparison is for the period ); viii) For NL, improvement to the definition of income in 2016 has some impact on comparison of income-based indicators over time; ix) For RO, breaks in series in 2010 for LFSbased indicators, so changes shown for longer term change; x) For UK, changes in the survey vehicle and institution in 2012 might have affected the results on trends since 2008 and interpretation of data on the longer-term trend must therefore be particularly cautious; xi) The bars refer to the number of SPPM indicators which have registered a statistically and substantively significant deterioration or improvement between 2008 and 2016/2017; xiii) * For some indicators (SMD rate, LTU rate, early school leavers, youth unemployment ratio, NEETs, ER (55-64)) the changes generally refer to the period ; ix) There are a total number of 25 SPPM dashboard indicators for this reference period. 19

23 SPPM dashboard
24 21
25 Note: i) Only significant changes have been highlighted in green/red (positive/negative changes). "~" refers to stable performance (i.e. insignificant change), "n.a." refers to data not (yet) being available. See table at end of document for full details of significance tests; ii) The method used to estimate the statistical significance of the net changes, based on regression and developed by Net-SILC2 (an EU funded network consisting of a group of institutions and researchers conducting analysis using EU-SILC) is still under improvement; iii) For AT, break in series in 2011 for persistent poverty risk ("n.a." shown for the period compared to 2008); iv) For BE, major break in 2011 in the self-reported unmet need for medical examination ("n.a." shown for the period compared to 2008); v) For BG, major break in the time series in 2014 for the material deprivation indicators, so for SMD and AROPE the change is used for the longer period compared to Also a break in 2016 for EU-SILC based indicators, but comparisons of changes are still valid; vi) For DK, breaks in series for the period which mainly affect indicators related to incomes and to a lesser degree variables highly correlated with incomes ("n.a." shown for the period compared to 2008 for these).; vii) For EE, major break in series in 2014 for variables in EU-SILC due to implementation of a new methodology based on the use of administrative files. Hence change used for the longer period compared to 2008; viii) For HR, no long-term comparison for EU-SILC-based indicators compared to 2008 as no EU-SILC data published by Eurostat before 2010; ix) For LU, major break in series in 2016 for EU-SILC based indicators ("n.a." shown for latest year comparisons, and long-term comparison is for period ); x) For NL, improvement to the definition of income in 2016 has some impact on comparison of income-based indicators over time; xi) For RO, breaks in series in 2010 for LFS-based indicators, so changes shown for longer term change; xii) For SI, break in time series in Healthy Life Years indicator (change of question in 2010) which affects the comparison of change since 2008; xii) For UK, changes in the EU-SILC survey vehicle and institution in 2012 might have affected the results on trends since 2008 and interpretation of data on the longer-term trend must therefore be particularly cautious; xiii) For some indicators (SMD rate, LTU rate, early school leavers, youth unemployment ratio, NEETs, ER (55-64)) the changes generally refer to the periods and xiv) SMD figures for CY, DE, EE, FR, HR, IT, LT, NL, PT, RO and the UK are provisional. 22
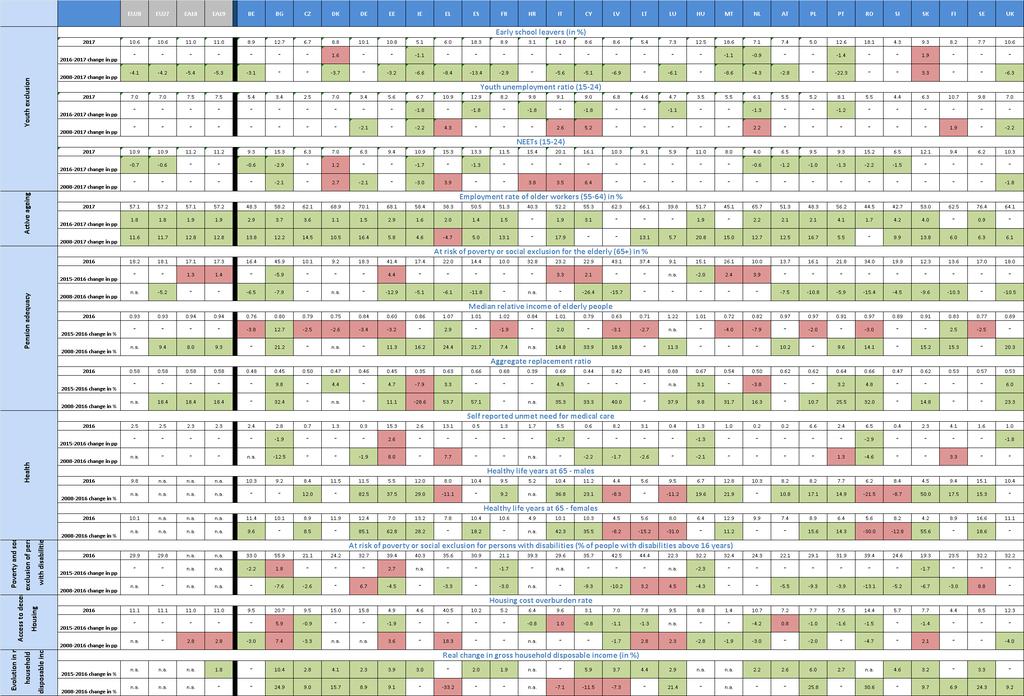
26 Latest indications from available 2017 EU-SILC data Some 14 Member States have already reported the results of the 2017 EU-SILC survey 15, while all Member States except IE, LU, PL, SK and SE have provided early estimates on the severe material deprivation (SMD) indicator. This section presents the findings, albeit rather patchy, from this most recently available data. The table below (Table 2) shows figures available for the changes in the EU-SILC based SPPM indicators between 2016 and 2017 surveys, highlighting where changes are significant 16. With a few exceptions (mainly concerning the income situation of the elderly), the picture from the available figures is one of continuing improvement in the social situation. As discussed earlier, results for the severe material deprivation (SMD) indicator improved strongly over the very latest period. The severe material deprivation rate has declined significantly over in 12 Member States, and has not risen significantly in any. Among the 14 countries having reported already data on the at-risk-of-poverty rate, 7 recorded a significant improvement between 2016 and Moreover, 10 Member States report declines in the share of the population living in (quasi-)jobless households. A result of these trends in the components of the overall at-risk-ofpoverty-or-social-exclusion rate (AROPE) are significant reductions in the AROPE indicator, with 10 countries already reporting significant reductions in the share of the population at risk of poverty or social exclusion over the latest year. The risk of poverty among children also shows improvements among 7 of the countries which have so far reported their data. In contrast to the positive developments overall, there are signs of further deterioration in the poverty risk for people living in (quasi-)jobless households in several (5) countries, and of a continuing decline in the relative income of the elderly, with significant falls in the median relative income ratio of the elderly already reported in 7 countries. As emphasised previously, the latter reflects to a large extent the rebalancing of the income distribution as the labour market situation and incomes of the working age population have improved. 15 This refers to the situation on the 24 th July 2018, at which time some 14 Member States (AT, BE, BG, CZ, DK, EE, EL, ES, FI, LV, HU, MT, RO and SI) had reported data for the SILC-based indicators included in the SPPM. For the SMD indicator, all Member States except 5 had provided early data or estimates. 16 The estimates of significance used are the ones employed to investigate the changes

27 Table 2: Dashboard of changes for available EU-SILC based figures Note: i) Only significant changes have been highlighted in green/red (positive/negative changes). "n.a." refers to data not (yet) being available. Eurostat calculations on statistical significance of net change have been used where available, combined with checks for substantive significance. In all the remaining cases a 1pp threshold has been used for all percentage-based indicators or for indicators based on ratios a 5% threshold has been used; ii) The method used to estimate the statistical significance of the net changes, based on regression and developed by Net-SILC2 (an EU funded network consisting of a group of institutions and researchers conducting analysis using EU-SILC) is still under improvement; iii) SMD figures for CY, DE, EE, FR, HR, IT, LT, NL, PT, RO and UK are provisional; 24
28 IV. Analysis of the key social challenges and good social outcomes in EU Member States and a review of latest developments in social protection policies In this section the main social challenges and good social outcomes in each Member State are assessed 17, and an overview is provided of the more recent reforms of social protection policies across MS, notably concerning social inclusion, pensions, health and long-term care. For the former, the assessment is based on an analysis of both the levels of the figures for the indicators in question together with the changes over a three-year reference period, based on the Joint Assessment Framework tool 18. This analysis is complemented, where relevant, by policy messages from the thematic and peer reviews undertaken during the year and results of the on-going benchmarking work. Preventing poverty and social exclusion through inclusive labour markets, adequate and sustainable social protection and high quality services The social situation in the EU continues to benefit from the economic recovery and the improving labour market situation, with significant reductions in the at-risk-of-poverty-or-social-exclusion rate observed in several countries. Nevertheless, Europe remains far from reaching the Europe 2020 poverty and social exclusion target, even if some countries (e.g. Poland, Romania) have already achieved their individual targets. While the economic, employment and social circumstances vary widely across the EU, common social challenges remain. A continued deterioration in the depth of poverty risk, high inequality, and continued falls in the adequacy of social benefits pose challenges to the social safety nets in a few Member States. At the same time, improvements in unemployment and labour market participation have not been fully reflected in the social situation, as evidenced by a steady rise in rates of in-work poverty risk in a number of Member States. General trends This year s SPPM analysis of the structural challenges of Member States 19 shows that for the general population across the EU28, the at-risk-of-poverty-or-social-exclusion rate (AROPE) remains a key challenge in 5 Member States (BG, EE, EL, IT, RO), with good outcomes registered in 2 Member State (CZ, IE) (Table 3). An analysis of the subcomponents of this indicator shows that (relative) poverty is a key challenge in 3 Member States (EE, ES, RO), while severe material deprivation is a key challenge in 4 Member States (BG, CY, EL, HU), and (quasi-)jobless households 17 For further details on the assessment methodology see the appendix "SPPM methodology used for the identification of Member States' key social challenges and good social outcomes" For further details on the classification for the specific member states, see the appendix "SPPM country profiles" 25
29 in 15 Member States (BE, CZ, CY, DE, EE, EL, ES, FI, HR, IE, LT, LV, MT, SE, SK), but with good outcomes on the latter in 4 Member States (CY, EE, LV and LT). For the EU28, severe or persistent income poverty represents a key challenge in 7 Member States (ES, HR, IT, LV, MT, RO, UK). Good social outcomes with regards to severe or persistent income poverty are registered in 7 Member States (AT, CZ, CY, DK, FR, HU, MT). Income inequality appears as a key challenge in 7 Member States (EL, ES, IT, LT, LV, RO, UK), while good social outcomes are registered in 2 MS (CZ, FR). The effectiveness of social protection, measured by impact of social transfers in reducing income poverty is flagged as a challenge in 7 Member States (CZ, LT, LU, LV, PL, PT, SK), while 5 Member states (AT, DE, FI, SE, SI) display good social outcomes in this regard. The housing situation, as reflected by either housing cost overburden or housing deprivation, is a key challenge in 11 Member States (BE, BG, CY, EL, FR, HU, LU, PT, SI, SK, UK), with 3 Member States (FI, MT, SK) registering good social outcomes. The analysis also shows that the risk of poverty and social exclusion situation of persons with disabilities appears to be a key social challenge in 12 Member Statutes (BE, BG, CY, DE, EE, HR, IE, LT, LV, MT, RO, UK) and good outcomes are registered in 2 Member States (ES, FR). The risk of poverty or social exclusion of migrants is flagged as a challenge in 8 Member States (AT, DE, DK, FI, FR, LU, MT, and NL). Table 3. Summary of Member States SPPM key social challenges and good social outcomes in the area of preventing poverty and social exclusion through inclusive labour markets, adequate and sustainable social protection and high quality services At-risk of poverty and social exclusion for general population (AROPE) At-riskofpoverty Severe material deprivation (Quasi-) jobless households (VLWI) Severe or persistent poverty risk (gap, persistence) Income inequality (S80/S20) Effectiveness of social protection for the general population Housing situation for general population 1 Key social challenge 2 EE, EL, IT, RO EE, ES, RO BG, CY, EL, HU BE, CZ, CY, DE, EE, EL, ES, FI, HR, IE, LT, LV, MT, SE, SK ES, HR, IT, LV, MT, RO, UK EL, ES, IT, LT, LV, RO, UK CZ, LT, LU, LV, PL, PT, SK BE, BG, CY, EL, FR, HU, LU, PT, SI, SK, UK FI, MT, SK Good social outcome CZ, IE AT, DK, SI \ CY, EE, LV, SK AT, CZ, CY, DK, FR, HU, MT CZ, FR AT, DE, FI, SE, SI Note: 1. Housing situation consists of an assessment on housing cost overburden and housing deprivation. 2. Challenges based on Non-JAF indicators are shown in italics. 3 Member states showing both KSC and GSO in a certain category are shown in bold. For further details on the classification for the specific member states, see the appendix "SPPM country profiles". Child poverty For children, the at-risk-of-poverty-or-social-exclusion rate is a key challenge in 3 Member States (CY, FR, RO); with DK and SI displaying particularly good social outcomes in this regard (Table 4). An analysis of the subcomponents of this indicator shows that the risk of poverty for children is a key challenge in EL, while good social outcomes are registered in 3 (DK, FI and SI), severe material 26
30 deprivation of children is a key challenge in 4 MS (BG, CY, HU, LT) and a good social outcome in SE. The share of children living in (quasi-)jobless households appears to be a key social challenge in 4 Member States (BE, BG, DE and FI), while good social outcomes are registered in EE, LU, LV and SI. The impact of social transfers in reducing the risk of child poverty, the at-risk-of poverty rate of children living in households with different levels of work intensity and the poverty risk gap are indicative of how effective social protection of children is in a given country. Based on these indicators, effectiveness challenges have been identified for 10 Member States (CZ, DK, ES, IE, IT, LT, MT, PT, SE, SK) with good outcomes reported in AT, BE, DK, FI, HU, HR, IE, NL. The housing situation for children appears as a challenge in LT, while a positive outcome is reported in FI. The well-being of children has been the focus of two recent peer reviews (see Box 1) and an in-depth Thematic Review on Early Childhood Development (see Box 2). Table 4. Summary of Member States SPPM key social challenges and good social outcomes in the area of breaking the intergenerational transmission of poverty/disadvantage - tackling child poverty and social exclusion At-risk of poverty and social exclusion for children (AROPE) At-risk-ofpoverty Severe material deprivation (Quasi-)jobless households (VLWI) Effectiveness of social protection for children Housing situation for children 1 Key social challenge CY, FR, RO EL BG, CY, HU, LT BE, BG, DE, FI CZ, DK, ES, IE, IT, LT, MT, PT, SE, SK LT Good social outcome DK, SI DK, FI, SI SE EE, LU, LV, SI AT, BE, DK, FI, HU, HR, IE, NL FI Note: 1. Housing situation consists on an assessment on housing cost overburden and housing deprivation. 2. Challenges based on Non-JAF indicators are shown in italics. 3 Member states showing both KSC and GSO in a certain category are shown in bold. For further details on the classification for the specific member states, see the appendix "SPPM country profiles". To prevent and combat child poverty, break the circle of intergenerational poverty and improve the well-being of children, a number of Member States are pursuing social protection measures focused on families with children. Measures include ensuring better financial support through introducing (LT) or increasing the amount of the universal child benefit (BG, DE, LV, PT); benefits for single parents (BE, DE), low income (BE, LT) or large families (EE, LV, LT, ES, SE); increased support for foster families and adoptees (LV); enhanced support for families with children suffering from a serious illness (ES); birth grants (IT) or provision of basic material assistance for new-born babies of deprived families, combined with social inclusion services. Other measures to improve the disposable income available to families with children include income tax amendments (ES, DE, LT, LU, LV); provisions to exclude part of the work income and child benefits when establishing the right to social assistance (e.g. LT, LV); increased childcare cost deduction for low income families (BE, IE, FI) and targeted benefits to parents for more affordable and accessible childcare (AT, IT). 27
31 The Miriam project in Belgium, providing conditions for sustainable social and labour market integration to a target group of women in single parenthood has been the focus of a recent SPC peer review (see Box 1). The availability, accessibility and affordability of early childhood education and care are also being addressed with a view of improving the well-being of children and improving the labour market outcomes for women. Measures include: initiatives to extend the provision of existing pre-school programmes (e.g. AT, IE) and to improve their quality (e.g. DK, IE); increased provision of free childcare (UK), efforts to increase the capacity of and access to early childhood education and care through the construction of facilities (EE, DE, SK, AT, PL, RO) and strengthening the legislative framework (SK, ES). In addition to the usual types of childcare facilities, the establishment of more flexible childcare schemes is also an important development in several Member States (FR). The provision of micro-crèches, offering childcare in small groups up to 4 children, set up by municipality, non-profit organization or parents on parental leave is an interesting concept, operating since 2016 in the Czech Republic. Poverty among the working age population For the working age population (Table 5), the share of people at-risk-of-poverty-or-socialexclusion appears to be a challenge in BE, while MT displays a good social outcome in that respect. The risk of poverty is a challenge in IT while 4 Member States (FI, MT, SE, SK) show particularly good outcomes. The share of adults living in (quasi-)jobless households is a challenge in CY and ES with good social outcomes in 5 MS (CZ, HU, LV, PL, SK). The risk of in-work poverty presents a challenge in 5 Member States (EE, EL, HU, IT and RO), with another 9 displaying good social outcomes (BE, CZ, DK, FI, HR, IE, MT, SE, SI) 20. The effectiveness of social protection is assessed in the SPPM methodology through the indicator on the impact of social transfers in reducing the risk of working age poverty, notably in terms of adequacy, coverage, and take-up of social assistance and unemployment benefits. Based on this approach, effectiveness challenges have been identified for 9 Member States (BG, DK, EE, EL, ES, HU, IT, PT, RO) and 4 Member states with particularly good outcomes (AT, CZ, CY and FR). The inclusiveness of labour markets, as reflected by the at-risk-of-poverty rate for adults living in (quasi-)jobless households and the poverty risk gap, appears to be a key challenge in 3 Member States (CZ, IE, SE). At the same time, good social outcomes are found in 5 Member States (BE, CY, FI, FR, IE). The housing situation of the working age population appears as a challenge in EE. 20 However, based purely on a reading of the indicators, 7 Member States have shown a year-on-year increase in inwork poverty risk, while only 5 have shown an improvement. When compared to the 2008 levels, the situation appears even worse. See Figure 30 below. 28
32 Table 5. Summary of Member States SPPM key social challenges and good social outcomes in the area of Active inclusion - tackling poverty and social exclusion in working age At-risk of poverty and social exclusion for working age population At-riskofpoverty (Quasi-) jobless households (VLWI) In work poverty risk Effectiveness of social protection for working age population Effective ness of social services Inclusive labour markets Housing situation for working age population 1 Key social challenge BE, IT CY, ES EE, EL, HU, IT, RO BG, DK, EE, EL, ES, HU, IT, PT, RO AT, BG, EL, ES, FI, IT, RO CZ, IE, SE \ Good social outcome MT FI, MT, SE, SK CZ, HU, LV, PL, SK BE, CZ, DK, FI, HR, IE, MT, SE, SI AT, CZ, CY, FR BE, CY, FI, FR, IE EE Note: 1. Housing situation consists on an assessment on housing cost overburden and housing deprivation. 2. Challenges based on Non-JAF indicators are shown in italics. 3 Member states showing both KSC and GSO in a certain category are shown in bold. For further details on the classification for the specific member states, see the appendix "SPPM country profiles". The multilateral reviews of CSRs implementation and the social reporting in the context of the National Reform Programmes show that a number of Member States are implementing active inclusion policy reforms in the areas of income support, access to services and activation measures. Several Member States are pursuing policy reforms to improve the coverage and adequacy of their social safety nets (e.g. BE, BG, EE, HR, IT, LV, LT, SI). These reforms include measures to improve the adequacy of social assistance, increasing the coverage and targeting of minimum income schemes while ensuring an effective link with labour market (re-)integration and social participation; the revision of existing or the introduction of new benefits for persons in vulnerable situations; measures to address the fragmentation of social assistance systems, also by harmonizing and simplifying the provision of benefits. Gaps in access to social protection for non-standard workers and the self-employed The increasing share of non-standard workers and addressing their more limited access to social protection, in comparison with other workers, is also an area of increased policy focus (see Box 3). Several Member States have adopted reforms or are carrying out national debates on the subject. Denmark has recently adopted a new unemployment insurance scheme for the self-employed and persons in non-standard jobs. Measures to increase the social protection of the self-employed and legislation to address bogus self-employment are being discussed in the Netherlands. The Spanish social dialogue roundtables are currently discussing a reform of labour market regulations for the self-employed. The Portuguese government has proposed to reform the contributory scheme for the self-employed covering all social risks with a view to improving their social protection. 29
33 People in vulnerable situations A number of Member States are also reporting on measures targeting the poverty and social exclusion situation of persons with disabilities. Some (e.g. BE, FR, PT, SK) are improving the income replacement allowances for disabled persons. Many are taking steps to support the increased labour force participation among the recipients of disability payments (BG, CZ, EE, DE, FR, HU, IE, LT, LU, MT, NL, PL, RO, SE, SK). The reported measures include wage support, mobility assistance, employer quotas and incentives, as well as work-oriented rehabilitation, personalized activation services and vocational training. Measures to improve the inclusiveness of education, such as financial support and measures for pupils with disabilities, are being pursued in several Member States (CZ, FR, HR, IE, IT, LT, PL, PT, SK). Efforts are also being made to improve the living environment and conditions for independent living through investing in and providing-special purpose welfare and support services for the elderly and people with disabilities. (e.g. BE, DE, IE, MT, PT). These efforts help to improve the quality of life of people with increased need for care, and, together with the development of community-based care solutions, support the process of deinstitutionalization, taking place in several Member States (e.g. BE, EE, HR, HU, IE, LT, LV, RO). Despite the reported measures, efforts to combat poverty and social exclusion of persons with disabilities will need to be sustained in the future, as this is flagged as a key social challenge in 12 Member States (BE, BG, CY, DE, EE, HR, IE, LT, LU, MT, RO, UK) with good social outcomes recorded in ES and FR. The SPC recently held a peer review on the promotion of social enterprises that support people with mental health problems to enter the labour market (see Box 4). Several member states are taking measures for improved integration of people with migrant background. Additional resources have been made available for the integration of refugees in the society and labour market through activities such as language teaching (e.g. AT, CY, DK, LU), vocational education and training, career guidance and counselling and support in finding traineeships and jobs (FI, DK, DE, SE). In addition, measures encouraging the social participation of young children and the involvement of parents are being extended (e.g. CY, BE). Despite those efforts, the poverty and social exclusion situation of migrants is flagged as a key social challenge in AT, DE, DK, FI, FR, LU, MT, and NL. Several Member States are pursuing measures to address the rising levels of homelessness and housing exclusion. These include strengthening the preventive measures to protect people and families to fall into homelessness (i.e. DK, IE), increased funding, targeted subsidies and social housing support through the private sector (IE, LT, SE), measures to improve the stock of available social housing (BE, CZ, IE, MT, PL, PT, RO, UK) and increased funding to deal with homelessness (e.g. IE). A comprehensive action plan on fighting homelessness has been initiated in DK in Some further information and analysis on recent developments in relation to housing and homelessness is provided by the European Federation of National Organizations Working with the Homeless in Box
34 Adequate and sustainable pensions In 2018, the Social Protection Committee and the European Commission released the third Pensions Adequacy Report (PAR). The report examines the adequacy of current and future pensions and aims to support Member States in designing pension systems that are adequate while remaining financially sustainable. The PAR is therefore complementary with the Ageing Report, produced by the Economic Policy Committee and the European Commission, which focuses on the financial sustainability of the pension systems. The 2018 Pension Adequacy Report brings into focus several key issues: it shows that inequalities among older people persist and the risk of poverty or social exclusion increases with age, even though compared to 2008, there are now almost 2 million older people less at risk of poverty or social exclusion. It also highlights that, while narrowing, the pension gap between men and women remains large and is likely to persist, and that people in non-standard or self-employment often face less favourable conditions for accessing and accruing pension rights. Key highlights of the Report are included in Box 5. This year s SPPM analysis of the structural challenges of Member States shows that the share of elderly at risk of poverty or social exclusion (Table 6) is a key social challenge in 4 Member States (BG, HR, LT, LV) and a good social outcome in one (CY). Three Member States have an explicit challenge in relation to the risk of poverty - LT, LV and MT. Severe material deprivation of the elderly appears to be a challenge in EL, LT and RO, while MT and PL have a good social outcome in this regard. The highest number of Member States with key social challenges for the elderly, 11 (BE, CZ, CY, DK, EE, HR, IE, LT, LV, SI, MT) is registered on income replacement aspects, measured by the aggregate replacement ratio (excluding other benefits) and the median relative income of the elderly (65+). HU, IT and LU register particularly good outcomes with regard to these indicators. Housing is another area where several Member States (BG, CY, DE, LU, PT, RO) register key social challenges. Only one Member State (AT) shows a good social outcome. The impact of social transfers in reducing old age risk of poverty and the poverty risk gap are indicative of how effective pensions systems and social protection are in terms of allowing for a decent standard of living of the elderly in a given country. In relation to good social outcomes poverty prevention is the area with the highest number of Member States with good social outcomes (4 DK, FI, IE, MT), although MT registers a challenge, linked to the poverty risk rate for the population living in (quasi-)jobless households, as well as some negative developments in the persistent at-risk-ofpoverty rate. One Member State (RO) has a challenge regarding equalising pension rules. 31
35 Table 6. Summary of Member States SPPM key social challenges and good social outcomes in the area of poverty risk and adequate income and living conditions of the elderly Poverty and social exclusion in old age At-risk-ofpoverty Severe material deprivation Poverty prevention Income replacement aspects Equal pension rules Housing situation for the elderly 1 Key social challenge BG, HR, LT, LV LT, LV, MT EL, LT, RO BG, EE, HR, LV, MT, PT BE, CZ, CY,, DK, EE, HR, IE, LT, LV, SI, MT RO BG, CY, DE, LU, PT, RO Good social outcome CY \ MT, PL DK, FI, IE, MT HU, IT, LU \ AT Note: 1. Housing situation consists on an assessment on housing cost overburden and housing deprivation. 2. Challenges based on Non-JAF indicators are shown in italics. 3 Member states showing both KSC and GSO in a certain category are shown in bold. For further details on the classification for the specific member states, see the appendix "SPPM country profiles". Pensions systems have been one of the areas with the most reforms in recent years across the EU. These reforms have been driven by the need to improve the long-term fiscal sustainability of the pension systems, whilst maintaining retirement income adequacy. Sustainability enhancing pension reforms have been in the spotlight during the crisis years (see table 7 below). In recent years, the pension reform dynamic started to shift and to reflect adequacy concerns more prominently. As indicated in the 2018 Pension Adequacy Report, this change in the reform dynamic reflects the fact that most Member States have already adopted and are implementing pensionable age increases in response to the ageing of their population. At the same time, the economic recovery leaves more fiscal space of adequacy-focused reforms, such as reinforcing minimum guarantees and (re-) introducing favourable mechanisms 21. The multilateral reviews of CSRs implementation and the social reporting in the context of the National Reform Programmes show that a number of Member States are pursuing reforms in their pension policy in the context of a multiannual cycle. These reforms include continued efforts to harmonize the effective and statutory retirement age, as well as the retirement age between men and women (e.g. AT, EE, HR, LU); promoting longer working lives through tax incentives and measures to create working conditions attuned to an ageing workforce (e.g. AT); limiting early retirement options and abolishing special pension regimes (e.g. BE, DK, MT). Some recent reforms however go against the trend of increasing pensionable age. Most notably, Poland has reversed earlier reforms by reintroducing lower pensionable age for men and women PAR, p PAR, p
36 Table 7. Pension reforms adopted in Member States (July 2014 to July 2017) Reform Area Increases in pensionable age Increases in contributory period requirements Reducing early retirement opportunities Promoting flexible retirement pathways Facilitating deferred retirement Protecting low-income pensioners increasing low-end pensions Protecting low-income pensioners targeted additional benefits Protecting low-income pensioners indexation mechanism reforms Improving access to old-age protection for specific categories of workers Reinforcing the role of supplementary pension schemes Member State BE, BG, EL. FI, NL, UK BE, BG, CZ, FR, LT, MT, ES, UK AT, BE, BG, DK, FI, LU, PT AT, FI, DE, SI AT, HR, DK, FI, FR AT, BE, BG, CY, ES, IE, MT, PL, RO, SI, SK BG, CZ, EE, IT, SE BG, CY, CZ, LV, LT, PT, RO, SI, SK EL, FI, FR, IT, LT, PL, RO BE, DK, EE, FR, DE, IE, SI Note: Source, 2018 Pension Adequacy Report (p ), Member States' National Reform Programmes, SPC Multilateral Surveillance Several Member States focus on protecting low-income pensioners by improving the minimum pensions, providing targeted benefits or by unfreezing existing or introducing new indexation mechanisms. Other Member States are stepping up efforts to incentivise supplementary pension schemes (e.g. BE, DK, IT, MT, but overall reform efforts in this area remain limited. Accessible, high-quality and sustainable health care Population ageing and other factors, such as the high costs of innovative technologies and medicines, are putting increased pressure on the financial sustainability of health care systems and the ability to provide adequate healthcare for all. Reforms in health care have been a main focus of the European Semester process and aim at ensuring sustainable, affordable and cost-effective health services, without compromising universal and equitable access, quality and safety, and with an increasing emphasis on prevention. This year s SPPM analysis of the structural challenges of Member States shows that the health status of the population (Table 8), assessed in terms of life expectancy at birth and at 65; healthy life years at birth and at 65 and child mortality (1-14), proves to be a key challenge for 9 Member States (AT, BG, FI, HR, LT, LV, NL, PL, PT). Good social outcomes are registered in FI and MT. The former simultaneously registers a challenge related to the Healthy life years at birth for women and a good social outcome with regard to infant mortality. The effectiveness of curative or preventive health care, assessed in terms of potential years of life lost, amenable mortality, preventable mortality and vaccination coverage rates for children, proves to be a challenge for 8 33
37 Member States (AT, BG, CZ, FR, HR, MT, RO, SK), and with 4 (EL, HU, LU, LV) showing good outcomes in this area. 10 Member States have a key challenge as concerns access to health care, based on self-reported unmet needs for medical care due to cost, waiting time, or distance (CZ, EE, EL, FI, HU, IE, IT, LT, LV, PL). Challenges related to the cost-effectiveness of the health systems typically reflect problems of the balance between in-patient and out-patient care, inefficiencies in the allocation of resources in the hospital sector, issues with pharmaceutical pricing and reimbursement, or insufficient availability and coverage of e-health services. 16 Member States (BE, BG, CY, DE, EE, EL, FR, HU, HR, LT, PL, PT, RO, SI, SK, UK) register key challenges in this array of areas. Table 8. Summary of Member States SPPM key social challenges and good social outcomes in the area of health Health status Effectiveness of curative or preventive health care Access to health care Cost-effectiveness of health systems Key social challenge 1 AT, BG, FI, HR, LT, LV, NL, PL, PT AT, BG, CZ, FR, HR, MT, RO, SK CZ, EE, EL, FI, HU, IE, IT, LT, LV, PL BE, BG, CY, DE, EE, EL, FR, HU, HR, LT, PL, PT, RO, SI, SK, UK Good social outcome FI, MT EL, HU, LU, LV \ \ Note: 1. Challenges based on Non-JAF indicators are shown in italics. 2 Member states showing both KSC and GSO in a certain category are shown in bold. 3. For further details on the classification for the specific member states, see the appendix "SPPM country profiles". The multilateral reviews of CSRs implementation and the social reporting in the context of the National Reform Programmes show that a number of Member States are taking measures to address cost-effectiveness and sustainability challenges, as well as issues related to the accessibility and quality of health care. These measures are often part of ambitious multi-annual National Health Strategies and projects to improve the health outcomes of the population and improve the cost-effectiveness of the healthcare systems (e.g. RO, LT, AT, SK, SI). A number of Member States are reporting on measures to address the sustainability and costeffectiveness of their healthcare systems. The reduction in hospital care and the shift towards primary care and prevention is particularly important in that respect and many efforts have been focused on creating the necessary conditions for a shift from inpatient to outpatient care (e.g. AT, BG, CY, HR, PT, LT). Other measures include the joint provision and centralized procurement of pharmaceuticals, medical devices and healthcare services (e.g. AT, CY, HR, PT, SI), as well as the increased use of generic medicines (e.g. PT). A few Member States are also addressing specific challenges related to the number or the composition of the health workforce (e.g. BG, HU, LV, PL). 34
38 Healthcare systems should also seek to provide universal access to healthcare for all, addressing obstacles faced by the most vulnerable, such as cost, lack of information and access, while reducing health inequalities. Increasing the universal and equal access to health care, including through the improvement of health insurance coverage, emerges as a particularly important reform, as it affects the accessibility of healthcare for people with low income (e.g. BG, CY). Other efforts aimed at improving the accessibility and affordability of health care include reducing outof-pocket payments, including expanding the range of services and medicines covered by the state budget (LV, LT, BG) or efforts to curb informal payments (RO, LT). Many Member States are also making efforts to improve the availability and dissemination of information to encourage healthier living habits (e.g. AT, EE, HU, FR, PT, PL, LT, LV) and are taking steps to improve the transparency of the procedures to ensure more equal access to healthcare. The development and rollout of E-Health services has also been a priority in several Member States (e.g. CY, CZ, EE, LV, SK) as it has potential to improve the functioning of the healthcare system by facilitating a better flow of information about patients in real time or by providing opportunities to monitor and analyse the performance of the systems in a more productive manner. Further details on the Healthcare systems in Europe are contained in the special focus section of this year s report (section V: Special Focus on health) and detailed country-level analyses are contained in Annex 3 of the report. Adequate social protection for long-term care needs Policy measures in the area of long-term care focus mainly on improving cost-effectiveness, provision and access to adequate long-term care services. The insufficient provision of long-term care services or the sub-optimal design of the long-term care system has been identified as a challenge in 7 Member States (CY, EE, ES, NL, PL, SI, SK) and as a good social outcome in one Member State (BG), as shown in Table 9. Relevant reforms have been the focus of a recent SPC peer review (see Box 6). Table 9. Summary of Member States SPPM key social challenges and good social outcomes in the area of long-term care Long-term care Key social challenge 1 Good social outcome CY, EE, ES, NL, PL, SI, SK BG Note: 1 Challenges based on Non-JAF indicators are shown in italics. Population ageing will increase the need for long-term care. The EU public expenditure on longterm care is projected to increase from 1.6% to 2.7% of GDP between , with marked variations across the EU 23. The projections however do not show the full scale of the challenge, as 23 Ageing Report 2018, European Commission 35
39 they do not consider the extent to which Member States rely on informal care (usually by other family members, most often women). As the supply of informal carers decreases due to changes in family structure (smaller families, children living further apart from their parents, etc.) and changes in the world of work (rising retirement age and female employment), the shift to formal care is likely to accelerate. The measures adopted by some Member States aim at addressing these challenges through structural reforms, such as creating the conditions for a shift from institutional to community-based care, providing strengthened support to informal carers and improved policies for prevention, rehabilitation and independent living. Malta, for example is taking measures to support caregivers and help relieve pressure on the formal long-term care in institutions. Slovakia is testing solutions for integrated delivery of longterm care in home environment. Germany recently passed legislation to provide better training conditions and raise the attractiveness of the care professions to tackle the overall shortage of care professionals. Several Member States are also taking measures to strengthen the coordination of Health and Social service delivery. Slovenia, for example is advancing with the preparation of legislation to facilitate and ensure the implementation of long-term care services, in conjunction with other aspects of the social security system health care, social care and pensions. Finland is preparing a wide-scale health and social services reform aimed to provide better integration between health and social services on the one hand, and between basic and specialised services on the other. Bulgaria has adopted an Action plan for period for the implementation of the National Strategy for Long-Term Care which includes measures and services to support people with disabilities and elderly people dependent on care including through building up the necessary infrastructure to provide social and integrated health and social services. The Czech Republic is also revising its long-term health and social care system of assistance. Given the demographic challenges in Europe, continuing and expanding those efforts are necessary to ensure the sustainability of long-term care systems and to facilitate the access to adequate, affordable and quality long-term care. 36
40 Box 1: Recent peer reviews related to the well-being of children 'Single mothers facing poverty: Providing adequate financial, material and social support for sustainable social integration 24 Genk (Belgium), 5-6 October 2017 In all EU Member States, the single-parent families poverty risk rate is substantially higher than among two-parent families, according to the at-risk-of-poverty (AROP) indicator. In Belgium, this risk is particularly high, as one in two single parent families was at risk of poverty in 2016, a ratio 2.6 times higher than for the total population. Single parenthood is also strongly gendered, as approximately 85% of single-parent families are headed by women. Single parents often experience multiple disadvantages, and in Belgium, single mothers represent close to 17% of all minimum income beneficiaries, compared to 2.1% men in the same sub-category (PPS Social integration statistics, 2015 data). Poverty risk appears to be more longterm phenomenon in this social group, with high relative rates of persistent poverty risk, and also high occurrence of material deprivation. To address this issue, a pilot project named MIRIAM was launched in September 2015 in five Public Social Welfare Centres (PSWC) in Belgium targeting single mothers that benefit from support of the PSWC. The project provided intensive and tailored case management, both at individual and at collective level, and aimed to increase the empowerment of women and, as a consequence, durable social integration. -Key learning messages- Single parents disproportionally face a triple bind, including the combination of inadequate resources, inadequate employment and inadequate policies to secure well-being. However, although there are clearly challenges that are unique to single-parent families, much of their needs are common to other types of families as well. Thus, policies and institutions that support families with children and those in the labour force were also found to be of particular importance to prevent the poverty risk faced by single parents. Measures targeting (poor) single parents result in the most effective poverty reduction as long as adequate levels of redistribution are ensured. Targeted (means-tested) benefits need to address the issue of inadequate take-up, and avoid stigma/shame around accessing benefits/support
41 Social inclusion of mothers beyond monetary support is essential, including employment and social connections. However, employment does not protect single mothers from poverty, as there are a number of risk factors related to precarious employment, low wages and less favourable employment conditions that may affect them. Thus, employment policies and policies that ensure work-life balance, are an inherent part of a desirable policy mix. A holistic approach with respect to the social integration of mothers with cumulative disadvantage requires coordination in both the design and implementation of policies among different institutions. In addition to individual support measures, the use of collective/grouplevel support was found effective in helping single mothers overcome their isolation through sharing of experiences with others who face similar problems and find support within the group. The event was hosted by the Belgian Federal Public Service Social Security (FPS Social Security) and presented the opportunity to exchange lessons learned, good and innovative practices with participants from government representatives and peer country representatives from Belgium, the Czech Republic, France, Germany, Greece, Ireland, Luxembourg, Malta, Norway, Portugal, and Romania Peer review on 'Homelessness from a child s perspective' 25 Brussels (Belgium), June 2018 This peer review sought to highlight the key elements of an effective child homelessness strategy to ensure the well-being and rights of children currently without a home. The peer review showcased the host country approaches to tackle children's homelessness and allowed the participating Member States to present their experiences, as well as to exchange national/regional and local policy practices in group discussions. The Office of the Flemish Child's Rights Commissioner hosted the event and exchanged lessons learned, good and innovative practices with participants from Czech Republic, Denmark, Lithuania, Portugal and Romania. Building on the findings of a 2016 Flemish report called With(out) a home: Homelessness from a child s perspective the Peer Review focused on five key themes for which the conclusions are presented below:
42 1. Preventing homelessness among children; It is mainly primary prevention measures such as basic minimum income schemes, housing and social assistance benefits that need to be strengthened. But also secondary prevention measures, such as early warning detection and debt counselling to prevent evictions, and adequate alternative housing provision can ensure that eviction does not result in children and their families being rendered homeless. Stronger cooperation between different policy areas such as social housing, family support, child protection and youth care, and joint approaches from youth and family services, judicial systems, social housing services, local governments and other specialized support services are also required. 2. Developing and managing child-friendly shelters and services that are adapted to homeless children s needs; Shelters can only be a last resort and provide at best a temporary solution. There was general agreement that they should be as adapted to children s needs as much possible, in order to mitigate the adverse effects. This includes ensuring a safe, protective and supporting environment that also offers some form of continuity of lifestyle (i.e. children of school age can remain in their school, able to retain relationships with their peers etc.). 3. Developing and widening access to sustainable housing solutions for homeless children and their families through housing allocation and social support systems; Insufficient supply of social housing results in long waiting lists and the financial constraints of families were identified as key obstacles when it comes to accessing affordable housing. The peer review discussed a number of interesting and innovative housing-led initiatives and alternative housing solutions (e.g. Housing First for youth in Denmark; social rental agencies in Belgium) aimed at overcoming these challenges. At the same time, a more structural housing market policy is needed to guarantee housing affordability. 4. Strengthening local governance capacity and cooperation among stakeholders in delivery of services for homeless children; Strengthening local governance and devoting sufficient resources are essential to address homelessness among families and children in an effective way. Especially for children a local governance solution can guarantee continuity in their development, education, integration and social inclusion. The role and importance of integrated support services was emphasised. This is a challenge because different organisational cultures must be brought together and the knowledge among social workers has to be streamlined 39
43 5. Increasing the visibility of homeless children in policy through improved data collection and statistics. A lack of systematic and regular data collection and underreporting of statistics, were cited as the main difficulties with regard to ensuring visibility through data collection. Additional attention was asked for hidden homelessness, referring to persons and families staying with friends or family because of a lack of other housing options, since this is a typical survival strategy of families but not visible in statistics. The use of a harmonised definition of homelessness, such as that presented by ETHOS Light 26 can help measuring family homelessness and make children more visible in statistics. More specifically, in each data collection exercise on homelessness one must try to capture the age of each child, which makes statements possible not only on the level of the adult but also on the level of the child. 26 ETHOS Light is a simplified version of the harmonised definition of homelessness - the European Typology of Homelessness and Housing Exclusion (ETHOS) developed by FEANTSA in the context of a 2007 European Commission study: Measurement of Homelessness at European Union Level. It is a pragmatic tool for the development of homelessness data collection, rather than a conceptual and operational definition to be used for a range of policy and practice purposes. It aimed at improving understanding and measurement of homelessness in Europe. Further info on ETHOS available at: 40
44 Box 2: In-depth thematic review: "Integrated early childhood development policies as a tool for reducing poverty and promoting social inclusion" Sofia (Bulgaria), 21 March 2018 Building on the policy priorities of the Bulgarian presidency, the SPC held a thematic discussion on "Integrated early childhood development policies as a tool for reducing poverty and promoting social inclusion" in March The discussion has been structured around the following questions for discussion: i) how to improve access to quality early childhood education and care (ECEC) for the disadvantaged children and how to better reach parents and families from disadvantaged backgrounds? ii) how to improve the integrated delivery of early childhood development and protection services? and iii) how to deliver on the European Pillar of Social Rights (EPSR) principle 11 at EU level and what role should the social Open Method of Coordination (OMC) play in this respect. Despite the large diversity of the social and educational systems across Europe, a number of common findings and challenges were highlighted during the review, supporting the importance of exchange of best practices and the value of peer learning: 1. Improving Access to Early Childhood Education and Care (ECEC), especially for children from disadvantaged backgrounds Participation in early childhood education and care programmes is beneficial to all children. It is especially important for children from disadvantaged backgrounds and with special needs. Their early involvement is key in preventing the development of competence gaps which can hamper a good start already in primary education. An effective ECEC system is one where activities are child-centred and dedicated to the wellbeing and development of the child. It should offer equal access to quality services to children from disadvantaged backgrounds, with migration background, or with special needs. Experience from several countries shows that those children stand to profit most from ECEC, yet they are less well represented in ECEC. Policies and services need to be family-centred, as the first years are the most important and formative for all children to grow and develop. Complementing the key role of the family and supporting parents with ECEC is important, as it can lay the essential foundations for successful lifelong learning, social integration and employability. Affordable, accessible and high-quality early education and care, along with appropriate tax and benefit incentives is a major factor in enabling parents (especially mothers) to work. This is particularly important, as the labour market situation of parents has been identified as one of the key drivers for child poverty, (alongside with limited access to social services and lowincome support). Well-designed work-life balance policies, such as family-related leaves and flexible working arrangements, can also support parent s participation in the labour market. Several countries have reformed their schemes to support a more gender-balanced take-up, highlighting the 41
45 importance of fathers involvement for children's well-being, health and development. Pre-school education is also a key priority in laying the foundation for further education that would ensure that children acquire the skills which will enable them to access skilled, well-paid jobs, enabling them to build their own way out of poverty. 2. Improving the integrated delivery of Early Childhood development and protection services Well-designed and well-coordinated interventions - integrating health, education, care, social protection, finance and other sectors - can achieve concrete results for children from disadvantaged background and their families, particularly those from the most marginalised and segregated communities. Practices that deepen the partnership between parents and early childhood education centres and schools have been found to have an especially positive impact for children in disadvantaged families. ECEC can be used to establish personal contact with the parents of such children. Through follow-up house visits and the use of designated family case worker(s) it is possible to coordinate and integrate the various types of support (housing, debt relief, counselling for better parent skills). The combination of universal policies promoting the well-being of all children and targeted policies directed at, but not stigmatizing, the most vulnerable families is a key element in the development of effective strategies. The availability of trained service providers and experts and their more equal geographical distribution and regional accessibility is important to ensure equal access to the integrated delivery of services. 3. Delivering on principle 11 of the European Pillar of Social Rights While the centre of gravity of social policies is with the Member States at national and local level, the implementation of the European Pillar of Social Rights is a joint responsibility of the Member States, EU institutions, social partners and other stakeholders. This implementation can be supported through a variety of processes, such as the European Semester and various EUlevel policy initiatives, such as the Work Life Balance Initiative or the upcoming Council Recommendation on high quality early childhood education and care systems. Mutual learning and sharing of good policy practices are key social OMC tools to deliver on these principles. The importance of monitoring the implementation of the Pillar principles has been highlighted. The new child-specific material and social deprivation indicator, approved by the SPC, provides a broader complementary vision of children s well-being and living conditions that can be used alongside other existing monitoring frameworks. Many family-oriented policies qualify for financial support from the European Structural Investment Funds (ESIF), mainly the European Social Fund (ESF) and the European Regional Development Fund (ERDF). European Funding can serve as a catalyst for reforms, which can be later sustained through national budgets. It is therefore important to maintain and even strengthen the existing funding possibilities for children in the upcoming post-2020 programming period. 42
46 Box 3: Gaps in access to social protection for non-standard workers and the selfemployed Non-standard workers and the self-employed, who represent close to 40% of persons in employment in the EU, have more limited access to social protection, in comparison with other workers. European Commission's analysis (2018d) shows that the self-employed generally have no formal coverage concerning unemployment benefits in nine Member States, in three regarding sickness benefits and in eleven regarding accident and occupational injuries insurance. Nonstandard workers are usually formally covered by social security in the same way as standard workers. However, in some countries specific categories of non-standard employees are not mandatorily covered for some or all branches of social security. The main groups for whom this is the case in a significant number of countries are casual and seasonal workers, as well as trainees and apprentices. Furthermore, there are a number of national categories to which restrictions apply in the concerned Member State, including 'marginal part-timers' and 'marginal freelancers' in Austria, 'mini-jobbers' in Germany and 'civil law contracts for a specific task' in Poland. In many countries, the self-employed and non-standard workers may be granted access without de facto being able to build and take up entitlements to benefits. In particular, eligibility conditions and thresholds in some of our social security schemes may constitute an unduly high obstacle for some groups of non-standard workers and for self-employed. In addition, rights are not always preserved and transferred when people move between different labour market statuses, for instance going from employment to self-employment, combining salaried employment and self-employment, starting or closing down a business. Benefits may also be inadequate, meaning that are insufficient or untimely to uphold the standard of living, to live with dignity and prevent individuals from falling into poverty. At the same time, the lack of information about social protection might hinder individuals' ability to exercise their rights. Generic information about social security schemes is available in most Member States, whereas personalised information is not provided to individuals in about half of the Member States. Addressing these gaps is an area of increased policy focus. The European Commission has adopted a proposal for a Council Recommendation, encouraging Member States to provide and improve access to social protection for workers and the self-employed (European Commission (2018d)). 43
47 Box 4: Peer Review on 'Social business for people with mental health difficulties' 27 Nicosia (Cyprus), June 2018 This Peer Review aimed to provide guidance on how to promote social enterprises that support people with mental health problems to enter the labour market. These social economy activities help people with mental health problems to develop and maintain their skills, ideally leading to integration on the open labour market. The Peer Review built on the experience of the Mental Health Services of the Vocational Rehabilitation Unit in Cyprus. It drew on relevant experience and outcomes from other European countries, in particular, on the development and assessment of social entrepreneurship to integrate people with mental issues into the labour market. The Peer Review discussed cooperation between social enterprises and mental health professionals and good examples of social enterprises being developed with and for people with mental health problems. The Vocational Rehabilitation Unit from the Ministry of Health in Cyprus hosted the event and exchanged lessons learned, good and innovative practices with participants from Bulgaria, Croatia, Czech Republic, Finland, Hungary and Latvia. The key messages from the Peer Review can be summarised as follows: Communication and awareness -raising Public and self-stigma is still a major barrier in all spheres of life, especially on the labour market. Stigma needs to be tackled not only to facilitate employment opportunities, but generally to improve the quality of life of people with mental health problems. Communication activities to raise knowledge about mental disorders (also to encourage people to raise their mental health problems more openly) and support in education and employment are ways to address stigma. Sharing experiences and challenges is important to identify lessons learnt and necessary competences to start and maintain a social enterprise and appropriate support for people with mental health difficulties. It is necessary to raise awareness about social enterprises and education of all stakeholders with the help of expert research proves to be helpful. A national label which identifies social enterprises as such, helps to raise consumer awareness, and may attract social entrepreneurs. Support structures and approaches for people with mental health problems Social enterprises have the potential to provide more flexible, innovative and supportive ways to help people with mental health problems. The combination of their entrepreneurial approach with a social mission and a participatory approach enables a more secure work
48 environment which is often similar to the open labour market. The stepping stone approach proves to be a promising form of guiding people with disabilities/mental health issues into the open labour market. This has been tried in Cyrus with work trails and Alternative Employment Programmes, and in Finland local NGOs or social enterprise offer a more secure work environment, but with the same tasks and work conditions as on the open labour market. Obviously, sufficient support for both employee and employer remains necessary. Continuous and personal contact with employers is needed to address stigma, but also to support people once in employment, to promote an inclusive culture and workplace settings suitable for people with mental health problems, and to detect future mental health problems early enough. When trying to find job opportunities for people with mental health problems, it is important to adopt a personal approach that addresses personal needs, but also user choice and participation. The personalised approach focuses on peoples ability (rather than on disability) and their interests. By doing so, there is a higher chance on finding the right place on the labour market. Social enterprises with their inclusive, participatory and flexible working culture are well placed to support this approach. In order to address the various needs of people with mental health problems, support and collaboration from various public actors is needed. Here the Cypriot approach of multidisciplinary teams and the idea to establish cooperation between mental health professionals and social enterprises helps to provide personal support and to prevent serious relapses. Other examples include the involvement of job coaches and occupational therapists. Employment of people with mental health problems requires community-based care and services, so the provision of health and social services at home, rather than in an institution. Especially community mental health services play a vital role to address various needs and to support job integration. Governance and processes Legislation on social enterprise is important to create an environment in which social enterprise can develop, but it often needs to consider a variety of organisational forms of social enterprise. Various ways of funding, often a mixture of private (SROI3, Social Impact Bonds, loans) and public (grants to set up the enterprise, ESF funding) as well as entrepreneurial training are a way to aim for financial sustainability of social enterprises. Tax incentives and an increased use of environmental and social clauses of the EU Public Procurement Directive may also be a way to develop social enterprises. A governmental incubator for social enterprise can help to share knowledge, including business and entrepreneurship advice, especially with regards to helping and involving people with mental health problems. Data collection concerning people with mental health problems is necessary to fully scale the number of people with mental health problems, and therefore the need for help, and to evaluate and monitor effective ways of labour market integration. A multifaceted approach tackling mental ill-health by focusing on health care, employment, education and inclusion of people with mental conditions at all policy levels is necessary. 45
49 Box 5: Highlights from the 2018 Pension Adequacy Report, adopted by EPSCO The 2018 Pension Adequacy Report (PAR) prepared jointly by the Social Protection Committee and the European Commission analyses the adequacy of current and future pensions, that is: how they help maintain the income of men and women for the duration of their retirement and prevent oldage poverty. It supports Member States in designing pension systems that are adequate while remaining financially sustainable, being mutually complementary with the Ageing Report. The PAR report conclusions highlight the following: 1. Despite improvements, there is no room for complacency. Compared to 2008 there are now almost 2 million older people less at risk of poverty or social exclusion, but some 17.3 million are still at risk today. 2. Inequalities remain and some groups require specific policy attention Across Member States, inequalities among older people persist and the risk of poverty or social exclusion increases with age. Pension outcomes are marked by persistent gender differences. People in non-standard or self-employment often face less favourable conditions for accessing and accruing pension rights. 3. Pension systems and labour markets continue to evolve Pensions systems have been one of the areas with the most reforms in recent years across the EU. At the same time, technological advancements and the changing world of work are bringing new challenges, which need to be addressed. While financial sustainability has been in focus during the crisis years, adequacy concerns are starting to be reflected more prominently in recent years. 4. Maintaining the adequacy of future pensions will require further improvements Gains in life expectancy require that future generations work longer and retire later. While narrowing, the pension gap between men and women is likely to persist. Pension systems also need to adapt and extend to cover people in non-standard or self-employment. Finally, the living standards of older people are influenced by wealth and access to services especially health and long-term care. 5. Joint efforts at the EU level need to be pursued The constantly evolving pension policies, the demographic situation and changing labour markets mean that pension adequacy would require continuous monitoring and on-going analysis, to provide Member State and other stakeholders with the information required to anticipate and act on adequacy, alongside financial sustainability challenges. 46
50 Box 6: Peer Review on 'Germany s latest reforms of the long-term care system' 28 Berlin (Germany), January 2018 This Peer Review provided an occasion to compare the German reforms to other Member States policies in the area of long-term care. German stakeholders presented an overview of the latest reforms and good practices to other Member States, while these presented their responses to similar challenges. The event focused on the following key areas: How to define long-term care needs and how to assess individual care needs; How to strengthen long-term care at home and in the community via local counselling and support structures; New types of (semi-)residential arrangements; A better coordination between health and social care services. The German Federal Ministry of Health hosted this event and exchanged lessons learned, good and innovative practices with participants from Austria, Bulgaria, Cyprus, the Czech Republic, France, Ireland, Latvia, Lithuania, Malta, Portugal, Slovenia and Spain. - Summary Conclusions In a society undergoing major demographic changes Member States face common challenges. Long-term care becomes more and more important in times of longevity. The participating Member States all have LTC policies that focus on care at home. Therefore, all guests were very interested in the host country s report on the latest reforms in Germany on the LTC system. It was recognised that not only the question of how do we care for people in need of care, but also the question of how do we support the carers will be essential in the coming years. With regard of the lack of professional care staff, especially in the long run, unconventional solutions like new and semi-residential care options will play a stronger role and a new mix of skills of trained staff will be unavoidable
51 Table 10: Synthesis table of key social challenges and good social outcomes, Social policy area Subcategory EU-28 sum (c) EU-28 sum (g) EA sum (c) EA sum (g) AT BE BG CZ CY DE DK EE EL ES FI FR HU HR IE IT LT LU LV MT NL PL PT RO SE SI SK UK 1. Preventing poverty and social exclusion through inclusive labour markets, adequate and sustainable social protection and high quality services At-risk of poverty and social exclusion for general population (AROPE) c g c c g c c At-risk-of-poverty g g c c c g Severe material deprivation 4 2 c c c c (Quasi-)jobless households (VLWI) c c c/g c c/g c c c c c c c/g c c c/g Severe poverty and/or inequality for general population Severe or persistent poverty (gap, persistence) g g g g c g g c c c c/g c c Income inequality (S80/S20) c g c c g c c c c c Effectiveness of social benefits for the general population g c g g c c c c c g g c Housing situation for general population c c c c g c c c g c c c/g c Poverty and social exclusion of persons in vulnerable situations Poverty and social exclusion of persons with disabilities c c c c c g g c c c c c c c Poverty and social exclusion of Roma 3 c c c Poverty and social exclusion of migrants and refugees 8 7 c c c c c c c c Poverty and social exclusion of low-skilled and unemployed 2 1 c c Regional dimension of poverty and social exclusion 6 3 c c c c c c 2. Breaking the intergenerational transmission of poverty tackling child poverty At-risk of poverty and social exclusion for children (AROPE) c g c c g At-risk-of-poverty g c g g Severe material deprivation c c c c g (Quasi-)jobless households (VLWI) c c c g c g g g Effectiveness of social protection for children g g c g c c g g g c/g c c c g c c c Housing situation for children g c 29 "c" stands for challenge; "g" stands for good social outcome. "c" and "g in blue cells show non-jaf based challenges/good social outcomes. 48
52 Social policy area Subcategory EU-28 sum (c) EU-28 sum (g) EA sum (c) EA sum (g) AT BE BG CZ CY DE DK EE EL ES FI FR HU HR IE IT LT LU LV MT NL PL PT RO SE SI SK UK At-risk of poverty and social exclusion for working age population c g At-risk-of-poverty g c g g g Severe material deprivation 1 c 3. Active inclusion - tackling poverty in working age (Quasi-)jobless households (VLWI) g c c g g g g In work poverty g g g c c g c g g c g c g g Effectiveness of social benefits g c g g c c c c g c c c c Effectiveness of social services 7 5 c c c c c c c Inclusive labour markets g c g g g c/g c Housing situation for working age population 1 1 g Poverty and social exclusion in old age c g c c c At-risk-of-poverty 3 3 c c c Severe material deprivation c c g g c 4. Elderly poverty/adequate Effectiveness of social protection in old age 4 3 c c c c income and living conditions of the elderly Poverty prevention c g c g c g c c/g c Income replacement aspects c c c c c g c c g c g c c c Equal pension rules 1 c Housing situation for the elderly g c c c c c c Health status c c c/g c c c g c c c 5. Health and long-term care Effectiveness of curative or preventive health care c c c g c g c g g c c c Access to health care 10 7 c c c c c c c c c c Cost-effectiveness of health systems c c c c c c c c c c c c c c c c Long-term care g c c c c c c c 49
53 1. Preventing poverty and social exclusion through inclusive labour markets, adequate and sustainable social protection and high quality services 2. Breaking the intergenerational transmission of poverty tackling child poverty 3. Active inclusion - tackling poverty in working age 4. Elderly poverty/adequate income and living conditions of the elderly 5. Health and longterm care Number of Member States with key social challenges per sub-category Long-term care Cost-effectiveness of health systems Access to health care Effectiveness of curative or preventive health care Health status Housing situation for the elderly Equal pension rules Income replacement aspects Poverty prevention Effectiveness of social protection in old age Severe material deprivation At-risk-of-poverty Poverty and social exclusion in old age Housing situation for working age population Inclusive labour markets Effectiveness of social services Effectiveness of social benefits In work poverty (Quasi-)jobless households (VLWI) Severe material deprivation At-risk-of-poverty At-risk of poverty and social exclusion for working age population Housing situation for children Effectiveness of social protection for children (Quasi-)jobless households (VLWI) Severe material deprivation At-risk-of-poverty At-risk of poverty and social exclusion for children (AROPE) Regional dimension of poverty and social exclusion Poverty and social exclusion of low-skilled and unemployed Poverty and social exclusion of migrants and refugees Poverty and social exclusion of Roma Poverty and social exclusion of persons with disabilities Poverty and social exclusion of persons in vulnerable situations Housing situation for general population Effectiveness of social benefits for the general population Income inequality (S80/S20) Severe or persistent poverty (gap, persistence) Severe poverty and/or inequality for general population (Quasi-)jobless households (VLWI) Severe material deprivation At-risk-of-poverty At-risk of poverty and social exclusion for general population (AROPE)
54 V. Special focus on health The European Pillar of Social Rights (EPSR), jointly proclaimed by the European Commission, the European Parliament and the Council of the European Union in 2017, affirms that "Everyone has the right to timely access to affordable, preventive and curative health care of good quality", reiterating the three main common objectives agreed by the Social Open Method of Coordination (OMC) 30 of accessibility, quality, sustainability/affordability and the Common Values and principles in EU health systems 31 of universality, access to good quality care, equity and solidarity. "Accessibility" refers to the possibility for everyone to access healthcare whenever it is needed. "Affordable health care" means that people should not be prevented from using needed care due to high costs and should not be exposed to extreme financial shocks in case of care needs. Healthcare of "good quality means that it should be relevant, safe and effective for all. Finally, countries must be in a sound financial position in financing the health care system ("sustainability") However, rapid population ageing across Member States is increasingly posing a challenge to the accessibility and financial sustainability of the healthcare systems. As reported by the 2018 Ageing Report, the share of elderly (65+) in the total population will increase by 10 percentage points in the next 50 years, challenging even further the ability of Member states to provide good and accessible health care to all and calling for more efficient and effective policies. In this context, the Joint Assessment Framework in the area of health (hereafter JAF Health) has been developed under the guidance of the Indicators Sub-Group of the Social Protection Committee, to constitute an analytical tool to monitor policies within the area of healthcare from a social protection perspective. This tool is used to identify key challenges experienced by the Member States and help to establish their priorities in policy-making. Moreover, the JAF is particularly important for its cross-country comparability dimension, which helps the Member States to evaluate their challenges in relation to each other. In 2017, the Social Protection Committee completed the methodological work related to JAF Health to be used in the context of the social open method of coordination and undertook an indepth analysis of Member States health care systems using the agreed methodology. Extracts of the country profiles prepared during this in-depth analysis are presented in Annex 3. A selection of a limited number of these indicators is also used in the vertical assessment carried out as part of the SPPM assessment to identify key social challenges and good social outcomes (see section 4 of the present report). JAF Health indicators and their breakdown into the four dimensions (outcome; access; quality and non-health care) and two context dimensions, as well as further methodological details, are covered in Box Council conclusions 2006/ C 146/01 51
55 Box 7: JAF health the indicators and assessment approach While acknowledging the challenges relating to finding appropriate indicators reflecting a sufficient description or comparability of the different health care systems, the Social Protection committee agreed on 93 indicators to be included in JAF Health and divided into 71 main indicators (divided into the four dimensions outcome; access; quality and non-health care) and 22 context indicators (divided into the two dimensions (financial and human) resources and socio-economic). The main indicators have to satisfactorily meet the quality criteria agreed at the EU level: they should be relevant for explaining the corresponding policy area, have a clear and accepted normative interpretation, be robust and be statistically validated, provide a sufficient level of cross countries comparability, and, most importantly, should be responsive to policy interventions but not subject to manipulation. The indicators used should include relevant breakdowns by gender, age, and income quintile. The context indicators, on the other hand, provide important information in the qualitative assessment, but are not used in the quantitative assessment exercise. All indicators are assessed for each Member State and compared to the EU average for both levels and changes over the last three years where available. To have the data reported on the same scale, the JAF indicators are standardised and based on the EU 28 average. The standardised levels of JAF indicators thus present the deviation of a Member State with respect to the EU28 average, while standardised changes correspond to the relative change in a Member State compared to the EU28 average. Like in other policy areas analysed through the JAF methodology, a quantitative assessment has been complemented a qualitative assessment (see Annex 3) to ensure that the organisation of the health care provision and financing in each country is duly taken into account in the analysis Table 11 below presents an overview of the 93 agreed indicators. Table 11. Overview of agreed indicators Dimension 1: Outcome (24 indicators) Life expectancy at birth (T); Life expectancy at birth (M); Life expectancy at birth (W); Life expectancy at 65 (T); Life expectancy at 65 (M); Life expectancy at 65 (W); Healthy life years at birth (M); Healthy life years at birth (W); Healthy life years at 65 (M); Healthy life years at 65 (W); Well-being: Self-perceived general health (good + very good); Well-being: Self-perceived general health (good + very good) - income quintile gap (q1-q5); Infant mortality rate (total); Child mortality rate, 1-14 (total); Potential years of life lost (T); Potential years of life lost (M); Potential years of life lost (W); Amenable mortality, standardised death rate per population aged 0-74 years (total); Preventable mortality, standardised death rate per population aged 0-74 years (total); External causes of death excl. transport accidents (total); Well-being: Self-perceived general health (bad + very bad); Well-being: Self-perceived general health (bad + very bad) - income quintile gap (q1-q5); Mental Health: Number of deaths due to intentional self-harm/suicide; Mental Health: Self-reported 12-month depression symptoms 52
56 Dimension 2: Access (7 indicators) Self-reported unmet need for medical care; Self-reported unmet need for medical care - due to cost; Self-reported unmet need for medical care - due to waiting time; Self-reported unmet need for medical care - due to distance; Gap in self-reported unmet need for medical care by income quintile gap (q1-q5); Share of population covered by health insurance; Care utilisation (total, by SES): Number of doctors' consultations per year per inhabitant (generalist and specialist in private practice or as outpatient) Dimension 3: Quality (14 indicators) Colorectal cancer survival rates (total); Breast cancer survival rates (total); Cervical cancer survival rates (total); Breast cancer screening (women); Cervical cancer screening (women); Colorectal cancer screening (T); Colorectal cancer screening (M); Colorectal cancer screening (W); Vaccination coverage for children: against diphtheria, pertussis, tetanus (DTP); Vaccination coverage for children: against measles; Influenza vaccination for 65+; Gap in influenza vaccination for 65+ by educational level (ISCED 0-2 and 5-6); In-hospital mortality following AMI; In-hospital mortality following stroke Dimension 4: Non-health care determinants (26 indicators) Regular daily smoking (total population); Regular daily smoking (15-24); Regular daily smoking (M); Regular daily smoking (W); Gap in regular daily smoking by income quintile (q1-q5); Obesity (total population); Obesity (18-24); Obesity (M); Obesity(W), Gap in obesity by income quintile (q1-q5); Risky single occasion drinking (total population 15+); Risky single occasion drinking (15-24); Risky single occasion drinking (M); Risky single occasion drinking (W); Gap in risky single occasion drinking by educational level (ISCED 0-2 and 5-6); Fruit consumption (total population 15+); Fruit consumption (15-24); Gap in fruit consumption by educational level (ISCED 0-2 and 5-6); Vegetable consumption (total population 15+); Vegetable consumption (15-24); Gap in vegetable consumption by educational level (ISCED 0-2 and 5-6); Physical activity (total population 15+); Physical activity (15-24); Physical activity (M); Physical activity (W); Gap in physical activity by educational level gap (ISCED 0-2 and 5-6) Dimension 5: Context - resources (16 indicators) Current expenditure on health care per capita (in PPS); Current expenditure on health care as % of GDP; Total long-term care expenditure as % of GDP; Expenditure on curative care as % of CHE; Expenditure on rehabilitative care as % of CHE; Expenditure on long-term nursing care as % of CHE; Expenditure on preventive care as a % of CHE; Administrative Expenditure as % of CHE; Practicing and professionally active nurses and midwives per 100K; Health personnel in hospital, FTE per 100K; Government expenditure as % CHE; Compulsory insurance expenditure as % CHE; Voluntary schemes expenditure as % CHE; Household out-of-pocket expenditure as % CHE; Rest of the world expenditure as % CHE Dimension 6: Context socio-economic (6 indicators) Old age dependency ratio; At risk of poverty or social exclusion rate; Share of population 65+; Share of population 80+; Percentage of population with low education; GDP per capita (PPS) Notes: T/M/W refers to total/men/women, respectively 53
57 The outcome area comprises a total of 24 indicators including on healthy life years, self-perceived health, infant and child mortality, life expectancy, potential year of life lost as well as amenable and preventable mortality. For 18 Member States healthy life years and/or life expectancy (at birth or at age 65) remain a key health challenge (AT, BG, CZ, DK, EE, EL, FI, HR, HU, LT, LU, LV, NL, PL, PT, RO, SI 32, SK) with their overall score lower or significantly lower than the EU average despite positive developments in some countries (e. HU) Infant mortality is a major challenge for 4 Member States (SK, MT, BG, RO) and amenable and preventable mortality for 8 Member States (BG, EE, HR, HU, LT, LV, RO, SK), while "potential year of life lost", scored worse than the EU averages only for 8 Member States (BG, EE, LV, LT, HU, PL, RO,SK). With regard to the quality area, the comparisons are conducted through 14 indicators relating to cancer screening and vaccinations coverage for both children and adults. 18 Member States have a key challenge in this area, concerning especially the children's vaccination coverage in which 9 Member States perform worse in one or more vaccines than the average (BG, CY, DK, EE, FR, IT, LT, MT, RO). The resource area intends to evaluate the overall expenditure in the health-care system, taking into account not only the overall per capita expenditure but also the various sources of the expenditure as well as the areas it goes into. For this area, there are 16 indicators including health expenditure per capita, health and LTC expenditure as % of GDP, preventive, curative care expenditure, government expenditure, compulsory insurance expenditure, voluntary scheme, household out-ofpocket expenditure, all as % of total current health expenditure. 22 Member States have at least one indicator performing worse than the EU average, although 7 countries record positive or considerably positive developments in raising the government expenditure or increasing the expenditure in some specific sectors such as rehabilitative care, long-term care or prevention. Regarding the levels of health expenditure as % of GDP, 9 Member States are above the EU average (AT, BE, DE, DK, FR, IE, LU, NL, SE) with a healthcare 'basket' that is relatively broad in terms of medical goods and services covered. The levels are below the EU average for 10 Member States (BG, CY, EL, HR, HU, LT, LV, PL, RO, SK), but this does not imply necessarily low health outcomes as not for all countries the indicators are worse than the EU average (e.g. CY). The area of access includes 7 indicators, namely health insurance coverage, number of doctor's consultations, and 5 indicators of self-reported unmet medical care needs. Correlated to this area is the number of doctors per inhabitant. The link with the access framework is straightforward, as with a lower number of doctors, challenges may arise in the geographical distribution of healthcare, with shortages of health workers in rural areas and islands, reducing the accessibility to the health-care services and so increasing the unmet needs due to distance. The value of universal access to healthcare is widely accepted at EU level and supported by the Charter of Fundamental Rights and the Sustainable Development Goals. As mentioned earlier, also the European Pillar of Social Rights, stresses the importance of universal affordability and health care of good quality. While each Member State is responsible for its own health policy, its 32 Break in time series in
58 organization and financing, the Pillar encourages the Member States to adapt their rules to give effect to this fundamental principle with health systems and to guarantee effective access to a comprehensive basket of (preventive and curative) healthcare services for all population groups. The various possible ways of organising the healthcare system can lead to different results in terms of accessibility in relation to the key dimensions of coverage, availability, and affordability of care and depth of coverage. Table 12 provides an overview relating the organisation and financing of health care systems to key outcomes. Table 12. Financing schemes and unmet medical need results in EU countries: Government schemes Compulsory insurance OOP Basic principle Insurance coverage Unmet need Gap in unmet need mainly tax based DK universal SE universal UK universal IT universal IE universal (not for primary care) ES universal PT universal FI universal LV universal 100* MT universal mainly contribution based DE compulsory social insurance SK compulsory social insurance FR social insurance/universal** LU compulsory social insurance HR compulsory social insurance CZ social insurance/universal** NL compulsory insurance SI social insurance/universal** EE compulsory social insurance RO compulsory social insurance 86* PL compulsory social insurance BE compulsory social insurance HU compulsory social insurance LT compulsory social insurance 96-98* AT compulsory social insurance mainly based on OOP BG compulsory social insurance 92-93* CY means-tested EL compulsory social insurance MT 0.8 Sources: data in the first three columns giving the shares in total expenditure are from Eurostat based on SHA data [hlth_sha11_hf] extracted on 10/10/2017. The classification of the healthcare model is based on information from the MISSOC Comparative Tables (mostly based on the "beneficiary" filed") and JAF Health analyses. Data on unmet need and on insurance coverage are extracted from the latest available version of the JAF database, based respectively on SILC and OECD data. 55

59 Notes: Insurance coverage values with an * means estimated value extracted from the JAF Health country analyses. ** means that all residents are de facto covered. Values worse than the EU average are highlighted in grey. OOP means out-of-pocket payments. In terms of basic organising principle, the different healthcare systems can be classified into three types: universal, insurance-based and "others", which includes atypical systems without a comprehensive organization of healthcare. In terms of financing healthcare expenditure, countries can be divided into three groups: mostly tax-financed (around one third of EU countries), mostly financed by insurance contributions (around half of Member States), mostly relying on out-ofpocket payments (3 Member States). Insurance-based systems rely on the payment of (often mandatory) social insurance contributions, and in one Member State (NL) the curative care is financed by the payment of mandatory insurance premium. Social insurance contributions, then, can be levied on employees, self-employed and/or employers. In terms of accessibility, those countries that have mainly government-financed schemes follow the universality principle reaching a coverage rate of 100% of the population. On the other hand, in those countries where the main source of financing is from (compulsory) insurance schemes, some parts of the population remain uncovered by the health insurance, including vulnerable groups as the unemployed or self-employed. However, some Member States with insurance-based systems, reach a coverage rate of 100% as they have adjustment mechanisms in place. For instance, the government pays contributions on behalf of mostly economically inactive people including children, students, pensioners, women on maternity leave, people on parental leave, the unemployed and asylum seekers. In three Member States (BG, CY, EL), the healthcare system is financed by household out-of-pocket payments to a substantial degree, which impacts the accessibility of healthcare for people with low income. Table 13 below further groups Member States in terms of the challenges identified concerning the three aspects of access (coverage, affordability, and availability of care). In most countries with an identified challenge in access, this concerns the availability of human resources and their geographical distribution. In addition to availability challenges, 7 Member States (EE, HU, PL, SK, EL, BG, RO) face challenges referring to healthcare coverage and 6 (IT, LV, LT, EL, BG, RO) concerning the affordability of healthcare. 3 Member States face challenges in all three areas. Table 13 - Results from JAFH analyses on the challenges in access to healthcare 56
SOCIAL PROTECTION COMMITTEE ANNUAL REPORT 2016 REVIEW OF THE SOCIAL PROTECTION PERFORMANCE MONITOR AND DEVELOPMENTS IN SOCIAL PROTECTION POLICIES
 SOCIAL PROTECTION COMMITTEE ANNUAL REPORT 2016 REVIEW OF THE SOCIAL PROTECTION PERFORMANCE MONITOR AND DEVELOPMENTS IN SOCIAL PROTECTION POLICIES SOCIAL PROTECTION COMMITTEE ANNUAL REPORT 2016 REVIEW OF
2017 Social Protection Performance Monitor (SPPM) dashboard results
 dashboard results") Social Protection Committee SPC/ISG/2018/1/3 FIN 2017 Social Protection Performance Monitor (SPPM) dashboard results (February 2018 update) Table of contents Summary... 2 SPPM dashboard - 2017 results...
Social Protection Committee SPC/ISG/2018/1/3 FIN 2017 Social Protection Performance Monitor (SPPM) dashboard results (February 2018 update) Table of contents Summary... 2 SPPM dashboard - 2017 results...
2015 Social Protection Performance Monitor (SPPM) dashboard results
 dashboard results") Social Protection Committee SPC/ISG/2016/02/4 FIN 2015 Social Protection Performance Monitor (SPPM) dashboard results Table of contents Summary... 2 SPPM dashboard... 3 Detailed review of trends identified
Social Protection Committee SPC/ISG/2016/02/4 FIN 2015 Social Protection Performance Monitor (SPPM) dashboard results Table of contents Summary... 2 SPPM dashboard... 3 Detailed review of trends identified
The key messages which are drawn from this report are contained in doc /16.
 Council of the European Union Brussels, 30 September 2016 (OR. en) 12607/16 SOC 566 EMPL 376 ECOFIN 838 EDUC 303 COVER NOTE From: To: Subject: The Social Protection Committee Permanent Representatives
Social Protection and Social Inclusion in Europe Key facts and figures
 MEMO/08/625 Brussels, 16 October 2008 Social Protection and Social Inclusion in Europe Key facts and figures What is the report and what are the main highlights? The European Commission today published
The Social Protection Committee. Social Europe
 The Protection Committee One of the 4 Advisory Committees: a) i) Economic and Financial Committee (art. 134 TFEU) /LIME indicator sub-group a) ii) Employment Committee (art.150 TFEU)/ IndicatorGroup b)iii)
COVER NOTE The Employment Committee Permanent Representatives Committee (Part I) / Council EPSCO Employment Performance Monitor - Endorsement
 / Council EPSCO Employment Performance Monitor - Endorsement") COUNCIL OF THE EUROPEAN UNION Brussels, 15 June 2011 10666/1/11 REV 1 SOC 442 ECOFIN 288 EDUC 107 COVER NOTE from: to: Subject: The Employment Committee Permanent Representatives Committee (Part I) / Council
COUNCIL OF THE EUROPEAN UNION Brussels, 15 June 2011 10666/1/11 REV 1 SOC 442 ECOFIN 288 EDUC 107 COVER NOTE from: to: Subject: The Employment Committee Permanent Representatives Committee (Part I) / Council
COUNCIL OF THE EUROPEAN UNION. Brussels, 13 June /1/13 REV 1 SOC 409 ECOFIN 444 EDUC 190
 COUNCIL OF THE EUROPEAN UNION Brussels, 13 June 2013 10373/1/13 REV 1 SOC 409 ECOFIN 444 EDUC 190 COVER NOTE from: to: Subject: The Employment Committee Permanent Representatives Committee (Part I) / Council
October 2010 Euro area unemployment rate at 10.1% EU27 at 9.6%
 STAT//180 30 November 20 October 20 Euro area unemployment rate at.1% EU27 at 9.6% The euro area 1 (EA16) seasonally-adjusted 2 unemployment rate 3 was.1% in October 20, compared with.0% in September 4.
PROGRESS TOWARDS THE LISBON OBJECTIVES 2010 IN EDUCATION AND TRAINING
 PROGRESS TOWARDS THE LISBON OBJECTIVES IN EDUCATION AND TRAINING In, reaching the benchmarks for continues to pose a serious challenge for education and training systems in Europe, except for the goal
Special Eurobarometer 418 SOCIAL CLIMATE REPORT
 Special Eurobarometer 418 SOCIAL CLIMATE REPORT Fieldwork: June 2014 Publication: November 2014 This survey has been requested by the European Commission, Directorate-General for Employment, Social Affairs
PROGRESS TOWARDS THE LISBON OBJECTIVES 2010 IN EDUCATION AND TRAINING
 PROGRESS TOWARDS THE LISBON OBJECTIVES IN EDUCATION AND TRAINING In 7, reaching the benchmarks for continues to pose a serious challenge for education and training systems in Europe, except for the goal
January 2010 Euro area unemployment rate at 9.9% EU27 at 9.5%
 STAT//29 1 March 20 January 20 Euro area unemployment rate at 9.9% EU27 at 9.5% The euro area 1 (EA16) seasonally-adjusted 2 unemployment rate 3 was 9.9% in January 20, the same as in December 2009 4.
Flash Eurobarometer 398 WORKING CONDITIONS REPORT
 Flash Eurobarometer WORKING CONDITIONS REPORT Fieldwork: April 2014 Publication: April 2014 This survey has been requested by the European Commission, Directorate-General for Employment, Social Affairs
European Commission. Statistical Annex of Alert Mechanism Report 2017
 European Commission Statistical Annex of Alert Mechanism Report 2017 COMMISSION STAFF WORKING DOCUMENT STATISTICAL ANNEX Accompanying the document REPORT FROM THE COMMISSION TO THE EUROPEAN PARLIAMENT,
EUROPEAN SEMESTER THEMATIC FACTSHEET SOCIAL INCLUSION
 EUROPEAN SEMESTER THEMATIC FACTSHEET SOCIAL INCLUSION 1. INTRODUCTION Fighting poverty or social exclusion is a key political priority for the European Commission. Since 2010, this has been mainstreamed
Securing sustainable and adequate social protection in the EU
 Securing sustainable and adequate social protection in the EU Session on Social Protection & Security IFA 12th Global Conference on Ageing 11 June 2014, HICC Hyderabad India Dr Lieve Fransen European Commission
EUROPEAN SEMESTER THEMATIC FACTSHEET SOCIAL INCLUSION
 EUROPEAN SEMESTER THEMATIC FACTSHEET SOCIAL INCLUSION 1. INTRODUCTION Fighting poverty and social exclusion is a key political priority for the European Commission. Since 2010, this has been included in
Social trends and dynamics of poverty and social exclusion. ESDE conference Brussels 06/02/2013
 Social trends and dynamics of poverty and social exclusion ESDE conference Brussels 06/02/2013 1-in-4 people in the EU at risk of poverty or exclusion 27% of working age population at risk of poverty for
Themes Income and wages in Europe Wages, productivity and the wage share Working poverty and minimum wage The gender pay gap
 5. W A G E D E V E L O P M E N T S At the ETUC Congress in Seville in 27, wage developments in Europe were among the most debated issues. One of the key problems highlighted in this respect was the need
NOTE ON EU27 CHILD POVERTY RATES
 NOTE ON EU7 CHILD POVERTY RATES Research note prepared for Child Poverty Action Group Authors: H. Xavier Jara and Chrysa Leventi Institute for Social and Economic Research (ISER) University of Essex The
The EFTA Statistical Office: EEA - the figures and their use
 The EFTA Statistical Office: EEA - the figures and their use EEA Seminar Brussels, 13 September 2012 1 Statistics Comparable, impartial and reliable statistical data are a prerequisite for a democratic
Growth, competitiveness and jobs: priorities for the European Semester 2013 Presentation of J.M. Barroso,
 Growth, competitiveness and jobs: priorities for the European Semester 213 Presentation of J.M. Barroso, President of the European Commission, to the European Council of 14-1 March 213 Economic recovery
SPC monitoring of the social situation. Solidar Conference EPSR Achieving upwards convergence with a rights based approach?
 SPC monitoring of the social situation Solidar Conference EPSR Achieving upwards convergence with a rights based approach? 6/12/2016 SPC monitoring tools Portfolio of EU-Social Indicators Social Protection
DRAFT JOINT EMPLOYMENT REPORT FROM THE COMMISSION AND THE COUNCIL. accompanying the Communication from the Commission on the Annual Growth Survey 2018
 EUROPEAN COMMISSION Brussels, 22.11.2017 COM(2017) 674 final DRAFT JOINT EMPLOYMENT REPORT FROM THE COMMISSION AND THE COUNCIL accompanying the Communication from the Commission on the Annual Growth Survey
Gender pension gap economic perspective
 Gender pension gap economic perspective Agnieszka Chłoń-Domińczak Institute of Statistics and Demography SGH Part of this research was supported by European Commission 7th Framework Programme project "Employment
Supplement March Trends in poverty and social exclusion between 2012 and March 2014 I 1
 Supplement March 2014 Trends in poverty and social exclusion between 2012 and 2013 March 2014 I 1 This supplement to the Quarterly Review provides in-depth analysis of recent labour market and social developments.
Social Protection Performance Monitor (SPPM)
") Social Protection Performance Monitor (SPPM) Rudi Van Dam Seminarie SPPM/EPM 6 november 2013 Overzicht Plaats in het proces Componenten van de SPPM Monitoring van de EU-2020 target Dashboard of key social
Social Protection Performance Monitor (SPPM) Rudi Van Dam Seminarie SPPM/EPM 6 november 2013 Overzicht Plaats in het proces Componenten van de SPPM Monitoring van de EU-2020 target Dashboard of key social
FIRST REPORT COSTS AND PAST PERFORMANCE
 FIRST REPORT COSTS AND PAST PERFORMANCE DECEMBER 2018 https://eiopa.europa.eu/ PDF ISBN 978-92-9473-131-9 ISSN 2599-8862 doi: 10.2854/480813 EI-AM-18-001-EN-N EIOPA, 2018 Reproduction is authorised provided
HOW RECESSION REFLECTS IN THE LABOUR MARKET INDICATORS
 REPUBLIC OF SLOVENIA HOW RECESSION REFLECTS IN THE LABOUR MARKET INDICATORS Matej Divjak, Irena Svetin, Darjan Petek, Miran Žavbi, Nuška Brnot ??? What is recession?? Why in Europe???? Why in Slovenia?
Aggregation of periods for unemployment benefits. Report on U1 Portable Documents for mobile workers Reference year 2016
 Aggregation of periods for unemployment benefits Report on U1 Portable Documents for mobile workers Reference year 2016 Frederic De Wispelaere & Jozef Pacolet - HIVA KU Leuven June 2017 EUROPEAN COMMISSION
DATA SET ON INVESTMENT FUNDS (IVF) Naming Conventions
 Naming Conventions") DIRECTORATE GENERAL STATISTICS LAST UPDATE: 10 APRIL 2013 DIVISION MONETARY & FINANCIAL STATISTICS ECB-UNRESTRICTED DATA SET ON INVESTMENT FUNDS (IVF) Naming Conventions The series keys related to Investment
DIRECTORATE GENERAL STATISTICS LAST UPDATE: 10 APRIL 2013 DIVISION MONETARY & FINANCIAL STATISTICS ECB-UNRESTRICTED DATA SET ON INVESTMENT FUNDS (IVF) Naming Conventions The series keys related to Investment
Working Poor in Europe
 Working Poor in Europe Georg Fischer Director for Analysis, Evaluation, External Relations DG Employment, social affairs and inclusion 29.7.2013 Clarification of definitions and terms Overall social trends
Country Health Profiles
 State of Health in the EU Country Health Profiles Brussels, November 2017 1 The Country Health Profiles 1. Highlights 2. Health status 3. Risk Factors 4. Health System (description) 5. Performance of Health
Taxation trends in the European Union EU27 tax ratio at 39.8% of GDP in 2007 Steady decline in top personal and corporate income tax rates since 2000
 DG TAXUD STAT/09/92 22 June 2009 Taxation trends in the European Union EU27 tax ratio at 39.8% of GDP in 2007 Steady decline in top personal and corporate income tax rates since 2000 The overall tax-to-gdp
Flash Eurobarometer 408 EUROPEAN YOUTH REPORT
 Flash Eurobarometer EUROPEAN YOUTH REPORT Fieldwork: December 2014 Publication: April 2015 This survey has been requested by the European Commission, Directorate-General for Education and Culture and co-ordinated
COMMISSION DECISION of 23 April 2012 on the second set of common safety targets as regards the rail system (notified under document C(2012) 2084)
 2084)") 27.4.2012 Official Journal of the European Union L 115/27 COMMISSION DECISION of 23 April 2012 on the second set of common safety targets as regards the rail system (notified under document C(2012) 2084)
27.4.2012 Official Journal of the European Union L 115/27 COMMISSION DECISION of 23 April 2012 on the second set of common safety targets as regards the rail system (notified under document C(2012) 2084)
2 ENERGY EFFICIENCY 2030 targets: time for action
 ENERGY EFFICIENCY 2030 targets: time for action The Coalition for Energy Savings The Coalition for Energy Savings strives to make energy efficiency and savings the first consideration of energy policies
Economic, employment and social policies in the new EU 2020 strategy
 EUROPEAN COMMISSION DG Employment, Social Affairs and Equal Opportunities Social protection and inclusion policies Walter WOLF Economic, employment and social policies in the new EU 2020 strategy Skopje,
COMMISSION STAFF WORKING DOCUMENT Accompanying the document. Report form the Commission to the Council and the European Parliament
 EUROPEAN COMMISSION Brussels, 4.5.2018 SWD(2018) 246 final PART 5/9 COMMISSION STAFF WORKING DOCUMENT Accompanying the document Report form the Commission to the Council and the European Parliament on
STAT/14/ October 2014
 STAT/14/158-21 October 2014 Provision of deficit and debt data for 2013 - second notification Euro area and EU28 government deficit at 2.9% and 3.2% of GDP respectively Government debt at 90.9% and 85.4%
Transition from Work to Retirement in EU25
 EUROPEAN CENTRE EUROPÄISCHES ZENTRUM CENTRE EUROPÉEN 1 Asghar Zaidi is Director Research at the European Centre for Social Welfare Policy and Research, Vienna; Michael Fuchs is Researcher at the European
Employment of older workers Research Note no. 5/2015
 Research Note no. 5/2015 E. Őzdemir, T. Ward M. Fuchs, S. Ilinca, O. Lelkes, R. Rodrigues, E. Zolyomi February - 2016 EUROPEAN COMMISSION Directorate-General for Employment, Social Affairs and Inclusion
Flash Eurobarometer 470. Report. Work-life balance
 Work-life balance Survey requested by the European Commission, Directorate-General for Justice and Consumers and co-ordinated by the Directorate-General for Communication This document does not represent
May 2009 Euro area external trade surplus 1.9 bn euro 6.8 bn euro deficit for EU27
 STAT/09/106 17 July 2009 May 2009 Euro area external trade surplus 1.9 6.8 deficit for EU27 The first estimate for the euro area 1 (EA16) trade balance with the rest of the world in May 2009 gave a 1.9
No work in sight? The role of governments and social partners in fostering labour market inclusion of young people
 No work in sight? The role of governments and social partners in fostering labour market inclusion of young people Joint seminar of the European Parliament and EU agencies 30 June 2011 1. Young workers
COMMISSION STAFF WORKING DOCUMENT STATISTICAL ANNEX. Accompanying the document
 EUROPEAN COMMISSION Brussels, 22.11.2017 SWD(2017) 661 final COMMISSION STAFF WORKING DOCUMENT STATISTICAL ANNEX Accompanying the document REPORT FROM THE COMMISSION TO THE EUROPEAN PARLIAMENT, THE COUNCIL,
COUNCIL OF THE EUROPEAN UNION. Brussels, 17 November /11 SOC 1008 ECOFIN 781
 COUNCIL OF THE EUROPEAN UNION Brussels, 17 November 2011 17050/11 SOC 1008 ECOFIN 781 COVER NOTE from: Council Secretariat to: Permanent Representatives Committee / Council (EPSCO) Subject: "The Europe
Macroeconomic Policies in Europe: Quo Vadis A Comment
 Macroeconomic Policies in Europe: Quo Vadis A Comment February 12, 2016 Helene Schuberth Outline Staff Projection of the Euro Area Monetary Policy Investment Rebalancing in the euro area Fiscal Policy
Investment in Germany and the EU
 Investment in Germany and the EU Pedro de Lima Head of the Economics Studies Division Economics Department Berlin 19/12/2016 11/01/2017 1 Slow recovery of investment, with strong heterogeneity Overall
Flash Eurobarometer 441. Report. European SMEs and the Circular Economy
 European SMEs and the Circular Economy Survey requested by the European Commission, Directorate-General Environment and co-ordinated by the Directorate-General for Communication This document does not
EUROSTAT SUPPLEMENTARY TABLE FOR REPORTING GOVERNMENT INTERVENTIONS TO SUPPORT FINANCIAL INSTITUTIONS
 EUROPEAN COMMISSION EUROSTAT Directorate D: Government Finance Statistics (GFS) and Quality Unit D1: Excessive deficit procedure and methodology Unit D2: Excessive deficit procedure (EDP) 1 Unit D3: Excessive
January 2009 Euro area external trade deficit 10.5 bn euro 26.3 bn euro deficit for EU27
 STAT/09/40 23 March 2009 January 2009 Euro area external trade deficit 10.5 26.3 deficit for EU27 The first estimate for the euro area 1 (EA16) trade balance with the rest of the world in January 2009
August 2008 Euro area external trade deficit 9.3 bn euro 27.2 bn euro deficit for EU27
 STAT/08/143 17 October 2008 August 2008 Euro area external trade deficit 9.3 27.2 deficit for EU27 The first estimate for the euro area 1 (EA15) trade balance with the rest of the world in August 2008
Fiscal competitiveness issues in Romania
 Fiscal competitiveness issues in Romania Ionut Dumitru President of the Fiscal Council, Chief Economist Raiffeisen Bank* October 2014 World Bank Doing Business Report Ranking (out of 189 countries) Ease
EUROSTAT SUPPLEMENTARY TABLE FOR REPORTING GOVERNMENT INTERVENTIONS TO SUPPORT FINANCIAL INSTITUTIONS
 EUROPEAN COMMISSION EUROSTAT Directorate D: Government Finance Statistics (GFS) and Quality Unit D1: Excessive deficit procedure and methodology Unit D2: Excessive deficit procedure (EDP) 1 Unit D3: Excessive
State of play of CAP measure Setting up of Young Farmers in the European Union
 State of play of CAP measure Setting up of Young Farmers in the European Union Michael Gregory EN RD Contact Point Seminar CEJA 20 th September 2010 Measure 112 rationale: Measure 112 - Setting up of young
STAT/14/64 23 April 2014
 STAT/14/64 23 April 2014 Provision of deficit and debt data for 2013 - first notification Euro area and EU28 government deficit at 3.0% and 3.3% of GDP respectively Government debt at 92.6% and 87.1% In
Fiscal sustainability challenges in Romania
 Preliminary Draft For discussion only Fiscal sustainability challenges in Romania Bucharest, May 10, 2011 Ionut Dumitru Anca Paliu Agenda 1. Main fiscal sustainability challenges 2. Tax collection issues
September With regularly updated data and charts downloadable here. Social Europe EU Employment and Social Situation I Quarterly Review
 September 2015 With regularly updated data and charts downloadable here September 2015 I 1 This Quarterly Review provides in-depth analysis of recent labour market and social developments. It is prepared
Active Ageing. Fieldwork: September November Publication: January 2012
 Special Eurobarometer 378 Active Ageing SUMMARY Special Eurobarometer 378 / Wave EB76.2 TNS opinion & social Fieldwork: September November 2011 Publication: January 2012 This survey has been requested
PUBLIC PERCEPTIONS OF VAT
 Special Eurobarometer 424 PUBLIC PERCEPTIONS OF VAT REPORT Fieldwork: October 2014 Publication: March 2015 This survey has been requested by the European Commission, Directorate-General for Taxations and
Increasing the fiscal sustainability of health care systems in the European Union to ensure access to high quality health services for all
 Increasing the fiscal sustainability of health care systems in the European Union to ensure access to high quality health services for all EPC Santander, 6 September 2013 Christoph Schwierz Sustainability
Agenda. Background. The European Union standards for establishing poverty and inequality measures
 Workshop on Computing and Analysing Poverty Measures Budapest, - December The European Union standards for establishing poverty and inequality measures Eva Menesi Senior statistician Living Standard, Employment-
Eurofound in-house paper: Part-time work in Europe Companies and workers perspective
 Eurofound in-house paper: Part-time work in Europe Companies and workers perspective Presented by: Eszter Sandor Research Officer, Surveys and Trends 26/03/2010 1 Objectives Examine the patterns of part-time
December 2010 Euro area annual inflation up to 2.2% EU up to 2.6%
 STAT/11/9 14 January 2011 December 2010 Euro area annual inflation up to 2.2% EU up to 2.6% Euro area 1 annual inflation was 2.2% in December 2010 2, up from 1.9% in November. A year earlier the rate was
European Commission Directorate-General "Employment, Social Affairs and Equal Opportunities" Unit E1 - Social and Demographic Analysis
 Research note no. 1 Housing and Social Inclusion By Erhan Őzdemir and Terry Ward ABSTRACT Housing costs account for a large part of household expenditure across the EU.Since everyone needs a house, the
Investment in Ireland and the EU
 Investment in and the EU Debora Revoltella Director Economics Department Dublin April 10, 2017 20/04/2017 1 Real investment: IE v EU country groupings Real investment (2008 = 100) 180 160 140 120 100 80
Scenario for the European Insurance and Occupational Pensions Authority s EU-wide insurance stress test in 2016
 17 March 2016 ECB-PUBLIC Scenario for the European Insurance and Occupational Pensions Authority s EU-wide insurance stress test in 2016 Introduction In accordance with its mandate, the European Insurance
COMMISSION STAFF WORKING DOCUMENT Accompanying the document
 EUROPEAN COMMISSION Brussels, 9.10.2017 SWD(2017) 330 final PART 13/13 COMMISSION STAFF WORKING DOCUMENT Accompanying the document REPORT FROM THE COMMISSION TO THE EUROPEAN PARLIAMENT, THE COUNCIL, THE
Overview of Eurofound surveys
 Overview of Eurofound surveys Dublin 21 st October 2010 Maija Lyly-Yrjänäinen Eurofound data European Working Conditions Survey 91, 95, 00, 05, 10 European Quality of Life Survey 03, 07, 09, 10 (EB), 11
H Marie Skłodowska-Curie Actions (MSCA)
") H2020 Key facts and figures (2014-2020) Number of IE researchers funded by MSCA: EU budget awarded to IE organisations (EUR million): Number of IE organisations in MSCA: 253 116,04 116 In detail, the number
H2020 Key facts and figures (2014-2020) Number of IE researchers funded by MSCA: EU budget awarded to IE organisations (EUR million): Number of IE organisations in MSCA: 253 116,04 116 In detail, the number
EUROPEAN COMMISSION EUROSTAT
 EUROPEAN COMMISSION EUROSTAT Directorate F: Social statistics Unit F-3: Labour market Doc.: Eurostat/F3/LAMAS/29/14 WORKING GROUP LABOUR MARKET STATISTICS Document for item 3.2.1 of the agenda LCS 2012
Traffic Safety Basic Facts Main Figures. Traffic Safety Basic Facts Traffic Safety. Motorways Basic Facts 2015.
 Traffic Safety Basic Facts 2013 - Main Figures Traffic Safety Basic Facts 2015 Traffic Safety Motorways Basic Facts 2015 Motorways General Almost 30.000 people were killed in road accidents on motorways
Library statistical spotlight
 /9/2 Library of the European Parliament 6 4 2 This document aims to provide a picture of the, in particular by looking at car production trends since 2, at the number of enterprises and the turnover they
Employment and Social Developments in Europe
 Employment and Social Developments in Europe Quarterly Review February 2018 Social Europe February 2018 With regularly updated data and charts downloadable here February 2018 I 1 The Employment and Social
in focus Statistics Contents Labour Mar k et Lat est Tr ends 1st quar t er 2006 dat a Em ploym ent r at e in t he EU: t r end st ill up
 Labour Mar k et Lat est Tr ends 1st quar t er 2006 dat a Em ploym ent r at e in t he EU: t r end st ill up Statistics in focus This publication belongs to a quarterly series presenting the European Union
Investment and Investment Finance. the EU and the Polish story. Debora Revoltella
 Investment and Investment Finance the EU and the Polish story Debora Revoltella Director - Economics Department EIB Warsaw 27 February 2017 Narodowy Bank Polski European Investment Bank Contents We look
EU s economic recovery remains uneven and requires more social investment
 E U R O C I T I E S A S S E S S M E N T O F T H E 2 0 1 7 C O U N T RY S P E C I F I C R E C O M M E N D AT I O N S On 22 May, the European Commission published its Country Specific Recommendations (CSRs)
Weighting issues in EU-LFS
 Weighting issues in EU-LFS Carlo Lucarelli, Frank Espelage, Eurostat LFS Workshop May 2018, Reykjavik carlo.lucarelli@ec.europa.eu, frank.espelage@ec.europa.eu 1 1. Introduction The current legislation
Employment and Social Developments in Europe
 Employment and Social Developments in Europe Quarterly Review December 218 Social Europe December 218 With regularly updated data and charts downloadable here December 218 I 1 The Employment and Social
Economic strain over the life course in Europe
 Economic strain over the life course in Europe (towards assessing prospects of ing) Tadas Leoncikas, Joanna Napierala Presentation for the conference Social monitoring and reporting in Europe 7 October
Aggregation of periods or salaries for unemployment benefits. Report on U1 portable documents for migrant workers
 Aggregation of periods or salaries for unemployment benefits Report on U1 portable documents for migrant workers Prof. dr. Jozef Pacolet and Frederic De Wispelaere HIVA KU Leuven June 2015 EUROPEAN COMMISSION
Special Eurobarometer 459. Report. Climate change
 Climate change Survey requested by the European Commission, Directorate-General for Climate Action and co-ordinated by the Directorate- General for Communication This document does not represent the point
LEADER implementation update Leader/CLLD subgroup meeting Brussels, 21 April 2015
 LEADER 2007-2013 implementation update Leader/CLLD subgroup meeting Brussels, 21 April 2015 #LeaderCLLD 2,416 2,416 8.9 Progress on LAG selection in the EU (2007-2013) 3 000 2 500 2 000 2 182 2 239 2 287
Investment in France and the EU
 Investment in and the EU Natacha Valla March 2017 22/02/2017 1 Change relative to 2008Q1 % of GDP Slow recovery of investment, and with strong heterogeneity Overall Europe s recovery in investment is slow,
H Marie Skłodowska-Curie Actions (MSCA)
") H2020 Key facts and figures (2014-2020) Number of BE researchers funded by MSCA: EU budget awarded to BE organisations (EUR million): Number of BE organisations in MSCA: 274 161,04 227 In detail, the number
H2020 Key facts and figures (2014-2020) Number of BE researchers funded by MSCA: EU budget awarded to BE organisations (EUR million): Number of BE organisations in MSCA: 274 161,04 227 In detail, the number
Gender Gap in Pensions: Looking ahead
 DIRECTORATE GENERAL FOR INTERNAL POLICIES POLICY DEPARTMENT C: CITIZENS' RIGHTS AND CONSTITUTIONAL AFFAIRS WOMEN S RIGHTS & GENDER EQUALITY Gender Gap in Pensions: Looking ahead STUDY Abstract The study
The Trend Reversal of the Private Credit Market in the EU
 The Trend Reversal of the Private Credit Market in the EU Key Findings of the ECRI Statistical Package 2016 Roberto Musmeci*, September 2016 The ECRI Statistical Package 2016, Lending to Households and
Issues Paper. 29 February 2012
 29 February 212 Issues Paper In the context of the European semester, the March European Council gives, on the basis of the Commission's Annual Growth Survey, guidance to Member States for the Stability
Joint Report on Social Protection and Social Inclusion 2010
 MEMO/1/62 Brussels, 4 March 1 Joint Report on Social Protection and Social Inclusion 1 What is the Joint Report and what does it cover? The Joint Report reviews the main trends in social protection and
May 2009 Euro area annual inflation down to 0.0% EU down to 0.7%
 STAT/09/88 16 June 2009 May 2009 Euro area annual inflation down to 0.0% EU down to 0.7% Euro area 1 annual inflation was 0.0% in May 2009 2, down from 0.6% in April. A year earlier the rate was 3.7%.
EUROPE 2020 STRATEGY FORECASTING THE LEVEL OF ACHIEVING ITS GOALS BY THE EU MEMBER STATES
 Abstract. Based on the interdependencies that exist between world economies, the effects of the Europe 2020 strategy is going to affect every company no matter if it operates or not in an EU member state.
THE 2015 EU JUSTICE SCOREBOARD
 THE 215 EU JUSTICE SCOREBOARD Communication from the Commission to the European Parliament, the Council, the European Central Bank, the European Economic and Social Committee and the Committee of the Regions
PROVISIONAL DRAFT. Information Note from the Commission. on progress in implementing the UN Convention on the Rights of Persons with Disabilities
 PROVISIONAL DRAFT Information Note from the Commission on progress in implementing the UN Convention on the Rights of Persons with Disabilities Introduction This note, which is based on the third report
H Marie Skłodowska-Curie Actions (MSCA)
") H2020 Key facts and figures (2014-2020) Number of NL researchers funded by MSCA: EU budget awarded to NL organisations (EUR million): Number of NL organisations in MSCA: 427 268.91 351 In detail, the number
H2020 Key facts and figures (2014-2020) Number of NL researchers funded by MSCA: EU budget awarded to NL organisations (EUR million): Number of NL organisations in MSCA: 427 268.91 351 In detail, the number
In 2009 a 6.5 % rise in per capita social protection expenditure matched a 6.1 % drop in EU-27 GDP
 Population and social conditions Authors: Giuseppe MOSSUTI, Gemma ASERO Statistics in focus 14/2012 In 2009 a 6.5 % rise in per capita social protection expenditure matched a 6.1 % drop in EU-27 GDP Expenditure
Report on the distribution of direct payments to agricultural producers (financial year 2016)
") Report on the distribution of direct payments to agricultural producers (financial year 2016) Every year, the Commission publishes the distribution of direct payments to farmers by Member State. Figures
Report on the distribution of direct payments to agricultural producers (financial year 2016) Every year, the Commission publishes the distribution of direct payments to farmers by Member State. Figures
The Eurostars Programme
 The Eurostars Programme The EU-EUREKA joint funding programme for R&D-performing SMEs What is EUREKA? > 2 > EUREKA is a public network supporting R&D-performing businesses > Established in 1985 by French
Two years to go to the 2014 European elections European Parliament Eurobarometer (EB/EP 77.4)
") Directorate-General for Communication PUBLIC OPINION MONITORING UNIT Brussels, 23 October 2012. Two years to go to the 2014 European elections European Parliament Eurobarometer (EB/EP 77.4) FOCUS ON THE
Directorate-General for Communication PUBLIC OPINION MONITORING UNIT Brussels, 23 October 2012. Two years to go to the 2014 European elections European Parliament Eurobarometer (EB/EP 77.4) FOCUS ON THE