Probability Basics. Part 1: What is Probability? INFO-1301, Quantitative Reasoning 1 University of Colorado Boulder. March 1, 2017 Prof.
|
|
|
- Catherine Patrick
- 5 years ago
- Views:
Transcription
1 Probability Basics Part 1: What is Probability? INFO-1301, Quantitative Reasoning 1 University of Colorado Boulder March 1, 2017 Prof. Michael Paul

2 Variables We can describe events like coin flips as variables Domain: {Heads, Tails} X = Heads
3 Random variables What if we haven t flipped the coin yet? Domain: {Heads, Tails} A random variable is a variable whose value is unknown (but we know the probability of the possible values) X =? P(X = Heads) = 0.5 P(X = Tails) = 0.5 Also called a random process
4 Random variables What if we haven t flipped the coin yet? Domain: {Heads, Tails} The domain of a random variable is called the sample space The values of random variables are called outcomes X =? P(X = Heads) = 0.5 P(X = Tails) = 0.5
5 Random variables Random variables can be any variables with unknown values Confusingly, the outcomes of random variables aren t necessarily random the winner of an election the weather tomorrow Ø These outcomes are unknown (even though they don t happen randomly) and can be treated as random variables with probabilities

6 What is probability? The probability of an outcome is the proportion of times the outcome would occur if we observed the random process an infinite number of times. If we kept flipping a coin forever, half of the outcomes would be heads and half would be tails X =? This property is known as the Law of Large Numbers
7 What is probability? Since probabilities correspond to proportions, probabilities are between 0 and 1 (inclusive) Or written as a percentage: (0%, 100%) Can also be written as a fraction, like ½ Odds are a slightly different way of measuring the same proportions. Odds are the ratio of the probability of what you re measuring to the probability of all other outcomes. For example, 1:1 odds means both probabilities are 0.5
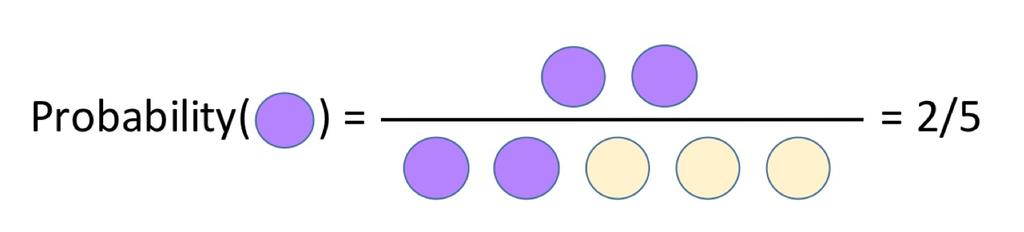
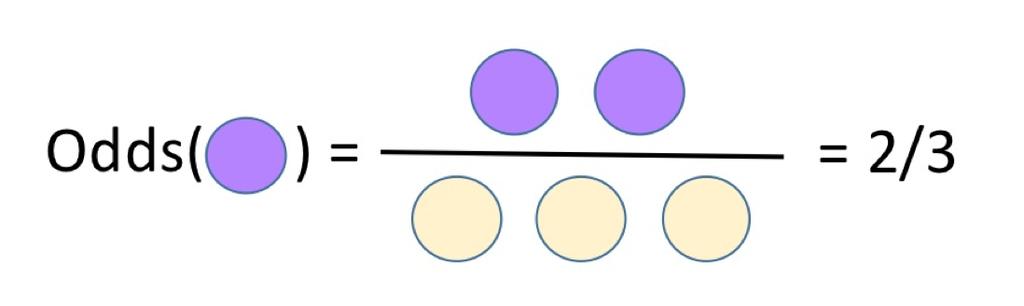
8 What is probability?
9 What is probability? A distribution is a table of the probabilities of all possible outcomes of a random variable (that is, all values in the sample space) The sum of all probabilities in a distribution must equal 1 (or 100%)
10 What is probability? What about outcomes that can t happen more than once? the probability that Mark Zuckerberg becomes president in 2021 the probability that I am telling the truth right now An alternative way to define probability is as a degree of belief
11 Why probability? Probability allows us to reason about data even when it is uncertain We can predict what will happen in the future and make decisions accordingly If you are 95% certain it will rain tomorrow, go ahead cancel your plans If you are 55% certain it will rain, you should wait and see what happens
12 Why probability? Probability allows us to reason about data even when it is uncertain We can estimate long-term tendencies to determine risk If you invest in a stock that has a 0.53 probability of increasing in value on any day, then you have a nearequal chance of gaining or losing money on a given day But long term, you can expect to gain more than you lose
13 Central Tendency You learned about mean, median, and mode as measures of central tendency of variables For random variables, the standard measure of central tendency is the expected value What do we expect the outcome to be? the expected value of X E[X] = Σ x P(X = x) x The expected value is equivalent to the mean of the outcomes if you repeat a process forever The probability that X has value x times the value x Sum over all values (denoted x ) in the sample space
14 Central Tendency Example: Let X be the number of times a coin comes up Heads after 3 flips P(X = 0) = P(X = 1) = P(X = 2) = P(X = 3) = This is the distribution of X E[X] = = 1.5 This is a weighted average of all the values, weighted by their probability
15 Central Tendency If you take the average of multiple outcomes of a random variable, the average will most often be close to the expected value This is proven by the Central Limit Theorem More formally, the theorem states that if you take the average of multiple random outcomes multiple times, the averages will form a bell curve where the mean is the expected value of that random variable We ll return to this in coming weeks
The normal distribution is a theoretical model derived mathematically and not empirically.
 Sociology 541 The Normal Distribution Probability and An Introduction to Inferential Statistics Normal Approximation The normal distribution is a theoretical model derived mathematically and not empirically.
Elementary Statistics Lecture 5
 Elementary Statistics Lecture 5 Sampling Distributions Chong Ma Department of Statistics University of South Carolina Chong Ma (Statistics, USC) STAT 201 Elementary Statistics 1 / 24 Outline 1 Introduction
TOPIC: PROBABILITY DISTRIBUTIONS
 TOPIC: PROBABILITY DISTRIBUTIONS There are two types of random variables: A Discrete random variable can take on only specified, distinct values. A Continuous random variable can take on any value within
The Central Limit Theorem. Sec. 8.2: The Random Variable. it s Distribution. it s Distribution
 The Central Limit Theorem Sec. 8.1: The Random Variable it s Distribution Sec. 8.2: The Random Variable it s Distribution X p and and How Should You Think of a Random Variable? Imagine a bag with numbers
2011 Pearson Education, Inc
 Statistics for Business and Economics Chapter 4 Random Variables & Probability Distributions Content 1. Two Types of Random Variables 2. Probability Distributions for Discrete Random Variables 3. The Binomial
The Binomial Probability Distribution
 The Binomial Probability Distribution MATH 130, Elements of Statistics I J. Robert Buchanan Department of Mathematics Fall 2017 Objectives After this lesson we will be able to: determine whether a probability
Theoretical Foundations
 Theoretical Foundations Probabilities Monia Ranalli monia.ranalli@uniroma2.it Ranalli M. Theoretical Foundations - Probabilities 1 / 27 Objectives understand the probability basics quantify random phenomena
Chapter 8. Variables. Copyright 2004 Brooks/Cole, a division of Thomson Learning, Inc.
 Chapter 8 Random Variables Copyright 2004 Brooks/Cole, a division of Thomson Learning, Inc. 8.1 What is a Random Variable? Random Variable: assigns a number to each outcome of a random circumstance, or,
The Elements of Probability and Statistics
 The Elements of Probability and Statistics E. Bruce Pitman The University at Buffalo CCR Workshop June 27, 2017 Basic Premise of Statistics One can group statistical ideas into a few groupings Aggregation
Section M Discrete Probability Distribution
 Section M Discrete Probability Distribution A random variable is a numerical measure of the outcome of a probability experiment, so its value is determined by chance. Random variables are typically denoted
STA 320 Fall Thursday, Dec 5. Sampling Distribution. STA Fall
 STA 320 Fall 2013 Thursday, Dec 5 Sampling Distribution STA 320 - Fall 2013-1 Review We cannot tell what will happen in any given individual sample (just as we can not predict a single coin flip in advance).
If the distribution of a random variable x is approximately normal, then
 Confidence Intervals for the Mean (σ unknown) In many real life situations, the standard deviation is unknown. In order to construct a confidence interval for a random variable that is normally distributed
Module 4: Probability
 Module 4: Probability 1 / 22 Probability concepts in statistical inference Probability is a way of quantifying uncertainty associated with random events and is the basis for statistical inference. Inference
Part 1 In which we meet the law of averages. The Law of Averages. The Expected Value & The Standard Error. Where Are We Going?
 1 The Law of Averages The Expected Value & The Standard Error Where Are We Going? Sums of random numbers The law of averages Box models for generating random numbers Sums of draws: the Expected Value Standard
ECE 295: Lecture 03 Estimation and Confidence Interval
 ECE 295: Lecture 03 Estimation and Confidence Interval Spring 2018 Prof Stanley Chan School of Electrical and Computer Engineering Purdue University 1 / 23 Theme of this Lecture What is Estimation? You
X = x p(x) 1 / 6 1 / 6 1 / 6 1 / 6 1 / 6 1 / 6. x = 1 x = 2 x = 3 x = 4 x = 5 x = 6 values for the random variable X
 1 / 6 1 / 6 1 / 6 1 / 6 1 / 6 1 / 6. x = 1 x = 2 x = 3 x = 4 x = 5 x = 6 values for the random variable X") Calculus II MAT 146 Integration Applications: Probability Calculating probabilities for discrete cases typically involves comparing the number of ways a chosen event can occur to the number of ways all
Calculus II MAT 146 Integration Applications: Probability Calculating probabilities for discrete cases typically involves comparing the number of ways a chosen event can occur to the number of ways all
Chapter 5. Sampling Distributions
 Lecture notes, Lang Wu, UBC 1 Chapter 5. Sampling Distributions 5.1. Introduction In statistical inference, we attempt to estimate an unknown population characteristic, such as the population mean, µ,
Value (x) probability Example A-2: Construct a histogram for population Ψ.
 probability Example A-2: Construct a histogram for population Ψ.") Calculus 111, section 08.x The Central Limit Theorem notes by Tim Pilachowski If you haven t done it yet, go to the Math 111 page and download the handout: Central Limit Theorem supplement. Today s lecture
Calculus 111, section 08.x The Central Limit Theorem notes by Tim Pilachowski If you haven t done it yet, go to the Math 111 page and download the handout: Central Limit Theorem supplement. Today s lecture
2017 Fall QMS102 Tip Sheet 2
 Chapter 5: Basic Probability 2017 Fall QMS102 Tip Sheet 2 (Covering Chapters 5 to 8) EVENTS -- Each possible outcome of a variable is an event, including 3 types. 1. Simple event = Described by a single
Section Distributions of Random Variables
 Section 8.1 - Distributions of Random Variables Definition: A random variable is a rule that assigns a number to each outcome of an experiment. Example 1: Suppose we toss a coin three times. Then we could
Chapter 3: Probability Distributions and Statistics
 Chapter 3: Probability Distributions and Statistics Section 3.-3.3 3. Random Variables and Histograms A is a rule that assigns precisely one real number to each outcome of an experiment. We usually denote
CHAPTER 4 DISCRETE PROBABILITY DISTRIBUTIONS
 CHAPTER 4 DISCRETE PROBABILITY DISTRIBUTIONS A random variable is the description of the outcome of an experiment in words. The verbal description of a random variable tells you how to find or calculate
MA 1125 Lecture 14 - Expected Values. Wednesday, October 4, Objectives: Introduce expected values.
 MA 5 Lecture 4 - Expected Values Wednesday, October 4, 27 Objectives: Introduce expected values.. Means, Variances, and Standard Deviations of Probability Distributions Two classes ago, we computed the
STAT 201 Chapter 6. Distribution
 STAT 201 Chapter 6 Distribution 1 Random Variable We know variable Random Variable: a numerical measurement of the outcome of a random phenomena Capital letter refer to the random variable Lower case letters
Statistics vs. statistics
 Statistics vs. statistics Question: What is Statistics (with a capital S)? Definition: Statistics is the science of collecting, organizing, summarizing and interpreting data. Note: There are 2 main ways
Have you ever wondered whether it would be worth it to buy a lottery ticket every week, or pondered on questions such as If I were offered a choice
 Section 8.5: Expected Value and Variance Have you ever wondered whether it would be worth it to buy a lottery ticket every week, or pondered on questions such as If I were offered a choice between a million
4.3 Normal distribution
 43 Normal distribution Prof Tesler Math 186 Winter 216 Prof Tesler 43 Normal distribution Math 186 / Winter 216 1 / 4 Normal distribution aka Bell curve and Gaussian distribution The normal distribution
Probability Distributions: Discrete
 Probability Distributions: Discrete INFO-2301: Quantitative Reasoning 2 Michael Paul and Jordan Boyd-Graber FEBRUARY 19, 2017 INFO-2301: Quantitative Reasoning 2 Paul and Boyd-Graber Probability Distributions:
Probability Distribution Unit Review
 Probability Distribution Unit Review Topics: Pascal's Triangle and Binomial Theorem Probability Distributions and Histograms Expected Values, Fair Games of chance Binomial Distributions Hypergeometric
Statistics, Their Distributions, and the Central Limit Theorem
 Statistics, Their Distributions, and the Central Limit Theorem MATH 3342 Sections 5.3 and 5.4 Sample Means Suppose you sample from a popula0on 10 0mes. You record the following sample means: 10.1 9.5 9.6
MATH 104 CHAPTER 5 page 1 NORMAL DISTRIBUTION
 MATH 104 CHAPTER 5 page 1 NORMAL DISTRIBUTION We have examined discrete random variables, those random variables for which we can list the possible values. We will now look at continuous random variables.
Problems from 9th edition of Probability and Statistical Inference by Hogg, Tanis and Zimmerman:
 Math 224 Fall 207 Homework 5 Drew Armstrong Problems from 9th edition of Probability and Statistical Inference by Hogg, Tanis and Zimmerman: Section 3., Exercises 3, 0. Section 3.3, Exercises 2, 3, 0,.
5.1 Personal Probability
 5. Probability Value Page 1 5.1 Personal Probability Although we think probability is something that is confined to math class, in the form of personal probability it is something we use to make decisions
19. CONFIDENCE INTERVALS FOR THE MEAN; KNOWN VARIANCE
 19. CONFIDENCE INTERVALS FOR THE MEAN; KNOWN VARIANCE We assume here that the population variance σ 2 is known. This is an unrealistic assumption, but it allows us to give a simplified presentation which
Normal distribution Approximating binomial distribution by normal 2.10 Central Limit Theorem
 1.1.2 Normal distribution 1.1.3 Approimating binomial distribution by normal 2.1 Central Limit Theorem Prof. Tesler Math 283 Fall 216 Prof. Tesler 1.1.2-3, 2.1 Normal distribution Math 283 / Fall 216 1
CHAPTER 8 PROBABILITY DISTRIBUTIONS AND STATISTICS
 CHAPTER 8 PROBABILITY DISTRIBUTIONS AND STATISTICS 8.1 Distribution of Random Variables Random Variable Probability Distribution of Random Variables 8.2 Expected Value Mean Mean is the average value of
Chapter 6: Random Variables. Ch. 6-3: Binomial and Geometric Random Variables
 Chapter : Random Variables Ch. -3: Binomial and Geometric Random Variables X 0 2 3 4 5 7 8 9 0 0 P(X) 3???????? 4 4 When the same chance process is repeated several times, we are often interested in whether
Section 7.5 The Normal Distribution. Section 7.6 Application of the Normal Distribution
 Section 7.6 Application of the Normal Distribution A random variable that may take on infinitely many values is called a continuous random variable. A continuous probability distribution is defined by
Section Random Variables and Histograms
 Section 3.1 - Random Variables and Histograms Definition: A random variable is a rule that assigns a number to each outcome of an experiment. Example 1: Suppose we toss a coin three times. Then we could
Section Distributions of Random Variables
 Section 8.1 - Distributions of Random Variables Definition: A random variable is a rule that assigns a number to each outcome of an experiment. Example 1: Suppose we toss a coin three times. Then we could
Experimental Probability - probability measured by performing an experiment for a number of n trials and recording the number of outcomes
 MDM 4U Probability Review Properties of Probability Experimental Probability - probability measured by performing an experiment for a number of n trials and recording the number of outcomes Theoretical
PROBABILITY AND STATISTICS, A16, TEST 1
 PROBABILITY AND STATISTICS, A16, TEST 1 Name: Student number (1) (1.5 marks) i) Let A and B be mutually exclusive events with p(a) = 0.7 and p(b) = 0.2. Determine p(a B ) and also p(a B). ii) Let C and
Binomial Random Variables. Binomial Random Variables
 Bernoulli Trials Definition A Bernoulli trial is a random experiment in which there are only two possible outcomes - success and failure. 1 Tossing a coin and considering heads as success and tails as
Chapter 9. Idea of Probability. Randomness and Probability. Basic Practice of Statistics - 3rd Edition. Chapter 9 1. Introducing Probability
 Chapter 9 Introducing Probability BPS - 3rd Ed. Chapter 9 1 Idea of Probability Probability is the science of chance behavior Chance behavior is unpredictable in the short run but has a regular and predictable
Chapter 6: Random Variables
 Chapter 6: Random Variables Section 6.1 Discrete and Continuous Random Variables The Practice of Statistics, 4 th edition For AP* STARNES, YATES, MOORE Chapter 6 Random Variables 6.1 Discrete and Continuous
Week 7. Texas A& M University. Department of Mathematics Texas A& M University, College Station Section 3.2, 3.3 and 3.4
 Week 7 Oğuz Gezmiş Texas A& M University Department of Mathematics Texas A& M University, College Station Section 3.2, 3.3 and 3.4 Oğuz Gezmiş (TAMU) Topics in Contemporary Mathematics II Week7 1 / 19
Confidence Intervals. σ unknown, small samples The t-statistic /22
 Confidence Intervals σ unknown, small samples The t-statistic 1 /22 Homework Read Sec 7-3. Discussion Question pg 365 Do Ex 7-3 1-4, 6, 9, 12, 14, 15, 17 2/22 Objective find the confidence interval for
Distributions in Excel
 Distributions in Excel Functions Normal Inverse normal function Log normal Random Number Percentile functions Other distributions Probability Distributions A random variable is a numerical measure of the
Week 1 Quantitative Analysis of Financial Markets Probabilities
 Week 1 Quantitative Analysis of Financial Markets Probabilities Christopher Ting http://www.mysmu.edu/faculty/christophert/ Christopher Ting : christopherting@smu.edu.sg : 6828 0364 : LKCSB 5036 October
6 If and then. (a) 0.6 (b) 0.9 (c) 2 (d) Which of these numbers can be a value of probability distribution of a discrete random variable
 0.6 (b) 0.9 (c) 2 (d) Which of these numbers can be a value of probability distribution of a discrete random variable") 1. A number between 0 and 1 that is use to measure uncertainty is called: (a) Random variable (b) Trial (c) Simple event (d) Probability 2. Probability can be expressed as: (a) Rational (b) Fraction (c)
1. A number between 0 and 1 that is use to measure uncertainty is called: (a) Random variable (b) Trial (c) Simple event (d) Probability 2. Probability can be expressed as: (a) Rational (b) Fraction (c)
Binomial and Normal Distributions
 Binomial and Normal Distributions Bernoulli Trials A Bernoulli trial is a random experiment with 2 special properties: The result of a Bernoulli trial is binary. Examples: Heads vs. Tails, Healthy vs.
variance risk Alice & Bob are gambling (again). X = Alice s gain per flip: E[X] = Time passes... Alice (yawning) says let s raise the stakes
![variance risk Alice & Bob are gambling (again). X = Alice s gain per flip: E[X] = Time passes... Alice (yawning) says let s raise the stakes](/thumbs/92/110156041.jpg "variance risk Alice & Bob are gambling (again). X = Alice s gain per flip: E[X] = Time passes... Alice (yawning) says let s raise the stakes") Alice & Bob are gambling (again). X = Alice s gain per flip: risk E[X] = 0... Time passes... Alice (yawning) says let s raise the stakes E[Y] = 0, as before. Are you (Bob) equally happy to play the new
Alice & Bob are gambling (again). X = Alice s gain per flip: risk E[X] = 0... Time passes... Alice (yawning) says let s raise the stakes E[Y] = 0, as before. Are you (Bob) equally happy to play the new
Consider the following examples: ex: let X = tossing a coin three times and counting the number of heads
 Overview Both chapters and 6 deal with a similar concept probability distributions. The difference is that chapter concerns itself with discrete probability distribution while chapter 6 covers continuous
Statistics 6 th Edition
 Statistics 6 th Edition Chapter 5 Discrete Probability Distributions Chap 5-1 Definitions Random Variables Random Variables Discrete Random Variable Continuous Random Variable Ch. 5 Ch. 6 Chap 5-2 Discrete
Quantitative Methods for Economics, Finance and Management (A86050 F86050)
") Quantitative Methods for Economics, Finance and Management (A86050 F86050) Matteo Manera matteo.manera@unimib.it Marzio Galeotti marzio.galeotti@unimi.it 1 This material is taken and adapted from Guy Judge
Quantitative Methods for Economics, Finance and Management (A86050 F86050) Matteo Manera matteo.manera@unimib.it Marzio Galeotti marzio.galeotti@unimi.it 1 This material is taken and adapted from Guy Judge
HUDM4122 Probability and Statistical Inference. February 23, 2015
 HUDM4122 Probability and Statistical Inference February 23, 2015 In the last class We studied Bayes Theorem and the Law of Total Probability Any questions or comments? Today Chapter 4.8 in Mendenhall,
ECON 214 Elements of Statistics for Economists 2016/2017
 ECON 214 Elements of Statistics for Economists 2016/2017 Topic The Normal Distribution Lecturer: Dr. Bernardin Senadza, Dept. of Economics bsenadza@ug.edu.gh College of Education School of Continuing and
Chapter 3 Discrete Random Variables and Probability Distributions
 Chapter 3 Discrete Random Variables and Probability Distributions Part 3: Special Discrete Random Variable Distributions Section 3.5 Discrete Uniform Section 3.6 Bernoulli and Binomial Others sections
Example - Let X be the number of boys in a 4 child family. Find the probability distribution table:
 Chapter8 Probability Distributions and Statistics Section 8.1 Distributions of Random Variables tthe value of the result of the probability experiment is a RANDOM VARIABLE. Example - Let X be the number
Chapter Seven: Confidence Intervals and Sample Size
 Chapter Seven: Confidence Intervals and Sample Size A point estimate is: The best point estimate of the population mean µ is the sample mean X. Three Properties of a Good Estimator 1. Unbiased 2. Consistent
Binomial Distribution and Discrete Random Variables
 3.1 3.3 Binomial Distribution and Discrete Random Variables Prof. Tesler Math 186 Winter 2017 Prof. Tesler 3.1 3.3 Binomial Distribution Math 186 / Winter 2017 1 / 16 Random variables A random variable
6.1 Binomial Theorem
 Unit 6 Probability AFM Valentine 6.1 Binomial Theorem Objective: I will be able to read and evaluate binomial coefficients. I will be able to expand binomials using binomial theorem. Vocabulary Binomial
Chapter 9: Sampling Distributions
 Chapter 9: Sampling Distributions 9. Introduction This chapter connects the material in Chapters 4 through 8 (numerical descriptive statistics, sampling, and probability distributions, in particular) with
The Binomial and Geometric Distributions. Chapter 8
 The Binomial and Geometric Distributions Chapter 8 8.1 The Binomial Distribution A binomial experiment is statistical experiment that has the following properties: The experiment consists of n repeated
The Central Limit Theorem
 The Central Limit Theorem Patrick Breheny March 1 Patrick Breheny University of Iowa Introduction to Biostatistics (BIOS 4120) 1 / 29 Kerrich s experiment Introduction The law of averages Mean and SD of
Version A. Problem 1. Let X be the continuous random variable defined by the following pdf: 1 x/2 when 0 x 2, f(x) = 0 otherwise.
 = 0 otherwise.") Math 224 Q Exam 3A Fall 217 Tues Dec 12 Version A Problem 1. Let X be the continuous random variable defined by the following pdf: { 1 x/2 when x 2, f(x) otherwise. (a) Compute the mean µ E[X]. E[X] x
Math 224 Q Exam 3A Fall 217 Tues Dec 12 Version A Problem 1. Let X be the continuous random variable defined by the following pdf: { 1 x/2 when x 2, f(x) otherwise. (a) Compute the mean µ E[X]. E[X] x
ECON 214 Elements of Statistics for Economists
 ECON 214 Elements of Statistics for Economists Session 7 The Normal Distribution Part 1 Lecturer: Dr. Bernardin Senadza, Dept. of Economics Contact Information: bsenadza@ug.edu.gh College of Education
We use probability distributions to represent the distribution of a discrete random variable.
 Now we focus on discrete random variables. We will look at these in general, including calculating the mean and standard deviation. Then we will look more in depth at binomial random variables which are
MATH1215: Mathematical Thinking Sec. 08 Spring Worksheet 9: Solution. x P(x)
") N. Name: MATH: Mathematical Thinking Sec. 08 Spring 0 Worksheet 9: Solution Problem Compute the expected value of this probability distribution: x 3 8 0 3 P(x) 0. 0.0 0.3 0. Clearly, a value is missing
N. Name: MATH: Mathematical Thinking Sec. 08 Spring 0 Worksheet 9: Solution Problem Compute the expected value of this probability distribution: x 3 8 0 3 P(x) 0. 0.0 0.3 0. Clearly, a value is missing
Sampling Distributions and the Central Limit Theorem
 Sampling Distributions and the Central Limit Theorem February 18 Data distributions and sampling distributions So far, we have discussed the distribution of data (i.e. of random variables in our sample,
Section 0: Introduction and Review of Basic Concepts
 Section 0: Introduction and Review of Basic Concepts Carlos M. Carvalho The University of Texas McCombs School of Business mccombs.utexas.edu/faculty/carlos.carvalho/teaching 1 Getting Started Syllabus
Binomial and Normal Distributions. Example: Determine whether the following experiments are binomial experiments. Explain.
 Binomial and Normal Distributions Objective 1: Determining if an Experiment is a Binomial Experiment For an experiment to be considered a binomial experiment, four things must hold: 1. The experiment is
Statistics Class 15 3/21/2012
 Statistics Class 15 3/21/2012 Quiz 1. Cans of regular Pepsi are labeled to indicate that they contain 12 oz. Data Set 17 in Appendix B lists measured amounts for a sample of Pepsi cans. The same statistics
Some Characteristics of Data
 Some Characteristics of Data Not all data is the same, and depending on some characteristics of a particular dataset, there are some limitations as to what can and cannot be done with that data. Some key
6 Central Limit Theorem. (Chs 6.4, 6.5)
") 6 Central Limit Theorem (Chs 6.4, 6.5) Motivating Example In the next few weeks, we will be focusing on making statistical inference about the true mean of a population by using sample datasets. Examples?
6 Central Limit Theorem (Chs 6.4, 6.5) Motivating Example In the next few weeks, we will be focusing on making statistical inference about the true mean of a population by using sample datasets. Examples?
MULTIPLE CHOICE. Choose the one alternative that best completes the statement or answers the question.
 Module 5 Test Name MULTIPLE CHOICE. Choose the one alternative that best completes the statement or answers the question. Calculate the specified probability ) Suppose that T is a random variable. Given
Introduction to Probability and Inference HSSP Summer 2017, Instructor: Alexandra Ding July 19, 2017
 Introduction to Probability and Inference HSSP Summer 2017, Instructor: Alexandra Ding July 19, 2017 Please fill out the attendance sheet! Suggestions Box: Feedback and suggestions are important to the
Managerial Finance FINC 474. Welcome to week 2 of FINC 474. This is a great time to ask questions about last week.
 Managerial Finance FINC 474 Session 2 Present and future value Dr. Michael Kinsman Welcome to week 2 of FINC 474 Last week we Discussed what you learned in accounting Talked about and used ratio analysis
. This would be denoted. P (heads-up) = 1 2.
 = 1 2.") Epected utility There is a fundamental difference between a cup of coffee and maybe having a cup of coffee; that is to say, there is an important distinction between being given a cup of coffee and someone
Epected utility There is a fundamental difference between a cup of coffee and maybe having a cup of coffee; that is to say, there is an important distinction between being given a cup of coffee and someone
Department of Quantitative Methods & Information Systems. Business Statistics. Chapter 6 Normal Probability Distribution QMIS 120. Dr.
 Department of Quantitative Methods & Information Systems Business Statistics Chapter 6 Normal Probability Distribution QMIS 120 Dr. Mohammad Zainal Chapter Goals After completing this chapter, you should
NORMAL RANDOM VARIABLES (Normal or gaussian distribution)
") NORMAL RANDOM VARIABLES (Normal or gaussian distribution) Many variables, as pregnancy lengths, foot sizes etc.. exhibit a normal distribution. The shape of the distribution is a symmetric bell shape.
NORMAL RANDOM VARIABLES (Normal or gaussian distribution) Many variables, as pregnancy lengths, foot sizes etc.. exhibit a normal distribution. The shape of the distribution is a symmetric bell shape.
Statistics for Business and Economics
 Statistics for Business and Economics Chapter 5 Continuous Random Variables and Probability Distributions Ch. 5-1 Probability Distributions Probability Distributions Ch. 4 Discrete Continuous Ch. 5 Probability
Managerial Finance FINC 474. Welcome to week 2 of FINC 474. This is a great time to ask questions about last week.
 Managerial Finance FINC 474 Session 2 Present and future value Dr. Michael Kinsman Welcome to week 2 of FINC 474 Last week we Discussed what you learned in accounting Talked about and used ratio analysis
Hypothesis Tests: One Sample Mean Cal State Northridge Ψ320 Andrew Ainsworth PhD
 Hypothesis Tests: One Sample Mean Cal State Northridge Ψ320 Andrew Ainsworth PhD MAJOR POINTS Sampling distribution of the mean revisited Testing hypotheses: sigma known An example Testing hypotheses:
Chapter 5. Continuous Random Variables and Probability Distributions. 5.1 Continuous Random Variables
 Chapter 5 Continuous Random Variables and Probability Distributions 5.1 Continuous Random Variables 1 2CHAPTER 5. CONTINUOUS RANDOM VARIABLES AND PROBABILITY DISTRIBUTIONS Probability Distributions Probability
Business Statistics 41000: Probability 4
 Business Statistics 41000: Probability 4 Drew D. Creal University of Chicago, Booth School of Business February 14 and 15, 2014 1 Class information Drew D. Creal Email: dcreal@chicagobooth.edu Office:
5.1 Mean, Median, & Mode
 5.1 Mean, Median, & Mode definitions Mean: Median: Mode: Example 1 The Blue Jays score these amounts of runs in their last 9 games: 4, 7, 2, 4, 10, 5, 6, 7, 7 Find the mean, median, and mode: Example 2
SECTION 4.4: Expected Value
 15 SECTION 4.4: Expected Value This section tells you why most all gambling is a bad idea. And also why carnival or amusement park games are a bad idea. Random Variables Definition: Random Variable A random
5.4 Normal Approximation of the Binomial Distribution
 5.4 Normal Approximation of the Binomial Distribution Bernoulli Trials have 3 properties: 1. Only two outcomes - PASS or FAIL 2. n identical trials Review from yesterday. 3. Trials are independent - probability
Review of commonly missed questions on the online quiz. Lecture 7: Random variables] Expected value and standard deviation. Let s bet...
![Review of commonly missed questions on the online quiz. Lecture 7: Random variables] Expected value and standard deviation. Let s bet...](/thumbs/83/87696499.jpg "Review of commonly missed questions on the online quiz. Lecture 7: Random variables] Expected value and standard deviation. Let s bet...") Recap Review of commonly missed questions on the online quiz Lecture 7: ] Statistics 101 Mine Çetinkaya-Rundel OpenIntro quiz 2: questions 4 and 5 September 20, 2011 Statistics 101 (Mine Çetinkaya-Rundel)
Recap Review of commonly missed questions on the online quiz Lecture 7: ] Statistics 101 Mine Çetinkaya-Rundel OpenIntro quiz 2: questions 4 and 5 September 20, 2011 Statistics 101 (Mine Çetinkaya-Rundel)
Statistical Methods in Practice STAT/MATH 3379
 Statistical Methods in Practice STAT/MATH 3379 Dr. A. B. W. Manage Associate Professor of Mathematics & Statistics Department of Mathematics & Statistics Sam Houston State University Overview 6.1 Discrete
Example. Chapter 8 Probability Distributions and Statistics Section 8.1 Distributions of Random Variables
 Chapter 8 Probability Distributions and Statistics Section 8.1 Distributions of Random Variables You are dealt a hand of 5 cards. Find the probability distribution table for the number of hearts. Graph
Lecture 6: Chapter 6
 Lecture 6: Chapter 6 C C Moxley UAB Mathematics 3 October 16 6.1 Continuous Probability Distributions Last week, we discussed the binomial probability distribution, which was discrete. 6.1 Continuous Probability
DESCRIBING DATA: MESURES OF LOCATION
 DESCRIBING DATA: MESURES OF LOCATION A. Measures of Central Tendency Measures of Central Tendency are used to pinpoint the center or average of a data set which can then be used to represent the typical
Part V - Chance Variability
 Part V - Chance Variability Dr. Joseph Brennan Math 148, BU Dr. Joseph Brennan (Math 148, BU) Part V - Chance Variability 1 / 78 Law of Averages In Chapter 13 we discussed the Kerrich coin-tossing experiment.
MATH 118 Class Notes For Chapter 5 By: Maan Omran
 MATH 118 Class Notes For Chapter 5 By: Maan Omran Section 5.1 Central Tendency Mode: the number or numbers that occur most often. Median: the number at the midpoint of a ranked data. Ex1: The test scores
Discrete Probability Distributions
 Discrete Probability Distributions Answers 1. Suppose a statistician working for CSULA Federal Credit Union collected data on ATM withdrawals for the population of the credit union s customers. The statistician
The Mathematics of Normality
 MATH 110 Week 9 Chapter 17 Worksheet The Mathematics of Normality NAME Normal (bell-shaped) distributions play an important role in the world of statistics. One reason the normal distribution is important
4 Random Variables and Distributions
 4 Random Variables and Distributions Random variables A random variable assigns each outcome in a sample space. e.g. called a realization of that variable to Note: We ll usually denote a random variable
Confidence Intervals for the Mean. When σ is known
 Confidence Intervals for the Mean When σ is known Objective Find the confidence interval for the mean when s is known. Intro Suppose a college president wishes to estimate the average age of students attending