The Elements of Probability and Statistics
|
|
|
- Aleesha O’Brien’
- 5 years ago
- Views:
Transcription
1 The Elements of Probability and Statistics E. Bruce Pitman The University at Buffalo CCR Workshop June 27, 2017
2 Basic Premise of Statistics One can group statistical ideas into a few groupings Aggregation Likelihood Regression Variation We will see examples of these notions throughout.
3 Definitions The probability P of an event A is the fraction of possible favorable outcomes the number of favorable outcomes f divided by the total number of possible outcomes n. P(A) = f /n
4 Definitions 2 The probability of drawing an ace from a standard deck of cards is 4/52. What this really means is that if I draw one card from a deck and see whether or not it is an ace and then replace the card and shuffle well, and repeat this exercise infinitely many times, then over the long haul I will find an ace 7.69% of the time.
5 Definitions 3 However, suppose you are playing a game in which all outcomes are equally likely (e.g., rolling dice), and you are on a losing streak. You might commit the Gamblers Fallacy if you believe your losing streak makes it more likely that you ll roll the numbers you want on the next roll (because you re due ). The truth is that your odds don t change; you start over with each roll.
6 Definitions 4 A sample space is the set of all possible outcomes of an experiment. An event is a specific outcome of an experiment. So if you are rolling a die, the sample space is the set A = {1, 2, 3, 4, 5, 6}. The event roll an odd number is the set E = {1, 3, 5}.

7 One perspective
8 Counting Say we have a sample of n items How to measure average? numbers = {1, 3, 3, 4, 5, 6, 7, 7, 7, 9}
9 Counting Say we have a sample of n items How to measure average? mean x = numbers = {1, 3, 3, 4, 5, 6, 7, 7, 7, 9} sum number = = = 5.2
10 Counting Say we have a sample of n items How to measure average? mean x = numbers = {1, 3, 3, 4, 5, 6, 7, 7, 7, 9} sum number = = = 5.2 median = middle value = 5.5
11 Counting Say we have a sample of n items How to measure average? mean x = numbers = {1, 3, 3, 4, 5, 6, 7, 7, 7, 9} sum number = = = 5.2 median = middle value = 5.5 mode is the item that occurs with the highest frequency = 7

12 What does it mean?

13 More counting For a different sample, say morenumbers = {1, 5, 7, 8, 9}, the mean = 6 and the median = 7
14 Independent items Two events are independent if the occurrence of one of the events gives us no information about whether or not the other event will occur; that is, the events have no influence on each other. If events A and B are independent, then the probability of A and B happening is just the product p(a)p(b). If events are not independent, the joint probability is not the product but we don t know what it is without more information. So, for instance, whether it rains tomorrow, and whether or not tomorrow is a Friday, are - really - independent.
15 Independent items again The total number of points the Bills score in a season and the number of points the Dolphins score are independent. But the total number of points the Bills score in a season and the event Tyrod is the starting quarterback in December are dependent.

16 So now we know some statistics
17 Variance Variance is how wide of a spread is present in the data σ 2 = 1 n 1 n (x x) 2 j=1 For morenumbers, we have σ 2 = 1 4 [(1 6)2 + (5 6) 2 + (7 6) 2 + (8 6) 2 + (9 6) 2 ] = 1 4 [ ] = 1 (40) = 10 4 The standard deviation is the square root of the variance = σ 2 For our data, σ = 10
18 A story about variance 1997 Grand Forks floods. Billions of damage That winters snowfall especially heavy and the potential for flood well known.
19 A story about variance 1997 Grand Forks floods. Billions of damage That winters snowfall especially heavy and the potential for flood well known. Two months before the spring melt started, NWS predicted the Red River would crest at 49.
20 A story about variance 1997 Grand Forks floods. Billions of damage That winters snowfall especially heavy and the potential for flood well known. Two months before the spring melt started, NWS predicted the Red River would crest at 49. Levees around the river were built for 51 flood.
21 A story about variance 1997 Grand Forks floods. Billions of damage That winters snowfall especially heavy and the potential for flood well known. Two months before the spring melt started, NWS predicted the Red River would crest at 49. Levees around the river were built for 51 flood. 54 actual flood maximum.
22 A story about variance 1997 Grand Forks floods. Billions of damage That winters snowfall especially heavy and the potential for flood well known. Two months before the spring melt started, NWS predicted the Red River would crest at 49. Levees around the river were built for 51 flood. 54 actual flood maximum. But NWS prediction was +/- 9. They did not want to talk about the variance because they were afraid prople would not believe them if notions of uncertainty were discussed. There was a 1-in-3 chance the river would overtop the 51 levee.
23 Quartiles Divide the sample set into quarters and plot the marks of first and third quartile. Think of it this way - the first quartile is the median of the items below the median. The third quartile is median of the items above the median. One could do a similar thing in tenths.
24 Box plot A diagram that show the maximum, minimum, the first and third quartiles, and the median. boxnumbers = {12, 20, 35, 38, 45, 60, 62, 70, 78, 90, 99} If there are a whole lot of numbers and the max/min are way out, you sometimes mark the 10% and 90% points.

25 Histogram Plot items using rectangles to represent the number of items within a range of values. agenumbers = {1, 2, 2, 3, 3, 3, 3, 4, 4, 5, 6}
26 Histograms You need to decide how many rectangles to include. Too few doesn t give a sense of numbers and frequency. Too many is both more work and often doesn t give a good frequency reading most of the time the numbers who appear are unique. This is referred to as binning.
27 More histograms Name Grade Bullwinkle 84 Rocky 91 Bugs 75 Daffy 68 Wylie 98 Mickey 78 Minnie 77 Lucy 86 Linus 94 Charlie 64 Patty 59 Donald 54 Sam 89 Taz 76


28 More histograms-2
29 More histograms-3
30 Normal Distribution What happens then when there are infinitely many bins - one for every real number? You get a probability distribution a function. The grandaddy of distributions is the Normal distribution. The normal distribution is the bell-shaped distribution you have probably seen.
31 Normal Distribution-2 The normal distribution has several properties that are useful in practice. The mean is the highest value. The distribution is symmetric about its mean. Within ±1 standard deviation (i.e. ±1σ) of the mean is 68% of the mass of the distribution, and 95% within ±2σ. The first and third quartiles are at about ±.67σ.

32 Normal Distribution-3
33 Other distributions Log-normal, Chi, and there are others. Useful in many applications. But they (usually) don t have the nice properties above. Although, for example, the log-nomal is always positive.
34 Conditional probability If a probability represent the odds of something happening say the odds of event A happening, or p(a), then the conditional probability is the odds of something happening given additional information the odds of A given that B has occurred, or p(a B). Lots of words but the idea is simple. A conditional probability accounts for additional information that informs the odds. So the odds of rolling a 3 with a single die is 1/6. What is the conditional probability of rolling a 3 given the roll was odd? It is 1/3. That is, A = {1, 3, 5}, so P(3 odd) = 1/3.
35 Conditional probability-2 Formally the conditional probability is given as p(a B) = p(a B) p(b) Notice how this works for rolling a 3. Since rolling a 3 and rolling an odd number are dependent, the probability of rolling a 3 AND odd is the same as rolling a 3. p(3 odd) = p(3 odd) p(odd) = 1/6 1/2 = 1/3
36 Exercise in counting A fair coin is flipped three times. What is the probability of at least one head? Given that the first flip came up tails, what is the probability of at least one head?
37 Exercise in counting-2 The sample space S = {HHH, HHT, HTH, THH, HTT, THT, TTH, TTT }. The event at least 1 head is E1 = {HHH, HHT, HTH, THH, HTT, THT, TTH} which has a 7/8 probability. The event first flip tails is E2 = {THH, THT, TTH, TTT }. So P(at least one head first flip tails) = 3/4.

38 Sounds too good to be true
, and asks you Do you want to switch doors or stick with your original choice?")
39 Monty Hall problem Monty lets you choose a door from 3 possibilities. Behind one of the doors is a new car, behind the other two are goats. You choose door 1. Monty reveals what is behind one of the remaining doors (he knows where the car is), and asks you Do you want to switch doors or stick with your original choice? What should you do?


40 Monty solution
41 Monty solutuon-2 Door 1 Door 2 Door 3 Result if Result stay with 1 switch car goat goat car goat goat car goat goat car goat goat car goat car if
42 Bayes Theorem From the definition of conditional probability p(a B) = p(a B) p(b) But it is equally true that we can reverse the roles of A and B p(b A) = p(a B) p(a) Solving for the intersection we have p(a B) = p(b A)p(A) p(b)
43 Conditional probability again An easy and more private test for the AIDS antibodies was developed, particularly for use in Africa, where men won t to go clinics to be tested. This new test could be administered at home. If you carried the antibodies, the test would confirm 99.1% of the time with a 0.9% false negative. The test gave a true negative 99.6%, and false positive 0.4%. So the question is: If you administered the test, and it came back positive, how likely is it that you actually have AIDS?
44 Conditional probability again-2 Well in the US, the incidence of AIDS is about.5% or so. If you think about it, the fact that the test gives false positives about 0.4% of the time (so 4 for every 1000 people tested) should give pause when 5 of every 1000 people tested actually carry the antibodies. The detailed arithmetic calculates P(D +) = P(+ D) P(D) P(+ D) P(D) + P(+ N) P(N) = = i.e. about a 55.5% chance you have AIDS and 44.5% chance you don t. Why such a low probability?
45 Conditional probability again-3 In Natal, South Africa, the incidence of AIDS is about 40%. Repeating the same calculation, but with this incidence rate one has P(D +) = P(+ D) P(D) P(+ D) P(D) + P(+ N) P(N) = = i.e. 99.4% chance you DO have AIDS
46 Conditional probability again-4 OK so what is really going on? Say we have 1000 people in Africa. In a random sample 400 of them have AIDS, and virtually all of them will test positive. An additional 4 of the 600 who are healthy will also test positive (false positive). So if you are one of the 404 people who test positive, your odds are 400/404 that in fact you have AIDS. In the US, of 1000 people only 5 will have AIDS, and 4 others will test positive. So if you test positive, your odds of having AIDS are 5/9 or about 55%.

47 So now we know more statistics
48 Scatter plot A scatter plot is a diagram showing two variables of a dataset.
49 More scatter plot If I just give you the points on a graph, what do you see?
50 More scatter plot If I add labels and a fitting curve, does it take on more meaning for you?
51 Correlation and causation In statistics, dependence refers to any statistical relationship between two random variables or two sets of data. Correlation refers to any of a broad class of statistical relationships involving dependence. Because two things are correlated does not mean one causes the other. A correlation between age and height in children is fairly causally transparent, but a correlation between mood and health in people is less so. Does improved mood lead to improved health, or does good health lead to good mood, or both? Or does some other factor underlie both? In other words, a correlation can be taken as evidence for a possible causal relationship, but cannot indicate what the causal relationship, if any, might be.
52 Measure of correlation There is a definition of a coefficient of correlation ρ(x, Y ) = E[(X x)(y y)] σ X σ Y

53 Correlation and causation
54 Positive, negative, and no correlation

55 Positive, negative, and no correlation-2
56 Positive, negative, and no correlation-3
57 Correlation and causation In a widely studied example, numerous epidemiological studies showed that women taking combined hormone replacement therapy (HRT) also had a lower-than-average incidence of coronary heart disease (CHD), leading doctors to propose that HRT was protective against CHD. But randomized controlled trials showed that HRT caused a small but statistically significant increase in risk of CHD. Re-analysis of the original data showed that women undertaking HRT were more likely to be from higher socio-economic groups, and thus had better-than-average diet and exercise regimens. The use of HRT and decreased incidence of coronary heart disease were coincident effects of a common cause (i.e. the benefits associated with a higher socio-economic status), rather than cause and effect, as had been supposed.
58 Correlation and causation-3 As ice cream sales increase, the rate of drowning deaths increases sharply. Therefore, ice cream consumption causes drowning.

59 Correlation and causation-4
60 Regression Given the data in, say, a scatterplot, can you draw a line (or some other curve) that fits the data well? Summer Income as a Function of Hours Worked Income Hours per Week
61 Regression 2 Summer Income (y) as a Function of Hours Worked (x) Income (y) Hours per Week (x)
62 Regression 3 How to tell which is the best line? l 3 l 5 Y dependent variable l 1 l 2 l X independent variable
63 Regression 3 How to tell which is the best line? l 3 d 3 l 5 Y dependent variable l 1 d1 l 2 d 2 l 4 d 4 d X independent variable
64 Regression 4
65 Regression 5 The best fit goes back to the correlation coefficient ρ(x, Y ) = E[(X x)(y y)] σ X σ Y The idea is to minimize this (actually the square of this)

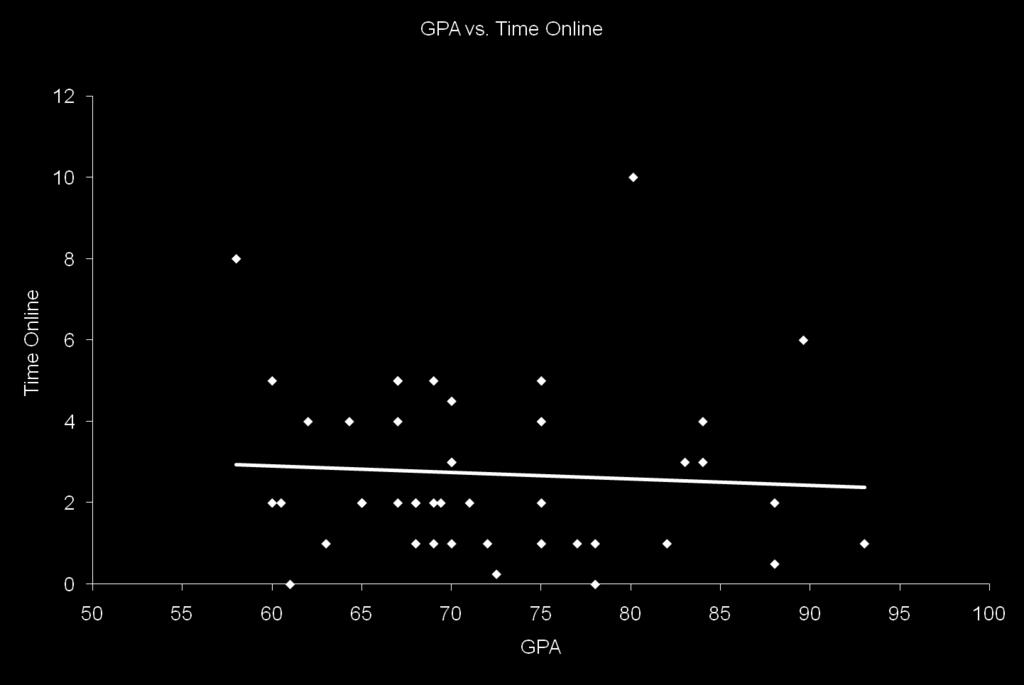
66 Outliers
67 Outliers - 2 GPA vs. Time Online 12 10? Time Online 8 6 4? GPA
68 Outlier - 3 GPA vs. Time Online Time Online GPA
69 Outliers - 4 But you always want to look carefully and ask Is this datum telling me something important? For example, it could signify a low probability but high impact event.
70 Other Statistical Predictions If you have a large sample size, you can make predictions about behavior in the aggregate. For example, Amazon uses your own buying habits and those of others like you, to give you recommendations for other purchases. The Federal Reserve makes predictions on the growth of the economy.
71 Statistical Predictions - 2 A different kind of prediction arises from statistical transitions. For example, data on home ownership shows that, if you live in a single family home currently, odds are 95% that you will be in a single family home next year. On the other hand, if you live in an apartment/multi-household setting currently, odds are 15% that you will live in a single family unit next year. We have enough data to be able to make a claim like this.
72 Statistical Predictions - 3 We can create an array that explains the situation, showing the current status on the left, and your status next year from the top. single multi single multi You can repeat this for subsequent years too.
73 Statistical Predictions - 4 Be wary of the variability in your predictions. The average weather in WNY is 53 and a 40% chance of precipitation. The varibility that is, variance matters!

74 Now that you are an expert
CHAPTER 6 Random Variables
 CHAPTER 6 Random Variables 6.1 Discrete and Continuous Random Variables The Practice of Statistics, 5th Edition Starnes, Tabor, Yates, Moore Bedford Freeman Worth Publishers Discrete and Continuous Random
Part V - Chance Variability
 Part V - Chance Variability Dr. Joseph Brennan Math 148, BU Dr. Joseph Brennan (Math 148, BU) Part V - Chance Variability 1 / 78 Law of Averages In Chapter 13 we discussed the Kerrich coin-tossing experiment.
Random Variables. 6.1 Discrete and Continuous Random Variables. Probability Distribution. Discrete Random Variables. Chapter 6, Section 1
 6.1 Discrete and Continuous Random Variables Random Variables A random variable, usually written as X, is a variable whose possible values are numerical outcomes of a random phenomenon. There are two types
Chapter 6: Random Variables
 Chapter 6: Random Variables Section 6.1 Discrete and Continuous Random Variables The Practice of Statistics, 4 th edition For AP* STARNES, YATES, MOORE Chapter 6 Random Variables 6.1 Discrete and Continuous
HHH HHT HTH THH HTT THT TTH TTT
 AP Statistics Name Unit 04 Probability Period Day 05 Notes Discrete & Continuous Random Variables Random Variable: Probability Distribution: Example: A probability model describes the possible outcomes
6.1 Discrete and Continuous Random Variables. 6.1A Discrete random Variables, Mean (Expected Value) of a Discrete Random Variable
 of a Discrete Random Variable") 6.1 Discrete and Continuous Random Variables 6.1A Discrete random Variables, Mean (Expected Value) of a Discrete Random Variable Random variable Takes numerical values that describe the outcomes of some
6.1 Discrete and Continuous Random Variables 6.1A Discrete random Variables, Mean (Expected Value) of a Discrete Random Variable Random variable Takes numerical values that describe the outcomes of some
Data that can be any numerical value are called continuous. These are usually things that are measured, such as height, length, time, speed, etc.
 Chapter 8 Measures of Center Data that can be any numerical value are called continuous. These are usually things that are measured, such as height, length, time, speed, etc. Data that can only be integer
Chapter 7. Random Variables
 Chapter 7 Random Variables Making quantifiable meaning out of categorical data Toss three coins. What does the sample space consist of? HHH, HHT, HTH, HTT, TTT, TTH, THT, THH In statistics, we are most
The binomial distribution
 The binomial distribution The coin toss - three coins The coin toss - four coins The binomial probability distribution Rolling dice Using the TI nspire Graph of binomial distribution Mean & standard deviation
Probability & Sampling The Practice of Statistics 4e Mostly Chpts 5 7
 Probability & Sampling The Practice of Statistics 4e Mostly Chpts 5 7 Lew Davidson (Dr.D.) Mallard Creek High School Lewis.Davidson@cms.k12.nc.us 704-786-0470 Probability & Sampling The Practice of Statistics
ECON 214 Elements of Statistics for Economists 2016/2017
 ECON 214 Elements of Statistics for Economists 2016/2017 Topic Probability Distributions: Binomial and Poisson Distributions Lecturer: Dr. Bernardin Senadza, Dept. of Economics bsenadza@ug.edu.gh College
Econ 6900: Statistical Problems. Instructor: Yogesh Uppal
 Econ 6900: Statistical Problems Instructor: Yogesh Uppal Email: yuppal@ysu.edu Lecture Slides 4 Random Variables Probability Distributions Discrete Distributions Discrete Uniform Probability Distribution
Probability Basics. Part 1: What is Probability? INFO-1301, Quantitative Reasoning 1 University of Colorado Boulder. March 1, 2017 Prof.
 Probability Basics Part 1: What is Probability? INFO-1301, Quantitative Reasoning 1 University of Colorado Boulder March 1, 2017 Prof. Michael Paul Variables We can describe events like coin flips as variables
Mean, Median and Mode. Lecture 2 - Introduction to Probability. Where do they come from? We start with a set of 21 numbers, Statistics 102
 Mean, Median and Mode Lecture 2 - Statistics 102 Colin Rundel January 15, 2013 We start with a set of 21 numbers, ## [1] -2.2-1.6-1.0-0.5-0.4-0.3-0.2 0.1 0.1 0.2 0.4 ## [12] 0.4 0.5 0.6 0.7 0.7 0.9 1.2
Statistics for IT Managers
 Statistics for IT Managers 95-796, Fall 212 Course Overview Instructor: Daniel B. Neill (neill@cs.cmu.edu) TAs: Eli (Han) Liu, Kats Sasanuma, Sriram Somanchi, Skyler Speakman, Quan Wang, Yiye Zhang (see
Sec$on 6.1: Discrete and Con.nuous Random Variables. Tuesday, November 14 th, 2017
 Sec$on 6.1: Discrete and Con.nuous Random Variables Tuesday, November 14 th, 2017 Discrete and Continuous Random Variables Learning Objectives After this section, you should be able to: ü COMPUTE probabilities
Lesson 97 - Binomial Distributions IBHL2 - SANTOWSKI
 Lesson 97 - Binomial Distributions IBHL2 - SANTOWSKI Opening Exercise: Example #: (a) Use a tree diagram to answer the following: You throwing a bent coin 3 times where P(H) = / (b) THUS, find the probability
Opening Exercise: Lesson 91 - Binomial Distributions IBHL2 - SANTOWSKI
 08-0- Lesson 9 - Binomial Distributions IBHL - SANTOWSKI Opening Exercise: Example #: (a) Use a tree diagram to answer the following: You throwing a bent coin times where P(H) = / (b) THUS, find the probability
CHAPTER 10: Introducing Probability
 CHAPTER 10: Introducing Probability The Basic Practice of Statistics 6 th Edition Moore / Notz / Fligner Lecture PowerPoint Slides Chapter 10 Concepts 2 The Idea of Probability Probability Models Probability
The following content is provided under a Creative Commons license. Your support
 MITOCW Recitation 6 The following content is provided under a Creative Commons license. Your support will help MIT OpenCourseWare continue to offer high quality educational resources for free. To make
Probability distributions
 Probability distributions Introduction What is a probability? If I perform n eperiments and a particular event occurs on r occasions, the relative frequency of this event is simply r n. his is an eperimental
Basic Procedure for Histograms
 Basic Procedure for Histograms 1. Compute the range of observations (min. & max. value) 2. Choose an initial # of classes (most likely based on the range of values, try and find a number of classes that
Module 4: Probability
 Module 4: Probability 1 / 22 Probability concepts in statistical inference Probability is a way of quantifying uncertainty associated with random events and is the basis for statistical inference. Inference
Example - Let X be the number of boys in a 4 child family. Find the probability distribution table:
 Chapter8 Probability Distributions and Statistics Section 8.1 Distributions of Random Variables tthe value of the result of the probability experiment is a RANDOM VARIABLE. Example - Let X be the number
The normal distribution is a theoretical model derived mathematically and not empirically.
 Sociology 541 The Normal Distribution Probability and An Introduction to Inferential Statistics Normal Approximation The normal distribution is a theoretical model derived mathematically and not empirically.
Example - Let X be the number of boys in a 4 child family. Find the probability distribution table:
 Chapter7 Probability Distributions and Statistics Distributions of Random Variables tthe value of the result of the probability experiment is a RANDOM VARIABLE. Example - Let X be the number of boys in
Statistical Methods for NLP LT 2202
 LT 2202 Lecture 3 Random variables January 26, 2012 Recap of lecture 2 Basic laws of probability: 0 P(A) 1 for every event A. P(Ω) = 1 P(A B) = P(A) + P(B) if A and B disjoint Conditional probability:
Chapter 4. Section 4.1 Objectives. Random Variables. Random Variables. Chapter 4: Probability Distributions
 Chapter 4: Probability s 4. Probability s 4. Binomial s Section 4. Objectives Distinguish between discrete random variables and continuous random variables Construct a discrete probability distribution
Chapter 7 Study Guide: The Central Limit Theorem
 Chapter 7 Study Guide: The Central Limit Theorem Introduction Why are we so concerned with means? Two reasons are that they give us a middle ground for comparison and they are easy to calculate. In this
Stat 101 Exam 1 - Embers Important Formulas and Concepts 1
 1 Chapter 1 1.1 Definitions Stat 101 Exam 1 - Embers Important Formulas and Concepts 1 1. Data Any collection of numbers, characters, images, or other items that provide information about something. 2.
Descriptive Statistics (Devore Chapter One)
") Descriptive Statistics (Devore Chapter One) 1016-345-01 Probability and Statistics for Engineers Winter 2010-2011 Contents 0 Perspective 1 1 Pictorial and Tabular Descriptions of Data 2 1.1 Stem-and-Leaf
Descriptive Statistics (Devore Chapter One) 1016-345-01 Probability and Statistics for Engineers Winter 2010-2011 Contents 0 Perspective 1 1 Pictorial and Tabular Descriptions of Data 2 1.1 Stem-and-Leaf
Homework Assigment 1. Nick Polson 41000: Business Statistics Booth School of Business. Due in Week 3
 Homework Assigment 1 Nick Polson 41000: Business Statistics Booth School of Business Due in Week 3 Problem 1: Probability Answer the following statements TRUE or FALSE, providing a succinct explanation
Theoretical Foundations
 Theoretical Foundations Probabilities Monia Ranalli monia.ranalli@uniroma2.it Ranalli M. Theoretical Foundations - Probabilities 1 / 27 Objectives understand the probability basics quantify random phenomena
+ Chapter 7. Random Variables. Chapter 7: Random Variables 2/26/2015. Transforming and Combining Random Variables
 + Chapter 7: Random Variables Section 7.1 Discrete and Continuous Random Variables The Practice of Statistics, 4 th edition For AP* STARNES, YATES, MOORE + Chapter 7 Random Variables 7.1 7.2 7.2 Discrete
Lecture 6 Probability
 Faculty of Medicine Epidemiology and Biostatistics الوبائيات واإلحصاء الحيوي (31505204) Lecture 6 Probability By Hatim Jaber MD MPH JBCM PhD 3+4-7-2018 1 Presentation outline 3+4-7-2018 Time Introduction-
Counting Basics. Venn diagrams
 Counting Basics Sets Ways of specifying sets Union and intersection Universal set and complements Empty set and disjoint sets Venn diagrams Counting Inclusion-exclusion Multiplication principle Addition
CHAPTER 2 Describing Data: Numerical
 CHAPTER Multiple-Choice Questions 1. A scatter plot can illustrate all of the following except: A) the median of each of the two variables B) the range of each of the two variables C) an indication of
MAKING SENSE OF DATA Essentials series
 MAKING SENSE OF DATA Essentials series THE NORMAL DISTRIBUTION Copyright by City of Bradford MDC Prerequisites Descriptive statistics Charts and graphs The normal distribution Surveys and sampling Correlation
Random variables The binomial distribution The normal distribution Other distributions. Distributions. Patrick Breheny.
 Distributions February 11 Random variables Anything that can be measured or categorized is called a variable If the value that a variable takes on is subject to variability, then it the variable is a random
Binomial Random Variable - The count X of successes in a binomial setting
 6.3.1 Binomial Settings and Binomial Random Variables What do the following scenarios have in common? Toss a coin 5 times. Count the number of heads. Spin a roulette wheel 8 times. Record how many times
Chapter 5 Basic Probability
 Chapter 5 Basic Probability Probability is determining the probability that a particular event will occur. Probability of occurrence = / T where = the number of ways in which a particular event occurs
Lecture 9. Probability Distributions. Outline. Outline
 Outline Lecture 9 Probability Distributions 6-1 Introduction 6- Probability Distributions 6-3 Mean, Variance, and Expectation 6-4 The Binomial Distribution Outline 7- Properties of the Normal Distribution
Chapter 3. Numerical Descriptive Measures. Copyright 2016 Pearson Education, Ltd. Chapter 3, Slide 1
 Chapter 3 Numerical Descriptive Measures Copyright 2016 Pearson Education, Ltd. Chapter 3, Slide 1 Objectives In this chapter, you learn to: Describe the properties of central tendency, variation, and
Example. Chapter 8 Probability Distributions and Statistics Section 8.1 Distributions of Random Variables
 Chapter 8 Probability Distributions and Statistics Section 8.1 Distributions of Random Variables You are dealt a hand of 5 cards. Find the probability distribution table for the number of hearts. Graph
3. The n observations are independent. Knowing the result of one observation tells you nothing about the other observations.
 Binomial and Geometric Distributions - Terms and Formulas Binomial Experiments - experiments having all four conditions: 1. Each observation falls into one of two categories we call them success or failure.
The Binomial distribution
 The Binomial distribution Examples and Definition Binomial Model (an experiment ) 1 A series of n independent trials is conducted. 2 Each trial results in a binary outcome (one is labeled success the other
Some Characteristics of Data
 Some Characteristics of Data Not all data is the same, and depending on some characteristics of a particular dataset, there are some limitations as to what can and cannot be done with that data. Some key
Lecture 9. Probability Distributions
 Lecture 9 Probability Distributions Outline 6-1 Introduction 6-2 Probability Distributions 6-3 Mean, Variance, and Expectation 6-4 The Binomial Distribution Outline 7-2 Properties of the Normal Distribution
Statistics vs. statistics
 Statistics vs. statistics Question: What is Statistics (with a capital S)? Definition: Statistics is the science of collecting, organizing, summarizing and interpreting data. Note: There are 2 main ways
Statistics and Probability
 Statistics and Probability Continuous RVs (Normal); Confidence Intervals Outline Continuous random variables Normal distribution CLT Point estimation Confidence intervals http://www.isrec.isb-sib.ch/~darlene/geneve/
Conditional Probability. Expected Value.
 Conditional Probability. Expected Value. CSE21 Winter 2017, Day 22 (B00), Day 14-15 (A00) March 8, 2017 http://vlsicad.ucsd.edu/courses/cse21-w17 Random Variables A random variable assigns a real number
AP Statistics Chapter 6 - Random Variables
 AP Statistics Chapter 6 - Random 6.1 Discrete and Continuous Random Objective: Recognize and define discrete random variables, and construct a probability distribution table and a probability histogram
MULTIPLE CHOICE. Choose the one alternative that best completes the statement or answers the question.
 Exam Name The bar graph shows the number of tickets sold each week by the garden club for their annual flower show. ) During which week was the most number of tickets sold? ) A) Week B) Week C) Week 5
Probability Distributions
 Chapter 6 Discrete Probability Distributions Section 6-2 Probability Distributions Definitions Let S be the sample space of a probability experiment. A random variable X is a function from the set S into
Binomial and Normal Distributions
 Binomial and Normal Distributions Bernoulli Trials A Bernoulli trial is a random experiment with 2 special properties: The result of a Bernoulli trial is binary. Examples: Heads vs. Tails, Healthy vs.
4.3 Normal distribution
 43 Normal distribution Prof Tesler Math 186 Winter 216 Prof Tesler 43 Normal distribution Math 186 / Winter 216 1 / 4 Normal distribution aka Bell curve and Gaussian distribution The normal distribution
Math 14 Lecture Notes Ch Mean
 4. Mean, Expected Value, and Standard Deviation Mean Recall the formula from section. for find the population mean of a data set of elements µ = x 1 + x + x +!+ x = x i i=1 We can find the mean of the
CHAPTER 4 DISCRETE PROBABILITY DISTRIBUTIONS
 CHAPTER 4 DISCRETE PROBABILITY DISTRIBUTIONS A random variable is the description of the outcome of an experiment in words. The verbal description of a random variable tells you how to find or calculate
Key Objectives. Module 2: The Logic of Statistical Inference. Z-scores. SGSB Workshop: Using Statistical Data to Make Decisions
 SGSB Workshop: Using Statistical Data to Make Decisions Module 2: The Logic of Statistical Inference Dr. Tom Ilvento January 2006 Dr. Mugdim Pašić Key Objectives Understand the logic of statistical inference
MA 1125 Lecture 05 - Measures of Spread. Wednesday, September 6, Objectives: Introduce variance, standard deviation, range.
 MA 115 Lecture 05 - Measures of Spread Wednesday, September 6, 017 Objectives: Introduce variance, standard deviation, range. 1. Measures of Spread In Lecture 04, we looked at several measures of central
Binomial population distribution X ~ B(
 Chapter 9 Binomial population distribution 9.1 Definition of a Binomial distributio If the random variable has a Binomial population distributio i.e., then its probability function is given by p n n (
5.1 Personal Probability
 5. Probability Value Page 1 5.1 Personal Probability Although we think probability is something that is confined to math class, in the form of personal probability it is something we use to make decisions
Probability. An intro for calculus students P= Figure 1: A normal integral
 Probability An intro for calculus students.8.6.4.2 P=.87 2 3 4 Figure : A normal integral Suppose we flip a coin 2 times; what is the probability that we get more than 2 heads? Suppose we roll a six-sided
The Binomial Distribution
 The Binomial Distribution January 31, 2018 Contents The Binomial Distribution The Normal Approximation to the Binomial The Binomial Hypothesis Test Computing Binomial Probabilities in R 30 Problems The
2017 Fall QMS102 Tip Sheet 2
 Chapter 5: Basic Probability 2017 Fall QMS102 Tip Sheet 2 (Covering Chapters 5 to 8) EVENTS -- Each possible outcome of a variable is an event, including 3 types. 1. Simple event = Described by a single
Random variables The binomial distribution The normal distribution Sampling distributions. Distributions. Patrick Breheny.
 Distributions September 17 Random variables Anything that can be measured or categorized is called a variable If the value that a variable takes on is subject to variability, then it the variable is a
12. THE BINOMIAL DISTRIBUTION
 12. THE BINOMIAL DISTRIBUTION Eg: The top line on county ballots is supposed to be assigned by random drawing to either the Republican or Democratic candidate. The clerk of the county is supposed to make
12. THE BINOMIAL DISTRIBUTION
 12. THE BINOMIAL DISTRIBUTION Eg: The top line on county ballots is supposed to be assigned by random drawing to either the Republican or Democratic candidate. The clerk of the county is supposed to make
2011 Pearson Education, Inc
 Statistics for Business and Economics Chapter 4 Random Variables & Probability Distributions Content 1. Two Types of Random Variables 2. Probability Distributions for Discrete Random Variables 3. The Binomial
Unit2: Probabilityanddistributions. 3. Normal distribution
 Announcements Unit: Probabilityanddistributions 3 Normal distribution Sta 101 - Spring 015 Duke University, Department of Statistical Science February, 015 Peer evaluation 1 by Friday 11:59pm Office hours:
Chapter 6: Random Variables. Ch. 6-3: Binomial and Geometric Random Variables
 Chapter : Random Variables Ch. -3: Binomial and Geometric Random Variables X 0 2 3 4 5 7 8 9 0 0 P(X) 3???????? 4 4 When the same chance process is repeated several times, we are often interested in whether
The Binomial Distribution
 The Binomial Distribution January 31, 2019 Contents The Binomial Distribution The Normal Approximation to the Binomial The Binomial Hypothesis Test Computing Binomial Probabilities in R 30 Problems The
Lecture 1: Review and Exploratory Data Analysis (EDA)
") Lecture 1: Review and Exploratory Data Analysis (EDA) Ani Manichaikul amanicha@jhsph.edu 16 April 2007 1 / 40 Course Information I Office hours For questions and help When? I ll announce this tomorrow
Lecture 1: Review and Exploratory Data Analysis (EDA) Ani Manichaikul amanicha@jhsph.edu 16 April 2007 1 / 40 Course Information I Office hours For questions and help When? I ll announce this tomorrow
Normal distribution Approximating binomial distribution by normal 2.10 Central Limit Theorem
 1.1.2 Normal distribution 1.1.3 Approimating binomial distribution by normal 2.1 Central Limit Theorem Prof. Tesler Math 283 Fall 216 Prof. Tesler 1.1.2-3, 2.1 Normal distribution Math 283 / Fall 216 1
Section 2: Estimation, Confidence Intervals and Testing Hypothesis
 Section 2: Estimation, Confidence Intervals and Testing Hypothesis Carlos M. Carvalho The University of Texas at Austin McCombs School of Business http://faculty.mccombs.utexas.edu/carlos.carvalho/teaching/
Probability Distributions for Discrete RV
 Probability Distributions for Discrete RV Probability Distributions for Discrete RV Definition The probability distribution or probability mass function (pmf) of a discrete rv is defined for every number
AP STATISTICS FALL SEMESTSER FINAL EXAM STUDY GUIDE
 AP STATISTICS Name: FALL SEMESTSER FINAL EXAM STUDY GUIDE Period: *Go over Vocabulary Notecards! *This is not a comprehensive review you still should look over your past notes, homework/practice, Quizzes,
5.7 Probability Distributions and Variance
 160 CHAPTER 5. PROBABILITY 5.7 Probability Distributions and Variance 5.7.1 Distributions of random variables We have given meaning to the phrase expected value. For example, if we flip a coin 100 times,
Assignment 2 (Solution) Probability and Statistics
 Probability and Statistics") Assignment 2 (Solution) Probability and Statistics Dr. Jitesh J. Thakkar Department of Industrial and Systems Engineering Indian Institute of Technology Kharagpur Instruction Total No. of Questions: 15.
Assignment 2 (Solution) Probability and Statistics Dr. Jitesh J. Thakkar Department of Industrial and Systems Engineering Indian Institute of Technology Kharagpur Instruction Total No. of Questions: 15.
Section M Discrete Probability Distribution
 Section M Discrete Probability Distribution A random variable is a numerical measure of the outcome of a probability experiment, so its value is determined by chance. Random variables are typically denoted
4.2 Probability Distributions
 4.2 Probability Distributions Definition. A random variable is a variable whose value is a numerical outcome of a random phenomenon. The probability distribution of a random variable tells us what the
value BE.104 Spring Biostatistics: Distribution and the Mean J. L. Sherley
 BE.104 Spring Biostatistics: Distribution and the Mean J. L. Sherley Outline: 1) Review of Variation & Error 2) Binomial Distributions 3) The Normal Distribution 4) Defining the Mean of a population Goals:
Consider the following examples: ex: let X = tossing a coin three times and counting the number of heads
 Overview Both chapters and 6 deal with a similar concept probability distributions. The difference is that chapter concerns itself with discrete probability distribution while chapter 6 covers continuous
Marquette University MATH 1700 Class 8 Copyright 2018 by D.B. Rowe
 Class 8 Daniel B. Rowe, Ph.D. Department of Mathematics, Statistics, and Computer Science Copyright 208 by D.B. Rowe Agenda: Recap Chapter 4.3-4.5 Lecture Chapter 5. - 5.3 2 Recap Chapter 4.3-4.5 3 4:
A probability distribution shows the possible outcomes of an experiment and the probability of each of these outcomes.
 Introduction In the previous chapter we discussed the basic concepts of probability and described how the rules of addition and multiplication were used to compute probabilities. In this chapter we expand
Statistics for Managers Using Microsoft Excel 7 th Edition
 Statistics for Managers Using Microsoft Excel 7 th Edition Chapter 5 Discrete Probability Distributions Statistics for Managers Using Microsoft Excel 7e Copyright 014 Pearson Education, Inc. Chap 5-1 Learning
Week 1 Variables: Exploration, Familiarisation and Description. Descriptive Statistics.
 Week 1 Variables: Exploration, Familiarisation and Description. Descriptive Statistics. Convergent validity: the degree to which results/evidence from different tests/sources, converge on the same conclusion.
Stat 211 Week Five. The Binomial Distribution
 Stat 211 Week Five The Binomial Distribution Last Week E x E x = x p(x) = n p σ x = x μ x 2 p(x) We will see this again soon!! Binomial Experiment We have an experiment with the following qualities : 1.
STAT 201 Chapter 6. Distribution
 STAT 201 Chapter 6 Distribution 1 Random Variable We know variable Random Variable: a numerical measurement of the outcome of a random phenomena Capital letter refer to the random variable Lower case letters
Continuous distributions. Lecture 6: Probability. Probabilities from continuous distributions. From histograms to continuous distributions
 Lecture 6: Probability Below is a histogram of the distribution of heights of US adults. The proportion of data that falls in the shaded bins gives the probability that a randomly sampled US adult is between
9/17/2015. Basic Statistics for the Healthcare Professional. Relax.it won t be that bad! Purpose of Statistic. Objectives
 Basic Statistics for the Healthcare Professional 1 F R A N K C O H E N, M B B, M P A D I R E C T O R O F A N A L Y T I C S D O C T O R S M A N A G E M E N T, LLC Purpose of Statistic 2 Provide a numerical
ECO220Y Introduction to Probability Readings: Chapter 6 (skip section 6.9) and Chapter 9 (section )
 and Chapter 9 (section )") ECO220Y Introduction to Probability Readings: Chapter 6 (skip section 6.9) and Chapter 9 (section 9.1-9.3) Fall 2011 Lecture 6 Part 2 (Fall 2011) Introduction to Probability Lecture 6 Part 2 1 / 44 From
ECO220Y Introduction to Probability Readings: Chapter 6 (skip section 6.9) and Chapter 9 (section 9.1-9.3) Fall 2011 Lecture 6 Part 2 (Fall 2011) Introduction to Probability Lecture 6 Part 2 1 / 44 From
Data Analysis and Statistical Methods Statistics 651
 Data Analysis and Statistical Methods Statistics 651 http://www.stat.tamu.edu/~suhasini/teaching.html Lecture 10 (MWF) Checking for normality of the data using the QQplot Suhasini Subba Rao Review of previous
MA 1125 Lecture 14 - Expected Values. Wednesday, October 4, Objectives: Introduce expected values.
 MA 5 Lecture 4 - Expected Values Wednesday, October 4, 27 Objectives: Introduce expected values.. Means, Variances, and Standard Deviations of Probability Distributions Two classes ago, we computed the
Chapter 3: Probability Distributions and Statistics
 Chapter 3: Probability Distributions and Statistics Section 3.-3.3 3. Random Variables and Histograms A is a rule that assigns precisely one real number to each outcome of an experiment. We usually denote
5.1 Mean, Median, & Mode
 5.1 Mean, Median, & Mode definitions Mean: Median: Mode: Example 1 The Blue Jays score these amounts of runs in their last 9 games: 4, 7, 2, 4, 10, 5, 6, 7, 7 Find the mean, median, and mode: Example 2
NOTES: Chapter 4 Describing Data
 NOTES: Chapter 4 Describing Data Intro to Statistics COLYER Spring 2017 Student Name: Page 2 Section 4.1 ~ What is Average? Objective: In this section you will understand the difference between the three
Numerical Descriptive Measures. Measures of Center: Mean and Median
 Steve Sawin Statistics Numerical Descriptive Measures Having seen the shape of a distribution by looking at the histogram, the two most obvious questions to ask about the specific distribution is where
The topics in this section are related and necessary topics for both course objectives.
 2.5 Probability Distributions The topics in this section are related and necessary topics for both course objectives. A probability distribution indicates how the probabilities are distributed for outcomes