EXCEL STATISTICAL Functions. Presented by Wayne Wilmeth
|
|
|
- Vernon Gilbert
- 6 years ago
- Views:
Transcription
1 EXCEL STATISTICAL Functions Presented by Wayne Wilmeth
2 Exponents 2 3
3 Exponents 2 3 2*2*2 = 8

4 Exponents
5 Exponents
6 Exponents

7 Exponent Examples
8 Roots? *? = 81? *? *? = 27
")
9 Roots =Sqrt(81) 9
10 Roots 27 1/3 27^(1/3) 3

11 Roots 27 1/3

12 Root Examples
13 Summations 10 1 i 2
14 Summations i 2 Perform a mathematical operation on each number in a series. + Sum the Results.
15 Summations Ending Number Starting 10 1 i 2 Mathematical Operation Number Sum(1 2, 2 2, 3 2, 4 2, 5 2, 6 2, 7 2, 8 2, 9 2, 10 2 )
16 Using Sum() as an Array 10 1 i 2 Sum(1^2,2^2,3^2,4^2,5^2,6^2,7^2,8^2,9^2,10^2) Sum(A1:A10^2) However, if you just press Enter, Excel cannot evaluate the equation. We need to tell it to process each cell in the range one at a time.

 Sum(1 2,2 2,3 2,4 2,5 2,6 2,7 2,8 2,9 2,10 2 )")
17 Using Sum() as an Array Press Control + Shift + Enter to make Excel Process cells in a range one at a time. Sum(A1:A10^2) Sum(A1 2,A2 2,A3 2,A4 2,A5 2,A6 2,A7 2,A8 2,A9 2,A10 2 ) Sum(1 2,2 2,3 2,4 2,5 2,6 2,7 2,8 2,9 2,10 2 ) Sum(1,4,9,16,25,36,49,64,81,100) 385

18 Summation Examples
19 Average vs. Weighted Average Average Weighted Average
20 Average Price Sum of Prices / Count of Prices Transaction Price Per Units Item Date Unit Sold 5/7/2007 Coffee $ /7/2007 Coffee $ /6/2007 Coffee $ /9/2007 Coffee $ Total: = 110 Average Price: 110 / 4 = 27.50
21 Weighted Average Price (Price per Unit * Units Sold) / Units Sold Date Item Price Per Units Unit Sold 5/7/2007 Coffee $ 20 X 500 6/7/2007 Coffee $ 25 X 750 7/6/2007 Coffee $ 35 X 200 8/9/2007 Coffee $ 30 X = 1,750 = 10,000 = 18,750 = 7,000 = 9, ,750 Weighted Average Price: 44,750 / 1,750 = $25.57

22 Weighted Average Example
23 =SumProduct(Array1,Array2) Multiplies corresponding numbers in two different ranges together then sums them. Date Item Price Per Units Unit Sold 5/7/2007 Coffee $ /7/2007 Coffee $ /6/2007 Coffee $ /9/2007 Coffee $ Array 1 Array 2 20*500 = 10,000 25*750 = 18,750 35*200 = 7,000 30*300 = 9,000 44,750

24 Wt. Avg. with SumProduct()
25 Combinations In a group of 7 survivors, how many different combinations of people can be selected for a three person lifeboat?
26 Combinations Order of Selection is Not Important

27 Combinations Each Person can be Selected Only Once.
28 Combinations =Combin(Populatin Size,Number Selected) In a group of 7 survivors, how many different combinations of people can be selected for a three person lifeboat? =Combin(7,3) 35
29 Permutations Like Combinations; Except, Order is Important & No Duplicates


30 Permutations =Permut(Population Size,# Selected) In a group of 7 Contestants, how many different combinations of people can be selected for a first, second, and third prize? =Permut(7,3) 210

31 Combinations Ex2 (With Replacement) You have an unlimited supply of Coconuts and Pineapples. How many different ways can you fill a bowl which will contain exactly 3 items?
32 Combinations Ex2 Order of Selection is Not Important


33 Combinations Ex2 Items can be Repeated (with Replacement)
34 Combinations Ex2 (With Replacement, Order Not Important) n k 1! ( n 1)! k! n = The number of different items available (2). K = The number of items selected (3).
35 Factorials (!) 4! = 1 * 2 * 3 * 4 = 24 6! = 1 * 2 * 3 * 4 * 5 * 6 = 720 4! = =Fact(4) = 24 6! = =Fact(6) = 720
36 Combinations Ex2 (With Replacement, Order Not Important) n k 1! 2 3 1! ( n 1)! k! (2 1)!3! 4! (1)!3! 4*3*2*1 (1)*3*2*1 n = The number of different items available (2). K = The number of items selected (3).
37 Combinations Ex2 (With Replacement, Order Not Important) 4*3*2*1 (1)*3*2* n = The number of different items available (2). K = The number of items selected (3).
38 Combinations Ex2 (With Replacement, Order Not Important) n k 1! ( n 1)! k! Fact Fact(2 1)* Fact(3) =FACT(2+3-1)/(FACT(2-1)*FACT(3))

39 Combinations Ex2 (With Replacement)
40 Order of Operations
41 Permutations Ex2 (With Replacement) Like Combinations; Except, Order is Important. (213) How many different possibilities for the last 4 digits?
42 Permutations Ex2 Order is Important (213) _ 2 34_ (213) _ 3 2 _ 1
43 Permutations Ex2 With Replacement (Items (0-9) can be Repeated) (213) _ 1 11_
 = n (K) ( Number of Items you are selecting ( =")
44 Permutations Ex2 With Replacement (Items (0-9) can be Repeated) Number of Choices Available (n) = n (K) ( Number of Items you are selecting ( = 10^4

45 Permutations Ex2 (with replacement)
46 Combinations/Permutations Summary Category Order Count? Replacement? Function Combinations No No =Combin(pop_size,#Selected) Combinations No Yes n k 1! ( n 1)! k! Permutations Yes No =Permut(pop_size,#Selected) Permutations Yes Yes = n^k

47 Slope of a Line
48 Slope Example: Sales In 2001 Sales were 10K and in 2007 sales were 25K. What is the slope of the line? How much have sales gone up each year?
49 Rise Sales Slope of a Line 30K 25K Run (2007, ) 20K 15K 10K (2001, ) 5K 0K Year
50 Rise Slope of a Line Slope = Change in Y Change in X (2001, 10000) Run (2007, ) Slope = y2 y1 X2 x1 Slope = Slope = =

51 Sales Rise Meaning of Slope 30K 25K 20K 15K 10K 5K 0K (2001, ) Run (2007, ) Year Rise Slope = = = 2500 Run Year For each year, sales have gone up $2,500

52 Excel s Slope( ) Function =Slope(Known Y s, Known X s)

53 Slope Example 2 How much do sales increase for each additional $1 of advertising?

54 Slope Ex 2: Solution How much do sales increase for each additional Adv. $1? Rise Run = 1, ,000 /1000 1,018.2 = = /1000 1,000 1 = $1.0182

55 Sales Y-Intercept of a Line Where a Line Crosses the Y-Axis 30K 25K 20K 15K 10K 5K 0K 1K 2K 3K 4K 5K 6K 7K 8K Advertising Cost
56 Excel s Intercept() Function =Intercept(Known Y s, Known X s) What would sales be if we spent nothing on advertising?

57 Y-Intercept Example What would sales be if we spent nothing on advertising?
58 Y-Intercept Example $123,772
59 Hardware Sales Forecasting (Linear Regression) 2.25M 2.0M 1.75M 1.5M 1.25M 1M 800K 900K 600K 400K 425K 500K New Home Startups
60 Forecast() Returns the predicted value of a dependant variable (x) =Forecast(X, Known Y s, Known X s) The data point you are predicting (Sales for 2010) Range of dependent variables (Previous Sales). Range of independent variables (Previous Housing Starts).

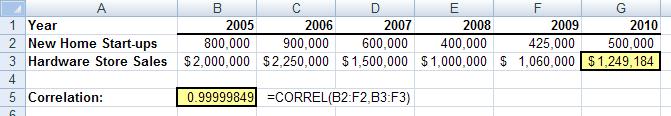
61 =Forecast(X, Known Y s, Known X s) We are assuming a relationship between new housing construction and our in-store hardware sales. If new construction start-ups for 2010 are predicted to be 500,000, predict what our sales will be.
62 Correlation
63 Correlation Is there really a correlation between our hardware sales and the number of new housing starts? =Correl(Array1,Array2) Inverse Correlation No Correlation Perfect Correlation
64 Correl(Array1,Array2)

65 Correl(Array1,Array2) Is there a correlation between Interest rates and average home price in the last few years? Is there a correlation between the age of an automobile and its average resale value?
66 Hardware Sales Forecasting Using Trend() (Linear Regression) 2.25M 2.0M 1.75M 1.5M 1.25M 1M 800K 900K 600K 400K 425K 500K New Home Startups
67 Trend() Like Forecast() Except: Trend can return multiple dependent variables. Can utilize multiple independent variables.
68 Trend() Trend(Known Y s, Known X s, New X s) Dependant Variables (Past Sales) Independent Variables (Past Adv. Costs) Planned Independent Variables (Planned Adv. Costs) Predict Sales for July-December using Trend().
69 Trend() Trend(Known Y s, Known X s, New X s) Dependant Variables (Past Sales) Independent Variables (Past Adv. Costs) Planned Independent Variables (Planned Adv. Costs) Known Xs Known Ys New Xs You must: Highlight First Press Control + Shift + Enter

70 Trend() Trend(Known Y s, Known X s, New X s) You must: Highlight First Press Control + Shift + Enter

71 Trend(Known Y s, Known X s, New X s) What price should we ask for our office building given the characteristics of similar office buildings in the area?

72 Trend(Known Y s, Known X s, New X s)


73 Number Occurring Frequency F D C B A Grade


74 We wish to determine the number of students getting an A, B, C, D and F based on the conditions below. >89.99 and <= > A >79.99 and <= > B >69.99 and <= > C >59.99 and <= > D <= > F

75 =Frequency(Data Array, Bins Array) This is the range of values you are analyzing. This is your grouping. The values listed are the maximums for the group and are inclusive. In this example the groupings are: >89.99 and <=100 >79.99 and <=89.99 >69.99 and <=79.99 >59.99 and <=69.99 <=59.99
76 =Frequency(Data Array, Bins Array) You must highlight your output area prior to typing the formula. When done typing, you must press: Control + Shift + Enter

77 =Frequency(Data Array, Bins Array) You must: Highlight First Press Control + Shift + Enter
78 Descriptive Functions Average() Median() Mode() Stdev() StdevP() Var() VarP() Count() Max() Min()
79 Average(Range) Mathematical Measure of Central Tendency Sum of Numbers Count of Numbers = 5
80 Median(Range) The number physically in the middle of an ordered number line 11
81 Mode() The most Frequently Occurring Number
82 Frequency Stdev(Range) or StdevP(Range) Standard Deviation of a Sample How close to the average is most of your data? 68% 95% 99%
83 Frequency Stdev(Range) or StdevP(Range) Standard Deviation = 23 Indicates 68% of our students are within 23 points (+/-) of the mean (76.8). 68% 95% 99% And 95% of our students are within 46 points (+/-) of the mean. (2 Stdev * 23) And 99% of our students are within 69 points (+/-) of the mean (3 stdev * 23)
84 Var(Range) or VarP(Range) The Variance is the average of the squared differences from the mean. Mathematically, you typically get Variance first and find its root to get the Standard Deviation which is a little more useful. Variance is: (Score a Mean) 2 + (Score b Mean) 2 + (Score c Mean) 2 Count of the number of scores Standard Deviation is: Variance (1/2)

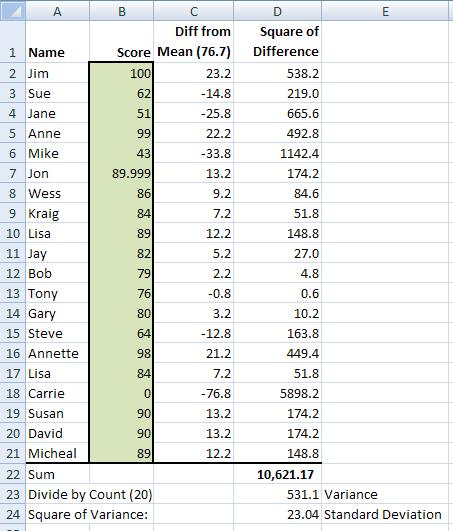
85 Variance
86 Count(Range) Returns the number of cells within a range which contain a value. Note that 0 is counted as a value but blanks and cells containing text are not counted.
87 Max(Range) Returns the largest number within a range.
88 Min(Range) Returns the smallest number within a range.

89 Descriptive Stats Find the statistics indicated for the student scores

90 Descriptive Stats: Solution Find the statistics indicated for the student scores
91 Normal Probabilities Binominal Hypergeometric Poisson 68% 95% 99%
92 Binominal Probabilities
93 Binomial Probability Concerns probabilities when there are only two possible outcomes. (i.e. Presence or absence of a characteristic.) Coin Toss: Heads or Tails? Men or Women: Of the 9 employees selected, what is the probability that three are women?
94 Binomial Probability Assumes data is Normally Distributed 68% 95% 99%

95 Binomial Probability With Replacement or Infinite Pool * * If sampling without replacement and the sample size is less than 10% of the population, then binominal is still a good approximation.
96 Binomial Probability The experiment consists of n identical trials. (Same wind velocity during all coin tosses) The trials are independent of each other. (Outcome of one doesn t affect the other.)
97 =NormDist(X,Mean,StdDev,Cumulative) This is the value you wish to test. (i.e. probability of a basketball player making 5 free throws in a row when his ratio is 2:3. Average value of the distribution. (i.e. 2 out of 3 or 67%.) Standard Deviation True or False False= Exact probability True= Less than or equal to.
98 Binominal Ex1: Exactly The average employee in the US works 40 hours per week with a standard deviation of 10 hours. What is the probability that a worker worked Exactly 40 hours? X=40

99 Binominal Ex1: Exactly The average employee in the US works 40 hours per week with a standard deviation of 10 hours. What is the probability that a worker worked Exactly 40 hours?
100 Binominal Ex2: <= 30 What is the probability that a worker worked Less than or Equal to 30 hours? ( True returns Less than or equal to X.) 40 X<=30 40

101 Binominal Ex2: <= 30 What is the probability that a worker worked Less than or Equal to 30 hours?
102 Binominal Ex3: > 30 What is the probability that a worker worked more than 30 hours? X>30 40
103 Binominal Ex3: > 30 What is the probability that a worker worked more than 30 hours? 40 Cumulative = True returns less than or equal to X. X<=30 40 X<= And a 100% probability would fill the entire curve and would be 1. Therefore
104 Binominal Ex3: > 30 1-Probability of X<=30 equals X > X<=100 X<= = X>30 40

105 Binominal Ex3: > 30 What is the probability that a worker worked more than 30 hours? Note that if you wanted >= 30 rather than >30 then you would use 29 rather than 30 as X.

106 Binominal Ex4: >30 and <50 What is the probability that a worker worked more than 30 and less than 50?
107 Binominal Ex4: >30 and <50 Subtract X<=30 from X<= X<=50 X<=30 40 = 40 X>30 40 X<50

108 Binominal Ex4: >30 and <50 What is the probability that a worker worked more than 30 and less than 50? Prob. Of X <=50 - Prob. Of X <=30 from Example 2
109 Normal Inverse Function The Exact Opposite of the Normdist() NormDist() returns a probability based on a given variable X NormInv() returns the variable X based on a given probability

110 NormInv() Example 1 Average height of a man is 69.2 inches with a standard deviation of 2.5 inches. How tall would a man have to be (X) if he wanted to be taller than 75% of all men?
111 NormInv(Probability,Mean,StDev) This is the probability you wish to find a data point for. For example, you wish to be taller than 75% of all men. This is the Average. For example, the average height of a man is 69.2 Standard Deviation from the mean. For example, 1 standard deviation is % NormInv() returns the variable for a 40 cumulative probability starting from the left (0%)

112 NormInv() Example 1 Average height of a man is 69.2 inches with a standard deviation of 2.5 inches. How tall would a man have to be (X) if he wanted to be taller than 75% of all men?

113 NormInv() Example 2 The average weight of a man is lbs with a standard deviation of 15lbs. How much should a man weigh if he would like to weight less than 60% of most men? (In other words, only 40% of men weigh less than him.)

114 NormInv() Example 2 40%
115 Hypergeometric Probability
116 Hypergeometric Distribution When items are selected without replacement, use the Hypergeometric Distribution over the Binomial Normal Distribution. All other criteria is the same as the Binomial Distribution.

117 Hypergeometric Ex. 1 A bowl contains 8 pineapples and 12 coconuts.
118 Hypergeometric Ex. 1 If 4 items are randomly selected, what is the probability that: None are pineapples? 1 is a pineapple? 2 are pineapples? 3 are pineapples? All are pineapples?


119 =HyperGeomDist( # of Successes in Sample,,, ) Sample Size # of Successes in Pop. Total Pop. Size This is the number of successes you are trying to find the probability of. For example, probability of just 1 pineapple.
120 =HyperGeomDist( # of Successes in Sample,,, ) Sample Size # of Successes in Pop. Total Pop. Size This is the size of your sample. For example, you are selecting 4 items from the bowl.????
121 =HyperGeomDist( # of Successes in Sample,,, ) Sample Size # of Successes in Pop. Total Pop. Size This is the total number of pineapples available in the bowl. 8 in this example.
122 =HyperGeomDist( # of Successes in Sample,,, ) Sample Size # of Successes in Pop. Total Pop. Size This is the total number of items the bowl will hold. In this example 20. (8 pineapples + 12 coconuts)

123 =HyperGeomDist( # of Successes in Sample,,, ) Sample Size # of Successes in Pop. Total Pop. Size A bowl contains 8 pineapples and 12 coconuts. If 4 items are randomly selected, what is the probability of: 0 pineapples? 1 pineapple? 2 pineapples? 3 pineapples? 4 pineapples?
124 Cumulative Hypergeometric Probabilities All possible probabilities add to a 100%. So, for cumulative probabilities, simply add the probabilities.
125 Cumulative Hypergeometric Probabilities Probability of 2 or Less: %
126 Cumulative Hypergeometric Probabilities Probability of 3 or More: %
127 Cumulative Hypergeometric Probabilities Probability of less than 2: %

128 Cumulative Hypergeometric Probabilities
129 Poisson Distribution


130 Poisson Distribution When probabilities occur over a fixed period of time. Results are success or failure (Two possible outcomes) Probabilities are normally distributed.
131 Poisson Distribution What is the probability that on a given day, the city of Redondo Beach will experience 3 fires? What is the probability that more than 10 cars will arrive at a tollbooth within a minute?
132 =Poisson( # of Events Being Tested,, Known Average Cumulative? ) This is the value being tested. For example, number of fires in a day or cars at a tollbooth. The Poisson distribution requires that the average is known. For example, there us an average of 4 fires per day in Redondo Beach. True: Less than or equal to the value being tested. False: Exactly the value being tested.
133 Poisson Ex1: Exact # On average, there are 4 fires in Redondo Beach per day, what is the probability that on a given day there are no fires? =Poisson(# of Events, Average, Cumulative)
134 Poisson Ex1: Solution On average, there are 4 fires in Redondo Beach per day, what is the probability that on a given day there are no fires?
135 Poisson Ex2: Less than or Equal to On average, there are 4 fires in Redondo Beach per day, what is the probability that on a given day there are 3 fires or less? =Poisson(# of Events, Average, Cumulative)

136 Poisson Ex2: Solution On average, there are 4 fires in Redondo Beach per day, what is the probability that on a given day there are 3 fires or less?
137 Poisson Ex3: Greater Than On average, the Vincent toll booth gets 8 cars per minute. What is the probability that it will receive more than 10 cars in a given minute? Poisson cumulative probabilities are inclusive and go from left to right. Therefore, to get a probability of a value greater than: - = % Probability (1) Probability of 10 Cars or Less Probability of More than 10 Cars

138 Poisson Ex3: Greater Than On average, the Vincent toll booth gets 8 cars per minute. What is the probability that it will receive more than 10 cars in a given minute?
139 Poisson Ex4: Less Than On average, the Vincent toll booth gets 8 cars per minute. What is the probability that it will receive less than 10 cars in a given minute? 40 <=9 <=10 Cumulative Poisson Probabilities are inclusive. 10 number of events is <=10. If you want just < 10, then use 9 number of events.

140 Poisson Ex4: Less Than On average, the Vincent toll booth gets 8 cars per minute. What is the probability that it will receive less than 10 cars in a given minute?

141 Interval Estimation Around the Mean How much above and below the average you can expect the data to be given a specific level of confidence. 40
142 =Confidence( Alpha,, Standard Deviation Sample Size ) Alpha is the confidence level and is 1-level. For example, 95% confidence level would be 1-.95=.05 This is the standard deviation Size of the sample

143 Confidence() Example On average, 64 randomly selected workers can make 60 sprockets per hour with a standard deviation of 16 sprockets. Determine the 95% confidence interval for the true mean of hourly output.

144 Confidence() Example =Confidence(Alpha, Standard Deviation, Sample Size) On average, 64 randomly selected workers can make 60 sprockets per hour with a standard deviation of 16 sprockets. Determine the 95% confidence interval for the true mean of hourly output.
2011 Pearson Education, Inc
 Statistics for Business and Economics Chapter 4 Random Variables & Probability Distributions Content 1. Two Types of Random Variables 2. Probability Distributions for Discrete Random Variables 3. The Binomial
Section Distributions of Random Variables
 Section 8.1 - Distributions of Random Variables Definition: A random variable is a rule that assigns a number to each outcome of an experiment. Example 1: Suppose we toss a coin three times. Then we could
STATISTICAL DATA ANALYSIS USING FUNCTIONS
 STATISTICAL DATA ANALYSIS USING FUNCTIONS Excel provides an extensive range of Statistical Functions, that perform calculations from basic mean, median & mode to the more complex statistical distribution
Lecture 9. Probability Distributions. Outline. Outline
 Outline Lecture 9 Probability Distributions 6-1 Introduction 6- Probability Distributions 6-3 Mean, Variance, and Expectation 6-4 The Binomial Distribution Outline 7- Properties of the Normal Distribution
Statistics, Measures of Central Tendency I
 Statistics, Measures of Central Tendency I We are considering a random variable X with a probability distribution which has some parameters. We want to get an idea what these parameters are. We perfom
Lecture 9. Probability Distributions
 Lecture 9 Probability Distributions Outline 6-1 Introduction 6-2 Probability Distributions 6-3 Mean, Variance, and Expectation 6-4 The Binomial Distribution Outline 7-2 Properties of the Normal Distribution
Section Distributions of Random Variables
 Section 8.1 - Distributions of Random Variables Definition: A random variable is a rule that assigns a number to each outcome of an experiment. Example 1: Suppose we toss a coin three times. Then we could
A probability distribution shows the possible outcomes of an experiment and the probability of each of these outcomes.
 Introduction In the previous chapter we discussed the basic concepts of probability and described how the rules of addition and multiplication were used to compute probabilities. In this chapter we expand
INF FALL NATURAL LANGUAGE PROCESSING. Jan Tore Lønning, Lecture 3, 1.9
 1 INF5830 2015 FALL NATURAL LANGUAGE PROCESSING Jan Tore Lønning, Lecture 3, 1.9 Today: More statistics 2 Recap Probability distributions Categorical distributions Bernoulli trial Binomial distribution
Discrete Probability Distributions
 Discrete Probability Distributions Chapter 6 Learning Objectives Define terms random variable and probability distribution. Distinguish between discrete and continuous probability distributions. Calculate
Example - Let X be the number of boys in a 4 child family. Find the probability distribution table:
 Chapter7 Probability Distributions and Statistics Distributions of Random Variables tthe value of the result of the probability experiment is a RANDOM VARIABLE. Example - Let X be the number of boys in
Chapter 3: Probability Distributions and Statistics
 Chapter 3: Probability Distributions and Statistics Section 3.-3.3 3. Random Variables and Histograms A is a rule that assigns precisely one real number to each outcome of an experiment. We usually denote
ECON 214 Elements of Statistics for Economists 2016/2017
 ECON 214 Elements of Statistics for Economists 2016/2017 Topic Probability Distributions: Binomial and Poisson Distributions Lecturer: Dr. Bernardin Senadza, Dept. of Economics bsenadza@ug.edu.gh College
LAB 2 INSTRUCTIONS PROBABILITY DISTRIBUTIONS IN EXCEL
 LAB 2 INSTRUCTIONS PROBABILITY DISTRIBUTIONS IN EXCEL There is a wide range of probability distributions (both discrete and continuous) available in Excel. They can be accessed through the Insert Function
STATISTICAL DISTRIBUTIONS AND THE CALCULATOR
 STATISTICAL DISTRIBUTIONS AND THE CALCULATOR 1. Basic data sets a. Measures of Center - Mean ( ): average of all values. Characteristic: non-resistant is affected by skew and outliers. - Median: Either
Data that can be any numerical value are called continuous. These are usually things that are measured, such as height, length, time, speed, etc.
 Chapter 8 Measures of Center Data that can be any numerical value are called continuous. These are usually things that are measured, such as height, length, time, speed, etc. Data that can only be integer
Statistics TI-83 Usage Handout
 Statistics TI-83 Usage Handout This handout includes instructions for performing several different functions on a TI-83 calculator for use in Statistics. The Contents table below lists the topics covered
STUDY SET 1. Discrete Probability Distributions. x P(x) and x = 6.
 and x = 6.") STUDY SET 1 Discrete Probability Distributions 1. Consider the following probability distribution function. Compute the mean and standard deviation of. x 0 1 2 3 4 5 6 7 P(x) 0.05 0.16 0.19 0.24 0.18 0.11
STUDY SET 1 Discrete Probability Distributions 1. Consider the following probability distribution function. Compute the mean and standard deviation of. x 0 1 2 3 4 5 6 7 P(x) 0.05 0.16 0.19 0.24 0.18 0.11
Prepared By. Handaru Jati, Ph.D. Universitas Negeri Yogyakarta.
 Prepared By Handaru Jati, Ph.D Universitas Negeri Yogyakarta handaru@uny.ac.id Chapter 7 Statistical Analysis with Excel Chapter Overview 7.1 Introduction 7.2 Understanding Data 7.2.1 Descriptive Statistics
Discrete Probability Distributions
 Discrete Probability Distributions Chapter 6 Copyright 2015 McGraw-Hill Education. All rights reserved. No reproduction or distribution without the prior written consent of McGraw-Hill Education. Learning
MAKING SENSE OF DATA Essentials series
 MAKING SENSE OF DATA Essentials series THE NORMAL DISTRIBUTION Copyright by City of Bradford MDC Prerequisites Descriptive statistics Charts and graphs The normal distribution Surveys and sampling Correlation
Written by N.Nilgün Çokça. Advance Excel. Part One. Using Excel for Data Analysis
 Written by N.Nilgün Çokça Advance Excel Part One Using Excel for Data Analysis March, 2018 P a g e 1 Using Excel for Calculations Arithmetic operations Arithmetic operators: To perform basic mathematical
Chapter 6: Random Variables
 Chapter 6: Random Variables Section 6.1 Discrete and Continuous Random Variables The Practice of Statistics, 4 th edition For AP* STARNES, YATES, MOORE Chapter 6 Random Variables 6.1 Discrete and Continuous
Chapter 6 Continuous Probability Distributions. Learning objectives
 Chapter 6 Continuous s Slide 1 Learning objectives 1. Understand continuous probability distributions 2. Understand Uniform distribution 3. Understand Normal distribution 3.1. Understand Standard normal
TOPIC: PROBABILITY DISTRIBUTIONS
 TOPIC: PROBABILITY DISTRIBUTIONS There are two types of random variables: A Discrete random variable can take on only specified, distinct values. A Continuous random variable can take on any value within
1. (9; 3ea) The table lists the survey results of 100 non-senior students. Math major Art major Biology major
 The table lists the survey results of 100 non-senior students. Math major Art major Biology major") Math 54 Test #2(Chapter 4, 5, 6, 7) Name: Show all necessary work for full credit. You may use graphing calculators for your calculation, but you must show all detail and use the proper notations. Total
Math 54 Test #2(Chapter 4, 5, 6, 7) Name: Show all necessary work for full credit. You may use graphing calculators for your calculation, but you must show all detail and use the proper notations. Total
Discrete Probability Distributions
 Discrete Probability Distributions Chapter 6 McGraw-Hill/Irwin Copyright 2012 by The McGraw-Hill Companies, Inc. All rights reserved. Learning Objectives LO1 Identify the characteristics of a probability
ECON 214 Elements of Statistics for Economists 2016/2017
 ECON 214 Elements of Statistics for Economists 2016/2017 Topic The Normal Distribution Lecturer: Dr. Bernardin Senadza, Dept. of Economics bsenadza@ug.edu.gh College of Education School of Continuing and
Chapter 5 Basic Probability
 Chapter 5 Basic Probability Probability is determining the probability that a particular event will occur. Probability of occurrence = / T where = the number of ways in which a particular event occurs
Math 227 Elementary Statistics. Bluman 5 th edition
 Math 227 Elementary Statistics Bluman 5 th edition CHAPTER 6 The Normal Distribution 2 Objectives Identify distributions as symmetrical or skewed. Identify the properties of the normal distribution. Find
MATH 118 Class Notes For Chapter 5 By: Maan Omran
 MATH 118 Class Notes For Chapter 5 By: Maan Omran Section 5.1 Central Tendency Mode: the number or numbers that occur most often. Median: the number at the midpoint of a ranked data. Ex1: The test scores
7. For the table that follows, answer the following questions: x y 1-1/4 2-1/2 3-3/4 4
 7. For the table that follows, answer the following questions: x y 1-1/4 2-1/2 3-3/4 4 - Would the correlation between x and y in the table above be positive or negative? The correlation is negative. -
Statistical Methods in Practice STAT/MATH 3379
 Statistical Methods in Practice STAT/MATH 3379 Dr. A. B. W. Manage Associate Professor of Mathematics & Statistics Department of Mathematics & Statistics Sam Houston State University Overview 6.1 Discrete
Week 1 Variables: Exploration, Familiarisation and Description. Descriptive Statistics.
 Week 1 Variables: Exploration, Familiarisation and Description. Descriptive Statistics. Convergent validity: the degree to which results/evidence from different tests/sources, converge on the same conclusion.
Homework: Due Wed, Nov 3 rd Chapter 8, # 48a, 55c and 56 (count as 1), 67a
, 67a") Homework: Due Wed, Nov 3 rd Chapter 8, # 48a, 55c and 56 (count as 1), 67a Announcements: There are some office hour changes for Nov 5, 8, 9 on website Week 5 quiz begins after class today and ends at
Homework: Due Wed, Nov 3 rd Chapter 8, # 48a, 55c and 56 (count as 1), 67a Announcements: There are some office hour changes for Nov 5, 8, 9 on website Week 5 quiz begins after class today and ends at
Session 178 TS, Stats for Health Actuaries. Moderator: Ian G. Duncan, FSA, FCA, FCIA, FIA, MAAA. Presenter: Joan C. Barrett, FSA, MAAA
 Session 178 TS, Stats for Health Actuaries Moderator: Ian G. Duncan, FSA, FCA, FCIA, FIA, MAAA Presenter: Joan C. Barrett, FSA, MAAA Session 178 Statistics for Health Actuaries October 14, 2015 Presented
Chapter 8. Variables. Copyright 2004 Brooks/Cole, a division of Thomson Learning, Inc.
 Chapter 8 Random Variables Copyright 2004 Brooks/Cole, a division of Thomson Learning, Inc. 8.1 What is a Random Variable? Random Variable: assigns a number to each outcome of a random circumstance, or,
CHAPTER 6 Random Variables
 CHAPTER 6 Random Variables 6.1 Discrete and Continuous Random Variables The Practice of Statistics, 5th Edition Starnes, Tabor, Yates, Moore Bedford Freeman Worth Publishers Discrete and Continuous Random
Biostatistics and Design of Experiments Prof. Mukesh Doble Department of Biotechnology Indian Institute of Technology, Madras
 Biostatistics and Design of Experiments Prof. Mukesh Doble Department of Biotechnology Indian Institute of Technology, Madras Lecture - 05 Normal Distribution So far we have looked at discrete distributions
Section Random Variables and Histograms
 Section 3.1 - Random Variables and Histograms Definition: A random variable is a rule that assigns a number to each outcome of an experiment. Example 1: Suppose we toss a coin three times. Then we could
5.2 Random Variables, Probability Histograms and Probability Distributions
 Chapter 5 5.2 Random Variables, Probability Histograms and Probability Distributions A random variable (r.v.) can be either continuous or discrete. It takes on the possible values of an experiment. It
Stat 101 Exam 1 - Embers Important Formulas and Concepts 1
 1 Chapter 1 1.1 Definitions Stat 101 Exam 1 - Embers Important Formulas and Concepts 1 1. Data Any collection of numbers, characters, images, or other items that provide information about something. 2.
MBEJ 1023 Dr. Mehdi Moeinaddini Dept. of Urban & Regional Planning Faculty of Built Environment
 MBEJ 1023 Planning Analytical Methods Dr. Mehdi Moeinaddini Dept. of Urban & Regional Planning Faculty of Built Environment Contents What is statistics? Population and Sample Descriptive Statistics Inferential
The instructions on this page also work for the TI-83 Plus and the TI-83 Plus Silver Edition.
 The instructions on this page also work for the TI-83 Plus and the TI-83 Plus Silver Edition. The position of the graphically represented keys can be found by moving your mouse on top of the graphic. Turn
AP Stats ~ Lesson 6B: Transforming and Combining Random variables
 AP Stats ~ Lesson 6B: Transforming and Combining Random variables OBJECTIVES: DESCRIBE the effects of transforming a random variable by adding or subtracting a constant and multiplying or dividing by a
Discrete Probability Distributions and application in Business
 http://wiki.stat.ucla.edu/socr/index.php/socr_courses_2008_thomson_econ261 Discrete Probability Distributions and application in Business By Grace Thomson DISCRETE PROBALITY DISTRIBUTIONS Discrete Probabilities
Descriptive Statistics
 Chapter 3 Descriptive Statistics Chapter 2 presented graphical techniques for organizing and displaying data. Even though such graphical techniques allow the researcher to make some general observations
Important Terms. Summary. multinomial distribution 234 Poisson distribution 235. expected value 220 hypergeometric distribution 238
 6 6 Summary Many variables have special probability distributions. This chapter presented several of the most common probability distributions, including the binomial distribution, the multinomial distribution,
ECOSOC MS EXCEL LECTURE SERIES DISTRIBUTIONS
 ECOSOC MS EXCEL LECTURE SERIES DISTRIBUTIONS Module Excel provides probabilities for the following functions: (Note- There are many other functions also but here we discuss only those which will help in
Chapter 5. Discrete Probability Distributions. Random Variables
 Chapter 5 Discrete Probability Distributions Random Variables x is a random variable which is a numerical description of the outcome of an experiment. Discrete: If the possible values change by steps or
Probability Distributions. Chapter 6
 Probability Distributions Chapter 6 McGraw-Hill/Irwin The McGraw-Hill Companies, Inc. 2008 GOALS Define the terms probability distribution and random variable. Distinguish between discrete and continuous
In a binomial experiment of n trials, where p = probability of success and q = probability of failure. mean variance standard deviation
 Name In a binomial experiment of n trials, where p = probability of success and q = probability of failure mean variance standard deviation µ = n p σ = n p q σ = n p q Notation X ~ B(n, p) The probability
Discrete Probability Distributions
 Discrete Probability Distributions Chapter 6 McGraw-Hill/Irwin Copyright 2010 by The McGraw-Hill Companies, Inc. All rights reserved. GOALS 6-2 1. Define the terms probability distribution and random variable.
UNIVERSITY OF TORONTO SCARBOROUGH Department of Computer and Mathematical Sciences. STAB22H3 Statistics I Duration: 1 hour and 45 minutes
 UNIVERSITY OF TORONTO SCARBOROUGH Department of Computer and Mathematical Sciences STAB22H3 Statistics I Duration: 1 hour and 45 minutes Last Name: First Name: Student number: Aids allowed: - One handwritten
Section Introduction to Normal Distributions
 Section 6.1-6.2 Introduction to Normal Distributions 2012 Pearson Education, Inc. All rights reserved. 1 of 105 Section 6.1-6.2 Objectives Interpret graphs of normal probability distributions Find areas
Business Statistics 41000: Probability 4
 Business Statistics 41000: Probability 4 Drew D. Creal University of Chicago, Booth School of Business February 14 and 15, 2014 1 Class information Drew D. Creal Email: dcreal@chicagobooth.edu Office:
Econ 6900: Statistical Problems. Instructor: Yogesh Uppal
 Econ 6900: Statistical Problems Instructor: Yogesh Uppal Email: yuppal@ysu.edu Lecture Slides 4 Random Variables Probability Distributions Discrete Distributions Discrete Uniform Probability Distribution
Appendix A. Selecting and Using Probability Distributions. In this appendix
 Appendix A Selecting and Using Probability Distributions In this appendix Understanding probability distributions Selecting a probability distribution Using basic distributions Using continuous distributions
ก ก ก ก ก ก ก. ก (Food Safety Risk Assessment Workshop) 1 : Fundamental ( ก ( NAC 2010)) 2 3 : Excel and Statistics Simulation Software\
 1 : Fundamental ( ก ( NAC 2010)) 2 3 : Excel and Statistics Simulation Software\") ก ก ก ก (Food Safety Risk Assessment Workshop) ก ก ก ก ก ก ก ก 5 1 : Fundamental ( ก 29-30.. 53 ( NAC 2010)) 2 3 : Excel and Statistics Simulation Software\ 1 4 2553 4 5 : Quantitative Risk Modeling Microbial
ก ก ก ก (Food Safety Risk Assessment Workshop) ก ก ก ก ก ก ก ก 5 1 : Fundamental ( ก 29-30.. 53 ( NAC 2010)) 2 3 : Excel and Statistics Simulation Software\ 1 4 2553 4 5 : Quantitative Risk Modeling Microbial
Continuous Probability Distributions
 8.1 Continuous Probability Distributions Distributions like the binomial probability distribution and the hypergeometric distribution deal with discrete data. The possible values of the random variable
Chapter 4. The Normal Distribution
 Chapter 4 The Normal Distribution 1 Chapter 4 Overview Introduction 4-1 Normal Distributions 4-2 Applications of the Normal Distribution 4-3 The Central Limit Theorem 4-4 The Normal Approximation to the
2017 Fall QMS102 Tip Sheet 2
 Chapter 5: Basic Probability 2017 Fall QMS102 Tip Sheet 2 (Covering Chapters 5 to 8) EVENTS -- Each possible outcome of a variable is an event, including 3 types. 1. Simple event = Described by a single
Statistics (This summary is for chapters 17, 28, 29 and section G of chapter 19)
") Statistics (This summary is for chapters 17, 28, 29 and section G of chapter 19) Mean, Median, Mode Mode: most common value Median: middle value (when the values are in order) Mean = total how many = x
Statistics (This summary is for chapters 17, 28, 29 and section G of chapter 19) Mean, Median, Mode Mode: most common value Median: middle value (when the values are in order) Mean = total how many = x
MBA 7020 Sample Final Exam
 Descriptive Measures, Confidence Intervals MBA 7020 Sample Final Exam Given the following sample of weight measurements (in pounds) of 25 children aged 4, answer the following questions(1 through 3): 45,
Lecture 7 Random Variables
 Lecture 7 Random Variables Definition: A random variable is a variable whose value is a numerical outcome of a random phenomenon, so its values are determined by chance. We shall use letters such as X
Chapter 7. Random Variables
 Chapter 7 Random Variables Making quantifiable meaning out of categorical data Toss three coins. What does the sample space consist of? HHH, HHT, HTH, HTT, TTT, TTH, THT, THH In statistics, we are most
ME3620. Theory of Engineering Experimentation. Spring Chapter III. Random Variables and Probability Distributions.
 ME3620 Theory of Engineering Experimentation Chapter III. Random Variables and Probability Distributions Chapter III 1 3.2 Random Variables In an experiment, a measurement is usually denoted by a variable
Chapter 6 Confidence Intervals
 Chapter 6 Confidence Intervals Section 6-1 Confidence Intervals for the Mean (Large Samples) VOCABULARY: Point Estimate A value for a parameter. The most point estimate of the population parameter is the
CHAPTER 1. Find the mean, median and mode for the number of returns prepared by each accountant.
 CHAPTER 1 TUTORIAL 1. Explain the term below : i. Statistics ii. Population iii. Sample 2. A questionnaire provides 58 Yes, 42 No and 20 no-opinion. i. In the construction of a pie chart, how many degrees
Homework: Due Wed, Feb 20 th. Chapter 8, # 60a + 62a (count together as 1), 74, 82
, 74, 82") Announcements: Week 5 quiz begins at 4pm today and ends at 3pm on Wed If you take more than 20 minutes to complete your quiz, you will only receive partial credit. (It doesn t cut you off.) Today: Sections
Announcements: Week 5 quiz begins at 4pm today and ends at 3pm on Wed If you take more than 20 minutes to complete your quiz, you will only receive partial credit. (It doesn t cut you off.) Today: Sections
The normal distribution is a theoretical model derived mathematically and not empirically.
 Sociology 541 The Normal Distribution Probability and An Introduction to Inferential Statistics Normal Approximation The normal distribution is a theoretical model derived mathematically and not empirically.
DATA HANDLING Five-Number Summary
 DATA HANDLING Five-Number Summary The five-number summary consists of the minimum and maximum values, the median, and the upper and lower quartiles. The minimum and the maximum are the smallest and greatest
$0.00 $0.50 $1.00 $1.50 $2.00 $2.50 $3.00 $3.50 $4.00 Price
 Orange Juice Sales and Prices In this module, you will be looking at sales and price data for orange juice in grocery stores. You have data from 83 stores on three brands (Tropicana, Minute Maid, and the
Example - Let X be the number of boys in a 4 child family. Find the probability distribution table:
 Chapter8 Probability Distributions and Statistics Section 8.1 Distributions of Random Variables tthe value of the result of the probability experiment is a RANDOM VARIABLE. Example - Let X be the number
The probability of having a very tall person in our sample. We look to see how this random variable is distributed.
 Distributions We're doing things a bit differently than in the text (it's very similar to BIOL 214/312 if you've had either of those courses). 1. What are distributions? When we look at a random variable,
Part 1 In which we meet the law of averages. The Law of Averages. The Expected Value & The Standard Error. Where Are We Going?
 1 The Law of Averages The Expected Value & The Standard Error Where Are We Going? Sums of random numbers The law of averages Box models for generating random numbers Sums of draws: the Expected Value Standard
DESCRIBING DATA: MESURES OF LOCATION
 DESCRIBING DATA: MESURES OF LOCATION A. Measures of Central Tendency Measures of Central Tendency are used to pinpoint the center or average of a data set which can then be used to represent the typical
Some Characteristics of Data
 Some Characteristics of Data Not all data is the same, and depending on some characteristics of a particular dataset, there are some limitations as to what can and cannot be done with that data. Some key
INF FALL NATURAL LANGUAGE PROCESSING. Jan Tore Lønning, Lecture 3, 1.9
 INF5830 015 FALL NATURAL LANGUAGE PROCESSING Jan Tore Lønning, Lecture 3, 1.9 Today: More statistics Binomial distribution Continuous random variables/distributions Normal distribution Sampling and sampling
Chapter 4 and 5 Note Guide: Probability Distributions
 Chapter 4 and 5 Note Guide: Probability Distributions Probability Distributions for a Discrete Random Variable A discrete probability distribution function has two characteristics: Each probability is
Discrete Probability Distributions
 90 Discrete Probability Distributions Discrete Probability Distributions C H A P T E R 6 Section 6.2 4Example 2 (pg. 00) Constructing a Binomial Probability Distribution In this example, 6% of the human
6.1 Binomial Theorem
 Unit 6 Probability AFM Valentine 6.1 Binomial Theorem Objective: I will be able to read and evaluate binomial coefficients. I will be able to expand binomials using binomial theorem. Vocabulary Binomial
5.1 Personal Probability
 5. Probability Value Page 1 5.1 Personal Probability Although we think probability is something that is confined to math class, in the form of personal probability it is something we use to make decisions
BARUCH COLLEGE MATH 2003 SPRING 2006 MANUAL FOR THE UNIFORM FINAL EXAMINATION
 BARUCH COLLEGE MATH 003 SPRING 006 MANUAL FOR THE UNIFORM FINAL EXAMINATION The final examination for Math 003 will consist of two parts. Part I: Part II: This part will consist of 5 questions similar
THE UNIVERSITY OF THE WEST INDIES (DEPARTMENT OF MANAGEMENT STUDIES)
") THE UNIVERSITY OF THE WEST INDIES (DEPARTMENT OF MANAGEMENT STUDIES) Mid-Semester Exam: Summer2005 June 20:2005; 7:00 9:00 pm MS 23C: Introduction to Quantitative Methods Instructions 1. This exam has
THE UNIVERSITY OF THE WEST INDIES (DEPARTMENT OF MANAGEMENT STUDIES) Mid-Semester Exam: Summer2005 June 20:2005; 7:00 9:00 pm MS 23C: Introduction to Quantitative Methods Instructions 1. This exam has
CHAPTER 2 Describing Data: Numerical
 CHAPTER Multiple-Choice Questions 1. A scatter plot can illustrate all of the following except: A) the median of each of the two variables B) the range of each of the two variables C) an indication of
Solutions for practice questions: Chapter 15, Probability Distributions If you find any errors, please let me know at
 Solutions for practice questions: Chapter 15, Probability Distributions If you find any errors, please let me know at mailto:msfrisbie@pfrisbie.com. 1. Let X represent the savings of a resident; X ~ N(3000,
GOALS. Discrete Probability Distributions. A Distribution. What is a Probability Distribution? Probability for Dice Toss. A Probability Distribution
 GOALS Discrete Probability Distributions Chapter 6 Dr. Richard Jerz Define the terms probability distribution and random variable. Distinguish between discrete and continuous probability distributions.
Chapter 6: Random Variables. Ch. 6-3: Binomial and Geometric Random Variables
 Chapter : Random Variables Ch. -3: Binomial and Geometric Random Variables X 0 2 3 4 5 7 8 9 0 0 P(X) 3???????? 4 4 When the same chance process is repeated several times, we are often interested in whether
Discrete Probability Distributions Chapter 6 Dr. Richard Jerz
 Discrete Probability Distributions Chapter 6 Dr. Richard Jerz 1 GOALS Define the terms probability distribution and random variable. Distinguish between discrete and continuous probability distributions.
Chapter 7: Random Variables
 Chapter 7: Random Variables 7.1 Discrete and Continuous Random Variables 7.2 Means and Variances of Random Variables 1 Introduction A random variable is a function that associates a unique numerical value
ECON 214 Elements of Statistics for Economists
 ECON 214 Elements of Statistics for Economists Session 7 The Normal Distribution Part 1 Lecturer: Dr. Bernardin Senadza, Dept. of Economics Contact Information: bsenadza@ug.edu.gh College of Education
PROBABILITY DISTRIBUTIONS
 CHAPTER 3 PROBABILITY DISTRIBUTIONS Page Contents 3.1 Introduction to Probability Distributions 51 3.2 The Normal Distribution 56 3.3 The Binomial Distribution 60 3.4 The Poisson Distribution 64 Exercise
Please show work for all calculated answers. Show work in a neat and organized manner.
 Math 083 Review for Final Exam Name Please show work for all calculated answers. Show work in a neat and organized manner. 1) Using the frequency table for a monthly budget, find all of the relative frequencies
EXERCISES FOR PRACTICE SESSION 2 OF STAT CAMP
 EXERCISES FOR PRACTICE SESSION 2 OF STAT CAMP Note 1: The exercises below that are referenced by chapter number are taken or modified from the following open-source online textbook that was adapted by
IOP 201-Q (Industrial Psychological Research) Tutorial 5
 Tutorial 5") IOP 201-Q (Industrial Psychological Research) Tutorial 5 TRUE/FALSE [1 point each] Indicate whether the sentence or statement is true or false. 1. To establish a cause-and-effect relation between two variables,
IOP 201-Q (Industrial Psychological Research) Tutorial 5 TRUE/FALSE [1 point each] Indicate whether the sentence or statement is true or false. 1. To establish a cause-and-effect relation between two variables,
Random Variables. 6.1 Discrete and Continuous Random Variables. Probability Distribution. Discrete Random Variables. Chapter 6, Section 1
 6.1 Discrete and Continuous Random Variables Random Variables A random variable, usually written as X, is a variable whose possible values are numerical outcomes of a random phenomenon. There are two types
The Binomial and Geometric Distributions. Chapter 8
 The Binomial and Geometric Distributions Chapter 8 8.1 The Binomial Distribution A binomial experiment is statistical experiment that has the following properties: The experiment consists of n repeated
Binomial and multinomial distribution
 1-Binomial distribution Binomial and multinomial distribution The binomial probability refers to the probability that a binomial experiment results in exactly "x" successes. The probability of an event
X P(X) (c) Express the event performing at least two tests in terms of X and find its probability.
 (c) Express the event performing at least two tests in terms of X and find its probability.") AP Stats ~ QUIZ 6 Name Period 1. The probability distribution below is for the random variable X = number of medical tests performed on a randomly selected outpatient at a certain hospital. X 0 1 2 3 4
AP Stats ~ QUIZ 6 Name Period 1. The probability distribution below is for the random variable X = number of medical tests performed on a randomly selected outpatient at a certain hospital. X 0 1 2 3 4