Lecture 3. Sampling distributions. Counts, Proportions, and sample mean.
|
|
|
- Silvester Ball
- 5 years ago
- Views:
Transcription
1 Lecture 3 Sampling distributions. Counts, Proportions, and sample mean.
2 Statistical Inference: Uses data and summary statistics (mean, variances, proportions, slopes) to draw conclusions about a population or process. Statistic: Any random variable measured from a random sample or in a random experiment. Sampling distribution of a statistic: shows how a statistic varies in repeated measurements of an experiment. The probability distribution of a statistic is called its sampling distribution. Population distribution of a statistic: distribution of values for all members of the population. Unknown, but estimable using laws of statistics.
3 Sampling Distribution for Counts and Proportions: In a survey of 2500 engineers, 600 of them say they would consider working as a consultant. Let X = the number who would work as consultants. X is a count: Sample Proportion of people who would work as consultants: Distinguish count from sample proportion, they have different distributions.
4 Binomial Distribution for Sample Counts: Distribution of the count, X, of successes in a binomial setting with parameters n and p n = number of observations p = P (Success) on any one observation X can take values from 0 to n Notation: X ~ Bin (n, p) Setting: 1. Fixed number of n observations 2. All observations are independent of each other 3. Each observation falls into one of two categories: Success or Failure 4. P (Success) = P (S) = p
5 EXAMPLES (Bin or not Bin) Toss a fair coin 10 times and count the number X of heads. What about a biased coin? Deal 10 cards from a shuffled deck of 52. X is the number of spades. Suggestions?? Number of girls born among first 100 children in a (large) hospital this year. Number of girls born in this hospital so far this year.
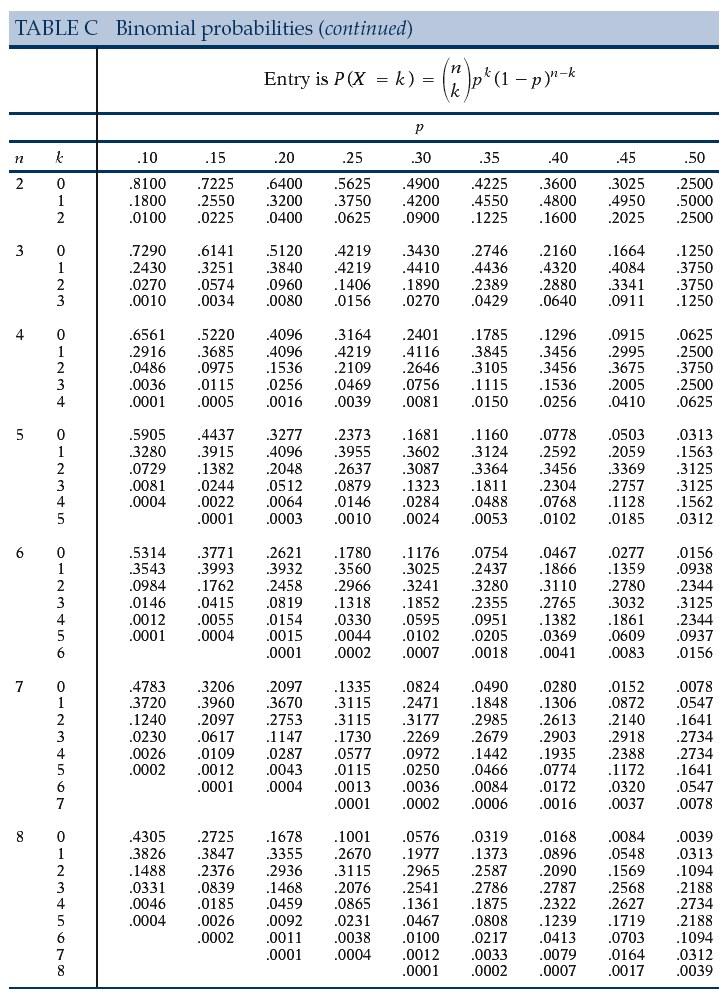
6 Finding Binomial Probabilities Use Table C: page T-6 (How to: - find your n = number of observations find your p = probability of success find the probability corresponding to k = number of successes you are interested in) You can use R as well to evaluate probabilities:» pbinom(4,size=10,prob=0.15) (calculates P(Bin(10,0.15)<=4) )» [1] If you want the entry in the table do:» pbinom(4,size=10,prob=0.15)-pbinom(3,size=10,prob=0.15)» [1]
7
8
9
10
11 Example Your job is to examine light bulbs on an assembly line. You are interested in finding the probability of getting a defective light bulb, after examining 10 light bulbs. Let X = number of defective light bulbs P (defective) =.15 N = Is this a binomial set up? 2. What is the probability that you get at most 2 defective light bulbs? 3. What is the probability that the number of defective light bulbs you find is greater than eight? 4. What is the probability that you find between 3 and 5 defective light bulbs?
12 Binomial Mean and Standard Deviation μ X = np σ 2 x = np(1 p) σ x = np( 1 p) Example: Find the mean and standard deviation of the previous problems
13 Sample Proportions Let X be a count of successes in n = total number of observations in the data set. Then the sample proportion: p ˆ = X n NOTE!!!! We know that X is distributed as a Binomial, however is NOT distributed as a Binomial. ˆp
14
15 Normal approximation for counts and proportions If X is B(n,p), np 10 and n(1-p) 10 then: X is approximately N( np, np(1 p) ) pˆ is approximately N( p, p(1 p) ) n

16 Sampling distribution of p^ The sampling distribution of pˆ is never exactly normal. But as the sample size increases, the sampling distribution of becomes approximately normal. The normal approximation is most accurate for any fixed n when p is close to 0.5, and least accurate when p is near 0 or near 1. pˆ
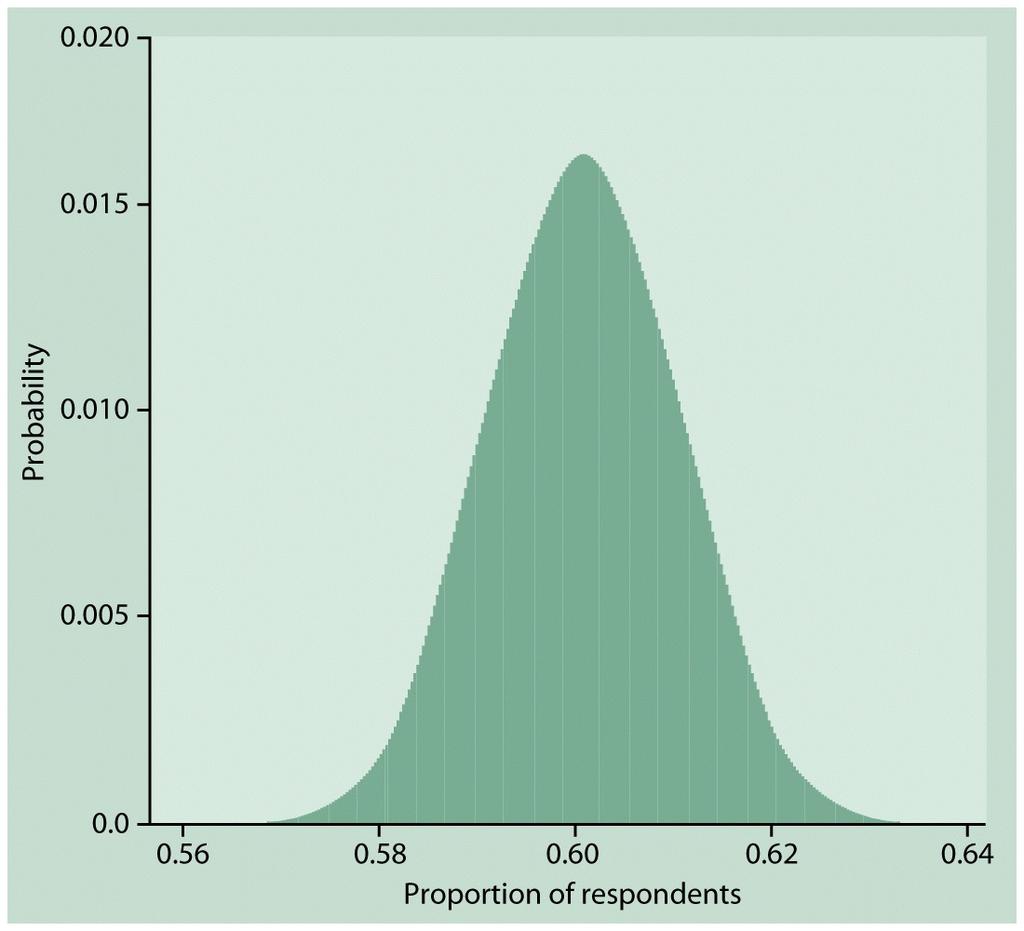
17 Example: In a survey 2500 engineers are asked if they would consider working as consultants. Suppose that 60% of the engineers would work as consultants. When we actually do the experiment 1375 say they would work as consultants Find the mean and standard deviation of pˆ. What is the probability that the percent of to be consultants in the sample is less than.58? Between.59 and.61?
18 The continuity correction: Example: According to a market research firm 52% of all residential telephone numbers in Los Angeles are unlisted. A telemarketing company uses random digit dialing equipment that dials residential numbers at random regardless of whether they are listed or not. The firm calls 500 numbers in L.A. 1. What is the exact distribution of the number X of unlisted numbers that are called? 2. Use a suitable approximation to calculate the probability that at least half the numbers are unlisted.
19 The continuity correction(cont.): In the previous problem if we compute the probability that exactly 250 people had unlisted numbers using the normal approximation we would have find this probability equals zero. That is obviously not right because this number has to have some probability (small but still not zero). The problem comes from the fact that we use a continuous distribution (Normal Distribution) to approximate a discrete one (Binomial Distribution). So to improve the approximation we use a correction: Whenever we compute a probability involving a count we will move the interval we compute 0.5 as to include or exclude the endpoints of the interval depending on the type of interval (closed or open) we compute in the problem. Then we use the normal approximation to compute the probability of this new interval.
20 Example: In the previous problem find: PX ( 250) PX> ( 250) PX= ( 250) PX< ( 250) P(248 < X < 251) P(248 < X 251) P(248 X 251)
21 Section 5.2: Sampling distribution of the sample mean Distribution of the center and spread Setup: Draw a SRS (simple random sample) of size n from a population. Measure some variable X (i.e. income) Data: n random variables, X1, X2, X3 Xn, where Xi is a measurement on 1 individual (i.e. income of 1 individual in the sample) Since the individuals are randomly chosen, the Xi s can be considered to be independent
 vs.")
22 Example: Distribution of individual stocks (up) vs. distribution of mutual funds (down)
23 Sample mean: X = X 1 + X 2 + X n X n Let X be the mean of an SRS (simple random sample) of size n from a population with mean μ and standard deviation σ. The mean and standard deviation of X are: μ σ X X = μ σ = n
24
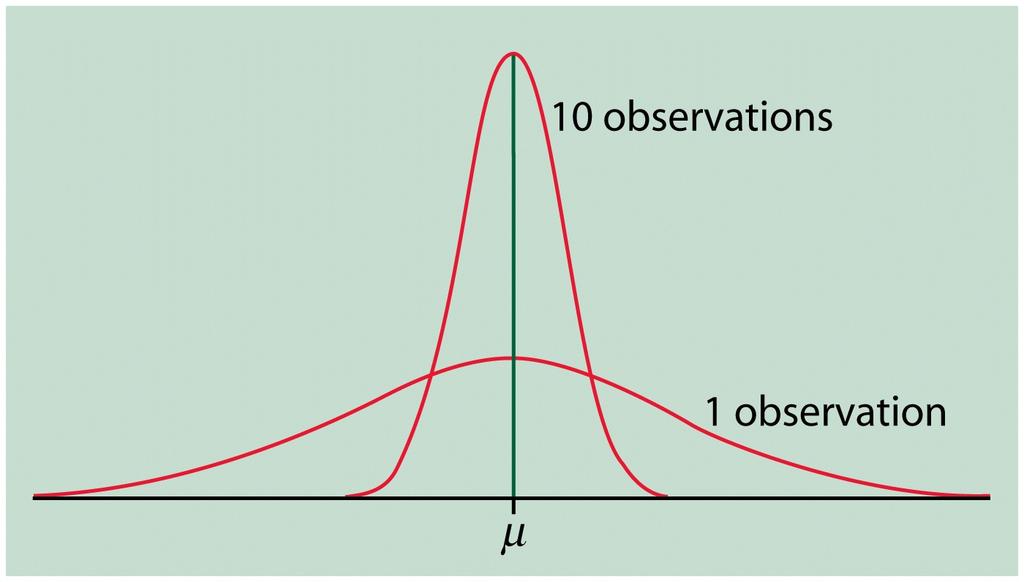
25 Central Limit Theorem: Draw a SRS of size n (n large) from any population with mean μ and standard deviation. The sampling distribution of the sample mean is approximately normal: X ~ N( μ, σ ) n Important special case: If the population is normal then the sample mean has exactly the σ normal distribution: N( μ, ) n σ
26 Example: A bank conducts an experiment to determine whether dropping their annual credit card fee will increase the amount charged on the credit card. The offer is made to a SRS of 200 customers. The bank then compares the amount the customers charged on their cards this year, to the amount charged next year. A mean increase of $308 with a standard deviation of $108 was found.
27 What is the sampling distribution of, the mean increase in amount charged? What is the probability that the mean increase in spending will be below $270? What is the probability that the mean increase in spending will be between $290 and $322? X
28 Example: 5.34 The number of accidents per week at a hazardous intersection varies with mean 2.2 and standard deviation 1.4. What is the distribution of X, the mean number of accidents in one year, (52 weeks)? What is the probability that X is less than 2? What is the probability that there are fewer than 100 accidents in a year?
29 Example: 5.67 The weight of eggs produced by a certain breed of hen is Normally distributed with mean 65 grams and standard deviation 5 grams. Let cartons of such eggs be considered to be SRSs of size 12. What is the probability that the weight of a carton falls between 750 grams and 825 grams?
30 Practical note Large samples are not always attainable. Sometimes the cost, difficulty, or preciousness of what is studied drastically limits any possible sample size. Blood samples/biopsies: No more than a handful of repetitions acceptable. Often, we even make do with just one. Opinion polls have a limited sample size due to time and cost of operation. During election times, though, sample sizes are increased for better accuracy. Not all variables are normally distributed. Income, for example, is typically strongly skewed. Is x still a good estimator of μ then?
.")
31 The central limit theorem Central Limit Theorem: When randomly sampling from any population with mean μ and standard deviation σ, when n is large enough, the sampling distribution of x bar is approximately normal: ~ N(μ, σ/ n). Population with strongly skewed distribution Sampling distribution of x for n = 2 observations Sampling distribution of x for n = 10 observations Sampling distribution of x for n = 25 observations

32 Income distribution Let s consider the very large database of individual incomes from the Bureau of Labor Statistics as our population. It is strongly right skewed. We take 1000 SRSs of 100 incomes, calculate the sample mean for each, and make a histogram of these 1000 means. We also take 1000 SRSs of 25 incomes, calculate the sample mean for each, and make a histogram of these 1000 means. Which histogram corresponds to the samples of size 100? 25?
33 How large a sample size? It depends on the population distribution. More observations are required if the population distribution is far from normal. A sample size of 25 is generally enough to obtain a normal sampling distribution from a strong skewness or even mild outliers. A sample size of 40 will typically be good enough to overcome extreme skewness and outliers. In many cases, n = 25 isn t a huge sample. Thus, even for strange population distributions we can assume a normal sampling distribution of the mean and work with it to solve problems.
34 Sampling distributions Atlantic acorn sizes (in cm 3 ) sample of 28 acorns: Frequency Describe the histogram. What do you assume for the population distribution? More Acorn sizes What would be the shape of the sampling distribution of the mean: For samples of size 5? For samples of size 15? For samples of size 50?

35 Further properties Any linear combination of independent random variables is also normally distributed. More generally, the central limit theorem is valid as long as we are sampling many small random events, even if the events have different distributions (as long as no one random event dominates the others). Why is this cool? It explains why the normal distribution is so common. Example: Height seems to be determined by a large number of genetic and environmental factors, like nutrition. The individuals are genes and environmental factors. Your height is a mean.
36 Weibull distributions There are many probability distributions beyond the binomial and normal distributions used to model data in various circumstances. Weibull distributions are used to model time to failure/product lifetime and are common in engineering to study product reliability. Product lifetimes can be measured in units of time, distances, or number of cycles for example. Some applications include: Quality control (breaking strength of products and parts, food shelf life) Maintenance planning (scheduled car revision, airplane maintenance) Cost analysis and control (number of returns under warranty, delivery time) Research (materials properties, microbial resistance to treatment)
37 Density curves of three members of the Weibull family describing a different type of product time to failure in manufacturing: Infant mortality: Many products fail immediately and the remainder last a long time. Manufacturers only ship the products after inspection. Early failure: Products usually fail shortly after they are sold. The design or production must be fixed. Old-age wear out: Most products wear out over time and many fail at about the same age. This should be disclosed to customers.
Sampling Distributions For Counts and Proportions
 Sampling Distributions For Counts and Proportions IPS Chapter 5.1 2009 W. H. Freeman and Company Objectives (IPS Chapter 5.1) Sampling distributions for counts and proportions Binomial distributions for
Section The Sampling Distribution of a Sample Mean
 Section 5.2 - The Sampling Distribution of a Sample Mean Statistics 104 Autumn 2004 Copyright c 2004 by Mark E. Irwin The Sampling Distribution of a Sample Mean Example: Quality control check of light
The Binomial Probability Distribution
 The Binomial Probability Distribution MATH 130, Elements of Statistics I J. Robert Buchanan Department of Mathematics Fall 2017 Objectives After this lesson we will be able to: determine whether a probability
Sampling. Marc H. Mehlman University of New Haven. Marc Mehlman (University of New Haven) Sampling 1 / 20.
 Sampling 1 / 20.") Sampling Marc H. Mehlman marcmehlman@yahoo.com University of New Haven (University of New Haven) Sampling 1 / 20 Table of Contents 1 Sampling Distributions 2 Central Limit Theorem 3 Binomial Distribution
Sampling Marc H. Mehlman marcmehlman@yahoo.com University of New Haven (University of New Haven) Sampling 1 / 20 Table of Contents 1 Sampling Distributions 2 Central Limit Theorem 3 Binomial Distribution
8.1 Binomial Distributions
 8.1 Binomial Distributions The Binomial Setting The 4 Conditions of a Binomial Setting: 1.Each observation falls into 1 of 2 categories ( success or fail ) 2 2.There is a fixed # n of observations. 3.All
Probability & Sampling The Practice of Statistics 4e Mostly Chpts 5 7
 Probability & Sampling The Practice of Statistics 4e Mostly Chpts 5 7 Lew Davidson (Dr.D.) Mallard Creek High School Lewis.Davidson@cms.k12.nc.us 704-786-0470 Probability & Sampling The Practice of Statistics
Chapter 4: Commonly Used Distributions. Statistics for Engineers and Scientists Fourth Edition William Navidi
 Chapter 4: Commonly Used Distributions Statistics for Engineers and Scientists Fourth Edition William Navidi 2014 by Education. This is proprietary material solely for authorized instructor use. Not authorized
The binomial distribution p314
 The binomial distribution p314 Example: A biased coin (P(H) = p = 0.6) ) is tossed 5 times. Let X be the number of H s. Fine P(X = 2). This X is a binomial r. v. The binomial setting p314 1. There are
ECON 214 Elements of Statistics for Economists 2016/2017
 ECON 214 Elements of Statistics for Economists 2016/2017 Topic The Normal Distribution Lecturer: Dr. Bernardin Senadza, Dept. of Economics bsenadza@ug.edu.gh College of Education School of Continuing and
2011 Pearson Education, Inc
 Statistics for Business and Economics Chapter 4 Random Variables & Probability Distributions Content 1. Two Types of Random Variables 2. Probability Distributions for Discrete Random Variables 3. The Binomial
Data Analysis and Statistical Methods Statistics 651
 Review of previous lecture: Why confidence intervals? Data Analysis and Statistical Methods Statistics 651 http://www.stat.tamu.edu/~suhasini/teaching.html Suhasini Subba Rao Suppose you want to know the
Chapter 6: Random Variables
 Chapter 6: Random Variables Section 6.3 The Practice of Statistics, 4 th edition For AP* STARNES, YATES, MOORE Chapter 6 Random Variables 6.1 Discrete and Continuous Random Variables 6.2 Transforming and
Random Variables CHAPTER 6.3 BINOMIAL AND GEOMETRIC RANDOM VARIABLES
 Random Variables CHAPTER 6.3 BINOMIAL AND GEOMETRIC RANDOM VARIABLES Essential Question How can I determine whether the conditions for using binomial random variables are met? Binomial Settings When the
Commonly Used Distributions
 Chapter 4: Commonly Used Distributions 1 Introduction Statistical inference involves drawing a sample from a population and analyzing the sample data to learn about the population. We often have some knowledge
Chapter 8: Binomial and Geometric Distributions
 Chapter 8: Binomial and Geometric Distributions Section 8.1 Binomial Distributions The Practice of Statistics, 4 th edition For AP* STARNES, YATES, MOORE Section 8.1 Binomial Distribution Learning Objectives
Chapter 5. Sampling Distributions
 Lecture notes, Lang Wu, UBC 1 Chapter 5. Sampling Distributions 5.1. Introduction In statistical inference, we attempt to estimate an unknown population characteristic, such as the population mean, µ,
Chapter 9: Sampling Distributions
 Chapter 9: Sampling Distributions 9. Introduction This chapter connects the material in Chapters 4 through 8 (numerical descriptive statistics, sampling, and probability distributions, in particular) with
Midterm Exam III Review
 Midterm Exam III Review Dr. Joseph Brennan Math 148, BU Dr. Joseph Brennan (Math 148, BU) Midterm Exam III Review 1 / 25 Permutations and Combinations ORDER In order to count the number of possible ways
***SECTION 8.1*** The Binomial Distributions
 ***SECTION 8.1*** The Binomial Distributions CHAPTER 8 ~ The Binomial and Geometric Distributions In practice, we frequently encounter random phenomenon where there are two outcomes of interest. For example,
chapter 13: Binomial Distribution Exercises (binomial)13.6, 13.12, 13.22, 13.43
13.6, 13.12, 13.22, 13.43") chapter 13: Binomial Distribution ch13-links binom-tossing-4-coins binom-coin-example ch13 image Exercises (binomial)13.6, 13.12, 13.22, 13.43 CHAPTER 13: Binomial Distributions The Basic Practice of Statistics
chapter 13: Binomial Distribution ch13-links binom-tossing-4-coins binom-coin-example ch13 image Exercises (binomial)13.6, 13.12, 13.22, 13.43 CHAPTER 13: Binomial Distributions The Basic Practice of Statistics
4-1. Chapter 4. Commonly Used Distributions by The McGraw-Hill Companies, Inc. All rights reserved.
 4-1 Chapter 4 Commonly Used Distributions 2014 by The Companies, Inc. All rights reserved. Section 4.1: The Bernoulli Distribution 4-2 We use the Bernoulli distribution when we have an experiment which
Chapter 7: Random Variables
 Chapter 7: Random Variables 7.1 Discrete and Continuous Random Variables 7.2 Means and Variances of Random Variables 1 Introduction A random variable is a function that associates a unique numerical value
Binomial Random Variable - The count X of successes in a binomial setting
 6.3.1 Binomial Settings and Binomial Random Variables What do the following scenarios have in common? Toss a coin 5 times. Count the number of heads. Spin a roulette wheel 8 times. Record how many times
Sampling Distributions
 AP Statistics Ch. 7 Notes Sampling Distributions A major field of statistics is statistical inference, which is using information from a sample to draw conclusions about a wider population. Parameter:
Sampling and sampling distribution
 Sampling and sampling distribution September 12, 2017 STAT 101 Class 5 Slide 1 Outline of Topics 1 Sampling 2 Sampling distribution of a mean 3 Sampling distribution of a proportion STAT 101 Class 5 Slide
Elementary Statistics Lecture 5
 Elementary Statistics Lecture 5 Sampling Distributions Chong Ma Department of Statistics University of South Carolina Chong Ma (Statistics, USC) STAT 201 Elementary Statistics 1 / 24 Outline 1 Introduction
ME3620. Theory of Engineering Experimentation. Spring Chapter III. Random Variables and Probability Distributions.
 ME3620 Theory of Engineering Experimentation Chapter III. Random Variables and Probability Distributions Chapter III 1 3.2 Random Variables In an experiment, a measurement is usually denoted by a variable
Statistics 6 th Edition
 Statistics 6 th Edition Chapter 5 Discrete Probability Distributions Chap 5-1 Definitions Random Variables Random Variables Discrete Random Variable Continuous Random Variable Ch. 5 Ch. 6 Chap 5-2 Discrete
Math 227 Elementary Statistics. Bluman 5 th edition
 Math 227 Elementary Statistics Bluman 5 th edition CHAPTER 6 The Normal Distribution 2 Objectives Identify distributions as symmetrical or skewed. Identify the properties of the normal distribution. Find
Business Statistics 41000: Probability 4
 Business Statistics 41000: Probability 4 Drew D. Creal University of Chicago, Booth School of Business February 14 and 15, 2014 1 Class information Drew D. Creal Email: dcreal@chicagobooth.edu Office:
AMS 7 Sampling Distributions, Central limit theorem, Confidence Intervals Lecture 4
 AMS 7 Sampling Distributions, Central limit theorem, Confidence Intervals Lecture 4 Department of Applied Mathematics and Statistics, University of California, Santa Cruz Summer 2014 1 / 26 Sampling Distributions!!!!!!
Name Period AP Statistics Unit 5 Review
 Name Period AP Statistics Unit 5 Review Multiple Choice 1. Jay Olshansky from the University of Chicago was quoted in Chance News as arguing that for the average life expectancy to reach 100, 18% of people
STAT 241/251 - Chapter 7: Central Limit Theorem
 STAT 241/251 - Chapter 7: Central Limit Theorem In this chapter we will introduce the most important theorem in statistics; the central limit theorem. What have we seen so far? First, we saw that for an
CHAPTER 6 Random Variables
 CHAPTER 6 Random Variables 6.3 Binomial and Geometric Random Variables The Practice of Statistics, 5th Edition Starnes, Tabor, Yates, Moore Bedford Freeman Worth Publishers Binomial and Geometric Random
CHAPTER 5 Sampling Distributions
 CHAPTER 5 Sampling Distributions 5.1 The possible values of p^ are 0, 1/3, 2/3, and 1. These correspond to getting 0 persons with lung cancer, 1 with lung cancer, 2 with lung cancer, and all 3 with lung
The normal distribution is a theoretical model derived mathematically and not empirically.
 Sociology 541 The Normal Distribution Probability and An Introduction to Inferential Statistics Normal Approximation The normal distribution is a theoretical model derived mathematically and not empirically.
STAT Chapter 7: Central Limit Theorem
 STAT 251 - Chapter 7: Central Limit Theorem In this chapter we will introduce the most important theorem in statistics; the central limit theorem. What have we seen so far? First, we saw that for an i.i.d
AMS7: WEEK 4. CLASS 3
 AMS7: WEEK 4. CLASS 3 Sampling distributions and estimators. Central Limit Theorem Normal Approximation to the Binomial Distribution Friday April 24th, 2015 Sampling distributions and estimators REMEMBER:
Lecture Slides. Elementary Statistics Tenth Edition. by Mario F. Triola. and the Triola Statistics Series. Slide 1
 Lecture Slides Elementary Statistics Tenth Edition and the Triola Statistics Series by Mario F. Triola Slide 1 Chapter 6 Normal Probability Distributions 6-1 Overview 6-2 The Standard Normal Distribution
Chapter 6: Random Variables
 Chapter 6: Random Variables Section 6.1 Discrete and Continuous Random Variables The Practice of Statistics, 4 th edition For AP* STARNES, YATES, MOORE Chapter 6 Random Variables 6.1 Discrete and Continuous
Making Sense of Cents
 Name: Date: Making Sense of Cents Exploring the Central Limit Theorem Many of the variables that you have studied so far in this class have had a normal distribution. You have used a table of the normal
Example - Let X be the number of boys in a 4 child family. Find the probability distribution table:
 Chapter7 Probability Distributions and Statistics Distributions of Random Variables tthe value of the result of the probability experiment is a RANDOM VARIABLE. Example - Let X be the number of boys in
ECO220Y Continuous Probability Distributions: Normal Readings: Chapter 9, section 9.10
 ECO220Y Continuous Probability Distributions: Normal Readings: Chapter 9, section 9.10 Fall 2011 Lecture 8 Part 2 (Fall 2011) Probability Distributions Lecture 8 Part 2 1 / 23 Normal Density Function f
CHAPTER 5 SAMPLING DISTRIBUTIONS
 CHAPTER 5 SAMPLING DISTRIBUTIONS Sampling Variability. We will visualize our data as a random sample from the population with unknown parameter μ. Our sample mean Ȳ is intended to estimate population mean
11.5: Normal Distributions
 11.5: Normal Distributions 11.5.1 Up to now, we ve dealt with discrete random variables, variables that take on only a finite (or countably infinite we didn t do these) number of values. A continuous random
A.REPRESENTATION OF DATA
 A.REPRESENTATION OF DATA (a) GRAPHS : PART I Q: Why do we need a graph paper? Ans: You need graph paper to draw: (i) Histogram (ii) Cumulative Frequency Curve (iii) Frequency Polygon (iv) Box-and-Whisker
Part V - Chance Variability
 Part V - Chance Variability Dr. Joseph Brennan Math 148, BU Dr. Joseph Brennan (Math 148, BU) Part V - Chance Variability 1 / 78 Law of Averages In Chapter 13 we discussed the Kerrich coin-tossing experiment.
Introduction to Business Statistics QM 120 Chapter 6
 DEPARTMENT OF QUANTITATIVE METHODS & INFORMATION SYSTEMS Introduction to Business Statistics QM 120 Chapter 6 Spring 2008 Chapter 6: Continuous Probability Distribution 2 When a RV x is discrete, we can
Random Variables. 6.1 Discrete and Continuous Random Variables. Probability Distribution. Discrete Random Variables. Chapter 6, Section 1
 6.1 Discrete and Continuous Random Variables Random Variables A random variable, usually written as X, is a variable whose possible values are numerical outcomes of a random phenomenon. There are two types
Unit 5: Sampling Distributions of Statistics
 Unit 5: Sampling Distributions of Statistics Statistics 571: Statistical Methods Ramón V. León 6/12/2004 Unit 5 - Stat 571 - Ramon V. Leon 1 Definitions and Key Concepts A sample statistic used to estimate
Example - Let X be the number of boys in a 4 child family. Find the probability distribution table:
 Chapter8 Probability Distributions and Statistics Section 8.1 Distributions of Random Variables tthe value of the result of the probability experiment is a RANDOM VARIABLE. Example - Let X be the number
Unit 5: Sampling Distributions of Statistics
 Unit 5: Sampling Distributions of Statistics Statistics 571: Statistical Methods Ramón V. León 6/12/2004 Unit 5 - Stat 571 - Ramon V. Leon 1 Definitions and Key Concepts A sample statistic used to estimate
HOMEWORK: Due Mon 11/8, Chapter 9: #15, 25, 37, 44
 This week: Chapter 9 (will do 9.6 to 9.8 later, with Chap. 11) Understanding Sampling Distributions: Statistics as Random Variables ANNOUNCEMENTS: Shandong Min will give the lecture on Friday. See website
A random variable (r. v.) is a variable whose value is a numerical outcome of a random phenomenon.
 is a variable whose value is a numerical outcome of a random phenomenon.") Chapter 14: random variables p394 A random variable (r. v.) is a variable whose value is a numerical outcome of a random phenomenon. Consider the experiment of tossing a coin. Define a random variable
Chapter 14: random variables p394 A random variable (r. v.) is a variable whose value is a numerical outcome of a random phenomenon. Consider the experiment of tossing a coin. Define a random variable
Chapter 9 & 10. Multiple Choice.
 Chapter 9 & 10 Review Name Multiple Choice. 1. An agricultural researcher plants 25 plots with a new variety of corn. The average yield for these plots is X = 150 bushels per acre. Assume that the yield
LESSON 7 INTERVAL ESTIMATION SAMIE L.S. LY
 LESSON 7 INTERVAL ESTIMATION SAMIE L.S. LY 1 THIS WEEK S PLAN Part I: Theory + Practice ( Interval Estimation ) Part II: Theory + Practice ( Interval Estimation ) z-based Confidence Intervals for a Population
Statistical Methods in Practice STAT/MATH 3379
 Statistical Methods in Practice STAT/MATH 3379 Dr. A. B. W. Manage Associate Professor of Mathematics & Statistics Department of Mathematics & Statistics Sam Houston State University Overview 6.1 Discrete
Version A. Problem 1. Let X be the continuous random variable defined by the following pdf: 1 x/2 when 0 x 2, f(x) = 0 otherwise.
 = 0 otherwise.") Math 224 Q Exam 3A Fall 217 Tues Dec 12 Version A Problem 1. Let X be the continuous random variable defined by the following pdf: { 1 x/2 when x 2, f(x) otherwise. (a) Compute the mean µ E[X]. E[X] x
Math 224 Q Exam 3A Fall 217 Tues Dec 12 Version A Problem 1. Let X be the continuous random variable defined by the following pdf: { 1 x/2 when x 2, f(x) otherwise. (a) Compute the mean µ E[X]. E[X] x
Chapter 7: Sampling Distributions Chapter 7: Sampling Distributions
 Chapter 7: Sampling Distributions Objectives: Students will: Define a sampling distribution. Contrast bias and variability. Describe the sampling distribution of a proportion (shape, center, and spread).
Lecture 9. Probability Distributions. Outline. Outline
 Outline Lecture 9 Probability Distributions 6-1 Introduction 6- Probability Distributions 6-3 Mean, Variance, and Expectation 6-4 The Binomial Distribution Outline 7- Properties of the Normal Distribution
ECON 214 Elements of Statistics for Economists
 ECON 214 Elements of Statistics for Economists Session 7 The Normal Distribution Part 1 Lecturer: Dr. Bernardin Senadza, Dept. of Economics Contact Information: bsenadza@ug.edu.gh College of Education
Statistics 13 Elementary Statistics
 Statistics 13 Elementary Statistics Summer Session I 2012 Lecture Notes 5: Estimation with Confidence intervals 1 Our goal is to estimate the value of an unknown population parameter, such as a population
Chapter 8 Estimation
 Chapter 8 Estimation There are two important forms of statistical inference: estimation (Confidence Intervals) Hypothesis Testing Statistical Inference drawing conclusions about populations based on samples
Chapter 7: Point Estimation and Sampling Distributions
 Chapter 7: Point Estimation and Sampling Distributions Seungchul Baek Department of Statistics, University of South Carolina STAT 509: Statistics for Engineers 1 / 20 Motivation In chapter 3, we learned
Statistics and Probability
 Statistics and Probability Continuous RVs (Normal); Confidence Intervals Outline Continuous random variables Normal distribution CLT Point estimation Confidence intervals http://www.isrec.isb-sib.ch/~darlene/geneve/
CHAPTER 4 DISCRETE PROBABILITY DISTRIBUTIONS
 CHAPTER 4 DISCRETE PROBABILITY DISTRIBUTIONS A random variable is the description of the outcome of an experiment in words. The verbal description of a random variable tells you how to find or calculate
Chapter 5 Student Lecture Notes 5-1. Department of Quantitative Methods & Information Systems. Business Statistics
 Chapter 5 Student Lecture Notes 5-1 Department of Quantitative Methods & Information Systems Business Statistics Chapter 5 Discrete Probability Distributions QMIS 120 Dr. Mohammad Zainal Chapter Goals
The Bernoulli distribution
 This work is licensed under a Creative Commons Attribution-NonCommercial-ShareAlike License. Your use of this material constitutes acceptance of that license and the conditions of use of materials on this
Lecture 9. Probability Distributions
 Lecture 9 Probability Distributions Outline 6-1 Introduction 6-2 Probability Distributions 6-3 Mean, Variance, and Expectation 6-4 The Binomial Distribution Outline 7-2 Properties of the Normal Distribution
Chapter 14 : Statistical Inference 1. Note : Here the 4-th and 5-th editions of the text have different chapters, but the material is the same.
 Chapter 14 : Statistical Inference 1 Chapter 14 : Introduction to Statistical Inference Note : Here the 4-th and 5-th editions of the text have different chapters, but the material is the same. Data x
Standard Normal, Inverse Normal and Sampling Distributions
 Standard Normal, Inverse Normal and Sampling Distributions Section 5.5 & 6.6 Cathy Poliak, Ph.D. cathy@math.uh.edu Office in Fleming 11c Department of Mathematics University of Houston Lecture 9-3339 Cathy
STOR 155 Introductory Statistics (Chap 5) Lecture 14: Sampling Distributions for Counts and Proportions
 Lecture 14: Sampling Distributions for Counts and Proportions") The UNIVERSITY of NORTH CAROLINA at CHAPEL HILL STOR 155 Introductory Statistics (Chap 5) Lecture 14: Sampling Distributions for Counts and Proportions 5/31/11 Lecture 14 1 Statistic & Its Sampling Distribution
The UNIVERSITY of NORTH CAROLINA at CHAPEL HILL STOR 155 Introductory Statistics (Chap 5) Lecture 14: Sampling Distributions for Counts and Proportions 5/31/11 Lecture 14 1 Statistic & Its Sampling Distribution
Probability is the tool used for anticipating what the distribution of data should look like under a given model.
 AP Statistics NAME: Exam Review: Strand 3: Anticipating Patterns Date: Block: III. Anticipating Patterns: Exploring random phenomena using probability and simulation (20%-30%) Probability is the tool used
Chapter 7 Sampling Distributions and Point Estimation of Parameters
 Chapter 7 Sampling Distributions and Point Estimation of Parameters Part 1: Sampling Distributions, the Central Limit Theorem, Point Estimation & Estimators Sections 7-1 to 7-2 1 / 25 Statistical Inferences
AP Statistics Ch 8 The Binomial and Geometric Distributions
 Ch 8.1 The Binomial Distributions The Binomial Setting A situation where these four conditions are satisfied is called a binomial setting. 1. Each observation falls into one of just two categories, which
5.3 Statistics and Their Distributions
 Chapter 5 Joint Probability Distributions and Random Samples Instructor: Lingsong Zhang 1 Statistics and Their Distributions 5.3 Statistics and Their Distributions Statistics and Their Distributions Consider
Chapter 8. Variables. Copyright 2004 Brooks/Cole, a division of Thomson Learning, Inc.
 Chapter 8 Random Variables Copyright 2004 Brooks/Cole, a division of Thomson Learning, Inc. 8.1 What is a Random Variable? Random Variable: assigns a number to each outcome of a random circumstance, or,
Section 7.5 The Normal Distribution. Section 7.6 Application of the Normal Distribution
 Section 7.6 Application of the Normal Distribution A random variable that may take on infinitely many values is called a continuous random variable. A continuous probability distribution is defined by
ECON 214 Elements of Statistics for Economists 2016/2017
 ECON 214 Elements of Statistics for Economists 2016/2017 Topic Probability Distributions: Binomial and Poisson Distributions Lecturer: Dr. Bernardin Senadza, Dept. of Economics bsenadza@ug.edu.gh College
***SECTION 7.1*** Discrete and Continuous Random Variables
 ***SECTION 7.1*** Discrete and Continuous Random Variables UNIT 6 ~ Random Variables Sample spaces need not consist of numbers; tossing coins yields H s and T s. However, in statistics we are most often
Value (x) probability Example A-2: Construct a histogram for population Ψ.
 probability Example A-2: Construct a histogram for population Ψ.") Calculus 111, section 08.x The Central Limit Theorem notes by Tim Pilachowski If you haven t done it yet, go to the Math 111 page and download the handout: Central Limit Theorem supplement. Today s lecture
Calculus 111, section 08.x The Central Limit Theorem notes by Tim Pilachowski If you haven t done it yet, go to the Math 111 page and download the handout: Central Limit Theorem supplement. Today s lecture
Section 6.3b The Binomial Distribution
 We have seen in the previous investigation that binomial distributions can have different shapes. The distributions can range from approximately normal to skewed left or skewed right. Remember that when
Lesson 97 - Binomial Distributions IBHL2 - SANTOWSKI
 Lesson 97 - Binomial Distributions IBHL2 - SANTOWSKI Opening Exercise: Example #: (a) Use a tree diagram to answer the following: You throwing a bent coin 3 times where P(H) = / (b) THUS, find the probability
Opening Exercise: Lesson 91 - Binomial Distributions IBHL2 - SANTOWSKI
 08-0- Lesson 9 - Binomial Distributions IBHL - SANTOWSKI Opening Exercise: Example #: (a) Use a tree diagram to answer the following: You throwing a bent coin times where P(H) = / (b) THUS, find the probability
*****CENTRAL LIMIT THEOREM (CLT)*****
*****") Sampling Distributions and CLT Day 5 *****CENTRAL LIMIT THEOREM (CLT)***** (One of the MOST important theorems in Statistics - KNOW AND UNDERSTAND THIS!!!!!!) Draw an SRS of size n from ANY population
Sampling Distributions and CLT Day 5 *****CENTRAL LIMIT THEOREM (CLT)***** (One of the MOST important theorems in Statistics - KNOW AND UNDERSTAND THIS!!!!!!) Draw an SRS of size n from ANY population
Week 1 Variables: Exploration, Familiarisation and Description. Descriptive Statistics.
 Week 1 Variables: Exploration, Familiarisation and Description. Descriptive Statistics. Convergent validity: the degree to which results/evidence from different tests/sources, converge on the same conclusion.
6. THE BINOMIAL DISTRIBUTION
 6. THE BINOMIAL DISTRIBUTION Eg: For 1000 borrowers in the lowest risk category (FICO score between 800 and 850), what is the probability that at least 250 of them will default on their loan (thereby rendering
Examples: Random Variables. Discrete and Continuous Random Variables. Probability Distributions
 Random Variables Examples: Random variable a variable (typically represented by x) that takes a numerical value by chance. Number of boys in a randomly selected family with three children. Possible values:
The Normal Approximation to the Binomial
 Lecture 16 The Normal Approximation to the Binomial We can calculate l binomial i probabilities bbilii using The binomial formula The cumulative binomial tables When n is large, and p is not too close
Theoretical Foundations
 Theoretical Foundations Probabilities Monia Ranalli monia.ranalli@uniroma2.it Ranalli M. Theoretical Foundations - Probabilities 1 / 27 Objectives understand the probability basics quantify random phenomena
MATH 264 Problem Homework I
 MATH Problem Homework I Due to December 9, 00@:0 PROBLEMS & SOLUTIONS. A student answers a multiple-choice examination question that offers four possible answers. Suppose that the probability that the
Previously, when making inferences about the population mean, μ, we were assuming the following simple conditions:
 Chapter 17 Inference about a Population Mean Conditions for inference Previously, when making inferences about the population mean, μ, we were assuming the following simple conditions: (1) Our data (observations)
4.2 Bernoulli Trials and Binomial Distributions
 Arkansas Tech University MATH 3513: Applied Statistics I Dr. Marcel B. Finan 4.2 Bernoulli Trials and Binomial Distributions A Bernoulli trial 1 is an experiment with exactly two outcomes: Success and
TRUE-FALSE: Determine whether each of the following statements is true or false.
 Chapter 6 Test Review Name TRUE-FALSE: Determine whether each of the following statements is true or false. 1) A random variable is continuous when the set of possible values includes an entire interval
ECO220Y Estimation: Confidence Interval Estimator for Sample Proportions Readings: Chapter 11 (skip 11.5)
") ECO220Y Estimation: Confidence Interval Estimator for Sample Proportions Readings: Chapter 11 (skip 11.5) Fall 2011 Lecture 10 (Fall 2011) Estimation Lecture 10 1 / 23 Review: Sampling Distributions Sample
ECO220Y Estimation: Confidence Interval Estimator for Sample Proportions Readings: Chapter 11 (skip 11.5) Fall 2011 Lecture 10 (Fall 2011) Estimation Lecture 10 1 / 23 Review: Sampling Distributions Sample
Binomial Random Variables. Binomial Random Variables
 Bernoulli Trials Definition A Bernoulli trial is a random experiment in which there are only two possible outcomes - success and failure. 1 Tossing a coin and considering heads as success and tails as
CHAPTER 6 Random Variables
 CHAPTER 6 Random Variables 6.1 Discrete and Continuous Random Variables The Practice of Statistics, 5th Edition Starnes, Tabor, Yates, Moore Bedford Freeman Worth Publishers Discrete and Continuous Random
The Central Limit Theorem
 Section 6-5 The Central Limit Theorem I. Sampling Distribution of Sample Mean ( ) Eample 1: Population Distribution Table 2 4 6 8 P() 1/4 1/4 1/4 1/4 μ (a) Find the population mean and population standard
= 0.35 (or ˆp = We have 20 independent trials, each with probability of success (heads) equal to 0.5, so X has a B(20, 0.5) distribution.
 equal to 0.5, so X has a B(20, 0.5) distribution.") Chapter 5 Solutions 51 (a) n = 1500 (the sample size) (b) The Yes count seems like the most reasonable choice, but either count is defensible (c) X = 525 (or X = 975) (d) ˆp = 525 1500 = 035 (or ˆp = 975
Chapter 5 Solutions 51 (a) n = 1500 (the sample size) (b) The Yes count seems like the most reasonable choice, but either count is defensible (c) X = 525 (or X = 975) (d) ˆp = 525 1500 = 035 (or ˆp = 975
Lecture Slides. Elementary Statistics Tenth Edition. by Mario F. Triola. and the Triola Statistics Series
 Lecture Slides Elementary Statistics Tenth Edition and the Triola Statistics Series by Mario F. Triola Slide 1 Chapter 5 Probability Distributions 5-1 Overview 5-2 Random Variables 5-3 Binomial Probability