This document is made available electronically by the Minnesota Legislative Reference Library as part of an ongoing digital archiving project.
|
|
|
- Malcolm Dawson
- 6 years ago
- Views:
Transcription


1 This document is made available electronically by the Minnesota Legislative Reference Library as part of an ongoing digital archiving project.
2 This page intentionally left blank.


3
4 This page intentionally left blank.

5 Market Environment Third Quarter 2017 Aon Hewitt Retirement and Investment Investment advice and consulting services provided by Aon Hewitt Investment Consulting, Inc., an Aon Company.
6 Market Highlights 25% 20% 15% SHORT TERM ANNUALIZED RETURNS AS OF 09/30/2017 Third Quarter 2017 One-Year 18.61% 18.54% 21.94% 15.12% 20.74% 20.98% 20.55% 18.71% 19.61% 18.73% 22.46% 10% 5% 0% -5% 4.48% 4.48% Source: Russell, MSCI, Barclays 18% 16% 14% 12% 10% 8% 6% 4% 2% 0% 5.90% S&P 500 Russell 1000 Russell 1000 Growth LONG TERM ANNUALIZED RETURNS AS OF 09/30/ % 14.27% Source: Russell, MSCI, Barclays 7.44% 7.55% 15.26% 9.08% S&P 500 Russell 1000 Russell 1000 Growth 3.11% Russell 1000 Value 13.20% 5.92% Russell 1000 Value 5.67% 6.22% Russell 2000 Russell 2000 Growth 13.79% 7.85% 14.28% 8.47% Russell 2000 Russell 2000 Growth 5.11% 4.57% Russell 2000 Value 13.27% 7.14% Russell 2000 Value Russell % 7.57% Russell % 5.62% MSCI All Country World ex-u.s. 6.97% MSCI All Country World ex-u.s. MSCI World ex USA Five-Year 7.81% 7.89% MSCI Emerging Markets Free 3.99% 1.28% 1.28% 1.32% MSCI World ex USA Ten-Year MSCI Emerging Markets Free 0.85% 0.81% 0.07% 0.27% 0.65% Bloomberg Barclays U.S. Aggregate 2.06% 2.10% Bloomberg Barclays U.S. Aggregate -0.01% Bloomberg Barclays Gov't/Credit 4.27% 4.34% Bloomberg Barclays Gov't/Credit 3 Mo U.S. T- Bills 0.22% 0.47% 3 Mo U.S. T- Bills Investment advice and consulting services provided by Aon Hewitt Investment Consulting, Inc., an Aon Company. 2
7 Market Highlights Returns of the Major Capital Markets Periods Ending 09/30/2017 Second Quarter 1-Year 3-Year 1 5-Year 1 10-Year 1 Domestic Equity S&P % 18.61% 10.81% 14.22% 7.44% Russell % 18.54% 10.63% 14.27% 7.55% Russell 1000 Growth 5.90% 21.94% 12.69% 15.26% 9.08% Russell 1000 Value 3.11% 15.12% 8.53% 13.20% 5.92% Russell % 20.74% 12.18% 13.79% 7.85% Russell 2000 Growth 6.22% 20.98% 12.17% 14.28% 8.47% Russell 2000 Value 5.11% 20.55% 12.12% 13.27% 7.14% Russell % 18.71% 10.74% 14.23% 7.57% International Equity MSCI All Country World ex-u.s. 6.16% 19.61% 4.70% 6.97% 1.28% MSCI World ex USA 5.62% 18.73% 4.57% 7.81% 1.28% MSCI Emerging Markets Free 7.89% 22.46% 4.90% 3.99% 1.32% Fixed Income Bloomberg Barclays U.S. Aggregate 0.85% 0.07% 2.71% 2.06% 4.27% Bloomberg Barclays Gov't/Credit 0.81% -0.01% 2.83% 2.10% 4.34% 3 Mo U.S. T-Bills 0.27% 0.65% 0.32% 0.22% 0.47% Inflation CPI-U 1.06% 2.23% 1.23% 1.30% 1.68% MSCI Indices show net returns. All other indices show total returns. 1 Periods are annualized. Investment advice and consulting services provided by Aon Hewitt Investment Consulting, Inc., an Aon Company. 3
8 Global Equity Markets GLOBAL MSCI IMI INDEX RETURNS AS OF 09/30/ % 20% 18.7% 19.6% 17.9% Third Quarter % 14.9% One-Year 13.8% 25.9% 13.7% 21.4% 10% 5.3% 6.3% 4.4% 5.6% 4.4% 7.5% 7.2% 3.7% 7.6% 0% -2.6% -10% Source: MSCI ACWI IMI 48.3% ACWI ex-u.s. IMI 51.7% USA IMI 6.0% UK IMI 8.1% Japan IMI 3.2% Canada IMI -8.2% 0.2% Israel IMI 15.4% Europe ex-uk IMI 3.9% Pacific ex-japan IMI 11.5% Emerging Markets IMI Evidence of improving global growth and low inflation continued to sustain the global equity market rally over the last quarter. Moreover, markets were broadly unperturbed by heightened tensions between the U.S. and North Korea. Global equity markets returned 5.3% in Q in U.S. dollar terms. The broad weakening of the U.S. dollar (1.7% in trade-weighted terms) led to a lower return of 4.5% in local currency terms. All regions shown above generated positive returns with the exception of Israel which moved sharply lower over the quarter. Emerging markets (EM) were once again the strongest performers, returning 7.6% in the third quarter of Investment advice and consulting services provided by Aon Hewitt Investment Consulting, Inc., an Aon Company. 4
9 Global Equity Markets MSCI ALL COUNTRY WORLD IMI INDEX GEOGRAPHIC ALLOCATION AS OF 09/30/2017 Pacific ex-japan Canada 3.9% 3.2% Japan 8.1% UK 6.0% Europe ex-uk 15.4% Israel 0.2% Latin America 1.5% MSCI ALL COUNTRY WORLD EX-U.S. IMI INDEX GEOGRAPHIC ALLOCATION AS OF 09/30/2017 Europe ex-uk 31.9% Israel 0.4% Latin America 3.0% Emerging Markets 11.5% Asia 8.4% Japan 16.7% Emerging Markets 23.8% Asia 17.4% Source: MSCI USA 51.7% Eastern Europe, Middle East & Africa 1.6% Pacific ex-japan 8.1% Source: MSCI Canada 6.7% UK 12.4% Eastern Europe, Middle East & Africa 3.3% The two exhibits on this slide illustrate the percentage that each country/region represents of the global and international equity markets as measured by the MSCI All Country World IMI Index and the MSCI All Country World ex-u.s. IMI Index, respectively. Investment advice and consulting services provided by Aon Hewitt Investment Consulting, Inc., an Aon Company. 5
10 U.S. Equity Markets RUSSELL STYLE RETURNS AS OF 09/30/ % 20.0% 15.0% 10.0% 5.0% 0.0% 4.6% 18.7% Russell % Source: Russell Indexes 16.0% 31.6% Large Value 6.1% 23.4% 34.6% Large Growth 2.1% 13.4% 14.7% Medium Value Third Quarter 2017 One-Year 17.8% 5.3% 5.1% 11.2% Medium Growth 20.5% 21.0% 3.8% Small Value 6.2% 4.0% Small Growth RUSSELL GICS SECTOR RETURNS AS OF 09/30/ % 25.0% 20.0% 15.0% 10.0% 5.0% 0.0% 4.6% 18.7% 8.0% 28.2% 16.1% 15.3% 3.8% 1.8% 3.3% -5.0% -1.9% Russell 18.9% 13.8% 13.4% 6.5% 3000 Technology Healthcare Cons. Disc Cons. Source: Russell Indexes Staples Third Quarter 2017 One-Year 6.8% 5.6% 5.5% 4.9% 4.2% -1.0% 5.8% Energy 21.5% 24.2% 4.0% 11.0% Materials & Producer Processing Durables 26.9% 21.4% Financial Services 7.9% 5.1% Utilities The Russell 3000 Index returned 4.6% during the third quarter and 18.7% over the one-year period. During the third quarter, the technology sector continued to be the strongest performer, posting returns of 8.0%. Consumer staples were the weakest and the only sector which posted negative returns in Q by falling 1.9%. Performance was positive across the market capitalization spectrum over the quarter. Renewed expectations for U.S. tax reform, announced late in the quarter, provided a boost for small cap stocks which outperformed their large cap peers. However, despite the recent outperformance, small cap stocks still lagged large cap stocks since the start of the year. In general, growth stocks outperformed value stocks. Investment advice and consulting services provided by Aon Hewitt Investment Consulting, Inc., an Aon Company. 6
11 U.S. Fixed Income Markets BLOOMBERG BARCLAYS U.S. AGGREGATE RETURNS BY MATURITY AS OF 9/30/2017 BLOOMBERG BARCLAYS U.S. AGGREGATE RETURNS BY QUALITY AND HIGH YIELD RETURNS AS OF 9/30/ % 10.0% Third Quarter 1.5% Third Quarter 8.9% 1.5% One-Year 8.0% One-Year 0.9% 1.0% 1.0% 0.7% 0.6% 6.0% 0.3% 0.4% 0.5% 0.0% 4.0% 3.2% 0.0% -0.5% 0.6% 1.0% 1.3% 1.6% 2.0% 2.0% 1.4% 0.4% -1.0% 0.0% -1.5% -1.0% -2.0% -0.7% -1.3% 1-3 Yr. 3-5 Yr. 5-7 Yr Yr. >10 Yr. Aaa Aa A Baa High Yield Source: Bloomberg Barclays Source: Bloomberg Barclays The Bloomberg Barclays U.S. Aggregate Bond Index returned 0.9% in the third quarter. Credit spreads narrowed over the quarter which supported corporate bond returns. Corporate bonds posted the highest return at 1.3%, particularly outperforming government bonds which had the lowest return of only 0.4%. High yield bonds outperformed their investment grade bond peers, returning nearly 2.0%. Long duration bonds outperformed intermediate and short duration bonds through the quarter. BLOOMBERG BARCLAYS U.S. AGGREGATE RETURNS BY SECTOR AS OF 9/30/ % 2.0% 1.5% 1.0% 0.5% 0.0% -0.5% -1.0% -1.5% -2.0% 0.9% 0.1% 0.4% -1.6% Barclays 43.9% U.S. Agg. Gov't Source: Bloomberg Barclays 1.3% 2.2% 25.6% Corp. 1.0% 0.3% 28.2% MBS Third Quarter One-Year 0.4% 0.9% 0.5% ABS 0.8% -0.1% 1.8% CMBS Investment advice and consulting services provided by Aon Hewitt Investment Consulting, Inc., an Aon Company. 7
12 U.S. Fixed Income Markets U.S. TREASURY YIELD CURVE 3.5% 9/30/ % 6/30/2017 U.S. 10-YEAR TREASURY AND TIPS YIELDS 5.0% 4.0% 10Y TIPS Yield 10Y Treasury Yield 2.5% 2.0% 1.5% 9/30/ % 2.0% 1.0% 1.0% 0.5% 0.0% Maturity (Years) Source: U.S. Department of Treasury 0.0% -1.0% -2.0% Sep 07 Sep 09 Sep 11 Sep 13 Sep 15 Sep 17 Source: U.S. Department of Treasury The Treasury yield curve marginally flattened over the quarter, as yields of short maturity bonds inched higher while longer maturity bonds were relatively unchanged. The 10-year U.S. Treasury yield ended the quarter at 2.3%, 2 basis points (bps) higher than at the start of the quarter. This was largely driven by higher breakeven inflation which moved 11 bps higher and offset the fall in real yields. The 10-year TIPS yield fell by 9 bps over the quarter and ended the period at 0.5%. Investment advice and consulting services provided by Aon Hewitt Investment Consulting, Inc., an Aon Company. 8
13 European Fixed Income Markets EUROZONE PERIPHERAL BOND SPREADS (10-YEAR SPREADS OVER GERMAN BUNDS) 20% 16% Spain Portugal Ireland Italy Greece 12% 8% 4% 0% Sep 12 Sep 13 Sep 14 Sep 15 Sep 16 Sep 17 Source: DataStream In the Eurozone, bond spreads were mixed across peripheral region. Spain s government bond yields rose by 8 bps with the majority of the increase coming towards the end of the quarter as political instability due to Catalonian Independence referendum grew. Meanwhile, Portuguese government bond yields fell sharply after the rating agency Standard & Poor s raised the nation s credit rating to investment grade from junk status, resulting in the yield on 10 year Portuguese government debt ending 64 bps lower over Q Meanwhile, the spread between Greek bonds and German Bunds moved 24 bps higher over the same period. Investment advice and consulting services provided by Aon Hewitt Investment Consulting, Inc., an Aon Company. 9
14 Credit Spreads Spread (bps) 9/30/2017 6/30/2017 9/30/2016 Quarterly Change (bps) 1-Year Change (bps) U.S. Aggregate Gov't Credit Gov't/Credit MBS CMBS ABS Corporate High Yield Global Emerging Markets Source: Barclays Live Improved risk appetite and a benign global credit backdrop saw spreads over U.S. Treasuries fall across all areas of the credit market. However, movement in U.S investment grade credit spreads were more muted. Global emerging market bond spreads fell by the most over the quarter, narrowing by 20 bps. They were closely followed by high yield bonds, their fellow outperformers in the credit universe this year, which fell by 17 bps. Investment advice and consulting services provided by Aon Hewitt Investment Consulting, Inc., an Aon Company. 10
15 Commodities COMMODITY RETURNS AS OF 09/30/ % -30.0% -20.0% -10.0% 0.0% 10.0% 20.0% 30.0% Bloomberg Commodity Index -0.3% 2.5% Ex-Energy -0.2% 0.6% Energy -2.9% 9.8% Industrial Metals 9.9% 24.0% Prec. Metals -6.6% 2.3% Agric % -6.1% Third Quarter 2017 Softs -0.7% -28.1% One-Year Grains -9.5% -5.5% Livestock -7.5% 24.4% Source: Bloomberg A strong upturn in commodity prices over the quarter saw the Bloomberg Commodity Index return 2.5%, driven mainly by the rise in crude oil prices. Over the quarter, the best performing segment was industrial metals with a return of 9.9%, closely followed by Energy (9.8%). Agriculture remained the laggard with a return of -6.1% which weighed on the overall index return. Grains was the worst performing sector over the quarter with a return of -9.5%. Investment advice and consulting services provided by Aon Hewitt Investment Consulting, Inc., an Aon Company. 11
16 Currency TRADE WEIGHTED U.S. DOLLAR INDEX (1997 = 100) Sep 12 Sep 13 Sep 14 Sep 15 Sep 16 Sep 17 Source: Federal Reserve U.S. DOLLAR RELATIVE TO EUR, GBP AND JPY REBASED TO 100 AT 09/30/ Stronger Dollar Weaker Dollar EUR/USD GBP/USD JPY/USD 70 Sep 12 Sep 13 Sep 14 Sep 15 Sep 16 Sep 17 Source: DataStream The U.S. dollar weakened by 1.7% on a trade-weighted basis over the quarter. Market expectations of a rate hike were lowered after a flurry of disappointing inflation releases, although the U.S. Federal Reserve (Fed) continued to believe that the factors suppressing inflation are transitory. The U.S. dollar depreciated against all the major currencies with the exception of the Japanese yen. Bank of England officials indicated UK monetary policy struck a more hawkish tone in September which sent sterling 3.2% higher against the U.S. dollar. Despite a brief period of safe-haven flow activity amid escalating geopolitical tensions in the Korean peninsula, the yen fell by 0.2% against the U.S. dollar. Resilient economic data emanating from the Eurozone supported the euro s 3.5% appreciation against the greenback. Investment advice and consulting services provided by Aon Hewitt Investment Consulting, Inc., an Aon Company. 12
17 Hedge Fund Markets Overview HEDGE FUND PERFORMANCE AS OF 09/30/ % 0.0% 2.0% 4.0% 6.0% 8.0% 10.0% 12.0% 14.0% 16.0% Fixed Income/Convertible Arb. Global Macro -1.2% Equity Hedge Emerging Markets Event-Driven Distressed-Restructuring Relative Value Fund-Weighted Composite Index Fund of Funds Composite Index 0.2% 1.1% 1.3% 1.4% 1.8% 2.1% 2.2% 3.5% Note: Latest 5 months of HFR data are estimated by HFR and may change in the future. Source: HFR 4.8% 6.0% 6.4% 6.4% 7.0% 9.6% 10.2% 11.0% 13.7% Third Quarter 2017 One-Year Hedge fund performance was positive across all strategies in the third quarter. The HFRI Fund-Weighted Composite Index and the HFRI Fund of Funds Composite Index produced returns of 2.1% and 2.2%, respectively, during the quarter. Emerging market hedge funds continued to be the best performer, posting a return of 4.8% during the third quarter which brought the one-year return to 13.7%. Investment advice and consulting services provided by Aon Hewitt Investment Consulting, Inc., an Aon Company. 13
18 Private Equity Market Overview Second Quarter 2017 LTM Global Private Equity-Backed Buyout Deal Volume Purchase Price Multiples All Transactions Sizes Value ($ Billions) $600 Deal Value ($ Billions) Number of Deals $500 $400 $300 $200 $100 4,500 4,000 3,500 3,000 2,500 2,000 1,500 1, # of Deals 12.0 x 10.0 x 9.1 x 8.5 x 8.8 x 8.7x 8.8x 8.0 x 7.7 x 6.0 x 4.0 x 2.0 x 0.0 x 9.8x 10.3x 10.0x 10.3x $0 0 1Q09 4Q09 3Q10 2Q11 1Q12 4Q12 3Q13 2Q14 1Q15 4Q15 3Q16 2Q17 Source: Preqin Source: S&P Senior Debt/EBITDA Sub Debt/EBITDA Equity/EBITDA Others Fundraising: In 2Q 2017, $162.0 billion was raised by 297 funds, which was up 8.7% on a capital basis and 11.2% by number of deals from the prior quarter. Dry powder stood at $1.3 trillion at the end of the quarter, up 3.7% and 31.1% compared to 1Q 2017 and the five year average, respectively 1. Buyout: Global private equity-backed buyout deals totaled $93.2 billion in 2Q 2017, which was up 67.9% and 7.5% from the prior quarter and five year average, respectively 1. At the end of 2Q 2017, the average purchase price multiple for all U.S. LBOs was 10.3x EBITDA, up from 10.2x as of the end of 1Q Large cap middle-market purchase price multiples stood at 10.3x, up compared to both 1Q 2017 and full year 2016 levels of 9.6x and 10.0x, respectively. The weighted average purchase price multiple across all European transaction sizes averaged 10.8x EBITDA on an LTM basis in 2Q 2017, down slightly from 10.9x in 1Q Purchase prices for transactions of 1.0 billion or more decreased from 11.8x in 1Q 2017 to 11.6x in the second quarter. Transactions between million and 1.0 billion were down 0.1x from the end of 1Q 2017, and stood at 11.2x 2. Globally, exit value totaled $68.7 billion on 417 deals in 2Q 2017 compared to $49.9 billion on 437 deals in the prior quarter 1. Venture: During the second quarter, 1,152 venture backed transactions totaling $18.4 billion were completed, up on a capital basis from 1Q 2017 s total of $14.4 billion across 1,206 deals. This was 44.9% higher than the five-year average of $12.7 billion 3. Total U.S. venture backed exit activity totaled $10.5 billion across 156 completed transactions in 2Q 2017, down from $14.6 billion across 196 exits in 1Q Mezzanine: 10 funds closed on $2.3 billion during the quarter, down from 1Q 2017 s total of $3.0 billion raised by 11 funds and the five year quarterly average of $4.7 billion. Estimated dry powder was $50.0 billion at the end of 2Q 2017, down from $51.6 billion in 1Q Fundraising activity remains robust with an estimated 66 funds in market targeting $14.3 billion of commitments 1. Distressed Debt: The LTM U.S. high-yield default rate was 2.2% as of June 2017, which was down from March 2017 s LTM rate of 3.9% 5. Distressed debt and bankruptcy restructuring activity totaled $105.9 billion during the first half of 2017, up 28.0% from 1H U.S. activity accounted for $55.7 billion in 1H 2017 and was up 123.2% from the same period last year 6. Secondaries: 10 funds raised $4.2 billion during the second quarter, down from $19.4 billion by nine funds in 1Q The average discount rate for all private equity sectors declined 0.2% quarter-over-quarter to 8.1% 7. Infrastructure: $5.3 billion of capital was raised by 11 funds in 2Q 2017 compared to $30.7 billion of capital closed on by 18 partnerships in 1Q At the end of the quarter, dry powder stood at $150.2 billion, up from 1Q 2017 s record total of $147.0 billion. Infrastructure managers completed 256 deals with an estimated aggregate deal value of $104.0 billion in 2Q 2017 compared to 372 deals totaling $216.9 billion a quarter ago 1. Natural Resources: During 2Q 2017, eight funds closed on $4.9 billion compared to three funds totaling $0.8 billion in 1Q Energy and utilities industry managers completed approximately 70 deals totaling an estimated $12.6 billion through 1H 2017, which represents 59.8% of 2016 s full year capital deployment 1. Sources: 1 Preqin 2 Standard & Poors 3 PWC / CB Insights MoneyTree Report 4 PitchBook/NVCA Venture Monitor 5 Fitch Ratings 6 Thomson Reuters 7 UBS Notes: FY: Fiscal year ended 12/31; YTD: Year to date; LTM: Last twelve months (aka trailing twelve months); PPM: Purchase Price Multiples: Total Purchase Price / EBITDA. Investment advice and consulting services provided by Aon Hewitt Investment Consulting, Inc., an Aon Company. 14
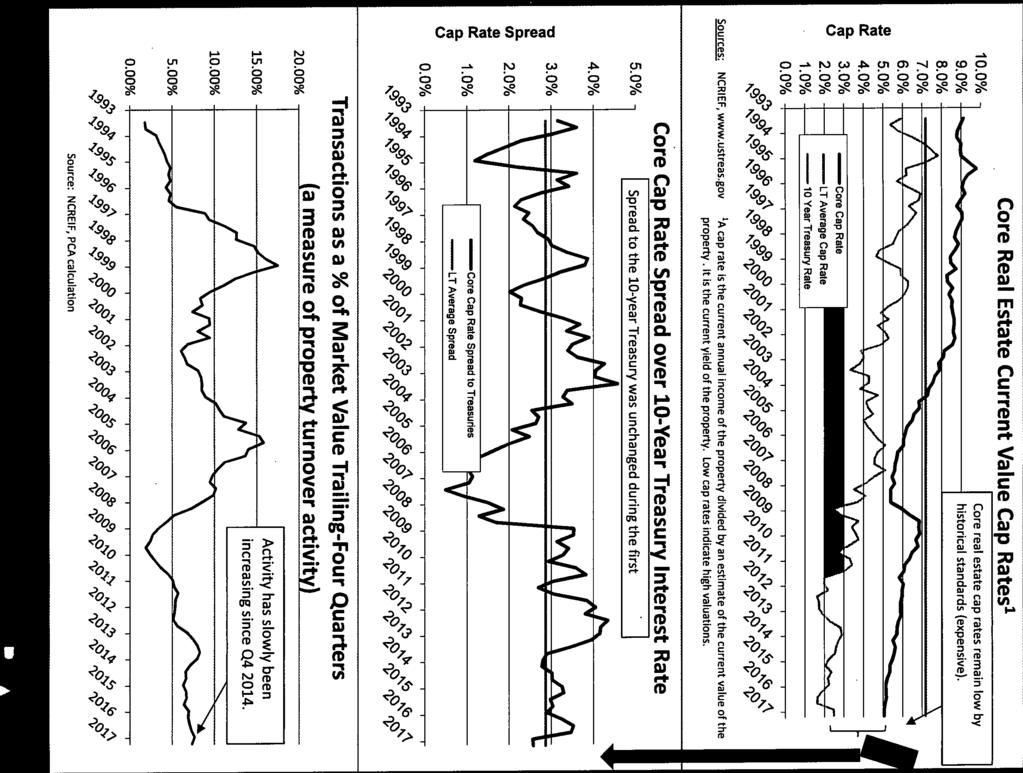
19 U.S. Commercial Real Estate Markets PRIVATE VS. PUBLIC REAL ESTATE RETURNS AS OF 06/30/ % 12.0% 10.0% 8.0% 6.0% 4.0% 2.0% 1.9% Private (NFI-ODCE Gross)* Public (NAREIT Gross) 7.7% 0.9% 0.7% 10.9% 11.6% 9.9% 9.7% 5.0% 5.8% 0.0% Third Quarter 1-Year 3-Years 5-Years 10-Years 2017 *Third quarter returns are preliminary Sources: NCREIF, NAREIT CAP RATES BY PROPERTY TYPE 9.5% Industrial Retail 8.5% Apartment Office 7.5% 6.5% 5.5% '08 '09 '10 '11 '12 '13 '14 '15 '16 '17 Sources: RCA, AHIC 6/30/2017 Returns continue to moderate. The trailing one-year return for U.S. core real estate was 7.7%* in third quarter, down 242 bps from this time last year. While moderating, returns are now back in line with the sector s long run average range of %. During the quarter, returns climbed slightly to 1.9%*, up 16 bps over Q2 but 21 bps lower year-on-year and 182 bps lower than 3Q2015. Income is now, and will continue to be, the larger driver of the sector s total return. Continued moderation is expected. Property stocks are up 7.3% YTD, globally. In 3Q, global property stocks (FTSE EPRA/NAREIT Developed Index) posted modest gains (1.8%), with positive returns in each of the major regions. Both the Europe (4.9%) and Asia (2.0%) regions outperformed. The U.S. REIT market (FTSE NAREIT Equity REITs Index), while slightly positive (0.9%), underperformed on a relative basis during the quarter and also lags year to date. During the quarter, strong share price gains were seen in the Industrial, Data Center, Net Lease, and Storage sectors, with weakness in the Health Care and Mall sectors. Values for high quality assets have remained relatively stable; however there is a wide disparity in relative valuations within the property sectors, with the overall U.S. REITs market ending the quarter trading at an approximate 2.0% premium. Despite the significant destructive impact of Hurricanes Harvey (Houston) and Irma (Florida) the negative financial impact to the REITs is expected to be minimal. Overall U.S. public REIT exposure is only approximately 3.0% to Houston, 5.0% to Florida and <0.5% to Puerto Rico. Pricing. The more typical relationship between deal volume and pricing has not moved in unison for almost two years now. While the reason varies by property type, in most cases volume has moved lower while prices have moved higher. This indicates a continuing disconnect between buyers and sellers expectations, which has been evident in sales trends since volume peaked in 4Q2015. Cap rates, however, have remained at or near recent lows that said, there is little expectation of them going lower. Capital flows remain robust. Private real estate dry powder globally (capital already allocated to new investments) now totals over $240.0bn; and far exceeds the peak of the last recession. The majority of the sector s dry powder sits in opportunistic and value add funds, accounting for 41.0% and 24.0% of the total respectively. Capital flows into U.S. commercial real estate, in particular, remain healthy and have not been disrupted by on-going global events as investors continue to favor the U.S. at this point in cycle due to the maturity and liquidity of U.S. markets. Portfolio structure important. Overall, real estate fundamentals and pricing are at a mature point in the real estate cycle. Given that, it is important to ensure that risk mitigation strategies are incorporated into all portfolio s structure. Preferred equity, secondaries, and debt structures are important investment considerations that can help mitigate medium term cyclical risks. Sources: NCREIF, RCA, CBRE-EA, Aon Hewitt *Indicates preliminary NFI-ODCE data gross of fees Investment advice and consulting services provided by Aon Hewitt Investment Consulting, Inc., an Aon Company. 15
20 (This page left blank intentionally.) Investment advice and consulting services provided by Aon Hewitt Investment Consulting, Inc., an Aon Company. 16
21 Appendix A: Global Private Equity Market Overview Investment advice and consulting services provided by Aon Hewitt Investment Consulting, Inc., an Aon Company. 17
22 Private Equity Overview $ Billions Value ($ Billions) Total Funds Raised YTD Source: Preqin LTM Global Private Equity-Backed Buyout Deal Volume $600 Deal Value ($ Billions) Number of Deals $500 $400 $300 $200 $100 4,500 4,000 3,500 3,000 2,500 2,000 1,500 1, # of Deals Fundraising In 2Q 2017, $162.0 billion was raised by 297 funds, which was up 8.7% on a capital basis and 11.2% by number of deals from the prior quarter 1. The majority of 2Q 2017 capital was raised by funds with target geographies in North America, comprising 57.2% of the quarterly total. Capital targeted for Europe made up 27.6% of the total funds raised during the quarter, while the remainder was attributable to managers targeting Asia and other parts of the world 1. Dry powder stood at $1.3 trillion at the end of the quarter, up 3.7% and 31.1% compared to 1Q 2017 and the five year average, respectively 1. Activity On an LTM basis, 4,203 deals were completed for an aggregate deal value of $336.2 billion as of 2Q 2017 compared to 4,274 transactions totaling $342.8 billion as of 1Q Average deal size was $80.0 million on an LTM basis, down 0.2% and 6.6% from the prior quarter and five year quarterly average level, respectively. European LBO transaction volume totaled 12.9 billion in 2Q 2017 and 40.1 billion on an LTM basis, compared to 1Q 2017 s quarterly and LTM totals of 13.6 billion and 43.2 billion, respectively. 2Q 2017 s total was up 13.2% from the five year quarterly average 3. At the end of 2Q 2017, the average purchase price multiple for all U.S. LBOs was 10.3x EBITDA, up from 10.2x as of the end of 1Q This was 0.8x and 1.2x turns (multiple of EBITDA) above the year-end five and ten year average levels, respectively. European multiples were down 0.1x quarter-over-quarter, averaging 10.8x EBITDA for all transaction sizes, with large and medium transactions each running at 12.1x and 11.2x, respectively 3. Debt remained broadly available in the U.S. U.S. average leverage levels through 1H 2017 were 5.8x compared to the five and ten year averages of 5.4x and 5.1x, respectively 3. The amount of debt issued supporting new transactions increased compared to 1Q 2017 from 52.4% to 60.4% and remains above the 51.0% average level over the prior five years 3. In Europe, average senior debt/ebitda through 1H 2017 was 5.1x, down from the 5.6x observed through 1Q This was also up significantly over the five year and ten year average levels of 4.9x. $0 0 1Q09 4Q09 3Q10 2Q11 1Q12 4Q12 3Q13 2Q14 1Q15 4Q15 3Q16 2Q17 Source: Preqin Investment advice and consulting services provided by Aon Hewitt Investment Consulting, Inc., an Aon Company. 18
23 Buyouts / Corporate Finance Value ($ Billions) LTM PE Exit Volume and Value 100% 90% 80% 70% 60% 50% 40% 30% 20% 10% 0% $600 $500 $400 $300 $200 $100 Source: Preqin 3% 44% 11% 28% 2% 42% 39% 5% 7% 43% 21% 34% 10% 43% 35% 13% 11% 49% 51% 16% 33% 17% 23% 22% 17% 18% 16% 21% 14% 16% 11% 14% 15% 13% 12% 15% 13% 13% 12% 14% 12% 12% 10% 10% 11% 10% 9% 9% 12% 6% 7% 8% 8% 9% 8% 6% 4% 4% 5% 4% YTD Less than $100mn $ mn $ mn $ mn $1-4.99bn $5bn+ Source: Preqin Value ($ Billions) Number of Deals $0 0 2Q08 2Q09 2Q10 2Q11 2Q12 2Q13 2Q14 2Q15 2Q16 2Q17 M&A Deal Value by Deal Size Fundraising $106.4 billion was closed on by 102 buyout and growth funds in 2Q 2017, compared to $64.2 billion raised by 84 funds the quarter before 1. This was up compared to the five year annual average of $54.2 billion and exceeded the highest quarterly total during that time by 27.9%. CVC Capital Partners Fund VII and Silver Lake Partners V were the largest partnerships raised during the quarter, with final closes totaling 16.0 billion and $15.0 billion, respectively. Buyout and growth equity dry powder was estimated at $703.6 billion, which was above the record level of $663.7 billion observed at the end of 1Q Investment advice and consulting services provided by Aon Hewitt Investment Consulting, Inc., an Aon Company. 19 2,500 2,000 1,500 1, Number of Deals Aside from small cap funds, which decreased 14.6% quarter-over-quarter, buyout dry powder increased across all fund size categories. Mega fund dry powder exhibited the largest increase during the quarter (13.9%), setting a new record mark of $247.0 billion. Large and middle market buyout dry powder finished the quarter up 0.6% and 6.2%, respectively, from 1Q An estimated 56.2% of buyout dry powder was targeted for North America, while European dry powder comprised 31.1% of the total 1. Activity Global private equity-backed buyout deals totaled $93.2 billion in 2Q 2017, which was up 67.9% and 7.5% from the prior quarter and five year average, respectively 1. 1,052 deals were completed during the quarter, which was down 2.0% from 1Q 2017, but up 5.1% compared to the five year quarterly average. Through 1H 2017, deals valued at $5.0 billion or greater accounted for an estimated 11.4% of total deal value during the quarter compared to 12.6% in 2016 and 35.1% in Entry multiples for all transaction sizes through 1H 2017 stood at 10.3x EBITDA, up from 1Q 2017 (10.2x) 3. Large cap middle-market purchase price multiples stood at 10.3x, up compared to both 1Q 2017 and full year 2016 levels of 9.6x and 10.0x, respectively 3. The weighted average purchase price multiple across all European transaction sizes averaged 10.8x EBITDA on an LTM basis in 2Q 2017, down slightly from 10.9x in 1Q Purchase prices for transactions of 1.0 billion or more decreased from 11.8x in 1Q 2017 to 11.6x in the second quarter. Transactions between million and 1.0 billion were down 0.1x from the end of 1Q 2017, and stood at 11.2x 3. The portion of average purchase prices financed by equity for U.S. deals was 43.6% in 1H 2017, down from 44.0% through 1Q 2017; however, this remained above the five and ten year full year averages of 41.7% and 42.3%, respectively 3. Globally, exit value totaled $68.7 billion on 417 deals in 2Q 2017 compared to $49.9 billion on 437 deals in the prior quarter, which had marked the lowest quarterly total since 1Q Opportunity Operationally focused managers targeting the middle and large markets with expertise in multiple sectors
24 Venture Capital Venture Capital Fundraising Capital Raised ($ Billions) 70 Capital Raised 600 Number of Funds Source: Preqin U.S. Venture Capital Investments by Quarter ($B) $ $ $ $15.7 $ $10.5 $7.5 $20.9 $7.1 $8.7 $ $7.6 $6.8 $8.1 $14.1 $ $8.3 $7.6 $7.3 $18.3 $15.9 $6.5 $6.3 $6.2 $ $ Quarter 1 Quarter 2 Quarter 3 Quarter 4 Source: PwC/CB Insights Report Number of Funds Fundraising $18.2 billion of capital was raised by 110 funds in 2Q 2017, up from the prior quarter s total of $14.2 billion by 108 managers 1. 2Q 2017 capital raised was up 37.6% compared to the five year quarterly level, despite being down on a number of funds basis (-11.8%). New Enterprise Associates 16 was the largest fund raised during the quarter, closing on $3.3 billion. The average fund size raised during the quarter was approximately $177.0 million, which was above both the prior quarter and five year quarterly average of $146.0 million and $126.1 million, respectively. The vast majority of funds in market are seeking commitments of $200.0 million or less 1. Dry powder was estimated at $177.2 billion at the end of 2Q 2017, which was down from 1Q 2017 s total of $178.5 billion. This was 48.9% higher than the five year average 1. Activity During the second quarter, 1,152 venture backed transactions totaling $18.4 billion were completed, up on a capital basis from 1Q 2017 s total of $14.4 billion across 1,206 deals. This was 44.9% higher than the five year average of $12.7 billion 7. Globally, the number of unicorns, or companies with valuations of $1.0 billion or more, increased from 14 in 1Q 2017 to 16 in 2Q This marked the highest number observed since 3Q Median pre-money valuations increased across all transaction stages. Series D+ transactions exhibited the largest increase (150.0%). Series, A, B, and Series C transactions were up 57.2%, 33.8%, and 13.1%, respectively 9. Total U.S. venture backed exit activity totaled $10.5 billion across 156 completed transactions in 2Q 2017, down on a capital basis from $14.6 billion in 1Q There were 18 venture-backed initial public offerings during the quarter, which was up from seven in 1Q However, on a capital basis, IPOs raised just $1.8 billion, down 56.0% quarter-over-quarter 16. The number of M&A transactions totaled 142 deals in 2Q 2017, representing a decrease of 12.9% quarter-over-quarter 16. Opportunity Early stage continues to be attractive, although we are monitoring valuation increases Smaller end of growth equity Technology sector Investment advice and consulting services provided by Aon Hewitt Investment Consulting, Inc., an Aon Company. 20
25 Leveraged Loans & Mezzanine Average Leverage by Deal Size 8.0x Large Corp LBOs All LBOs 7.0x 6.2x 6.0x 5.9x 5.7x 5.8x 5.2x 5.2x 5.3x 5.4x 5.5x 5.0x 4.7x 4.0x 4.0x 5.4x 5.8x 5.6x 5.8x 3.0x 6.1x 3.8x 5.0x 5.1x 5.3x 4.6x 4.9x 2.0x 1.0x 0.0x YTD Debt Issuance ($ Billions) $700 High-Yields $600 Leveraged Loans $500 $400 $300 $200 $100 $0 Mezzanine % of Purchase Price Multiple 25% All LBOs 20% Large Corp LBOs 15% 10% 5% 0% Leveraged Loans Fundraising New CLO issuance totaled $48.1 billion during the quarter, up compared to 1Q 2017 s total of $15.9 billion 2. High-yield debt issuance totaled $62.2 billion in 2Q 2017, down from $82.7 billion in 1Q Mutual fund net inflows stood at $11.4 billion through the end of 2Q 2017, compared to net outflows of $11.4 billion as of 1Q Activity Leverage for all LBO transactions ended the quarter at 5.9x, compared to 5.6x at 1Q 2017 and continues to be comprised almost entirely of senior debt. The average leverage level for large cap LBOs was 5.9x during the quarter, up from 5.7x in 1Q New leveraged loan issuances in 2Q totaled $166.0 billion, down from the prior quarter s total of $202.0 billion. 1H 2017 leverage loan issuances represent 77.1% of 2016 s full year total % of new leveraged loans were used to support M&A and growth activity during the first half of the year, up from 51.7% through 1Q This was above the prior five year average of 50.2% 3. European leveraged loan issuance decreased by 11.0% quarter-over-quarter to 18.0 billion 3. This was above the five year and ten year average levels of 11.7 billion and 10.9 billion, respectively. Leveraged loan spreads for B rated issues narrowed quarter-over-quarter, ending 2Q 2017 at L+409 bps compared to L+428 bps at 1Q BB- index spreads decreased to L+260 bps from L+270 bps during the quarter 2. Opportunity Funds with the ability to source deals directly and the capacity to scale for large transactions Funds with an extensive track record and experience through prior credit cycles Mezzanine Fundraising 10 funds closed on $2.3 billion during the quarter, down from 1Q 2017 s total of $3.0 billion raised by 11 funds and the five year quarterly average of $4.7 billion 1. Estimated dry powder was $50.0 billion at the end of 2Q 2017, down from $51.6 billion in 1Q Fundraising activity remains robust with an estimated 66 funds in market targeting $14.3 billion of commitments 1. Opportunity Funds with the capacity to scale for large sponsored deals Sources from top to bottom: S&P, UBS, & S&P Investment advice and consulting services provided by Aon Hewitt Investment Consulting, Inc., an Aon Company. 21
26 Distressed Private Markets High Yield Issuance ($ Billions) Distressed Debt, Turnaround, & Special Situations Fundraising Capital Raised ($ Billions) $ YTD Source: Thomson Reuters High-Yield Bond Volume vs Default Rates $350 $300 $250 $200 $150 $100 $50 $60.0 $50.0 $40.0 $30.0 $20.0 $ High-Yield Issuance ($B) High-Yield Default Rates % 9.0% 8.0% 7.0% 6.0% 5.0% 4.0% 3.0% 2.0% 1.0% Default Rate Fundraising During the quarter, $9.6 billion was raised by nine funds compared to $9.8 billion raised by nine funds in 1Q This was flat compared to the five year quarterly average. Cerberus Institutional Partners VI was the largest partnership raised during the quarter, closing on $4.0 billion. Dry powder was estimated at $103.1 billion at the end 2Q 2017, which was up 5.4% from 1Q 2017, but down 8.1% from 2015 s record year end level. This remained above the five year quarterly average level of $88.5 billion. Roughly 101 funds were in the market at the end of 2Q 2017, seeking an aggregate $76.9 billion in capital commitments 1. Activity Distressed debt managers were targeting the most capital, seeking an aggregate $44.1 billion. 3G Special Situations Fund V was the largest fund in market with a target fund size of $10.0 billion. Distressed debt and bankruptcy restructuring activity totaled $105.9 billion during the first half of 2017, up 28.0% from 1H U.S. activity accounted for $55.7 billion in 1H 2017 and was up 123.2% from the same period last year 5. The LTM U.S. high-yield default rate was 2.2% as of June 2017, which was down from March 2017 s LTM rate of 3.9% 6. Credit spreads are now modestly expensive, and yields are also low. Expect continued volatility caused by oil and equity market gyrations. The impact of rising interest rates is becoming more and more pertinent, and further positive returns driven by valuations will be limited 4. Increasing purchase prices and elevated levels of leverage may result in an increase in distressed opportunities looking out over the next two to three years, or sooner if there is a stall in the economy. Opportunity Funds capable of performing operational turnarounds Funds with the flexibility to invest globally $- 0.0% Source: UBS & Fitch Ratings Investment advice and consulting services provided by Aon Hewitt Investment Consulting, Inc., an Aon Company. 22
27 Secondaries % Discount to NAV $ Billions Secondary Fundraising Investment advice and consulting services provided by Aon Hewitt Investment Consulting, Inc., an Aon Company YTD Source: Preqin Secondary Pricing 0% -5% -10% -15% -20% -25% -30% 1Q '13 2Q '13 Source: UBS 3Q '13 4Q '13 1Q '14 2Q '14 3Q '14 4Q '14 1Q '15 2Q '15 3Q '15 4Q '15 1Q '16 2Q '16 3Q '16 4Q '16 All Private Equity Sectors Buyout Venture 1Q '17 2Q '17 Fundraising 10 funds raised $4.2 billion during the second quarter, down from $19.4 billion by nine funds in 1Q H 2017 s total capital raised represents 80.5% of 2016 s full year total. Hamilton Lane Secondary Fund IV was the largest fund raised during the quarter, closing on $1.9 billion 1. At the beginning of 2017, dry powder was estimated at a record $71.0 billion, which was 22.4% above 3Q 2016 s prior record level 2. The top 15 secondary buyers are estimated to command more than 75.0% of the market s capital reserves. A further inflow of dry powder can be expected given that nine of the top 20 purchasers are currently fundraising 2. At the end of 2Q 2017, there were an estimated 45 secondary and direct secondary funds in market, targeting approximately $26.8 billion. Goldman Sach s Vintage Fund VII was the largest fund in the market targeting $5.0 billion 1. Activity More than 900 potential buyers and 750 potential sellers of secondary interests have been identified 1. Secondary funds were the most active buyers in 1H 2017, accounting for 78.6% of total purchases 13. Fund of funds managers and public pension funds represent the largest proportion of potential sellers at 13.0% and 12.0%, respectively. In 1H 2017, private equity transaction volume totaled $24.3 billion, representing an increase of 58.8% from the level observed during 1H % of deal volume was traditional LP positions and the remainder were secondary direct transactions 13. Leveraged buyout funds continued to be the most purchased private equity funds during 1H 2017, representing 79.0% on a capital basis 13. The secondary market for infrastructure interests has shown growth 2. The average discount rate for all private equity sectors declined 0.2% quarterover-quarter to 8.1%. The average buyout pricing discount decreased 0.1% during the year, ending the quarter at 5.8% 2. Pricing is expected to remain attractive given the strong competitive market dynamics and the widening supply/demand imbalance driven by the continued growth of dry powder 2. Opportunity Funds that are able to execute complex and structured transactions Niche strategies
28 Infrastructure Capital Raised ($ Billions) Global Infrastructure Fundraising Capital Raised $70.0 Number of Funds $60.0 $50.0 $40.0 $30.0 $20.0 $10.0 $0.0 Source: Preqin Number of Deals Completed 2,500 2,000 1,797 1,921 1,938 1,611 1,500 1, , Number of Funds Fundraising $5.3 billion of capital was raised by 11 funds in 2Q 2017 compared to $30.7 billion of capital closed on by 18 partnerships in 1Q Funds raised during 1H 2017 averaged 106.9% of their target size, which was up from the five year average level of 95.8% 1. icon Infrastructure Partners IV was the largest fund raised during the quarter, closing on 1.2 billion 1. As of the end of 2Q 2017, there were an estimated 171 funds in the market seeking roughly $149.0 billion, up from $102.3 billion sought by 168 managers a quarter ago 1. Funds focused on infrastructure assets in North America were targeting an estimated $75.1 billion in capital, followed by Europe focused funds, which were targeting approximately $39.8 billion 1. Blackstone Infrastructure was the largest fund in the market as of the end of 2Q 2017, targeting $40.0 billion of commitments. If successfully raised, this would be considerably higher than the record $15.8 billion mark set by Global Infrastructure Partners III in 1Q At the end of the quarter, dry powder stood at $150.2 billion, up from 1Q 2017 s record total of $147.0 billion 1. Funds with commitments of $2.0 billion or more hold an estimated 47.4% of the dry powder. 44.3% of the dry powder was targeted for North America, compared to 33.1% for Europe and 22.6% for Asia and the rest of the world 1. Concerns surrounding the relative availability and pricing of assets remain. Fundraising continues to be very competitive given the number of funds and aggregate target level of funds in market. Investor appetite for the asset class persists despite the record levels of dry powder and increased investment activity from strategic and corporate buyers as well as institutional investors. Activity Infrastructure managers completed 256 deals with an estimated aggregate deal value of $104.0 billion in 2Q 2017 compared to 372 deals totaling $216.9 billion a quarter ago. The average deal value during the quarter was $406.3 million, down compared to 1Q 2017 s average of $583.1 million, but above the prior five year average of $374.2 million 1. Europe accounted for 51.2% of the deals in 2Q 2017, while 28.9% and 9.4% of deals were transacted in North America and Asia, respectively 1. Energy was the dominant industry during the quarter with 78.5% of transactions, followed by the transportation sector, which accounted for 10.5% of the quarter s deals 1. Opportunity Greenfield infrastructure is less competitive and offers a premium for managers willing to take on construction risk Source: Preqin Investment advice and consulting services provided by Aon Hewitt Investment Consulting, Inc., an Aon Company. 24
29 Natural Resources Capital Raised ($ Billions) Total Deal Value ($ Billions) Natural Resources Fundraising $45.0 $40.0 $35.0 $30.0 $25.0 $20.0 $15.0 $10.0 $80.00 $70.00 $60.00 $50.00 $40.00 $30.00 $20.00 $10.00 $- $5.0 $0.0 Aggregate Capital Raised ($ Billions) Number of Funds Source: Preqin Energy & Utilities Deal Activity Number of Funds Number of Deals Fundraising During 2Q 2017, eight funds closed on $4.9 billion compared to three funds totaling $0.8 billion in 1Q Energy & Minerals Group Fund IV and Denham Oil and Gas Fund accounted for 69.0% of the capital raised during the quarter, closing on $2.4 billion and $1.0 billion, respectively. At the end of 2Q 2017, there were roughly 96 funds in the market targeting an estimated $47.6 billion in capital, compared to 102 funds seeking an estimated $54.2 billion in 1Q Six managers accounted for 49.6% of the total capital being raised. EnCap Energy Capital Fund XI was seeking the most capital with a target fund size of $6.5 billion. Dry powder was estimated at $74.0 billion at the end of 2Q 2017, which was up 2.4% from 1Q 2017 s level, but remains below the record level of $77.4 billion observed in 3Q Activity Energy and utilities industry managers completed approximately 70 deals totaling an estimated $12.6 billion through 1H 2017, which represents 59.8% of 2016 s full year capital deployment 1. Crude oil prices decreased during the quarter. WTI crude oil prices decreased 8.4% during the quarter to $45.18/bbl 11. Brent crude oil prices ended the quarter at $46.37/bbl, down 10.1% from 1Q Natural gas prices (Henry Hub) increased by 3.5% during the second quarter, ending at $2.98 per MMBtu 11. A total of 940 crude oil and natural gas rotary rigs were in operation in the U.S. at the end of 1Q 2017, up 14.1% from the prior quarter 15. Crude oil rigs represented 80.4% of the total rigs in operation. 48.9% of the 756 active oil rigs were in the Permian basin. 24.5% and 21.7% of natural gas rigs at the end of 2Q 2017 were operating in the Marcellus and Haynesville basins, respectively. The price of iron ore (Tianjin Port) ended the quarter at $57.86 per dry metric ton, down 33.6% quarter-over-quarter 12. Opportunity Acquire and exploit existing oil and gas strategies preferred over early stage exploration in core U.S. and Canadian basins Select midstream opportunities Aggregate Deal Value ($ Billions) Number of Deals Source: Preqin Investment advice and consulting services provided by Aon Hewitt Investment Consulting, Inc., an Aon Company. 25
30 (This page left blank intentionally.) Investment advice and consulting services provided by Aon Hewitt Investment Consulting, Inc., an Aon Company. 26

31 Appendix B: Real Estate Market Update Investment advice and consulting services provided by Aon Hewitt Investment Consulting, Inc., an Aon Company. 27
32 U.S. Real Estate Market Update Q The commercial real estate cycle is very mature and nearing the top of its expansionary phase. Highlights from the quarter included: Return momentum continued to wane. The NFI-ODCE returned 1.7% (gross of fees) this quarter, roughly in line with 1Q2017 but 43 bps lower YOY, and 164 bps lower than 2Q2015. Income was the main driver of returns, registering 1.08% versus appreciation at 0.6%. The trailing oneyear return of 7.87% for this Core index remained in-line with the sector s long-run average range of 7-9%. Continued moderation of returns is expected. Returns in non Core legacy funds continued to perform generally in line with expectations as completed strategies still find eager buyers in the Core investment segment. That said, sales activity is slowing, thus exit risk continued to rise for this segment. U.S. REITs gained 1.5% during the quarter (FTSE NAREIT Equity REIT Index) after a strong June, up 2.2%. While REIT returns were positive (+2.7%) in the first half of 2017, the sector underperformed the broader market as the S&P 500 returned 9.3% during the same time period. REIT returns continued their broad divergence at the sector level as property types with stronger fundamentals (industrial & data centers) outperformed those with weaker fundamentals (retail). U.S. REITs are trading towards the middle of their five-year historical range relative to their underlying property net asset value. Heightened volatility is expected to continue. Fundamentals healthy but moderating: Vacancy held fairly steady across core property types in second quarter, driven by no significant changes in new supply and demand trends. Industrial continued to outperform on a relative basis across the core property types; with Apartments underperforming. Rent growth, while still healthy in all core property types except Apartments, continued to demonstrate a waning in momentum; with more downside risk than upside potential medium term. Investors hunt for yield: Transaction volume in second quarter continued to demonstrate an elevated level of pricing uncertainty as a disconnect between buyers and sellers expectations remained present. That said, investors still paid handsomely for well located properties in primary markets; helping to keep cap rates sticky and low. Search for yield continued to be a key driver of sales activity across all property types. Portfolio structure important. Overall, real estate fundamentals and pricing remain at a mature point in the cycle. Given that, it is important to ensure that risk mitigation strategies are incorporated into the portfolio s structure. Preferred equity and debt structures are important investment considerations that can help mitigate medium term cyclical risks. The following charts provide an update on select current market stats: Sources: Aon Hewitt, CBRE EA, RCA, NCREIF, Moody s Investment advice and consulting services provided by Aon Hewitt Investment Consulting, Inc., an Aon Company. 28


33 Current Market Factors NFI-ODCE (NET) 4-QTR ROLLING RETURNS WITH COMPONENTS AS OF 6/30/2017 (SOURCE: NCREIF AON HEWITT ) Sector returns continue to moderate from recent peak rebound rates; and currently stand squarely in the long run range for the asset class. Income is now, and will continue to be, the larger driver of the sector s total return. Cap rates remain sticky, however; and while at or near recent lows, there is little expectation of going lower. Continued moderation of returns is expected at this mature point in the real estate cycle as growth in appreciation is limited medium term. MARKET MOMENTUM BY PROPERTY TYPE AS OF 6/30/2017 (SOURCE: RCA) A disconnect between buyers and sellers expectations has been evident in sales trends since volume peaked in 4Q2015. The more typical relationship between deal volume and pricing has not moved in unison for almost two years now. While the reason varies by property type, in most cases volume has moved lower while prices have moved higher. YOY transaction volume for the first half of the 2017 fell in every property type except Industrial and Suburban Office. Declines in Apartments (-17%) and Retail (-16%) led YTD. DRY POWDER BY REGION AS OF 6/30/2017 (SOURCE: PREQIN, AON HEWITT) Private real estate dry powder now totals $246bn, slightly surpassing its previous peak of $237bn in 2016 and far exceeding the peak of the last recession. The majority of the sector s dry powder sits in opportunistic and value add funds, accounting for 41% and 24% of the total respectively. Overall, capital flows into U.S. commercial real estate have not been disrupted by on-going global events as investors continue to favor the U.S. at this point in cycle due to the maturity and liquidity of U.S. primary markets. Investment advice and consulting services provided by Aon Hewitt Investment Consulting, Inc., an Aon Company. 29
34 U.S. Real Estate Market Outlook A mature real estate cycle, at a time when the economic outlook is also expected to moderate, presents additional challenges that create the need for closer monitoring and increased attention to new capital deployment. Factors to consider in 2017 and beyond include: The U.S. real estate cycle is very mature; and thus presents more downside risk than upside potential medium term Portfolio construction is critical at this point in the cycle. Appropriate risk mitigation measures should be a staple in all investment portfolios today New investments will likely be required to ride out a cyclical downturn Core recovery is fully valued or more. Returns are expected to continue to moderate Returns will be driven by income generation. Important to focus on underwriting assumptions, especially rent growth expectations and exit cap rates, as well as new supply impacts and levels of non core activity Non-Core investing is past its cyclical sweet spot Tactical opportunities still exist, though return expectations are lower today than the past few years Preferred equity and debt structures are important to incorporate now to help mitigate medium term cyclical risks Focus on use of leverage and managers proven ability to execute on expected strategy in down markets Fundamentals to more broadly moderate; increased downside volatility in pricing will likely follow Demand is expected to slow across most property types, albeit still modestly in 2017; while new supply is expected to rise slightly Prepare portfolio for downward pressure on rent growth and eventually pricing Heightened economic and political uncertainty adds to investment risk Increases risk to real estate investors due to potential changes in interest rates, trade agreements, demand patterns, and the like. Uncertainty creates the potential for higher volatility While current solid sector fundamentals and robust capital flows into the US will help offset some of these risks, real estate will not be immune to global events Important to prepare portfolios for downside volatility Sources: Aon Hewitt, CBRE EA, RCA, NCREIF, Moody s Investment advice and consulting services provided by Aon Hewitt Investment Consulting, Inc., an Aon Company. 30
35 Notes 1. Preqin 2. UBS 3. Standard & Poor s 4. Aon Hewitt Investment Consulting 5. Thomson Reuters 6. Fitch Ratings 7. PriceWaterhouseCoopers/National Venture Capital Association MoneyTree Report 8. PitchBook/National Venture Capital Association Venture Monitor 9. Cooley Venture Financing Report 10. Federal Reserve 11. U.S. Energy Information Administration 12. Bloomberg 13. Setter Capital Volume Report: Secondary Market FY KPMG and CB Insights 15. Baker Hughes 16. Dow Jones Venture Capital Report Notes: FY: Fiscal year ended 12/31 YTD: Year to date YE: Year end LTM: Last twelve months (aka trailing twelve months or TTM) PPM: Purchase Price Multiples: Total Purchase Price / EBITDA /bbl: Price per barrel MMBtu: Price per million British thermal units Investment advice and consulting services provided by Aon Hewitt Investment Consulting, Inc., an Aon Company. 31
36 Legal Disclosures and Disclaimers Investment advice and consulting services provided by Aon Hewitt Investment Consulting, Inc. ( AHIC ). The information contained herein is given as of the date hereof and does not purport to give information as of any other date. The delivery at any time shall not, under any circumstances, create any implication that there has been a change in the information set forth herein since the date hereof or any obligation to update or provide amendments hereto. This document is not intended to provide, and shall not be relied upon for, accounting, legal or tax advice or investment recommendations. Any accounting, legal, or taxation position described in this presentation is a general statement and shall only be used as a guide. It does not constitute accounting, legal, and tax advice and is based on AHIC s understanding of current laws and interpretation. This document is intended for general information purposes only and should not be construed as advice or opinions on any specific facts or circumstances. The comments in this summary are based upon AHIC s preliminary analysis of publicly available information. The content of this document is made available on an as is basis, without warranty of any kind. AHIC disclaims any legal liability to any person or organization for loss or damage caused by or resulting from any reliance placed on that content. AHIC. reserves all rights to the content of this document. No part of this document may be reproduced, stored, or transmitted by any means without the express written consent of AHIC. The opinions referenced are as of the date of publication and are subject to change due to changes in the market or economic conditions and may not necessarily come to pass. Information contained herein is for informational purposes only and should not be considered investment advice. Aon Hewitt Investment Consulting, Inc. is a federally registered investment advisor with the U.S. Securities and Exchange Commission. AHIC is also registered with the Commodity Futures Trade Commission as a commodity pool operator and a commodity trading advisor, and is a member of the National Futures Association. The AHIC ADV Form Part 2A disclosure statement is available upon written request to: Aon Hewitt Investment Consulting, Inc. 200 E. Randolph Street Suite 1500 Chicago, IL ATTN: AHIC Compliance Officer Aon plc All rights reserved. Investment advice and consulting services provided by Aon Hewitt Investment Consulting, Inc., an Aon Company. 32

37


38


39


40


41
42
43


44

45
46
47
48

49


50

51
52


53

54
University of Illinois. Fourth Quarter 2016 Investment Update Board Report. March University of Illinois
 University of Illinois March 15, 2017 Fourth Quarter 2016 Investment Update Board Report March 2017 University of Illinois 1 (This page left blank intentionally) University of Illinois 2 Table of Contents
Presentation Materials
 Fairfax County Public Schools Third Quarter 2017 Presentation Materials Visit the Aon Hewitt Retirement and Investment Blog (http://retirementandinvestmentblog.aon.com); sharing our best thinking. Contact
State Board of Administration of Florida
 State Board of Administration of Florida Major Mandate Review Fourth Quarter 206 Investment advice and consulting services provided by Aon Hewitt Investment Consulting, Inc., an Aon Company. Table of Contents.
State Board of Administration of Florida. Major Mandate Review First Quarter 2013
 State Board of Administration of Florida Major Mandate Review First Quarter 2013 (This page left blank intentionally) 2 Table of Contents 1. Executive Summary 2. Pension Plan Review 3. Investment Plan
Presentation Materials
 Fairfax County Public Schools Second Quarter 2017 Presentation Materials Visit the Aon Hewitt Retirement and Investment Blog (http://retirementandinvestmentblog.aon.com); sharing our best thinking. Contact
Capital Market Review
 Capital Market Review September 3, 215 Percent Percent MARKET/ECONOMIC OVERVIEW Risk Reprices Rapidly 2,2 1,9 1,6 1,3 S&P 5 April 29, 211 to Oct 3, 211 157 Days -19.4% May 21, 215 to Sep 3, 215 132 Days
MAY 2018 Capital Markets Update
 MAY 2018 Market commentary U.S. ECONOMICS The U.S. added 223,000 jobs to payrolls in May, well above the consensus estimate of 180,000 and the expansion average of around 200,000. Sector job gains were
Summit Strategies Group 8182 Maryland Avenue, 6th Floor St. Louis, Missouri Monthly Economic & Capital Market Update
 Summit Strategies Group 8182 Maryland Avenue, 6th Floor St. Louis, Missouri 63105 314.727.7211 Monthly Economic & Capital Market Update November 2015 Yield to Maturity Monthly Change Nov-63 Nov-67 Nov-71
OCTOBER 2018 Capital Markets Update
 OCTOBER 2018 Market commentary U.S. ECONOMICS U.S. real GDP grew at an annualized quarterly rate of 3.5% (3. YoY) in Q3, beating expectations of 3.4%. The economy was supported by the strongest consumer
Economic and Capital Market Update November 2017
 Economic and Capital Market Update November 2017 Oct-69 Oct-73 Oct-77 Oct-81 Oct-85 Oct-89 Oct-93 Oct-97 Oct-01 Oct-05 Oct-09 Oct-13 Oct-17 November 30, 2017 Economic Perspective Economy Global economic
Private Equity Overview
 Private Equity Overview June 10, 2010 State Universities Retirement System Rob Parkinson, Associate Agenda Asset Class Overview Market Update SURS Private Equity Portfolio Asset Class Overview Benefits
SEPTEMBER 2018 Capital Markets Update
 SEPTEMBER 2018 Market commentary U.S. ECONOMICS Non-farm payrolls added 134,000 jobs in September, missing the consensus estimate of 185,000. However, net revisions to the two months prior totaled +87,000
Capital Markets Outlook 100 LOWDER BROOK DRIVE SUITE 1100 WESTWOOD MA FAX
 M E K E T A I N V E S T M E N T G R O U P 00 LOWDER BROOK DRIVE SUITE 00 WESTWOOD MA 02090 78 47 3500 FAX 78 47 34 Investors are faced with three primary issues in the near-term: ) historically low bond
Economic and Capital Market Update April 2018
 Economic and Capital Market Update April 2018 Apr-70 Apr-74 Apr-78 Apr-82 Apr-86 Apr-90 Apr-94 Apr-98 Apr-02 Apr-06 Apr-10 Apr-14 Apr-18 April 30, 2018 Economic Perspective The strong pace of the global
Economic and Financial Markets Monthly Review & Outlook Detailed Report October 2017
 Economic and Financial Markets Monthly Review & Outlook Detailed Report October 17 NOT FDIC INSURED NO BANK GUARANTEE MAY LOSE VALUE Overview of the Economy Business and economic confidence indicators
Asset Strategy Consultants. MARKET ENVIRONMENT Third Quarter 2016
 MARKET ENVIRONMENT Third Quarter 2016 Market Environment: Economy Investor angst over the unexpected vote on Brexit was short lived with a "risk on" theme returning to the markets in July and leading to
Summit Strategies Group 8182 Maryland Avenue, 6th Floor St. Louis, Missouri Monthly Economic & Capital Market Update
 Summit Strategies Group 8182 Maryland Avenue, 6th Floor St. Louis, Missouri 63105 314.727.7211 Monthly Economic & Capital Market Update July 2015 Yield to Maturity Monthly Change Jul-63 Jul-67 Jul-71 Jul-75
Market Watch. July Review Global economic outlook. Australia
 Market Watch Latest monthly commentary from the Investment Markets Research team at BT. Global economic outlook Australia Available data for the June quarter is consistent with a moderation in GDP growth
DECEMBER 2018 Capital Markets Update
 DECEMBER 2018 Market commentary U.S. ECONOMICS Nonfarm payrolls jumped by 312,000 in December, well above expectations for a 176,000 increase. The healthcare sector (+50,000) led job creation, while restaurants
Retirement Funds. SEMIANNual REPORT
 SEMIANNual REPORT November 30, 2017 T. Rowe Price Retirement Funds The funds invest in a diversified portfolio of T. Rowe Price mutual funds, offering a professionally managed, age-appropriate mix of stocks
Quarterly market summary
 Quarterly market summary 3rd Quarter 2017 Economic overview Economic data released during the quarter seemed to signal a continuation of synchronised global recovery in almost all regions. This is being
M&A, Private Equity and Capital Markets Update
 M&A, Private Equity and Capital Markets Update April 211 DRAFT M&A Market Drivers DRAFT Macroeconomic Conditions Favorable For M&A GDP growth expected to continue The second half of 29 exhibited the first
Asset Strategy Consultants. MARKET ENVIRONMENT First Quarter 2017
 MARKET ENVIRONMENT First Quarter 2017 Market Environment: Economy Economies in the U.S. and Europe continued to gain traction. Expectations for lower taxes, reduced regulation, and other pro-growth reforms
Target Funds. SEMIANNual REPORT
 SEMIANNual REPORT November 30, 2017 T. Rowe Price Target Funds The funds invest in a diversified portfolio of T. Rowe Price mutual funds, offering a professionally managed, age-appropriate mix of stocks
MARCH 2018 Capital Markets Update
 MARCH 2018 Market commentary ECONOMIC CLIMATE Hiring slowed from its fast pace last month the U.S. added 103,000 jobs to nonfarm payrolls in March, below the consensus estimate of 185,000. The U-3 unemployment
NOVEMBER 2018 Capital Markets Update
 NOVEMBER 2018 Market commentary U.S. ECONOMICS Non-farm payrolls added 155,000 jobs in November, missing expectations of 198,000, and the unemployment rate held steady at 3.7%. The labor force participation
Retirement System Pension Plan Investment Performance Review Quarter Ended June 30, 2014
 Retirement System Pension Plan Investment Performance Review Quarter Ended June 30, 2014 Investment Advisors John Spagnola, Managing Director Joseph Federico, Analyst PFM Asset Management LLC Two Logan
SEPTEMBER 2017 Private Equity Outlook
 SEPTEMBER 2017 Table of contents VERU.S.INVESTMENTS.COM SEATTLE 206 622 3700 LOS ANGELES 310 297 1777 SAN FRANCISCO 415 362 3484 Executive summary 3 Market update: Other 19 Fund finance: Subscription credit
Economic and Financial Markets Monthly Review & Outlook Detailed Report January 2018
 Economic and Financial Markets Monthly Review & Outlook Detailed Report January 1 NOT FDIC INSURED NO BANK GUARANTEE MAY LOSE VALUE Overview of the Economy Business and economic confidence continue to
Quarterly market summary
 Quarterly market summary 4th Quarter 2017 Economic overview Further evidence of synchronised global economic improvement was signalled by higher measures of economic activity and company profits, along
Marquette Associates Market Environment
 M Marquette Associates Market Environment April 2010 U.S. Economy Fixed Income Markets U.S. Equity Markets International Equity Markets Hedge Fund Markets Real Estate Markets Private Equity and Hedge Fund
Prudential International Investments Advisers, LLC. Global Investment Strategy May 2008
 Prudential International Investments Advisers, LLC. Global Investment Strategy May 2008 By John Praveen, Chief Investment Strategist For Market Commentary Interviews Contact: Lisa Villareal, 973-367-2503/lisa.villareal@prudential.com
January market performance. Equity Markets Price Indices Index
 Global Central Banks continue to lower interest rates. The RBA cuts the cash rate by 25bp to 2.25% (February 2015). The ECB finally announces Quantitative Easing 60b per month. Oil prices declined again
Private Equity. Panel Detail: Monday, May 2, :30 AM - 10:45 AM
 Private Equity Panel Detail: Monday, May 2, 211 9:3 AM - 1:45 AM Speakers: Leon Black, Founding Partner, Apollo Management, LP David Bonderman, Founding Partner, TPG Capital Jonathan Nelson, CEO and Founder,
MARKET REPORT THE MONTHLY A SNAPSHOT OF THE KEY POINTS FOR AUGUST. Bonds continue to Rally. ISSUE 8 August 2014
 ISSUE 8 August 2014 THE MONTHLY MARKET REPORT A SNAPSHOT OF THE KEY POINTS FOR AUGUST The RBA held the overnight cash rate steady at 2.50% for the 12th consecutive Month in August. Short term fixed income
April 2016 Market Commentary
 April 2016 Market Commentary Domestic equity indices finished the month mixed, while international developed markets ended higher. The falling U.S. dollar continued to reverberate across markets, especially
Portfolio Strategist Update from BlackRock Active Opportunity ETF Portfolios
 Portfolio Strategist Update from BlackRock Active Opportunity ETF Portfolios As of Sept. 30, 2017 Ameriprise Financial Services, Inc., ("Ameriprise Financial") is the investment manager for Active Opportunity
Quarterly market summary
 Quarterly market summary 1st Quarter 2018 Economic overview Late in the first quarter of 2018, a potential global trade war dominated the headlines. President Trump imposed tariffs on various imports into
GLOBAL REAL ESTATE SECURITIES Market Commentary Q4 2016
 GLOBAL REAL ESTATE SECURITIES Market Commentary Q4 2016 EXECUTIVE SUMMARY GLOBAL REAL ESTATE STOCKS WERE MODESTLY POSITIVE IN 2016 Real estate stocks finished the year with mid-single digit total return
City of Fort Walton Beach, Florida Beal Memorial Cemetery Perpetual Care Fund
 City of Fort Walton Beach, Florida Beal Memorial Cemetery Perpetual Care Fund Investment Performance Review Investment Advisors Steven Alexander, CTP, CGFO, CPPT, Managing Director Khalid Yasin, CIMA,
Perspectives JAN Market Preview: Private Equity
 Perspectives JAN 2019 2019 Market Preview: Private Equity POISED FOR ROBUST DEPLOYMENT Private equity investors in 2018 benefited from strong overall industry performance, with U.S. funds up 8.3% YTD.
City of Hollywood Employees' Retirement Fund Preliminary Market Value Update as of August 31, 2017
 Market Value Percent of Total Plan New Target Allocation Difference Range Domestic Equity - Large Cap $69,743,672 22.3% 20.0% 2.3% 15-30% Northern Trust $69,743,672 22.3% Domestic Equity - SMID Cap $40,440,453
Summit Strategies Group 8182 Maryland Avenue, 6th Floor St. Louis, Missouri Economic & Capital Market Review
 Summit Strategies Group 8182 Maryland Avenue, 6th Floor St. Louis, Missouri 63105 314.727.7211 Economic & ital Market Review TABLE OF CONTENTS Page Key Highlights 1 Economic Perspective 2 Assets 5 Income
Monthly Market Snapshot
 ly Market Snapshot NOVEMBER 2016 The ly Market Snapshot publication provides commentary on the global economy and the performance of financial markets Key insights Equity markets recovered in November
Week in Markets. FTSE Equity Indices Week MTD Jul 12 Jun 12 QTD YTD. MSCI Equity Indices Week MTD Jul 12 Jun 12 QTD YTD
 Week ending 24 August, 20 Page 1 of 8 FTSE Equity Indices Week MTD Jul Jun QTD YTD UK FTSE All Share -1.3 3.2 1.3 4.8 4.6 8.0 15.5 FTSE -1.3 3.2 1.2 5.0 4.5 6.8 15.3 FTSE 250-1.4 3.0 2.1 3.8 5.2 15.6 17.5
Performance Review May 17, 2018
 Performance Review May 17, 2018 Cost-Efficiencies Initiative Update Goal: Obtain $100 million of incremental cost-efficiencies for the NCRS investment program, consistent with fiduciary requirements and
Financial Market Outlook: Further Stock Gain on Faster GDP Rebound and Earnings Recovery. Year-end Target Raised
 For Market Commentary Interviews Contact: Lisa Villareal, 973-367-2503/lisa.villareal@prudential.com Financial Market Outlook & Strategy: FurtherStock Gains Likely, Year-end Target Raised. Bond Under Pressure
Asset Strategy Consultants. MARKET ENVIRONMENT Second Quarter 2016
 MARKET ENVIRONMENT Second Quarter 2016 Market Environment: U.S. Economy The 2nd quarter was reasonably uneventful and markets were relatively placid until June 23rd, when British voters narrowly approved
MONTHLY MARKET REVIEW April 2018
 MONTHLY MARKET REVIEW April 218 www.primebuchholz.com 63.433.1143 The decline in risk assets subsided in April and U.S. equity market volatility fell from elevated levels exhibited in recent months. Earnings
Eric C. Elbell, CFA, CAIA Area Senior Vice President. Kyongdo Min, CPA, CFA Area Vice President. April 11, 2018
 Eric C. Elbell, CFA, CAIA Area Senior Vice President Kyongdo Min, CPA, CFA Area Vice President April 11, 2018 Agenda We will address three key topics: Headline events that impacted markets during the quarter
ORSO 職業退休計劃. Fidelity Advantage Portfolio Fund
 ORSO 職業退休計劃 Fidelity Advantage Portfolio Fund Semi-Annual Report and Accounts For the period ended 30 June 2018 SEMI-ANNUAL REPORT AND ACCOUNTS - FOR THE PERIOD ENDED 30TH JUNE 2018 Contents Pages Management
Quarterly Asset Class Report Private Equity
 Quarterly Asset Class Report canterburyconsulting.com Canterbury Consulting ( CCI ) is an SEC registered Investment Adviser. Information pertaining to CCI's advisory operations, services, and fees is set
Global Market Overview
 First Quarter 219 First Quarter 219: March Madness, or Just an Incredible Rebound? Global Market Overview MSCI All Country World S&P Russell 2 MSCI EAFE MSCI Emerging Markets MSCI ACWI ex USA Small BBgBarc
FIXED INCOME STRATEGIES FOR LATE 2017 NAVIGATING UNCHARTERED TERRITORY, RISING RATES, AND YOUR FIXED INCOME PORTFOLIO
 FIXED INCOME STRATEGIES FOR LATE 2017 NAVIGATING UNCHARTERED TERRITORY, RISING RATES, AND YOUR FIXED INCOME PORTFOLIO 1 The information contained herein reflects the views of Galliard Capital Management,
May market performance. Index. Index. Global economies
 JUNE 2016 The recovery in equity and commodity prices from February lows continued into May with the third straight month of equity and commodity price rises. Oil prices continued to move higher, up another
SIP Aggressive Portfolio
 SIP LIFESTYLE PORTFOLIOS FACT SHEET (NOV 2015) SIP Aggressive Portfolio SIP Aggressive Portfolio is a unitized fund, which is designed to provide long term capital growth. It is designed for those who
INVESTMENT OUTLOOK March 2016
 Austrasse 56 P.O. Box 452 94 Vaduz, Liechtenstein asset@imt.li www.imt.li INVESTMENT OUTLOOK 03.2016 19 March 2016 Since mid-february markets have calmed significantly and risky assets have enjoyed a clear
Market Update: Broad Market Returns and Indicators
 Market Update Eckler Ltd. collects information directly from sources believed to be reliable. Eckler Ltd. does not guarantee or warrant the accuracy, timeliness, or completeness of the information either
Putnam Stable Value Fund
 Product profile Q1 2016 Putnam Stable Value Fund Inception date February 28, 1991 Total portfolio assets $5.7B Putnam Stable as of March 31, 2016 Value Weighted average maturity 2.66 Effective duration
A CASE FOR GLOBAL LISTED REAL ESTATE SECURITIES IN A MIXED ASSET PORTFOLIO
 A CASE FOR GLOBAL LISTED REAL ESTATE SECURITIES IN A MIXED ASSET PORTFOLIO MAY 2015 EXECUTIVE SUMMARY Access to Growing Global Markets The number of listed real estate companies world-wide continues to
Portfolio Strategist Update from The Dreyfus Corporation
 Portfolio Strategist Update from The Dreyfus Corporation Active Opportunity ETF Portfolios As of Dec. 31, 2017 Ameriprise Financial Services, Inc. (Ameriprise Financial) is the investment manager for Active
Summit Strategies Group 8182 Maryland Avenue, 6th Floor St. Louis, Missouri Economic & Capital Market Review
 Summit Strategies Group 8182 Maryland Avenue, 6th Floor St. Louis, Missouri 63105 314.727.7211 Economic & ital Market Review TABLE OF CONTENTS Page Key Highlights 1 Economic Perspective 2 Assets 5 Income
Capital Markets Review 2nd Quarter 2018 June 30, 2018
 Return (%) Capital Markets Review 2nd Quarter 2018 June 30, 2018 Overview The US dollar strengthened significantly relative to a trade weighted basket of currencies during the second quarter of 2018, reversing
Zenith Monthly Market Report Zenith Monthly Market Report (31 May 2011) `
 `") Zenith Monthly Market Report (31 May 2011) ` Market Indicators Market Indicator End of Month Previous Month 1 Month Change 12 Months Ago 12 Month Change Interest Rates Overnight Cash 4.75 4.75 0.00% 4.50
Zenith Monthly Market Report (31 May 2011) ` Market Indicators Market Indicator End of Month Previous Month 1 Month Change 12 Months Ago 12 Month Change Interest Rates Overnight Cash 4.75 4.75 0.00% 4.50
Leumi. Global Economics Monthly Review. Arie Tal, Research Economist. July 12, Capital Markets Division, Economics Department. leumiusa.
 Global Economics Monthly Review July 12, 2018 Arie Tal, Research Economist Capital Markets Division, Economics Department Leumi leumiusa.com Please see important disclaimer on the last page of this report
Endowment Funds Performance (Year ending June 30 th, 2014)
") Endowment Funds Performance (Year ending June 30 th, 2014) prepared for Investment Subcommittee (Note: all returns and values are expressed in Canadian Dollars- CAD s) 1 Quarterly Market Overview Equity
Endowment Funds Performance (Year ending June 30 th, 2014) prepared for Investment Subcommittee (Note: all returns and values are expressed in Canadian Dollars- CAD s) 1 Quarterly Market Overview Equity
Fresno County Employees' Retirement Association
 Fresno County Employees' Retirement Association Investment Performance Review Period Ending: December 31, 2006 999 Third Avenue, Suite 3650 2321 Rosecrans Avenue, Suite 2250 Seattle, Washington 98104 El
Q2 Quarterly Market Review Second Quarter 2015
 Q2 Quarterly Market Review Second Quarter 2015 Quarterly Market Review Second Quarter 2015 This report features world capital market performance and a timeline of events for the past quarter. It begins
Market Outlook. July 2015
 Market Outlook July 2015 Greece Defaults; Contagion Risks Limited Greek government failed to make the EUR 1.6bn IMF debt payment due on 30 June and becomes the first nation to default on IMF since Mugabe's
Capital Markets Review 4th Quarter 2016 December 31, 2016
 Return (%) Capital Markets Review 4th Quarter 2016 December 31, 2016 Overview The fourth quarter of 2016 was positive for US equities, but generally negative for international developed and emerging market
Economic and Financial Markets Monthly Review & Outlook Detailed Report. June 2014
 Economic and Financial Markets Monthly Review & Outlook Detailed Report June 1 Overview of the Economy In the U.S., the Federal Reserve s Beige Book report on the economy through late May indicated that
By John Praveen, Chief Investment Strategist of Prudential International Investments Advisers, LLC.*
 By John Praveen, Chief Investment Strategist of Prudential International Investments Advisers, LLC.* For Market Commentary Interviews Contact: Lisa Villareal, 973-367-2503/lisa.villareal@prudential.com
Fixed income market update
 March 2, 215 Fixed income market update Taplin, Canida & Habacht, LLC BMO Global Asset Management 11 Brickell Bay Drive Suite 21 Miami, Florida 33131 p 35-379-21 f 35-379-4452 tchinc.com Fixed income market
Q QUARTERLY PERSPECTIVES
 Q2-219 QUARTERLY PERSPECTIVES Tavistock Wealth - Investment Team Outlook Christopher Peel - John Leiper - Andrew Pottie - Sekar Indran - Alex Livingstone India Turnbull - Jonah Levy - James Peel Welcome
Global Macroeconomic Monthly Review
 Global Macroeconomic Monthly Review August 14 th, 2018 Arie Tal, Research Economist Capital Markets Division, Economics Department 1 Please see disclaimer on the last page of this report Key Issues Global
PREQIN QUARTERLY UPDATE: NATURAL RESOURCES Q Insight on the quarter from the leading provider of alternative assets data
 PREQIN QUARTERLY UPDATE: NATURAL RESOURCES Q2 217 Insight on the quarter from the leading provider of alternative assets data Content includes: Fundraising Funds in Market Institutional Investors Fund
Week in Markets. FTSE Equity Indices Week MTD Mar 17 Feb 17 QTD YTD. MSCI Equity Indices Week MTD Mar 17 Feb 17 QTD YTD
 Week ending 7 April, 2017 Page 1 of 8 FTSE Equity Indices Week MTD Mar 17 Feb 17 QTD YTD UK FTSE All Share 0.6 0.6 1.2 3.1 0.6 4.7 23.5 FTSE 0.5 0.5 1.1 3.1 0.5 4.2 24.6 FTSE 250 1.5 1.5 1.4 3.5 1.5 7.0
U.S. REAL ESTATE SECURITIES Market Commentary Q4 2016
 U.S. REAL ESTATE SECURITIES Market Commentary Q4 2016 EXECUTIVE SUMMARY U.S. REAL ESTATE STOCKS DELIVERED POSITIVE TOTAL RETURNS IN 2016 U.S. real estate stocks delivered positive performance in 2016,
Presentation Global private equity trends
 Presentation Global private equity trends Alex Scott Partner Pantheon Ventures Global Private Equity Trends Alex Scott July 2018 Hitting the headlines IPOS ARE DWINDLING, SO IS THE NUMBER OF PUBLIC COMPANIES
U.S. REAL ESTATE SECURITIES Market Commentary Q4 2016
 U.S. REAL ESTATE SECURITIES Market Commentary Q4 2016 EXECUTIVE SUMMARY U.S. REAL ESTATE STOCKS DELIVERED POSITIVE TOTAL RETURNS IN 2016 U.S. real estate stocks delivered positive performance in 2016,
Zenith Monthly Market Report Zenith Monthly Market Report (31 October 2011)
") Zenith Monthly Market Report (31 October 2011) Market Indicators Market Indicator End of Month Previous Month 1 Month Change 12 Months Ago 12 Month Change Interest Rates Overnight Cash 4.75 4.75 0.00%
Zenith Monthly Market Report (31 October 2011) Market Indicators Market Indicator End of Month Previous Month 1 Month Change 12 Months Ago 12 Month Change Interest Rates Overnight Cash 4.75 4.75 0.00%
GLOBAL REAL ESTATE SECURITIES Market Commentary Q1 2017
 GLOBAL REAL ESTATE SECURITIES Market Commentary Q1 2017 EXECUTIVE SUMMARY GLOBAL REAL ESTATE STOCKS WERE POSITIVE DURING Q1 2017 Real estate stocks moved higher during the first quarter as economic releases
Market Overview As of 4/30/2018
 Asset Class Leadership Periodic Table Worst Best 5.24-26.16-28.92-36.85-37.00-37.34-38.44-38.54-45.53 78.51 58.21 41.45 37.21 34.47 27.45 26.46 20.58 19.69 29.09 27.58 24.50 18.88 16.71 15.51 15.12 15.06
Market Overview As of 11/30/2018
 Asset Class Leadership Periodic Table Worst Best 5.24-26.16-28.92-36.85-37.00-37.34-38.44-38.54-45.53 78.51 58.21 41.45 37.21 34.47 27.45 26.46 20.58 19.69 29.09 27.58 24.50 18.88 16.71 15.51 15.12 15.06
1000G 1000G HY
 Asset Class Leadership Periodic Table Worst Best 5.24-26.16-28.92-36.85-37.00-37.34-38.44-38.54-45.53 78.51 58.21 41.45 37.21 34.47 27.45 26.46 20.58 19.69 29.09 27.58 24.50 18.88 16.71 15.51 15.12 15.06
Market Overview As of 1/31/2019
 Asset Class Leadership Periodic Table Worst Best 78.51 58.21 41.45 37.21 34.47 27.45 26.46 20.58 19.69 29.09 27.58 2 18.88 16.71 15.51 15.12 15.06 11.15 7.84 7.28 4.98 2.64 2.11 0.39-2.91-5.50-13.71 20.14
The SunGard Retirement Benefits Scheme Quarterly Investment Monitoring Report to 31 March 2012
 Quarterly Investment Monitoring Report to 31 March 2012 Executive Summary Scheme Asset Valuation The SunGard Section's assets increased in value over the quarter to 75,233,620. This is an increase of 5,188,852
Quarterly Market Review. First Quarter 2015
 Q1 Quarterly Market Review First Quarter 2015 Quarterly Market Review First Quarter 2015 This report features world capital market performance and a timeline of events for the past quarter. It begins with
Market Overview As of 10/31/2017
 Asset Class Leadership Periodic Table Worst Best 39.42 16.65 11.81 7.05 6.97 5.49 1.87-0.17-9.78 5.24-26.16-28.92-36.85-37.00-37.34-38.44-38.54-45.53 78.51 58.21 41.45 37.21 34.47 27.45 26.46 20.58 19.69
Market Overview As of 8/31/2017
 Asset Class Leadership Periodic Table Worst Best 39.42 16.65 11.81 7.05 6.97 5.49 1.87-0.17-9.78 5.24-26.16-28.92-36.85-37.00-37.34-38.44-38.54-45.53 78.51 58.21 41.45 37.21 34.47 27.45 26.46 20.58 19.69
June 2013 Equities Rally Drive Global Re-rating
 June 2013 Equities Rally Drive Global Re-rating Since the lows of 2011, global equities have rallied 30% while Earnings per Share remained flat. This has been the biggest mid-cycle re-rating of global
Global ex US PE / VC Benchmark Commentary Quarter and Year Ending December 31, 2015
 Global ex US PE / VC Benchmark Commentary Quarter and Year Ending December 31, 2015 Overview The Cambridge Associates LLC Global ex US Developed Markets Private Equity and Venture Capital (PE/VC) Index
Quarterly Asset Class Report Private Equity
 Quarterly Asset Class Report canterburyconsulting.com Canterbury Consulting ( CCI ) is an SEC registered Investment Adviser. Information pertaining to CCI's advisory operations, services, and fees is set
SUNRISE POLICE PENSION FUND PERFORMANCE REVIEW JUNE 2003
 PENSION FUND PERFORMANCE REVIEW JUNE 23 Associates, Inc. 199, 2 INVESTMENT RETURN On June 3th, the Sunrise Police Pension Fund s assets were valued at $36,325,34, which was an increase of $2,641,772 from
November PRUDENTIAL INTERNATIONAL INVESTMENTS ADVISERS, LLC. Global Investment Outlook & Strategy
 PRUDENTIAL INTERNATIONAL INVESTMENTS ADVISERS, LLC. Global Investment Outlook & Strategy November 2015 John Praveen, PhD Chief Investment Strategist FOR MORE INFORMATION CONTACT: Theresa Miller Phone:
Zenith Monthly Market Report Zenith Monthly Market Report (30 June 2010)
") Zenith Monthly Market Report (30 June 2010) Market Indicators Market Indicator End of Month Previous Month 1 Month Change 12 Months Ago 12 Month Change Interest Rates Overnight Cash 4.50 4.50 0.00% 3.00
Zenith Monthly Market Report (30 June 2010) Market Indicators Market Indicator End of Month Previous Month 1 Month Change 12 Months Ago 12 Month Change Interest Rates Overnight Cash 4.50 4.50 0.00% 3.00
Perspectives JAN Market Preview: Private Equity
 Perspectives JAN 2018 2018 Market Preview: Private Equity RELATIVE OPPORTUNITY FUELING GROWTH Private equity investors in 2017 benefited from strong overall industry performance, with U.S. funds up 12%
GLOBAL REAL ESTATE SECURITIES Market Commentary Q4 2017
 GLOBAL REAL ESTATE SECURITIES Market Commentary Q4 2017 MARKET PERFORMANCE REVIEW Real estate stocks finished the year with a positive Q4 and 1+ total return for the year, which outperformed bonds but
Market volatility to continue
 How much more? Renewed speculation that financial institutions may report increased US subprime-related losses has sent equity markets tumbling. How much more bad news can investors expect going forward?
Short exposure to US equities
 Portfolio performance The All Asset Fund aims to serve as a differentiated asset allocation strategy. It focuses on third pillar assets in seeking three key outcomes: 1) long-term real return consistent