University of Illinois. Fourth Quarter 2016 Investment Update Board Report. March University of Illinois
|
|
|
- Charlotte Waters
- 6 years ago
- Views:
Transcription

1 University of Illinois March 15, 2017 Fourth Quarter 2016 Investment Update Board Report March 2017 University of Illinois 1
2 (This page left blank intentionally) University of Illinois 2
3 Table of Contents Section Page Number Market Overview and University Assets 5 Endowment Fund Update: December 31, Operating Pool Update: December 31, Appendix: Market Environment 21 Explanatory Notes 35 University of Illinois 3
4 (This page left blank intentionally) University of Illinois 4
5 Market Overview and University Assets University of Illinois 5
6 Capital Markets Review December 31, 2016 Global equity markets rose during the fourth quarter against a backdrop of political uncertainty in the form of the U.S. presidential elections, Italian constitutional referendum, and ongoing Brexit discussions. Expectations of reflationary policies under a Trump administration bolstered the U.S. equity market as investors rotated out of bonds and into equities. The strengthening of the U.S. dollar eroded much of the gains made in other regional equity markets. Expectations of increased protectionism under Trump weighed heavily on emerging markets. The U.S. Federal Reserve s decision to increase the target federal funds range by 25bps to % drove the Treasury yield curve to shift upward over the fourth quarter with yields rising across the curve. During the fourth quarter, hedge fund performance was positive across strategies with the exception of global macro and emerging markets. U.S. private market real estate performed well on a relative basis in 2016, despite its clear moderating trend following five years of above average performance. Income growth for the year outpaced appreciation, illustrating that income growth has become the larger driver of sector returns at this mature point in the real estate cycle. University of Illinois 6

7 University Assets: December 31, 2016 University of Illinois 7
8 (This page left blank intentionally) University of Illinois 8
9 Endowment Fund Update: December 31, 2016 University of Illinois 9
10 Total Endowment Assets by Type December 31, 2016 Total Endowment Fund $706.0 Million Endow ment Farms 9.4% Sep Invested Endow ment 0.4% Operating Permanent Core 43.6% Endow ment Pool ex Operating 46.6% The Total Endowment Fund is valued at $706.0 million as of December 31, The Operating Pool maintains a permanent core investment in the Endowment Pool (light-blue pie slice); this is a long-term investment to enhance Operating Pool returns. The combined Endowment Pool is valued at $636.6 million (dark- and light- blue pie slices) and discussed further on the following pages. University of Illinois 10
11 Total Fund Asset Growth: Endowment Pool During the fourth quarter ending December 31, 2016, the Endowment Pool assets decreased by approximately $0.8 million, from $637.4 million to $636.6 million. This decrease was the net result of investment gains and negative fund flows. For this period, net outflows were approximately $7.3 million, and the absolute return of 1.0% in Endowment Pool assets resulted in investment gains of $6.6 million. *The beginning market value + net contributions + investment gains referenced in the above table may not equal the ending market value due to rounding. University of Illinois 11
12 Market Value and Asset Allocation: Endowment Pool December 31, 2016 Total Fund $636,604,390 Note: Long-Term Policy Allocations: U.S. Equity 14%, Non-U.S. Equity 10%, Global Equity 24%, Private Equity 8%, Hedge Funds 10%, Fixed Income 20%, Farmland 7%, and Core Real Estate 7% *Total sum of actual allocations referenced in the above table may not equal 100.0% due to rounding. University of Illinois 12
13 Total Fund Performance: Endowment Pool December 31, 2016 During the quarter ending December 31, 2016, the Endowment Pool gained 1.0 percentage point while outperforming the benchmark. Below are the main drivers of the Endowment Pool s quarterly return: U.S. Equity investments outperformed the Dow Jones U.S. Total Stock Market by 0.7 percentage point during the quarter, returning 4.8%. The Hedge Fund portfolio outperformed its benchmark by 0.9 percentage point during the quarter, returning 2.1%. Fixed Income and Non-U.S. Equity investments approximated their respective benchmarks during the quarter, returning -2.9% and -1.6%, respectively. Over the trailing one-year period ending December 31, 2016, the Endowment Pool returned 6.5%, relatively underperforming its benchmark. The largest detractors of relative performance were U.S. Equity, Hedge Funds, and Private Equity. University of Illinois 13
14 Peer Rankings: Endowment Pool December 31, 2016 Over the trailing one-year time period, the return of the University of Illinois s Endowment Pool ranked in the top 50% of the Investment Metrics/BNY Mellon Endowment Fund and Foundation Universe returns, and the three- and five-year returns ranked in the top 31% and 13% of the Universe, respectively. University of Illinois 14
15 Asset Class Performance: Endowment Pool December 31, The combined Adams Street Partners IRR at September 30, 2016 w as 9.1%. 2 Farmland is valued annually on June 30. As such, the one-year return reflected above is the one-year return for Farmland as of June 30, University of Illinois 15
16 (This page left blank intentionally) University of Illinois 16
17 Operating Pool Update: December 31, 2016 University of Illinois 17
18 Total Fund Asset Growth: Operating Pool During the fourth quarter ending December 31, 2016, the Operating Pool assets decreased by approximately $115.6 million, from $2.079 billion to $1.963 billion. This decrease was the result of $109.9 million in net outflows and transfers and $5.7 million in investment losses. Note: The Total Fund s beginning and ending market values include bank balances in w hich the University earns credit to offset bank fees. *The beginning market value + net contributions + investment gains referenced in the above table may not equal the ending market value due to rounding. University of Illinois 18
19 Total Fund Performance: Operating Pool December 31, 2016 Total Fund $1,963,373,529 The Operating Pool s performance during the fourth quarter was -0.3%, performing inline with its benchmark return for this time period. All of the Operating Pool s managers except for two approximated or outperformed their respective benchmarks during the quarter. Note: Total Fund performance excludes the JP Morgan bank balance. University of Illinois 19
20 (This page left blank intentionally) University of Illinois 20
21 Appendix: Market Environment University of Illinois 21
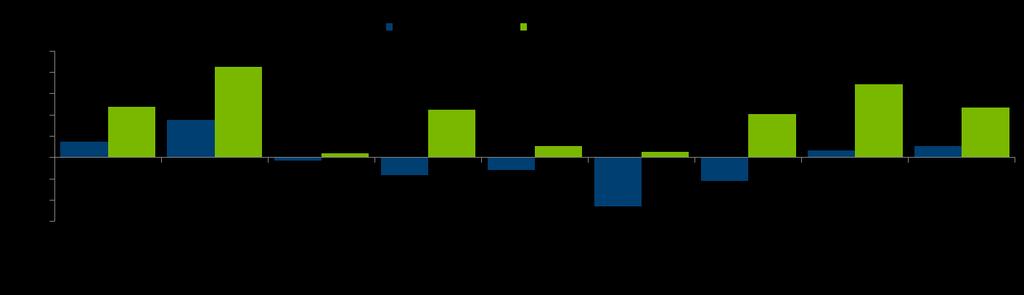
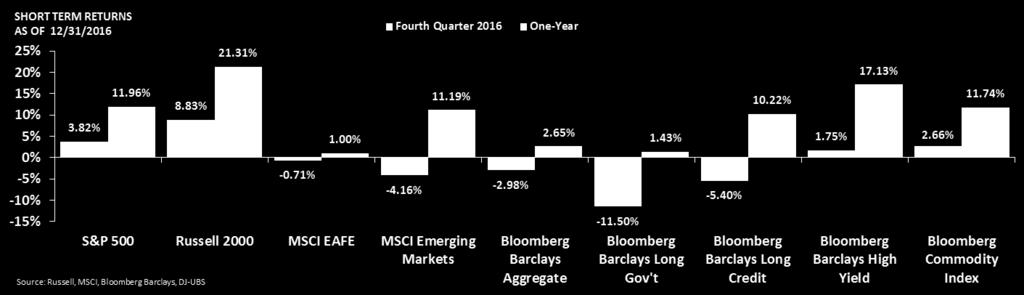
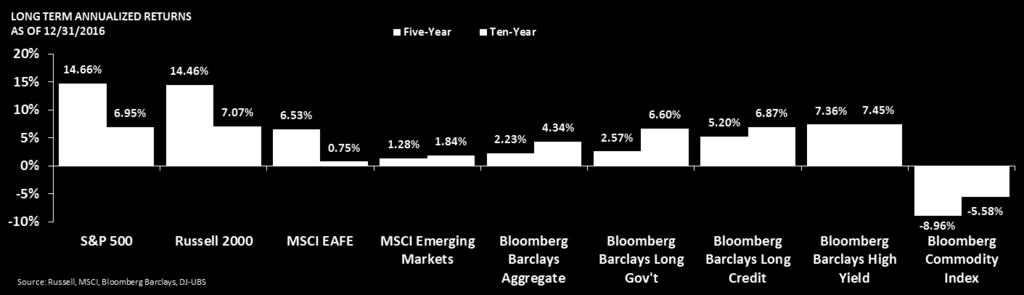
22 Market Highlights Returns of the Major Capital Markets Periods Ending 12/31/2016 Fourth Quarter 1-Year 3-Year 1 5-Year 1 10-Year 1 Equity MSCI All Country World IMI 1.27% 8.36% 3.25% 9.62% 3.84% MSCI All Country World 1.19% 7.86% 3.13% 9.36% 3.56% Dow Jones U.S. Total Stock Market 4.14% 12.62% 8.36% 14.59% 7.18% Russell % 12.74% 8.43% 14.67% 7.07% S&P % 11.96% 8.87% 14.66% 6.95% Russell % 21.31% 6.74% 14.46% 7.07% MSCI All Country World ex-u.s. IMI -1.57% 4.41% -1.44% 5.35% 1.22% MSCI All Country World ex-u.s % 4.50% -1.78% 5.00% 0.96% MSCI EAFE -0.71% 1.00% -1.60% 6.53% 0.75% MSCI EAFE (Local Currency) 7.07% 5.34% 5.53% 11.84% 2.20% MSCI Emerging Markets -4.16% 11.19% -2.55% 1.28% 1.84% Fixed Income Bloomberg Barclays Global Aggregate -7.07% 2.09% -0.19% 0.21% 3.29% Bloomberg Barclays Aggregate -2.98% 2.65% 3.03% 2.23% 4.34% Bloomberg Barclays Long Gov't % 1.43% 7.71% 2.57% 6.60% Bloomberg Barclays Long Credit -5.40% 10.22% 6.98% 5.20% 6.87% Bloomberg Barclays Long Gov't/Credit -7.84% 6.67% 7.16% 4.07% 6.85% Bloomberg Barclays US TIPS -2.41% 4.68% 2.26% 0.89% 4.36% Bloomberg Barclays High Yield 1.75% 17.13% 4.66% 7.36% 7.45% Citi Group Non-U.S. WGBI % 1.81% -2.18% -1.94% 2.54% JP Morgan EMBI Global (Emerging Markets) -4.21% 10.19% 5.59% 5.44% 6.76% Commodities Bloomberg Commodity Index 2.66% 11.74% % -8.96% -5.58% Goldman Sachs Commodity Index 5.76% 11.37% % % -8.10% Hedge Funds HFRI Fund-Weighted Composite % 5.47% 2.41% 4.51% 3.36% HFRI Fund of Funds % 0.53% 1.20% 3.42% 1.31% Real Estate NAREIT U.S. Equity REITS -2.89% 8.52% 13.38% 12.01% 5.08% NCREIF NFI - ODCE % 8.72% 12.05% 12.20% 5.81% Infrastructure Macquarie Global Infrastructure - North America -2.80% 9.30% 2.95% 5.60% 3.08% MSCI Indices show net returns. All other indices show total returns. 1 Periods are annualized. 2 Latest 5 months of HFR data are estimated by HFR and may change in the future. 3 Fourth quarter results are preliminary and gross of fees. University of Illinois 22
23 Market Highlights University of Illinois 23
24 Global Equity Markets GLOBAL MSCI IMI INDEX RETURNS AS OF 12/31/ % Fourth Quarter % One-Year 20% 10% 0% -10% 8.36% 4.41% 1.27% -1.57% 3.84% 11.95% -1.25% -1.57% -0.44% 3.25% 2.51% -7.86% 7.78% -0.51% -0.23% -3.19% -4.45% 9.90% -20% Source: MSCI ACWI IMI 46.3% ACWI ex- U.S. IMI 53.7% USA IMI 5.9% UK IMI 8.2% Japan IMI 3.3% Canada IMI % 0.3% Israel IMI 14.3% Europe ex- UK IMI 3.9% Pacific ex- Japan IMI 10.4% Emerging Markets IMI Global equity markets rose against a backdrop of political uncertainty in the form of the U.S. presidential election, Italian constitutional referendum, and ongoing Brexit discussions. Markets entered positive territory toward the end of the quarter on the hopes of Trump s fiscal reform policies and rising crude oil prices. Global equity markets returned 1.27% in Q with only U.S. and Canada regions generating positive returns. The U.S. was the best performing market with a return of 3.84% during the quarter as Q GDP data was strong and inflation expectations grew over promises of greater fiscal spending under Trump s administration. Note: Percentages along the bottom of the graph show the proportion of the sub-index within the ACWI IMI Index. University of Illinois 24


25 Global Equity Markets The two exhibits on this slide illustrate the percentage that each country/region represents of the global equity market as measured by the MSCI All Country World IMI Index and the MSCI All Country World ex-u.s. IMI Index. University of Illinois 25
26 U.S. Equity Markets RUSSELL STYLE RETURNS AS OF 12/31/ % 30% 20% 10% 0% 4.21% 12.74% 7.21% 16.20% Russell % Large Value Source: Russell Indexes 1.21% 6.95% 33.2% Large Growth 5.52% 20.00% 14.7% Medium Value 0.46% 7.33% 11.7% Medium Growth Fourth Quarter 2016 One-Year 14.07% 31.74% 4.2% Small Value 3.57% 11.32% 3.8% Small Growth RUSSELL RGS* SECTOR RETURNS AS OF 12/31/ % 20% 10% 0% -10% 4.21% 12.74% Russell % Source: Russell Indexes 14.82% 16.9% Technology -4.22% -3.33% 12.9% Healthcare 2.23% 6.85% 13.8% Cons. Disc -1.57% 7.31% 5.79% 7.4% Cons. Staples 26.29% 7.0% Energy 5.95% 23.09% 3.9% Materials & Processing Fourth Quarter 2016 One-Year 8.23% 20.13% 11.1% Producer Durables 13.04% 17.96% 21.5% Financial Services 2.87% 20.49% 5.5% Utilities The Russell 3000 Index returned 4.21% during the fourth quarter and returned 12.74% over the one-year period. Performance across the market capitalization spectrum was positive over the quarter. Small cap stocks outperformed the other segments in growth and value stocks. Value stocks continued their outperformance relative to growth stocks over 2016 across the capitalizations. During the fourth quarter, the financial services sector was the strongest performer, returning 13.04%. The healthcare and consumer staples sectors were the weakest performers, with returns of -4.22% and -1.57%, respectively. *RGS stands for Russell Global Sectors. University of Illinois 26
27 U.S. Fixed Income Markets BLOOMBERG BARCLAYS AGGREGATE RETURNS BY SECTOR AS OF 12/31/ % 6.11% 6.0% Fourth Quarter One-Year 20% 15% BLOOMBERG BARCLAYS AGGREGATE RETURNS BY QUALITY AND HIGH YIELD RETURNS AS OF 12/31/2016 Fourth Quarter One-Year 17.13% 4.0% 2.0% 2.65% 1.05% 1.67% 2.03% 3.32% 10% 7.87% 0.0% -2.0% -4.0% -6.0% -2.98% Barclays Agg. Bond Source: Bloomberg Barclays Live -3.72% 43.9% Gov't -2.83% 25.8% Corp % 28.1% MBS -0.70% 0.5% ABS -3.03% 1.7% CMBS The Bloomberg Barclays Aggregate Bond Index fell 2.98% in the fourth quarter. ABS bonds fell by the least with a return of -0.70% while Government bonds fell by the most, returning -3.72%. High yield bonds outperformed investment grade corporate bonds, as high yield spreads fell by 71bps (according to the Bloomberg Barclays Live indices). Shortest duration bonds outperformed all other bonds in different maturities. This particularly benefited high yield bonds, which typically have low duration. 5% 4.65% 3.10% 1.36% 1.75% 0% -5% -2.98% -3.06% -3.19% -2.75% Aaa Aa A Baa High Yield Source: Bloomberg Barclays Live BLOOMBERG BARCLAYS AGGREGATE RETURNS BY MATURITY AS OF 12/31/ % 6.67% 6.0% Fourth Quarter One-Year 4.0% 2.01% 1.94% 2.37% 2.0% 1.31% 0.0% -2.0% -0.38% -1.68% -4.0% -2.59% -6.0% -4.31% -8.0% -7.84% -10.0% 1-3 Yr. 3-5 Yr. 5-7 Yr Yr. >10 Yr. Source: Bloomberg Barclays Live University of Illinois 27
28 U.S. Fixed Income Markets U.S. TREASURY YIELD CURVE 3.5% 12/31/ % 9/30/ % 12/31/ % 1.5% 1.0% U.S. 10-YEAR TREASURY AND TIPS YIELDS 6.0% 5.0% 4.0% 3.0% 2.0% 1.0% 0.0% 10Y TIPS Yield 10Y Treasury Yield 0.5% 0.0% Source: U.S. Department of Treasury Maturity (Years) -1.0% -2.0% Dec 06 Dec 07 Dec 08 Dec 09 Dec 10 Dec 11 Dec 12 Dec 13 Dec 14 Dec 15 Dec 16 Source: U.S. Department of Treasury The Treasury yield curve shifted upward over the fourth quarter with yields rising across the curve. The yield curve also steepened over the quarter, driven by long maturity bonds rising faster than short maturity bonds. The U.S. Federal Reserve s decision to increase the target federal funds range by 25bps to % alongside higher breakeven inflation drove yields higher. The 10-year U.S. Treasury yield ended the quarter at 2.45%, 85 basis points higher than its level at the beginning of the quarter. The 10-year TIPS yield rose by 50 basis points over the quarter and ended the period at 0.50%. University of Illinois 28
29 Credit Spreads Spread (bps) 12/31/2016 9/30/ /31/2015 Quarterly Change (bps) 1-Year Change (bps) U.S. Aggregate Long Gov't Long Credit Long Gov't/Credit MBS CMBS ABS Corporate High Yield Global Emerging Markets Source: Barclays Live During the fourth quarter, credit spreads were mixed across all areas of the bond market. ABS bond spreads rose by 4 basis points, the most over the quarter, whereas high yield and long-dated credit spreads fell by 71 and 28 basis points, respectively. University of Illinois 29
30 Currency TRADE WEIGHTED U.S. DOLLAR INDEX (1997 = 100) U.S. DOLLAR RELATIVE TO EUR, GBP AND JPY REBASED TO 100 AT 06/30/ Stronger Dollar Weaker Dollar EUR/USD GBP/USD JPY/USD Source: Federal Reserve Source: DataStream As measured through the broad trade weighted U.S. dollar index, the U.S. dollar rose sharply over the quarter. The U.S. dollar appreciated sharply against all major currencies as expectations of greater fiscal spending and increased number of future interest rate hikes led to significant U.S. dollar inflows. The pound was dragged down by worries over the possibility of a hard-brexit. The yen depreciated sharply against the dollar, primarily due to the divergent monetary policy stances of the two central banks. University of Illinois 30


31 Hedge Fund Markets Overview Hedge fund performance was positive across strategies with the exception of global macro and emerging markets. The HFRI Fund-Weighted Composite Index and the HFRI Fund of Funds Composite Index produced returns of 1.21% and 0.88%, respectively, during the quarter. Distressed-restructuring was the best performer, with a return of 4.02% in the fourth quarter. University of Illinois 31
32 Value ($ Billions) Private Equity Market Overview LTM Global Priv ate Equity-Backed Buyout Deal Volume $600 $500 $400 $300 Deal Value ($ Billions) 4,500 Number of Deals 4,000 3,500 3,000 2,500 2,000 # of Deals Purchase Price Multiples All Transactions Sizes 12.0 x 10.0 x 9.7 x 9.1 x 8.5 x 8.8 x 8.7x 8.8x 8.0 x 7.7 x 6.0 x 4.0 x 9.8x 10.3x 10.5x $200 $100 1,500 1, x 0.0 x $0 0 2Q08 1Q09 4Q09 3Q10 2Q11 1Q12 4Q12 3Q13 2Q14 1Q15 4Q15 3Q16 Source: Preqin Senior Debt/EBITDA Sub Debt/EBITDA Equity/EBITDA Source: S&P In Q3 2016, $108.4 billion was raised by 243 funds, which was down 21.3% on a capital basis and 13.2% by number of deals from the prior quarter. On a year-to-date basis, private equity fundraising totaled $357.2 billion, which was up 6.8% year over year. 1 Dry powder was up roughly 4.5% compared to Q s peak of $1.2 trillion and remained well above the five year average level of $910.4 billion. 1 Global private equity-backed buyout deals totaled $90.6 billion in the third quarter, which was down 9.2% from the prior quarter, but above the five year quarterly average of $82.7 billion. 1 Over the last twelve months, 4,055 deals were completed as of 3Q 2016 for an aggregate deal value of $378.6 billion compared to 4,087 transactions totaling $375.9 billion at the end of Q At the end of Q3 2016, average purchase price multiples for all U.S. LBOs were 10.5x EBITDA, up from 10.1x as of the end of Q Both large cap and middle-market purchase price multiples increased on a year-to-date basis quarter over quarter. Middle-market purchase price multiples increased from 8.2x through 1H 2016 to 9.9x through 3Q Sources: 1 Preqin 2 Standard & Poors 3 PWC / National Venture Capital Association (NVCA) MoneyTree Report 4 PitchBook 5 Fitch Ratings 6 Thomson Reuters 7 UBS Notes: YTD: Year to date; LTM: Last twelve months (aka trailing twelve months); PPM: Purchase Price Multiples: Total Purchase Price /EBITDA. University of Illinois 32
33 U.S. Commercial Real Estate Market PRIVATE VS. PUBLIC REAL ESTATE RETURNS AS OF 12/31/2016 Stages of Fundamental Recovery in the Real Estate Market Cycle SOURCE:AON HEWITT 12/30/2016 YE 2015 YE % 35% Private (NFI-ODCE Gross)* Public (NAREIT Gross) YE 2013 YE 2014 Construction Reignites 25% YE % 5% 2.07% 8.72% 8.52% 12.05% 13.38% 12.20% 12.01% 5.81% 5.08% YE 2011 Declining Vacancy Growth in Rental Rates -5% -2.89% Net Absorption Turns Positive -15% Fourth Quarter 1-Year 3-Years 5-Years 10-Years 2016 *Fourth quarter returns are preliminary Sources: NCREIF, NAREIT U.S. Core real estate returned 8.72%* for the calendar year, which is roughly inline with the sector s long run average. The income return (+4.48%)* for the year outpaced appreciation (+4.09%)* illustrating our expectation that net income growth will be a larger driver of returns at this mature point in the real estate cycle. The U.S. REIT sector posted similar gains for the year, up 8.5% (FTSE NAREIT Equity REIT Index), but it was a bumpy road with elevated volatility quarter to quarter. U.S. REITs ended the year trading at an approximate 1.5% premium to NAVs, although excluding the health care and net lease sectors, the REIT sector ended the year at an approximate 4.0% discount to private market valuations. As we enter 2017, the U.S. real estate cycle is mature and thus more susceptible to bumps along the road. While solid income returns are forecasted to continue to support attractive relative returns against many other asset classes, portfolio construction consideration is essential. At this point in the cycle, appropriate risk mitigation measures should be a staple in all investment portfolios as new investments will likely be required to ride out a cyclical downturn. *Indicates preliminary NFI-ODCE data gross of fees Demand Drivers Rebound YE 2010 University of Illinois 33
34 (This page left blank intentionally) University of Illinois 34
35 Explanatory Notes University of Illinois 35
36 Explanatory Notes Note: Market values are used in this report to calculate performance for the Endowment and Operating pools. Market values reflect trade date accounting provided by the custodial bank Northern Trust. Peer Universe Comparison Floating Bar Chart: In this chart, the universe returns are shown in percentiles, with the lowest percentile/rank representing the best performance in that time period. The shaded blocks shown for each time period represent the range of returns in the peer universe from the 95 th percentile to the 5 th percentile. Returns below the red boxes fall in the worst 5 percent for that period, and returns above the light-blue boxes fall in the top 5 percent. The Investment Metrics/BNY Mellon Universe includes reported performance from 417 Endowment and Foundations. The average market value within the Endowment and Foundations universe was $849.8 million as of quarter-end. University of Illinois 36
State Board of Administration of Florida
 State Board of Administration of Florida Major Mandate Review Fourth Quarter 206 Investment advice and consulting services provided by Aon Hewitt Investment Consulting, Inc., an Aon Company. Table of Contents.
This document is made available electronically by the Minnesota Legislative Reference Library as part of an ongoing digital archiving project.
 This document is made available electronically by the Minnesota Legislative Reference Library as part of an ongoing digital archiving project. http://www.leg.state.mn.us/lrl/lrl.asp This page intentionally
State Board of Administration of Florida. Major Mandate Review First Quarter 2013
 State Board of Administration of Florida Major Mandate Review First Quarter 2013 (This page left blank intentionally) 2 Table of Contents 1. Executive Summary 2. Pension Plan Review 3. Investment Plan
Economic and Capital Market Update April 2018
 Economic and Capital Market Update April 2018 Apr-70 Apr-74 Apr-78 Apr-82 Apr-86 Apr-90 Apr-94 Apr-98 Apr-02 Apr-06 Apr-10 Apr-14 Apr-18 April 30, 2018 Economic Perspective The strong pace of the global
Presentation Materials
 Fairfax County Public Schools Second Quarter 2017 Presentation Materials Visit the Aon Hewitt Retirement and Investment Blog (http://retirementandinvestmentblog.aon.com); sharing our best thinking. Contact
Presentation Materials
 Fairfax County Public Schools Third Quarter 2017 Presentation Materials Visit the Aon Hewitt Retirement and Investment Blog (http://retirementandinvestmentblog.aon.com); sharing our best thinking. Contact
Summit Strategies Group 8182 Maryland Avenue, 6th Floor St. Louis, Missouri Monthly Economic & Capital Market Update
 Summit Strategies Group 8182 Maryland Avenue, 6th Floor St. Louis, Missouri 63105 314.727.7211 Monthly Economic & Capital Market Update November 2015 Yield to Maturity Monthly Change Nov-63 Nov-67 Nov-71
MAY 2018 Capital Markets Update
 MAY 2018 Market commentary U.S. ECONOMICS The U.S. added 223,000 jobs to payrolls in May, well above the consensus estimate of 180,000 and the expansion average of around 200,000. Sector job gains were
Economic and Capital Market Update November 2017
 Economic and Capital Market Update November 2017 Oct-69 Oct-73 Oct-77 Oct-81 Oct-85 Oct-89 Oct-93 Oct-97 Oct-01 Oct-05 Oct-09 Oct-13 Oct-17 November 30, 2017 Economic Perspective Economy Global economic
DECEMBER 2018 Capital Markets Update
 DECEMBER 2018 Market commentary U.S. ECONOMICS Nonfarm payrolls jumped by 312,000 in December, well above expectations for a 176,000 increase. The healthcare sector (+50,000) led job creation, while restaurants
City of Fort Walton Beach, Florida Beal Memorial Cemetery Perpetual Care Fund
 City of Fort Walton Beach, Florida Beal Memorial Cemetery Perpetual Care Fund Investment Performance Review Investment Advisors Steven Alexander, CTP, CGFO, CPPT, Managing Director Khalid Yasin, CIMA,
SEPTEMBER 2018 Capital Markets Update
 SEPTEMBER 2018 Market commentary U.S. ECONOMICS Non-farm payrolls added 134,000 jobs in September, missing the consensus estimate of 185,000. However, net revisions to the two months prior totaled +87,000
Summit Strategies Group 8182 Maryland Avenue, 6th Floor St. Louis, Missouri Monthly Economic & Capital Market Update
 Summit Strategies Group 8182 Maryland Avenue, 6th Floor St. Louis, Missouri 63105 314.727.7211 Monthly Economic & Capital Market Update July 2015 Yield to Maturity Monthly Change Jul-63 Jul-67 Jul-71 Jul-75
Economic and Financial Markets Monthly Review & Outlook Detailed Report October 2017
 Economic and Financial Markets Monthly Review & Outlook Detailed Report October 17 NOT FDIC INSURED NO BANK GUARANTEE MAY LOSE VALUE Overview of the Economy Business and economic confidence indicators
Marquette Associates Market Environment
 M Marquette Associates Market Environment April 2010 U.S. Economy Fixed Income Markets U.S. Equity Markets International Equity Markets Hedge Fund Markets Real Estate Markets Private Equity and Hedge Fund
Capital Markets Review 4th Quarter 2016 December 31, 2016
 Return (%) Capital Markets Review 4th Quarter 2016 December 31, 2016 Overview The fourth quarter of 2016 was positive for US equities, but generally negative for international developed and emerging market
Private Equity Overview
 Private Equity Overview June 10, 2010 State Universities Retirement System Rob Parkinson, Associate Agenda Asset Class Overview Market Update SURS Private Equity Portfolio Asset Class Overview Benefits
OCTOBER 2018 Capital Markets Update
 OCTOBER 2018 Market commentary U.S. ECONOMICS U.S. real GDP grew at an annualized quarterly rate of 3.5% (3. YoY) in Q3, beating expectations of 3.4%. The economy was supported by the strongest consumer
Asset Strategy Consultants. MARKET ENVIRONMENT Second Quarter 2016
 MARKET ENVIRONMENT Second Quarter 2016 Market Environment: U.S. Economy The 2nd quarter was reasonably uneventful and markets were relatively placid until June 23rd, when British voters narrowly approved
Global Market Overview
 First Quarter 219 First Quarter 219: March Madness, or Just an Incredible Rebound? Global Market Overview MSCI All Country World S&P Russell 2 MSCI EAFE MSCI Emerging Markets MSCI ACWI ex USA Small BBgBarc
Retirement System Pension Plan Investment Performance Review Quarter Ended June 30, 2014
 Retirement System Pension Plan Investment Performance Review Quarter Ended June 30, 2014 Investment Advisors John Spagnola, Managing Director Joseph Federico, Analyst PFM Asset Management LLC Two Logan
Capital Market Review
 Capital Market Review September 3, 215 Percent Percent MARKET/ECONOMIC OVERVIEW Risk Reprices Rapidly 2,2 1,9 1,6 1,3 S&P 5 April 29, 211 to Oct 3, 211 157 Days -19.4% May 21, 215 to Sep 3, 215 132 Days
The curious task of economics is to demonstrate to men how little they really know about what they imagine they can design."
 The curious task of economics is to demonstrate to men how little they really know about what they imagine they can design." -Friedrich August von Hayek 3 Months YTD 1 Year 3 Years 5 Years 10 Years S&P
Summit Strategies Group 8182 Maryland Avenue, 6th Floor St. Louis, Missouri Economic & Capital Market Review
 Summit Strategies Group 8182 Maryland Avenue, 6th Floor St. Louis, Missouri 63105 314.727.7211 Economic & ital Market Review TABLE OF CONTENTS Page Key Highlights 1 Economic Perspective 2 Assets 5 Income
NOVEMBER 2018 Capital Markets Update
 NOVEMBER 2018 Market commentary U.S. ECONOMICS Non-farm payrolls added 155,000 jobs in November, missing expectations of 198,000, and the unemployment rate held steady at 3.7%. The labor force participation
Capital Markets Outlook 100 LOWDER BROOK DRIVE SUITE 1100 WESTWOOD MA FAX
 M E K E T A I N V E S T M E N T G R O U P 00 LOWDER BROOK DRIVE SUITE 00 WESTWOOD MA 02090 78 47 3500 FAX 78 47 34 Investors are faced with three primary issues in the near-term: ) historically low bond
Monthly Risk-Return Report As of February 28, 2017
 Monthly Risk-Return Report As of February 28, 2017 Asset Allocation......Page 1 Returns........Page 2 Risk............Page 3 Portfolio Changes......Page 4 Benchmarks..... Page 5 Based on actual BNY Mellon
Economic and Financial Markets Monthly Review & Outlook Detailed Report January 2018
 Economic and Financial Markets Monthly Review & Outlook Detailed Report January 1 NOT FDIC INSURED NO BANK GUARANTEE MAY LOSE VALUE Overview of the Economy Business and economic confidence continue to
University of Washington
 University of Washington Investment Performance Report to UWINCO Fourth Quarter Fiscal Year 200 As of June 30, 200 Treasurer Board of Regents Treasury Office Published August 200 Table of Contents Treasury
Market Overview As of 4/30/2018
 Asset Class Leadership Periodic Table Worst Best 5.24-26.16-28.92-36.85-37.00-37.34-38.44-38.54-45.53 78.51 58.21 41.45 37.21 34.47 27.45 26.46 20.58 19.69 29.09 27.58 24.50 18.88 16.71 15.51 15.12 15.06
Market Overview As of 11/30/2018
 Asset Class Leadership Periodic Table Worst Best 5.24-26.16-28.92-36.85-37.00-37.34-38.44-38.54-45.53 78.51 58.21 41.45 37.21 34.47 27.45 26.46 20.58 19.69 29.09 27.58 24.50 18.88 16.71 15.51 15.12 15.06
1000G 1000G HY
 Asset Class Leadership Periodic Table Worst Best 5.24-26.16-28.92-36.85-37.00-37.34-38.44-38.54-45.53 78.51 58.21 41.45 37.21 34.47 27.45 26.46 20.58 19.69 29.09 27.58 24.50 18.88 16.71 15.51 15.12 15.06
Monthly Risk-Return Report As of May 31, 2016
 Monthly Risk-Return Report As of May 31, 2016 Asset Allocation......Page 1 Returns........Page 2 Risk............Page 3 Portfolio Changes......Page 4 Benchmarks..... Page 5 Based on actual BNY Mellon data
City of Fort Walton Beach Beal Memorial Cemetery Perpetual Care Fund
 City of Fort Walton Beach Beal Memorial Cemetery Perpetual Care Fund Investment Performance Review Quarter Ended June 30, 2016 Investment Advisors Steven Alexander, CTP, CGFO, CPPT, Managing Director Khalid
Market Overview As of 1/31/2019
 Asset Class Leadership Periodic Table Worst Best 78.51 58.21 41.45 37.21 34.47 27.45 26.46 20.58 19.69 29.09 27.58 2 18.88 16.71 15.51 15.12 15.06 11.15 7.84 7.28 4.98 2.64 2.11 0.39-2.91-5.50-13.71 20.14
Market Overview As of 8/31/2017
 Asset Class Leadership Periodic Table Worst Best 39.42 16.65 11.81 7.05 6.97 5.49 1.87-0.17-9.78 5.24-26.16-28.92-36.85-37.00-37.34-38.44-38.54-45.53 78.51 58.21 41.45 37.21 34.47 27.45 26.46 20.58 19.69
Market Overview As of 10/31/2017
 Asset Class Leadership Periodic Table Worst Best 39.42 16.65 11.81 7.05 6.97 5.49 1.87-0.17-9.78 5.24-26.16-28.92-36.85-37.00-37.34-38.44-38.54-45.53 78.51 58.21 41.45 37.21 34.47 27.45 26.46 20.58 19.69
Performance Review May 17, 2018
 Performance Review May 17, 2018 Cost-Efficiencies Initiative Update Goal: Obtain $100 million of incremental cost-efficiencies for the NCRS investment program, consistent with fiduciary requirements and
Asset Strategy Consultants. MARKET ENVIRONMENT First Quarter 2017
 MARKET ENVIRONMENT First Quarter 2017 Market Environment: Economy Economies in the U.S. and Europe continued to gain traction. Expectations for lower taxes, reduced regulation, and other pro-growth reforms
Monthly Market Snapshot
 ly Market Snapshot DECEMBER 2016 The ly Market Snapshot publication provides commentary on the global economy and the performance of financial markets Key insights Equity markets increased 1.8, rallying
MARCH 2018 Capital Markets Update
 MARCH 2018 Market commentary ECONOMIC CLIMATE Hiring slowed from its fast pace last month the U.S. added 103,000 jobs to nonfarm payrolls in March, below the consensus estimate of 185,000. The U-3 unemployment
Summit Strategies Group 8182 Maryland Avenue, 6th Floor St. Louis, Missouri Economic & Capital Market Review
 Summit Strategies Group 8182 Maryland Avenue, 6th Floor St. Louis, Missouri 63105 314.727.7211 Economic & ital Market Review TABLE OF CONTENTS Page Key Highlights 1 Economic Perspective 2 Assets 5 Income
Quarterly Investment Review
 Fairfax County Public Schools Second Quarter 206 Quarterly Investment Review Visit the Aon Hewitt Retirement and Investment Blog (http://retirementandinvestmentblog.aon.com); sharing our best thinking.
Texas Tech University System
 Texas Tech University System Capital Markets Overview October 2016 Timothy Bruce, Partner Index Performance Summary as of July 29 2016 2009 2010 2011 2012 2013 2014 2015 Q1 Q2 July YTD Barclays US STRIPS
Monthly Market Snapshot
 ly Market Snapshot SEPTEMBER 2016 The ly Market Snapshot publication provides commentary on the global economy and the performance of financial markets Key insights Equities markets in general, traded
Vantage Investment Partners. Quarterly Market Review
 Vantage Investment Partners Quarterly Market Review First Quarter 2016 Quarterly Market Review First Quarter 2016 This report features world capital market performance and a timeline of events for the
Quarterly Market Review
 Quarterly Market Review THEMES FOR THE QUARTER Emerging Markets the Standout in Mixed Q1 Global Equity Returns Developed Markets Positive; Australia and NZ Negative Value Premium Positive in Emerging Markets;
ACG Market Review. Second Quarter Global Highlights: Economy Announced tariffs have so far failed to slow down economic activity
 ACG Market Review Second Quarter 2018 Global Highlights: Economy Announced tariffs have so far failed to slow down economic activity Equities U.S. equites turn positive for the year backed by strong corporate
MARKET REPORT THE MONTHLY A SNAPSHOT OF THE KEY POINTS FOR AUGUST. Bonds continue to Rally. ISSUE 8 August 2014
 ISSUE 8 August 2014 THE MONTHLY MARKET REPORT A SNAPSHOT OF THE KEY POINTS FOR AUGUST The RBA held the overnight cash rate steady at 2.50% for the 12th consecutive Month in August. Short term fixed income
Capital Markets Review 2nd Quarter 2018 June 30, 2018
 Return (%) Capital Markets Review 2nd Quarter 2018 June 30, 2018 Overview The US dollar strengthened significantly relative to a trade weighted basket of currencies during the second quarter of 2018, reversing
Quarterly Market Review. Third Quarter 2017
 Q3 Quarterly Market Review Third Quarter 2017 Market Summary Index Returns US Stock Market International Developed Stocks Emerging Markets Stocks Global Real Estate US Bond Market Global Bond Market ex
Asset Strategy Consultants. MARKET ENVIRONMENT Third Quarter 2016
 MARKET ENVIRONMENT Third Quarter 2016 Market Environment: Economy Investor angst over the unexpected vote on Brexit was short lived with a "risk on" theme returning to the markets in July and leading to
F U N D E V A L U A T I O N R E P O R T
 F U N D E V A L U A T I O N R E P O R T Santa Barbara Foundation Performance Update M E K E T A I N V E S T M E N T G R O U P BOSTON MASSACHUSETTS CHICAGO ILLINOIS MIAMI FLORIDA PORTLAND OREGON SAN DIEGO
Retirement Funds. SEMIANNual REPORT
 SEMIANNual REPORT November 30, 2017 T. Rowe Price Retirement Funds The funds invest in a diversified portfolio of T. Rowe Price mutual funds, offering a professionally managed, age-appropriate mix of stocks
Eric C. Elbell, CFA, CAIA Area Senior Vice President. Kyongdo Min, CPA, CFA Area Vice President. April 11, 2018
 Eric C. Elbell, CFA, CAIA Area Senior Vice President Kyongdo Min, CPA, CFA Area Vice President April 11, 2018 Agenda We will address three key topics: Headline events that impacted markets during the quarter
Monthly Market Snapshot
 ly Market Snapshot NOVEMBER 2016 The ly Market Snapshot publication provides commentary on the global economy and the performance of financial markets Key insights Equity markets recovered in November
TMRS Quarterly Summary. Period Ended: December 31, 2015
 TMRS Quarterly Summary Period Ended: December 31, 2015 Capital Markets Review Fourth Quarter Economic Environment Key Economic Indicators World equity markets rallied in October following a period of heightened
Fresno County Employees' Retirement Association
 Fresno County Employees' Retirement Association Investment Performance Review Period Ending: December 31, 2006 999 Third Avenue, Suite 3650 2321 Rosecrans Avenue, Suite 2250 Seattle, Washington 98104 El
85.3% 0.3% 3.3% 6.5% 0.5% 3.4% U.S. PENSION FUNDING UPDATE. U.S. corporate pension funding decreased by 0.3% in December 2017
 U.S. PENSION FUNDING UPDATE BlackRock U.S. Client Solutions U.S. corporate pension funding decreased by. in December 217 December 217 BlackRock estimates the average funded status of the largest 1 U.S.
Endowment Funds Performance (Year ending June 30 th, 2014)
") Endowment Funds Performance (Year ending June 30 th, 2014) prepared for Investment Subcommittee (Note: all returns and values are expressed in Canadian Dollars- CAD s) 1 Quarterly Market Overview Equity
Endowment Funds Performance (Year ending June 30 th, 2014) prepared for Investment Subcommittee (Note: all returns and values are expressed in Canadian Dollars- CAD s) 1 Quarterly Market Overview Equity
Parasol Long-Term Investment Horizon 3.2% 17.0% 17.0% 6.7% 8.6% 8.0% 5.9% Long-Term Composite Index (Policy) 4.0% 15.6% 15.6% 7.0% 8.8% 7.6% 5.
 4.0% 15.6% 15.6% 7.0% 8.8% 7.6% 5.") Long Term Investment Horizon As of December 31, 17 Annualized Performance (Net of Fees) 3 Mo YTD 1 Year 3 Years 5 Years 7 Years 1 Years Parasol Long-Term Investment Horizon 3.% 17.% 17.%.7%.%.% 5.9% Long-Term
Long Term Investment Horizon As of December 31, 17 Annualized Performance (Net of Fees) 3 Mo YTD 1 Year 3 Years 5 Years 7 Years 1 Years Parasol Long-Term Investment Horizon 3.% 17.% 17.%.7%.%.% 5.9% Long-Term
Brexit and Market Implications Special Commentary & Webinar
 Brexit and Market Implications Special Commentary & Webinar June 27, 2016 SR# 904360 Today s Speakers Envestnet PMC Zachary Karabell Head of Global Strategy, Envestnet As Head of Global Strategy, Mr. Karabell
Market Commentary - 2nd Quarter 2017
 3 Months YTD 1 Year 3 Years 5 Years 1 Years As the economy picks up we will need to be gradual when adjusting our policy parameters, so as to ensure that our stimulus accompanies the recovery amid the
Target Funds. SEMIANNual REPORT
 SEMIANNual REPORT November 30, 2017 T. Rowe Price Target Funds The funds invest in a diversified portfolio of T. Rowe Price mutual funds, offering a professionally managed, age-appropriate mix of stocks
University of Puerto Rico Retirement System
 December 31, 2016 University of Puerto Rico Retirement System Investment Measurement Service Quarterly Review The following report was prepared by Callan Associates Inc. ("CAI") using information from
Portfolio Strategist Update from The Dreyfus Corporation
 Portfolio Strategist Update from The Dreyfus Corporation Active Opportunity ETF Portfolios As of Dec. 31, 2017 Ameriprise Financial Services, Inc. (Ameriprise Financial) is the investment manager for Active
Emerging Markets Stocks Q STOCKS BONDS
 Q4 US Stock Market International Developed Stocks Emerging Markets Stocks Global Real Estate US Bond Market Global Bond Market ex US Q4 2017 STOCKS BONDS 6.34% 4.23% 7.44% 2.97% 0.39% 1.10% Since Jan.
Quarterly Market Review. First Quarter 2015
 Q1 Quarterly Market Review First Quarter 2015 Quarterly Market Review First Quarter 2015 This report features world capital market performance and a timeline of events for the past quarter. It begins with
City of Hollywood Employees' Retirement Fund Preliminary Market Value Update as of August 31, 2017
 Market Value Percent of Total Plan New Target Allocation Difference Range Domestic Equity - Large Cap $69,743,672 22.3% 20.0% 2.3% 15-30% Northern Trust $69,743,672 22.3% Domestic Equity - SMID Cap $40,440,453
Quarterly Market Review Market Slides. Fourth Quarter 2015
 Q4 Quarterly Market Review Market Slides Fourth Quarter 2015 US Stocks In a turnaround from the previous quarter, the US equity market recorded positive performance. Small caps underperformed large caps,
NVIT Investor Destinations Funds
 NVIT Investor Destinations Funds Nationwide VIT Quarterly Asset class: Allocation Share class Class II Strategy Overview The NVIT Investor Destinations Funds (NVIT ID Funds) consist of seven risk-based
Returns among non-us equity markets were even higher. The MSCI World ex USA Index, which reflects non-us
 2017 Market Review At the beginning of 2017, a common view among money managers and analysts was that the financial markets would not repeat their strong returns from 2016. Many cited the uncertain global
Q MARKETS REVIEW
 Stock markets around the world continued their ascent during the quarter as investors took solace in continuing corporate earnings growth, fueled by strong global economic growth, and U.S. tax cuts. Overview
INVESTMENT REVIEW AMBER CARDEN PRIVATE CLIENT ADVISOR CHARLES D SHEPHERD, CFA PORTFOLIO MANAGER
 INVESTMENT REVIEW PRESENTED TO: AUSTIN COMMUNITY FOUNDATION RELATIONSHIP AMBER CARDEN PRIVATE CLIENT ADVISOR 512.397.2717 DAVE ZEITZ PRIVATE CLIENT MANAGER 512.397.2820 CHARLES D SHEPHERD, CFA PORTFOLIO
FIXED INCOME STRATEGIES FOR LATE 2017 NAVIGATING UNCHARTERED TERRITORY, RISING RATES, AND YOUR FIXED INCOME PORTFOLIO
 FIXED INCOME STRATEGIES FOR LATE 2017 NAVIGATING UNCHARTERED TERRITORY, RISING RATES, AND YOUR FIXED INCOME PORTFOLIO 1 The information contained herein reflects the views of Galliard Capital Management,
Short exposure to US equities, used as a risk hedge. Exposure to commodities
 Portfolio performance The Fund is designed to serve as a Third Pillar strategy, aiming to provide a diversified return stream versus traditional stock/bond-centric approaches. In seeking a long-term real
Federal Money Market Fund (VMFXX)
") Federal Money Market Fund (VMFXX) Overview Investment approach Invests primarily in U.S. government agency obligations. Seeks current income. Seeks to maintain a constant $1 net asset value (NAV). Maintains
Federal Money Market Fund (VMFXX) Overview Investment approach Invests primarily in U.S. government agency obligations. Seeks current income. Seeks to maintain a constant $1 net asset value (NAV). Maintains
Quarterly market summary
 Quarterly market summary 4th Quarter 2016 Economic overview Economies around the world appear to be relatively resilient, with data signalling that in many countries, economic activities are expanding
Capital Markets: Observations and Insights Earnings Resurgence Spring 2017
 Capital Markets: Observations and Insights Earnings Resurgence Spring 2017 Key Observations After diverging in 2016, fundamentals once again drove performance in 1Q17 There is a resurgence in earnings
Fidelity Freedom 2020 Fund
 QUARTERLY FUND REVIEW AS OF SEPTEMBER 30, 2017 Fidelity Freedom 2020 Fund Investment Approach Fidelity Freedom Funds (the Funds) are designed so that the target date referenced in the Fund name is the
Monthly Market Snapshot
 ly Market Snapshot JANUARY 2017 The ly Market Snapshot publication provides commentary on the global economy and the performance of financial markets Key insights The New Year continued with political
Monthly Market Snapshot
 ly Market Snapshot OCTOBER 2016 The ly Market Snapshot publication provides commentary on the global economy and the performance of financial markets Key insights Domestic and international equities (unhedged)
January Market Review Groundhog Day
 Larry Adam, CFA, CIMA CIO Americas & Chief Investment Strategist January Market Review Groundhog Day January 2016 Highlights of the Month: U.S. 4Q15 GDP Slows to Lowest YoY Growth Since 1Q14; ISM Manufacturing
Market Update: Broad Market Returns and Indicators
 Market Update Eckler Ltd. collects information directly from sources believed to be reliable. Eckler Ltd. does not guarantee or warrant the accuracy, timeliness, or completeness of the information either
The Myth of Diversification: Risk Factors vs. Asset Classes
 The Myth of Diversification: Risk Factors vs. Asset Classes Sébastien Page, CFA Executive Vice President April 2011 PIMCO Canada will retain PIMCO LLC as a subadvisor. PIMCO Canada Corp., 120 Adelaide
Economic and Financial Markets Monthly Review & Outlook Detailed Report. June 2014
 Economic and Financial Markets Monthly Review & Outlook Detailed Report June 1 Overview of the Economy In the U.S., the Federal Reserve s Beige Book report on the economy through late May indicated that
SUNRISE POLICE PENSION FUND PERFORMANCE REVIEW JUNE 2003
 PENSION FUND PERFORMANCE REVIEW JUNE 23 Associates, Inc. 199, 2 INVESTMENT RETURN On June 3th, the Sunrise Police Pension Fund s assets were valued at $36,325,34, which was an increase of $2,641,772 from
University of South Carolina Development Foundation
 COMPOSITE PERFORMANCE REVIEW Report for Periods Ending March 31, 2018 University of South Carolina Development Foundation Presented by: Scott B. Harsh President & CEO Stephen M. Hodson, CFA, CAIA Senior
Zenith Monthly Market Report Zenith Monthly Market Report (31 May 2011) `
 `") Zenith Monthly Market Report (31 May 2011) ` Market Indicators Market Indicator End of Month Previous Month 1 Month Change 12 Months Ago 12 Month Change Interest Rates Overnight Cash 4.75 4.75 0.00% 4.50
Zenith Monthly Market Report (31 May 2011) ` Market Indicators Market Indicator End of Month Previous Month 1 Month Change 12 Months Ago 12 Month Change Interest Rates Overnight Cash 4.75 4.75 0.00% 4.50
State Universities Retirement System of Illinois (SURS) Investment Update
 Investment Update") State Universities Retirement System of Illinois (SURS) Investment Update December 2017 Volume 28, Issue 6 c\ Investment Update March 12, 2018 Volume 28, Issue 6 www.surs.org December Quarter Fiscal 1
State Universities Retirement System of Illinois (SURS) Investment Update December 2017 Volume 28, Issue 6 c\ Investment Update March 12, 2018 Volume 28, Issue 6 www.surs.org December Quarter Fiscal 1
Target Retirement Performance Update
 Target Retirement Update Q1 2017 CIT Strategy Highlights As of March 31, 2017 The State Street Target Retirement Collective Trust Strategies posted quarterly returns ranging from +2.44% (Income Strategy)
US Economic Outlook Improving
 Government Bonds Have Never Looked Less Attractive OUTLOOK Executive Summary Kenneth J. Taubes Chief Investment Officer, US Economic Outlook US GDP growth may lead growth among developed nations, at approximately
Income Solutions Beyond Investment Grade Bonds
 October 2017 Income Solutions Beyond Investment Grade Bonds Multiple Fixed Income Approaches Direction of interest rates Reduce Duration Limit Duration to Near Zero with: Floating rate notes (FRNs) for
INVESTMENTS. The CalSTRS Investment Portfolio generated 13.4 percent return net of fees on its investments for the fiscal year ending June 30, 2017.
 The CalSTRS Investment Portfolio generated 13.4 percent return net of fees on its investments for the fiscal year ending June 30, 2017. Investments 105 Investment Consultants' Reports 107 Asset Allocation
Summit Strategies Group
 April 0, 205 US Equity: All Cap Russell 000 Index 0.45 5.9 2.26 2.74 6.86 4. 8.68 8.66 Dow Jones US Total Stock Market Index 0.46 5.9 2.27 2.67 6.78 4.7 8.78 8.8 US Equity: Large Cap Russell 000 Index
Week in Markets. FTSE Equity Indices Week MTD Jul 12 Jun 12 QTD YTD. MSCI Equity Indices Week MTD Jul 12 Jun 12 QTD YTD
 Week ending 24 August, 20 Page 1 of 8 FTSE Equity Indices Week MTD Jul Jun QTD YTD UK FTSE All Share -1.3 3.2 1.3 4.8 4.6 8.0 15.5 FTSE -1.3 3.2 1.2 5.0 4.5 6.8 15.3 FTSE 250-1.4 3.0 2.1 3.8 5.2 15.6 17.5
January market performance. Equity Markets Price Indices Index
 Global Central Banks continue to lower interest rates. The RBA cuts the cash rate by 25bp to 2.25% (February 2015). The ECB finally announces Quantitative Easing 60b per month. Oil prices declined again
First Quarter 2017 Investment Review. Prepared by: Meketa Investment Group CHICAGO, IL (312)
") First Quarter 2017 Investment Review Prepared by: Meketa Investment Group CHICAGO, IL 60661 (312) 474-0900 MARKET SUMMARY - 1Q17 CAPITAL MARKETS Index MARKET SNAPSHOT MARCH 31, 2017 Qtr One Year Three
First Quarter 2017 Investment Review Prepared by: Meketa Investment Group CHICAGO, IL 60661 (312) 474-0900 MARKET SUMMARY - 1Q17 CAPITAL MARKETS Index MARKET SNAPSHOT MARCH 31, 2017 Qtr One Year Three
City of Los Angeles. Performance Evaluation Report. Deferred Compensation Plan. Second Quarter 2015
 City of Los Angeles Deferred Compensation Plan Performance Evaluation Report Second Quarter 2015 Services provided by Mercer Investment Consulting, Inc. Contents Market Environment... 1 Summary... 14 Fund
J.P. Morgan Income Funds
 Annual Report J.P. Morgan Income Funds February 28, 2017 JPMorgan Core Bond Fund JPMorgan Core Plus Bond Fund JPMorgan Government Bond Fund JPMorgan High Yield Fund JPMorgan Inflation Managed Bond Fund