BUSINESS CYCLES, MARKET CYCLES, AND STOCK SECTORS
|
|
|
- Allison Nicholson
- 5 years ago
- Views:
Transcription
1 WELCOME!
2 BUSINESS CYCLES, MARKET CYCLES, AND STOCK SECTORS George Dagnino, PhD The Peter Dag Portfolio peterdag.blogspot.com
3 OUTLINE BUSINESS CYCLE OUTLOOK SECTORS FOR A STRONG AND WEAK ECONOMY STOCK SELECTION TIMING DECISIONS ETFs AND MUTUAL FUNDS RISK AND PORTFOLIO MGT
4 Peter Dag s PERFORMANCE PICKS ( 02-06) 06) +82.7% +23.5% (S&P 500) (S&P dividends excluded, Source: Hulbert) Mutual funds % (S&P 500: 3.53%) ETF % TOP TEN TIMER (Timer Digest)
5 BUSINESS CYCLE
6 YIELD CURVE: BULLISH
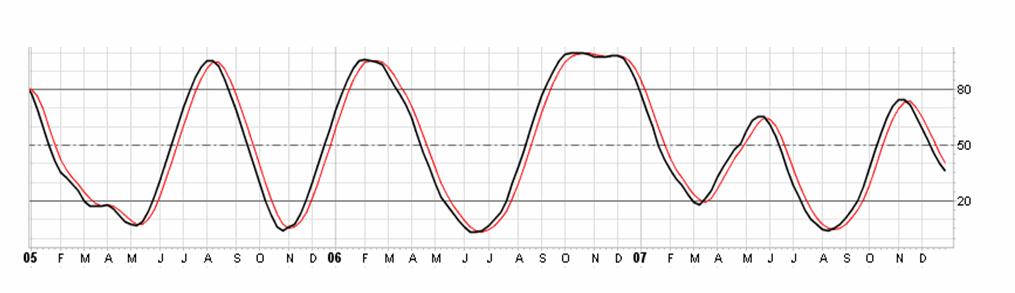
7 INFLATION, COMMODITIES, AND SHORT-TERM INTEREST RATES INFLATION, COMMODITIES, AND SHORT-TERM TERM INTEREST RATES HAVE THE SAME TURNING POINTS THEY FOLLOW THE TURNING POINTS OF THE ECONOMY
8 INFLATION: UP
9 ALL COMMODITIES HAVE THE SAME CYCLICAL TURNING POINTS
10 COMMODITIES & THE FED HAVE THE SAME CYCLICAL TURNING POINTS
11 THE POINT A STRONG ECONOMY IS FOLLOWED BY RISING INFLATION, RISING COMMODITIES, RISING INTEREST RATES. A WEAKENING ECONOMY IS FOLLOWED BY LOWER INFLATION, LOWER COMMODITIES, LOWER INTEREST RATES
12 THE FED AND FINANCIAL BUBBLES AGGRESSIVE EASING IN 1998 WAS FOLLOWED BY THE TECH BUBBLE AGGRESSIVE EASING IN WAS FOLLLOWED BY THE HOUSING/COMMODITY BUBBLES AND SUBPRIME DEBACLE
13 MAN-MADE (FED) COMMODITY BUBBLES
14 DOLLAR, COMMODITIES, GOLD, AND PURCHASING POWER
15 OUTLINE BUSINESS CYCLE OUTLOOK SECTORS FOR A STRONG AND WEAK ECONOMY STOCK SELECTION TIMING DECISIONS ETFs AND MUTUAL FUNDS RISK AND PORTFOLIO MGT
16 STOCK MARKET, SECTORS AND BUSINESS CYCLE
17 THE STOCK MARKET: CAN IT GROW FASTER?
18 FINANCIAL RISK AND STOCK PRICES
19 OUTLINE BUSINESS CYCLE OUTLOOK SECTORS FOR A STRONG AND WEAK ECONOMY STOCK SELECTION TIMING DECISIONS ETFs AND MUTUAL FUNDS RISK AND PORTFOLIO MGT
20 SECTORS FOR A STRONG ECONOMY AND BEATING THE S&P 500 METALS AND MINING ENERGY ELECTRONICS INTERNET COMPUTER SOFTWARE & SERVICES CONGLOMERATES TELECOM
21 SECTORS FOR A WEAK ECONOMY AND BEATING THE S&P 500 TOBACCO HEALTH SERVICES INSURANCE BANKING FINANCIAL SERVICES REAL ESTATE AEROSPACE & DEFENSE
22 GAMES THEORY AND INVESTMENT STRATEGY (ADJUST MIX STRONG/WEAK ECONOMY SECTORS AS NEW INFORMATION BECOMES AVAILABLE)
23 ECONOMIC OUTLOOK Select possible scenarios Select most likely scenario LIST STRONG SECTORS IN THE PREDICTED ECONOMIC ENVIRONMENT SELECT STOCKS WITHIN CHOSEN SECTORS. Strong fundamentals. Outperforming market. Low volatility BUY/SELL SIGNAL. Short-term interest rates... Bond yields. Technical DECREASING RISK RISING RISK INCREASE EQUITIES Add to strongest positions Reduce weakest positions Add new positions REDUCE EQUITIES Reduce weakest positions Increase cash Hedge portfolio with shorts
24 HEDGING IN A DOWN MARKET USING SDS SELL POOR PERFORMING STOCKS USE CASH TO HEDGE PROFITS AND REDUCE VOLATILITY WHY? FOR EVERY $ OF SDS YOU HEDGE $2 DOLLARS OF LONG POSITIONS ONLY STRONG STOCKS ARE NOW EXPOSED TO MARKET DECLINES
25 OUTLINE BUSINESS CYCLE OUTLOOK SECTORS FOR A STRONG AND WEAK ECONOMY STOCK SELECTION TIMING DECISIONS ETFs AND MUTUAL FUNDS RISK AND PORTFOLIO MGT
26 STOCK SELECTION USE FAN CHARTS TO CHECK PERFORMANCE OF STOCKS CHOSE STOCKS WITH LOWEST VOLATILITY AND BEST PERFORMANCE PERFORM FINANCIAL ANALYSIS (

27 EXAMPLE OF FAN CHART: WIRELESS COMMUNICATION
28 OUTLINE BUSINESS CYCLE OUTLOOK SECTORS FOR A STRONG AND WEAK ECONOMY STOCK SELECTION TIMING DECISIONS ETFs AND MUTUAL FUNDS RISK AND PORTFOLIO MGT
29 MEASURING RISK AND MARKET TIMING BOND YIELDS-SHORT SHORT-TERM TERM INTEREST RATES TRADING VOLUME OVERBOUGHT/OVERSOLD INDICATORS MARKET SEASONALITY AND THE MONTH CYCLE PROPRIETARY INDICATORS
30 LOWER YIELDS ARE BULLISH
31 VOLUME PATTERNS BEARISH: STRONG VOLUME FOLLOWING A STRONG RISE BULLISH: STRONG VOLUME FOLLOWING A SHARP DECLINE
32 OVERBOUGHT/OVERSOLD: INVESTORS SENTIMENT

33 THE TREND IS DOWN
34 SEASONALITYAND 8-MONTH CYCLE
35 OUTLINE BUSINESS CYCLE OUTLOOK SECTORS FOR A STRONG AND WEAK ECONOMY STOCK SELECTION TIMING DECISIONS ETFs AND MUTUAL FUNDS RISK AND PORTFOLIO MGT

36 SELECT THE STRONGEST ETFs & MUTUAL FUNDS USING FAN CHART
37 RISK AND PORTFOLIO MANAGEMENT MAKE A FAN CHART OF STRONGEST STOCKS, ETF, OR MUTUAL FUNDS CHOOSE A PERIOD OF THREE MONTHS INVEST IN THE STRONGEST INCREASE INVESTMENT IN STRONGEST ONES REDUCE INVEESTMENT IN THE WEAKEST ONES USE SECTOR ANALYSIS TO CONFIRM CHOICE
38 SUMMARY BUSINESS CYCLE OUTLOOK SECTORS FOR A STRONG AND WEAK ECONOMY STOCK SELECTION TIMING DECISIONS ETFs AND MUTUAL FUNDS RISK AND PORTFOLIO MGT
39 DID YOU LIKE THIS PRESENTATION? I WILL BE DELIGHTED TO MAKE A SIMILAR PRESENTATION TO YOUR INVESTMENT GROUP CALL
40 THANK YOU!
STRATEGIC MONEY MANAGEMENT
 Hello! NEBC PETER DAG STRATEGIC MONEY MANAGEMENT George Dagnino, PhD The Peter Dag Portfolio Strategy and Management www.peterdag peterdag.com OUTLINE! PETER DAG PERFORMANCE! INVESTMENT PROCESS " BUSINESS
Gundlach s Forecast for 2017
 Gundlach s Forecast for 2017 January 11, 2017 by Robert Huebscher Investors will confront excessive debt, high P/E levels and political uncertainty as they enter the Trump presidential era. In response,
Monthly Investment Compass Charting The Course Of The Markets
 Monthly Investment Compass Charting The Course Of The Markets January 12 th, 2017 Monthly Investment Compass Executive Summary: January 12 th 2017 U.S. Stock Market: A number of near term metrics warn
US Financial Market Chart Book for February/March February 23, 2012
 US Financial Market Chart Book for February/March 2012 February 23, 2012 US Financial Market Chart Book Executive Summary: February 23 rd 2012 U.S. Stocks: The benchmark S&P 500 and bellwether Dow Jones
Tactical Gold Allocation Within a Multi-Asset Portfolio
 Tactical Gold Allocation Within a Multi-Asset Portfolio Charles Morris Head of Global Asset Management, HSBC Introduction Thank you, John, for that kind introduction. Ladies and gentlemen, my name is Charlie
Monthly Investment Compass Charting The Course Of The Markets
 Monthly Investment Compass Charting The Course Of The Markets April 22 nd, 2016 Monthly Investment Compass Executive Summary: April 22 nd 2016 U.S. Stock Market: The most important takeaway from the latest
Understanding of Price-Volume -Open Interest in futures market
 Understanding of Price-Volume -Open Interest in futures market Introduction Price, Volume and Open interest are the most important market determinants in futures market. Among these, price is more important.
AlphaSolutions Sector Rotation Model
 AlphaSolutions Sector Rotation Model An investment model based on trending and momentum strategies Portfolio Goals Primary: Seeks long term growth of capital by investing in highranked U.S. Equity Sectors
Investing During The Trump Administration: Opportunity & Danger
 Investing During The Trump Administration: Opportunity & Danger Prepared for the Los Angeles Chapter of the American Association of Individual Investors (AAII ) June 17 th, 2017 About Asbury Research John
Market Maps. Bob Dickey, Technical Strategist, Portfolio Advisory Group. April RBC Capital Markets, LLC / Portfolio Advisory Group
 Market Maps Bob Dickey, Technical Strategist, Portfolio Advisory Group RBC Capital Markets, LLC / Portfolio Advisory Group All values in U.S. dollars and priced as of March 29, 2018, unless otherwise noted
Chapter 8 Stock Price Behavior and Market Efficiency
 Chapter 8 Stock Price Behavior and Market Efficiency Concept Questions 1. There are three trends at all times, the primary, secondary, and tertiary trends. For a market timer, the secondary, or short-run
A Traders guide to Commodity Investing by Gnanasekar Thiagarajan, Director, Commtrendz Research 30 th March 2018.
 A Traders guide to Commodity Investing by Gnanasekar Thiagarajan, Director, Commtrendz Research 30 th March 2018. 1 Commodities Outlook Who should invest? Any investor who wants to take advantage of price
Monthly Investment Compass Charting The Course Of The Markets
 Monthly Investment Compass Charting The Course Of The Markets November 11 th, 2017 Monthly Investment Compass 1) Executive Summary: November 11 th, 2017 U.S. Stock Market: Unmet upside targets in several
Market Outlook As of March 4, 2016
 Financial & Investment Newsletter Market Outlook As of March 4, 2016 By George M. Hiller JD, LLM, MBA, CFP The 7-year old bull market, got off to a rocky start in early 2016 moving into correction territory,
US Financial Market Update for March Prepared for the Market Technicians Association
 US Financial Market Update for March 2016 Prepared for the Market Technicians Association March 16 th, 2016 About Asbury Research Research, Methodology & Clientele Our Research: Asbury Research, established
Stock Market Basics Series
 Stock Market Basics Series HOW DO I TRADE STOCKS.COM Copyright 2012 Stock Market Basics Series THE STOCHASTIC OSCILLATOR A Little Background The Stochastic Oscillator was developed by the late George Lane
Knowing When to Buy or Sell a Stock
 Knowing When to Buy or Sell a Stock Overview Review & Market direction Driving forces of market change Support & Resistance Basic Charting Review & Market Direction How many directions can a stock s price
Market Maps. Bob Dickey, Technical Strategist, Portfolio Advisory Group. January RBC Capital Markets, LLC / Portfolio Advisory Group
 Market Maps Bob Dickey, Technical Strategist, Portfolio Advisory Group RBC Capital Markets, LLC / Portfolio Advisory Group All values in U.S. dollars and priced as of December 31, 2018, unless otherwise
SIP Aggressive Portfolio
 SIP LIFESTYLE PORTFOLIOS FACT SHEET (NOV 2015) SIP Aggressive Portfolio SIP Aggressive Portfolio is a unitized fund, which is designed to provide long term capital growth. It is designed for those who
Ryan Lewenza, CFA, CMT, Private Client Strategist September 26, 2014
 Weekly Trends Ryan Lewenza, CFA, CMT, Private Client Strategist September 26, 214 Buying Opportunity? In recent publications we have underscored the potential for volatility to rise through the September/October
Market Maps. Bob Dickey, Technical Strategist, Portfolio Advisory Group. March RBC Capital Markets, LLC / Portfolio Advisory Group
 Market Maps Bob Dickey, Technical Strategist, Portfolio Advisory Group RBC Capital Markets, LLC / Portfolio Advisory Group All values in U.S. dollars and priced as of February 28, 2019, unless otherwise
February 21, Dear Investors:
 February 21, 2019 Crescat Capital LLC 1560 Broadway Denver, CO 80202 (303) 271-9997 info@crescat.net www.crescat.net Dear Investors: There is indeed a business cycle and timing it ahead of key inflection
Technical Strategy. Q1 Dollar top as the basis for a sharp correction
 2017 Chart 38. ) DXY with Advance/Decline Line (20 Key Dollar Pairs) Chart 39. ) US Dollar with Presidential Cycle Tactically, we have been bullish US dollar since the May 2016 bottom, which is the base
Active Portfolio Management
 Active Portfolio Management Disciplined, Focused, Effective Special Risk Capital Management, LLC A Registered Investment Advisor Thomas C. Hamilton, President 8 Pine Shadow Court Savannah, Georgia 31411
Chart 1: S&P 500 Death Crosses since 1923;
 December 10th, 2018 1 Last week we had a death cross in the S&P 500 and the 3 year minus 5 year Treasury yield curve went negative (inverted). These two events had talking heads claiming everything from
WallStreetCourier.com Starter Kit & Guidelines. How to maximize your results with WallStreetCourier.com. 1 v1.
 WallStreetCourier.com Starter Kit & Guidelines How to maximize your results with WallStreetCourier.com www.wallstreetcourier.com 1 v1.7 Philosophy & Services of WallStreetCourier.com 2 www.wallstreetcourier.com
Weekly Market Summary
 Weekly Market Summary April 24, 2016 by Urban Carmel of The Fat Pitch Summary: SPY made a new all-time high this week. The short and long term trend is higher. Despite a gain of 16% over the past 10 weeks,
Point & Figure Basics
 DORSEY WRIGHT Point & Figure Basics Technical Insights, Powerful Solutions Presented by Nasdaq Dorsey Wright Our Research Methodology Simple Economics Simply stated, Nasdaq Dorsey Wright focuses on the
Investor Opinions Have Become Extremely Uniform, And That's Not Good
 Investor Opinions Have Become Extremely Uniform, And That's Not Good May 23, 2015 by Urban Carmel of The Fat Pitch Summary: Investor opinions have become extremely uniform. By some measures, they are the
ARK Industrial Innovation ETF
 November 30, 2017 ARK Industrial Innovation ETF NYSE Arca, Inc: ARKQ Summary Prospectus Before you invest, you may want to review the Fund s prospectus, which contains more information about the Fund and
Market Maps. Bob Dickey, Technical Strategist, Portfolio Advisory Group. December RBC Capital Markets, LLC / Portfolio Advisory Group
 Market Maps Bob Dickey, Technical Strategist, Portfolio Advisory Group RBC Capital Markets, LLC / Portfolio Advisory Group All values in U.S. dollars and priced as of market close, December 1, 2017, unless
Factors have delivered similar risk-adjusted performance as asset classes, but may perform worse going forward
 Are Factors Better and More Diversifying Than Asset Classes? (For the most part, we don t think so) February 2018 By: Maneesh Shanbhag, CFA Executive Summary - Factor investing promises outperformance
Capital Expenditure Trends: When and Where Will Firms Start Investing Again? Peter Loveridge European Manager, World Industry Service 24 th June 2009
 Capital Expenditure Trends: When and Where Will Firms Start Investing Again? Peter Loveridge European Manager, World Industry Service th June 009 What This Means for You Outlook for growth in E.U. sectors
Weekly Commodity News Letter
 2018 Weekly Commodity News Letter The trend of Gold is Sideways with positive bias. Gold remained bearish this week due weaker demand, as world gold council has released statement Star India Market Research
Outlook for Economic Activity and Prices (April 2017) Summary
 Summary") April 27, 2017 Bank of Japan The Bank's View 1 Outlook for Economic Activity and Prices (April 2017) Summary Japan's economy is likely to continue expanding and maintain growth at a pace above its potential,
April 27, 2017 Bank of Japan The Bank's View 1 Outlook for Economic Activity and Prices (April 2017) Summary Japan's economy is likely to continue expanding and maintain growth at a pace above its potential,
Massive Uncertainty and Portfolio Management
 THE JAGGED PERCH The decline in global equity markets from their April highs was swift, brutal and ugly. The S&P 500 was down almost 20% over this period (13.8% in the 3rd quarter). Other indices fared
Monthly Investment Compass Charting The Course Of The Markets
 Monthly Investment Compass Charting The Course Of The Markets September 21st, 2017 Monthly Investment Compass 1) Executive Summary: September 21 st, 2017 U.S. Stock Market: Virtually all of our near term
Gold, Mining Stocks on the Verge of a Major Bull Market
 Gold, Mining Stocks on the Verge of a Major Bull Market By Robert McHugh, Ph.D. In looking at the charts for Gold, Silver and Mining Stocks, it is clear that patterns and wave mappings suggest a bottom
Portfolio Management Commentary
 Portfolio Management Commentary Quarter Ending September 30, 2016 First things first, let s dissect the current market environment to see where the bias exists for investors. As usual, we begin with the
Asbury Research s US Investment Analysis: A Review of Q Prepared for Interactive Brokers
 Asbury Research s US Investment Analysis: A Review of Q1 2016 Prepared for Interactive Brokers April 14 th. 2016 About Asbury Research Research, Methodology & Clientele Our Research: Asbury Research, established
Are You Smarter Than. Monkey?
 Are You Smarter Than Advanced Systems a Group Monkey? Course Syllabus 1 Questions from Last Week? How Are Our Stocks Doing? 2 Question of the Day What s the Difference Between Mid-Cap and Equal-Weight?
Asset Allocation Model March Update
 The month of February was marked by a sell-off in global equity markets and a sudden increase in market volatility with the CBOE Volatility Index reaching its highest level since August 2015. The rout
Weekly outlook for April 23, 2018
 Weekly outlook for April 23, 2018 Summary The S&P 500 index is expected to go down further if price stays below the 2700 level. A weekly doji candle formed on the intermediate-term chart, and the short-term
Figure 1: Resource subsector ETF performance
 In February the Bromma Resource Fund returned -4.8% for Class B C$ and -8.5% for Class V US$. While general equity markets were able to recover more than half of their volatility-induced peak-to-trough
CIF Stock Recommendation Report (Spring 2013)
") Date: 2/26/13 Analyst Name: Frank McLaughlin CIF Stock Recommendation Report (Spring 2013) Company Name and Ticker: PPG Industries Inc. (PPG) Section (A) Summary Recommendation Buy: Yes No Target Price:
Date: 2/26/13 Analyst Name: Frank McLaughlin CIF Stock Recommendation Report (Spring 2013) Company Name and Ticker: PPG Industries Inc. (PPG) Section (A) Summary Recommendation Buy: Yes No Target Price:
> Macro Investment Outlook
 > Macro Investment Outlook Dr Shane Oliver Head of Investment Strategy and Chief Economist October 214 The challenge for investors how to find better yield and returns as bank deposit rates stay low 9
This would lower the year-end S&P 500 target price from 2,140 to 2,040. The technical picture of the market is also deteriorating.
 January 13, 2016 SPECIAL BULLETIN We are now in the 82 nd month of a Bull Market and U.S. Markets are now getting very close to giving a SELL SIGNAL. As you know, I have been bullish on the market since
QUALIFIED ELIGIBLE PERSONS
 TACTICAL FI STRATEGY IN THE U.S. THE INFORMATION CONTAINED HEREIN IS INTENDED FOR USE BY QUALIFIED ELIGIBLE PERSONS AS DEFINED IN CFTC REGULATION 4.7. COMPANY OVERVIEW: BLACKHEATH FUND MANAGEMENT INC.
AlphaSolutions Blended Bull/Calendar
 AlphaSolutions Blended Bull/Calendar An investment model based on trending strategies coupled with market analytics for downside risk control with predetermined investment periods Portfolio Goals Primary:
Global Economic Themes
 Global Economic Themes Global economic activity has been strengthening since 2013 though the recovery is modest, labourious, (and) fragile according to the International Monetary Fund s (IMF) Managing
October Stock Indexes September 2009 Market Indexes September S&P 500 Index +3.6% +17.0% HFRX Global Hedge Fund Index +2.2% +11.
 October 2009 Dear Investor, In September, stocks continued modestly higher, both in the US and globally. There have been a few notable exceptions to the gains, as stock indexes in China and Japan (among
DAL Investment Company. Janet Brown
 DAL Investment Company NoLoad FundX FundX Upgrader Funds Janet Brown DAL Investment Company Money Management since 1969 $2 million minimum $1.3 Billion aggregate assets under management. NoLoad FundX Newsletter
8/15/2016: Porter Library, Westlake, OH
 Just how good is active portfolio management compared to buy-and-hold? Goal: demonstrate added value of actively managed portfolios with years of theoretical results and months of actual results Educational:
The Benefits of a Diversified Precious-Metals Exposure
 The Benefits of a Diversified Precious-Metals Exposure July 26, 2016 by Robert Huebscher ETF Securities provides accessible investment solutions, enabling investors to intelligently diversify their portfolios
Hope Alone MODEL CAPITAL MANAGEMENT LLC
 MODEL CAPITAL MANAGEMENT LLC Hope Alone IMPORTANT NOTICE The following material is provided by a third-party strategist unaffiliated with AssetMark. The strategist is solely responsible for its content.
Chart 2: Long-term valuation metrics suggest US stocks to be highly valued.
 November 19th, 2018 1 This is provided for informational purposes only and should not be considered a recommendation to buy or sell a particular security. Past performance is no guarantee of future returns.
In the Wake of the Downgrade, New Opportunities
 141 W. Jackson Boulevard Suite 4002 Chicago, IL 60604 312.786.4450 / 800.662.9346 Part of the market s malaise since August 1st came as a result of bickering in Washington over whether to raise the US
Zacks Earnings Trends
 May 24, 2017 Zacks Earnings Trends Sheraz Mian SMian@Zacks.com Q1 Earnings Season Scorecard Here are the key points: We have Q1 results from 477 S&P 500 members or 97.6% of the index s total membership.
Views and Insights. Schroders Multi-Asset Investments. Section 1: Monthly Views November Summary Issued in November 2015
 Issued in November 215 For Financial Intermediary, Institutional and Consultant use only. Not for redistribution under any circumstances. Views and Insights Section 1: Monthly Views November 215 Summary
Quantitative & Strategy
 Cam Hui, CFA January 30, 2018 cam@pennock@ideahub.com THE PAIN TRADE SIGNALS FROM THE BOND MARKET Highlights As the 10-year Treasury yield staged an upside breakout at 2.6%, and luminary investors such
April 11, 2013 BOARD MATTER NO. D-1. University of Wyoming Student Portfolio Management Program Update INFORMATION ONLY
 April 11, 2013 BOARD MATTER NO. D-1 ACTION: University of Wyoming Student Portfolio Management Program Update INFORMATION ONLY ANALYSIS: The State Loan and Investment Board on December 15, 2005, authorized
2017 PREPARING FOR A YEAR OF REFLATION. Oct 20, 2016 Andreas Ruhlmann, Market Analyst at IG Bank
 2017 PREPARING FOR A YEAR OF REFLATION Oct 20, 2016 Andreas Ruhlmann, Market Analyst at IG Bank DISCLAIMER CFDs are leveraged products. CFD trading may not be suitable for everyone and can result in losses
Michael Riesner Marc Müller 23/05/2017. These are sales views based on Technical Analysis. They do not represent the UBS House View.
 h Equities Sales Trading Commentary Technical Analysis Weekly Comment Global Michael Riesner Marc Müller 23/05/2017 michael.riesner@ubs.com marc.mueller@ubs.com +41-44-239 1676 +41-44-239 1789 These are
QUICK PIVOT FRIDAY, JANUARY 7, 2011 BOB HOYE PUBLISHED BY INSTITUTIONAL ADVISORS. Surreal Policymakers Are Blowing Serial Bubbles
 QUICK PIVOT FRIDAY, JANUARY 7, 2011 BOB HOYE PUBLISHED BY INSTITUTIONAL ADVISORS Surreal Policymakers Are Blowing Serial Bubbles The above is more a sarcastic observation than a title for this edition.
Outlook for Economic Activity and Prices (October 2017)
") Outlook for Economic Activity and Prices (October 2017) October 31, 2017 Bank of Japan The Bank's View 1 Summary Japan's economy is likely to continue expanding on the back of highly accommodative financial
Outlook for Economic Activity and Prices (October 2017) October 31, 2017 Bank of Japan The Bank's View 1 Summary Japan's economy is likely to continue expanding on the back of highly accommodative financial
The Best Gann Fan Trading Strategy
 The Best Gann Fan Trading Strategy The best Gann fan trading strategy is a complex support and resistance trading strategy that uses diagonal support and resistance levels. Unlike the traditional horizontal
CIF Stock Recommendation Report (Spring 2013)
") Date: 4/08/2013 Analyst Name: Frank McLaughlin CIF Stock Recommendation Report (Spring 2013) Section (A) Summary Company Name and Ticker: Monsanto Co. (MON) Recommendation Buy: Yes Target Price: $115 Sector:
Date: 4/08/2013 Analyst Name: Frank McLaughlin CIF Stock Recommendation Report (Spring 2013) Section (A) Summary Company Name and Ticker: Monsanto Co. (MON) Recommendation Buy: Yes Target Price: $115 Sector:
Vanguard: The yield curve inversion and what it means for investors
 Vanguard: The yield curve inversion and what it means for investors December 3, 2018 by Joseph Davis, Ph.D. of Vanguard The U.S. economy has seen a prolonged period of growth without a recession. As the
High Dividend Value Equity Q Commentary. Market Review:
 S C H A F E R C U L L E N High Dividend Value Equity Q3 2016 Commentary Market Review: C A P I T A L M A N A G E M E N T In the third quarter of 2016, the S&P 500 and Russell 1000 Value returned 3.9% and
Prudential International Investments Advisers, LLC. Global Investment Strategy May 2008
 Prudential International Investments Advisers, LLC. Global Investment Strategy May 2008 By John Praveen, Chief Investment Strategist For Market Commentary Interviews Contact: Lisa Villareal, 973-367-2503/lisa.villareal@prudential.com
Outlook 2018: Commodities
 ECONOMICS Outlook 2018: Commodities With global in!ation forecast to pick up, is it time to add exposure to commodities, where fundamentals are improving and valuations are attractive? 13 DECEMBER 2017
Insights. Location, Location, Location
 February 2016 UNCERTAINTY = OPPORTUNITY Location, Location, Location Richard Bernstein, Chief Executive and Chief Investment Officer Richard Bernstein Advisors Richard Bernstein Advisors LLC (RBA) is an
MARKET INSIGHT Performance Economic Update Charts* of Interest
 MARKET INSIGHT Performance Economic Update Charts* of Interest *Provided by Strategas Research Partners LLC October 24, 2011 PERFORMANCE: as of 10-24-2011 Sector Week 3Mo YTD S&P 500 1.1% -7.3% 0.7% Russell
3.14. The Link between Bonds and Stocks.
 3.14. The Link between Bonds and Stocks. This chapter covers the important link between the bond and stock markets. It shows how the positive link between bond yields and stocks has existed over the last
MARKET INSIGHT Performance Economic Update Charts* of Interest
 MARKET INSIGHT Performance Economic Update Charts* of Interest *Provided by Strategas Research Partners LLC January 9, 2012 PERFORMANCE: as of 1/6/12 Sector Week 3Mo 1yr S&P 500 1.3% 10.3% 2.4% Russell
DESIGNED FOR TODAY S AND TOMORROW S INVESTMENT CHALLENGES
 DESIGNED FOR TODAY S AND TOMORROW S INVESTMENT CHALLENGES PRUDENTIAL REAL ASSETS FUND EFFECTIVE JUNE 11, 2018, THE FUND S NEW NAME WILL BE PGIM REAL ASSETS FUND. FUND SYMBOLS WILL NOT CHANGE. Potential
January Effect Boosts Equities
 Analyst Tan Xuan +6565316001 tanx@phillip.com.sg January Effect Boosts Equities Executive Summary Equities Positive investors sentiments and improving macroeconomics in US gave a boost to global equities
CHAPTER 13 EFFICIENT CAPITAL MARKETS AND BEHAVIORAL CHALLENGES
 CHAPTER 13 EFFICIENT CAPITAL MARKETS AND BEHAVIORAL CHALLENGES Answers to Concept Questions 1. To create value, firms should accept financing proposals with positive net present values. Firms can create
Beta Test Quick-Start Guide
 The Stock Trader Alert Beta Test Quick-Start Guide Stock Trader ALERT Stock Trader ALERT The Stock Trader Alert Beta Test Quick-Start Guide By Ted Bauman, Editor of Stock Trader Alert WELCOME to Stock
On Our Radar September 2015
 On Our Radar September 2015 The Dow Jones Industrial Average (DJIA), S&P 500 and NASDAQ Composite fell 6.56 percent, 6.25 percent, and 6.85 percent, respectively, in August, which was highlighted by a
The following is an extract from the April 07 Issue of The Global Speculator sent to subscribers on the 4 th of May 2007.
 TECHNICALLY SOUND The following is an extract from the April 07 Issue of The Global Speculator sent to subscribers on the 4 th of May 2007. The month of April 07 has seen further falls in the US dollar
March 16, Dear Investors:
 March 16, 2019 Crescat Capital LLC 1560 Broadway Denver, CO 80202 (303) 271-9997 info@crescat.net www.crescat.net Dear Investors: At Crescat we remain positioned to capitalize on a downturn in the economic
Rabidly Risk Averse. July 13, 2016 by Richard Bernstein of Richard Bernstein Advisors
 Rabidly Risk Averse July 13, 2016 by Richard Bernstein of Richard Bernstein Advisors 1999 was a very unique period. There was an overwhelming consensus that the new economy was a permanent investment theme
The $VIX, the Dow, and China. 3/15/2008
 The $VIX, the Dow, and China. 3/15/2008 In the past few days, I have received some questions from a few members. These questions cannot be answered in a few words, and because other members may be interested,
The law of Supply and Demand
 The law of Supply and Demand I have been trading for more than 25 years. What I have discovered in that time span is one of the best and most actuate tools in trading is the relationship between price
US Equity and Economic Review For the Week of April 27-May 1: Weak GDP Edition
 US Equity and Economic Review For the Week of April 27-May 1: Weak GDP Edition May 3, 2015 by Hale Stewart of Hale Stewart The market has been trading at fairly expensive levels since the first of the
ECONOMIC AND MARKET ENVIRONMENT FOURTH QUARTER 2017
 ECONOMIC AND MARKET ENVIRONMENT FOURTH QUARTER 2017 THE FIRM S OUTLOOK: SUMMARY ANDCONCLUSION THE ECONOMY» The U.S. economy continues to provide investors and businesses with a benign environment that
Market Maps. Bob Dickey, Technical Analyst. October 2016
 Market Maps Bob Dickey, Technical Analyst RBC Capital Markets, LLC / Portfolio Advisory Group For Important Disclosures, see slides 12 13; priced as of September 30, 2016, unless otherwise noted DJIA with
TMT Deep Dive 2/20/2017
 60 Deep Dive 2/20/2017 Technology continues its surge as absolute and relative prices reach new highs on a cap, equal weight, and global basis. Tech remains our top ranked sector however, our sector rankings
Economic Cycle Page 2. Market Tops and Bottoms Page 7. Secular Cycle Page 9. Market Cycle Page 10. Short-Term Market Timing and Corrections Page 11
 Index Economic Cycle Page 2 Market Tops and Bottoms Page 7 Secular Cycle Page 9 Market Cycle Page 10 Short-Term Market Timing and Corrections Page 11 Market Forecasting July 2018 Investor Education Investor
ARE YOU READY, HISTORY REPEATS AND WE REMAIN IGNORANT
 WEEKLY FINANCIAL NEWSLETTER ARE YOU READY, HISTORY REPEATS AND WE REMAIN IGNORANT Dear Members, Many market pundits came to predict market trend with their own theories. For example, the Black Swan theory
Time Weighted Return (TWR) Qtr change 3.0%. 12 Months 14.3%. Rate since 2/1/2002: 6.4%.
 Qtr change 3.0%. 12 Months 14.3%. Rate since 2/1/2002: 6.4%.") Performance Summary December 22, 2017 Wenzel Analytics Inc All Accounts and Strategies Time Weighted Return (TWR) Qtr change 3.0%. 12 Months 14.3%. Rate since 2/1/2002: 6.4%. Year-to-date aggregate price
Performance Summary December 22, 2017 Wenzel Analytics Inc All Accounts and Strategies Time Weighted Return (TWR) Qtr change 3.0%. 12 Months 14.3%. Rate since 2/1/2002: 6.4%. Year-to-date aggregate price
A Dramatic Rebound for Small-Caps
 A Dramatic Rebound for Small-Caps January 4, 207 by Francis Gannon of The Royce Funds 206 was a terrific year for small-cap stocks that included some key reversals: The Russell 2000 turned around 205's
Technical Analysis. Weekly Comment. Global. SPX Overbought Relief Rally in Europe!! Equities Sales Trading Commentary
 h Technical Analysis Equities Sales Trading Commentary Weekly Comment Global Michael Riesner Marc Müller 03/07/2012 michael.riesner@ubs.com marc.mueller@ubs.com +41-44-239 1676 +41-44-239 1789 SPX Overbought
ASEAN Insights: Regional trends
 ASEAN Insights: Regional trends January 2017 1. Global trends GLOBAL ECONOMY AND EQUITY MARKETS ENTER 2017 ON A STRONG NOTE DESPITE GEOPOLITICAL UNCERTAINTIES The global economy entered 2017 on a strong
Exchange Traded Fund Strategies
 Exchange Traded Fund Strategies 221 W. 6 th Street, Suite 1210 Austin, Texas 78701 Phone 512.477.3110 Fax 512.472.1046 Teresa Finney Senior Vice President, Investments Richard A. Funk, CFP First Vice President,
Outlook & Perspective
 Outlook & Perspective All data and information as of June 30, 2016 Approved for current clients. May be presented to prospective clients in a one-on-one setting only. Morningstar Investment Services LLC
Economic Cycle model, Recession Probability model & Leading Indicators A Holistic Perspective
 Economic Cycle model, Recession Probability model & Leading Indicators A Holistic Perspective White Paper RecessionProtect.com Whilst history doesn't repeat itself, it often rhymes, so the saying goes.
2018 Annual Management Report of Fund Performance
 MD Family of Funds 2018 Annual Management Report of Fund Performance DISCLOSURE This annual management report of fund performance contains financial highlights but does not contain the complete annual
NEXT EDGE BIOTECH BAROMETER CHARTBOOK
 NEXT EDGE BIOTECH BAROMETER CHARTBOOK NEXT EDGE BIOTECH BAROMETER CHARTBOOK: OCTOBER 12 TH, 2018 With the recent sharp decline in global equity markets and Biotech companies, resulting in a 11% decline