Investor Presentation May 2018
|
|
|
- Marshall Black
- 5 years ago
- Views:
Transcription

1 Investor Presentation May May 2018
2 Important Notice This presentation shall be read in conjunction with Mapletree Industrial Trust s ( MIT ) financial results for Fourth Quarter Financial Year 2017/2018 in the SGXNET announcement dated 23 April This presentation is for information only and does not constitute an offer or solicitation of an offer to sell or invitation to subscribe for or acquire any units in Mapletree Industrial Trust ( Units ). The past performance of the Units and MIT is not indicative of the future performance of MIT or Mapletree Industrial Trust Management Ltd. (the Manager ). The value of Units and the income from them may rise or fall. Units are not obligations of, deposits in or guaranteed by the Manager or any of its affiliates. An investment in Units is subject to investment risks, including the possible loss of the principal amount invested. Investors have no right to request the Manager to redeem their Units while the Units are listed. It is intended that unitholders may only deal in their Units through trading on the Singapore Exchange Securities Trading Limited ( SGX-ST ). Listing of the Units on the SGX-ST does not guarantee a liquid market for the Units. This presentation may also contain forward-looking statements that involve risks and uncertainties. Actual future performance, outcomes and results may differ materially from those expressed in forward-looking statements as a result of risks, uncertainties and assumptions. Representative examples of these factors include general industry and economic conditions, interest rate trends, cost of capital, occupancy rate, construction and development risks, changes in operating expenses (including employees wages, benefits and training costs), governmental and public policy changes and the continued availability of financing. You are cautioned not to place undue reliance on these forward-looking statements, which are based on current view of management on future events. Nothing in this presentation should be construed as financial, investment, business, legal or tax advice and you should consult your own independent professional advisors. 2
3 Contents 1 Overview of Mapletree Industrial Trust 2 Portfolio Highlights 3 4Q & FY17/18 Financial Performance 4 Outlook and Strategy 3

4 Hi-Tech Buildings, build-to-suit project for HP OVERVIEW OF MAPLETREE INDUSTRIAL TRUST
5 Overview of Mapletree Industrial Trust Sponsor Investment mandate Portfolio Manager Property Manager Trustee Mapletree Investments Pte Ltd ( MIPL ) Owns 32.8% of MIT Focused on (i) industrial real estate assets in Singapore, excluding properties primarily used for logistics purposes and (ii) data centres worldwide beyond Singapore 99 properties valued at S$4.3 billion 18.0 million 1 sq ft NLA Mapletree Industrial Trust Management Ltd. 100% owned by the Sponsor Mapletree Facilities Services Pte. Ltd. 100% owned by the Sponsor DBS Trustee Limited Public & Inst Unitholders 67.2% Business Park Buildings 13.2% Flatted Factories 36.6% MIT Portfolio Stack-up/ Ramp-up Buildings 10.8% MIPL Light Industrial Buildings 1.7% 32.8% Portfolio Value S$4.3 billion Hi-Tech Buildings 37.7% Trustee Manager Property Manager 1 Excluded the parking decks (150 Carnegie Way and 171 Carnegie Way) at 180 Peachtree. 2 Relates to MIT s 40.0% interest of the joint venture with MIPL in a portfolio of 14 data centres in the United States of America ( US ). 5 Portfolio value by geography Singapore 90.4% US 9.6% 2
6 Sustainable and Growing Returns Distributable Income (S$ million) DPU (cents) Q¹ 4Q 1Q 2Q 3Q 4Q 1Q 2Q 3Q 4Q 1Q 2Q 3Q 4Q 1Q 2Q 3Q 4Q 1Q 2Q 3Q 4Q 1Q 2Q 3Q 4Q 1Q 2Q 3Q 4Q FY10/11 FY11/12 FY12/13 FY13/14 FY14/15 FY15/16 FY16/17 FY17/ Distributable Income (S$ million) DPU (cents) 1 MIT was listed on 21 Oct


7 Healthy Returns since IPO COMPARATIVE TRADING PERFORMANCE SINCE IPO¹ MIT s Return on Investment Capital Appreciation Distribution Yield Total Return Listing on 21 Oct 2010 to 14 May %² 81.4%³ 194.3% 4 7 ¹ Rebased MIT s issue price of S$0.93 and opening unit prices of FTSE ST REITs Index and FTSE Straits Times Index on 21 Oct 2010 to 100. Source: Bloomberg. ² Based on MIT s closing unit price of S$1.980 on 14 May ³ MIT s distribution yield is based on DPU of S$0.757 over the issue price of S$0.93. ⁴ Sum of distributions and capital appreciation for the period over the issue price of S$0.93.


8 99 Properties Across 5 Property Segments FLATTED FACTORIES High-rise multi-tenanted industrial buildings with basic common facilities used for light manufacturing activities. STACK-UP/RAMP-UP BUILDINGS Stacked-up factory space with vehicular access to upper floors. Multi-tenanted space suitable for manufacturing and assembly activities. HI-TECH BUILDINGS High specification industrial buildings with higher office content for tenants in technology and knowledge-intensive sectors, including data centres. Usually fitted with airconditioned lift lobbies and common areas. LIGHT INDUSTRIAL BUILDINGS Multi-storey developments usually occupied by an anchor tenant for light manufacturing activities. BUSINESS PARK BUILDINGS High-rise multi-tenanted buildings in specially designated Business Park zones. Serve as regional headquarters for MNCs as well as spaces for R&D and knowledge-intensive enterprises. 8
")
9 85 Properties in Singapore Total NLA 15.7m sq ft WALE (By GRI) years Weighted Average Unexpired Lease Term of Underlying Land years Occupancy Rate % Flatted Factories Hi-Tech Buildings Business Park Buildings Stack-up/Ramp-up Buildings Light Industrial Buildings 9 1 Refers to the Singapore Portfolio s weighted average lease to expiry ( WALE ) by gross rental income ( GRI ) as at 31 Mar As at 31 Mar 2018.

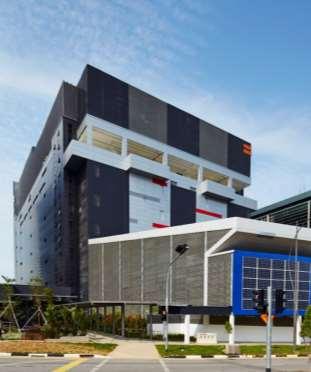
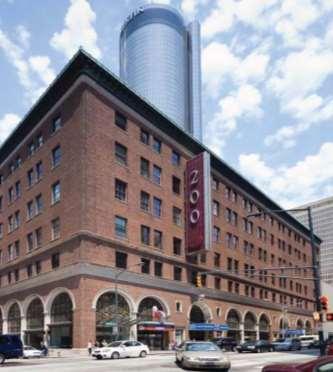
10 14 Data Centres across 9 States in US 1 Total NLA 2 2.3m sq ft WALE (By GRI) years Weighted Average Unexpired Lease Term of Underlying Land Freehold 4 Occupancy Rate % Texas California 1221 Coit Road, Plano 3300 Essex Drive, Richardson 5000 Bowen, Arlington Texas Wisconsin 1 Tennessee Michigan 2 New Jersey 3 4 Pennsylvania 5 6 North Carolina Wisconsin N15W24250 Riverwood Drive, Pewaukee Michigan W Ten Mile Road, Southfield New Jersey 2 Christie Heights, Leonia Pennsylvania 2000 Kubach Road, Philadelphia North Carolina 1805 Center Park Drive, Charlotte 5150 McCrimmon Parkway, Morrisville Tennessee 402 Franklin Road, Brentwood California 1001 Windward Concourse, 9 Alpharetta Trade Street, San Diego Northwoods Parkway, Atlanta 1 Acquired through a 40:60 joint venture with MIPL. 2 Excluded the parking decks (150 Carnegie Way and 171 Carnegie Way) at 180 Peachtree. 3 Refer to the US Portfolio s WALE by GRI as at 31 Mar All properties are sited on freehold land, except for the parking deck (150 Carnegie Way) at 180 Peachtree. As at 31 Mar 2018, the parking deck has a remaining land lease 10 tenure of approximately 37.8 years, with an option to renew for an additional 40 years. 5 As at 31 Mar Georgia Georgia Peachtree, Atlanta
11 Portfolio Growth since IPO S$ billion FY10/11 11 S$2.70 billion FY11/12 Jul 2011 Acquired Flatted Factories from JTC S$400 million 4 Acquisitions 3 Asset Enhancement Initiatives ( AEI ) 4 Build-to-Suit ( BTS ) S$2.88 billion FY12/13 S$3.17 billion FY13/14 Jul 2013 Completed AEI at Woodlands Central S$30 million Oct 2013 Completed BTS project for Kulicke & Soffa S$50 million S$3.42 billion FY14/15 S$3.56 billion FY15/16 May 2014 Acquired Light Industrial Building at Changi North S$14 million Jan 2014 Jan 2015 Completed Completed AEI at Toa BTS data Payoh North 1 centre for S$40 million Equinix Apr 2018 Projects S$108 million FY10/11 FY11/12 FY12/13 FY13/14 FY14/15 FY15/16 FY16/17 To FY17/18 acquire 1 Valuation of investment properties on 31 Mar at end of each financial year. 2 Acquired through a 40:60 joint venture with MIPL. S$3.75 billion FY16/17 Mar 2017 Secured new BTS data centre S$76 million S$4.32 billion FY17/18 Jun 2017 Completed BTS project for HP S$226 million Dec 2017 Acquired 14 data centres in US² US$750 million Feb 2018 Completed the AEI at 30A Kallang Place S$77 million and upgrade 7 Tai Seng Drive S$95 million

12 Flatted Factory, Toa Payoh North 2 PORTFOLIO HIGHLIGHTS
13 Portfolio Overview Singapore Portfolio US Portfolio Overall Number of properties NLA (million sq ft) Average passing rental rate ($ psf/mth) S$2.01 US$ % 89.6% 97.4% 97.4% 90.5% 90.0% 2 1 Excludes the parking decks (150 Carnegie Way and 171 Carnegie Way) at 180 Peachtree. 2 Based on MIT s 40.0% interest of the joint venture with Mapletree Investments Pte Ltd in a portfolio of 14 data centres in US through Mapletree Redwood Data Centre Trust. 13 Singapore US Overall Left Bar (3QFY17/18) Right Bar (4QFY17/18)
14 Lease Expiry Profile EXPIRING LEASES BY GROSS RENTAL INCOME 1 As at 31 March 2018 WALE by Gross Rental Income (years) Singapore Portfolio 3.6 US Portfolio 6.0 Overall % 18.0% 24.4% 28.8% 7.4% FY18/19 FY19/20 FY20/21 FY21/22 FY22/23 & Beyond Flatted Factories Hi-Tech Buildings US Data Centre Business Park Buildings Stack-up / Ramp-up Buildings Light Industrial Buildings 14 1 Based on MIT s 40.0% interest of the joint venture with Mapletree Investments Pte Ltd in a portfolio of 14 data centres in US through Mapletree Redwood Data Centre Trust.
15 Large and Diversified Tenant Base TOP 10 TENANTS BY GROSS RENTAL INCOME 1 As at 31 March % Over 2,000 tenants Largest tenant contributes about 9.9% of Overall Portfolio s Gross Rental Income Top 10 tenants forms 26.1% of Overall Portfolio s Gross Rental Income 3.3% 2.9% 2.8% 1.4% 1.3% 1.3% 1.2% 1.1% 0.9% 1 Based on MIT s 40.0% interest of the joint venture with Mapletree Investments Pte Ltd in a portfolio of 14 data centres in US through Mapletree Redwood Data Centre Trust. 15

16 Tenant Diversification Across Trade Sectors 1 No single trade sector accounted >23% of Overall Portfolio s Gross Rental Income By Gross Rental Income As at 31 Mar Based on MIT s 40.0% interest of the joint venture with Mapletree Investments Pte Ltd in a portfolio of 14 data centres in US through Mapletree Redwood Data Centre Trust.

17 Singapore Portfolio Performance Occupancy 100% Gross Rental Rate S$ psf/mth $ % 92.3% 93.2% 94.3% 94.5% 95.1% 95.0% 94.9% 95.0% 95.2% 95.4% 95.5% 93.9% 92.5% 91.3% 90.7% 91.5% 90.8% 90.2% 93.5% 93.8% 94.7% 94.6% 93.0% 92.5% 92.1% 93.1% 92.6% 90.4% 90.1% 89.6% 80% 70% 60% $1.68 $1.71 $1.70 $1.82 $1.83 $1.84 $1.86 $1.88 $1.89 $1.90 $1.92 $1.92 $1.93 $1.94 $1.95 $1.97 $1.94 $1.73 $1.75 $1.77 $2.01 $ % 40% $1.49 $1.52 $1.54 $1.53 $1.55 $1.59 $1.61 $1.56 $1.45 $ % $ % 10% 0% 3Q 4Q 1Q 2Q 3Q 4Q 1Q 2Q 3Q 4Q 1Q 2Q 3Q 4Q 1Q 2Q 3Q 4Q 1Q 2Q 3Q 4Q 1Q 2Q 3Q 4Q 1Q 2Q 3Q 4Q FY10/11 FY11/12 FY12/13 FY13/14 FY14/15 FY15/16 FY16/17 FY17/18 $0.50 Occupancy (LHS) Rental Rate (RHS) 17
18 Segmental Occupancy Levels (Singapore) 95.4% 88.7% 88.9% 91.0% 92.7% 92.9% 97.1% 97.1% 90.1% 89.6% 79.0% 76.6% Flatted Factories Hi-Tech Buildings Business Park Buildings Stack-Up/Ramp-Up Buildings Light Industrial Buildings Singapore Portfolio Left Bar (3QFY17/18) Right Bar (4QFY17/18) 18
19 Rental Revisions (Singapore) Gross Rental Rate (S$ psf/mth) 1 For period 4QFY17/18 $3.87 $3.84 $3.12 Before Renewal After Renewal New Leases Passing Rent $1.77 $1.71 $1.75 $1.89 $1.93 $1.98 $1.32 $1.37 $1.24 $1.27 $1.22 Flatted Factories Hi-Tech Buildings Business Park Buildings Stack-Up/Ramp-Up Buildings Light Industrial Buildings Renewal Leases 117 Leases (383,624 sq ft) 16 Leases (87,103 sq ft) 2 Leases (4,467 sq ft) 3 Leases (35,553 sq ft) 3 Leases (149,096 sq ft) New Leases 53 Leases (151,922 sq ft) 5 Leases (17,479 sq ft) 6 Leases (28,137 sq ft) 3 Leases (22,895 sq ft) - 1 Gross Rental Rate figures exclude short term leases; except Passing Rent figures which include all leases. 19
20 Healthy Tenant Retention (Singapore) LONG STAYING TENANTS RETENTION RATE FOR 4QFY17/18 >10 yrs 24.6% Up to 1 yr 8.9% >1 to 2 yrs 8.8% 79.2% 78.5% 100.0% 100.0% 83.8% More than 4 yrs 67.6% 4 yrs or less 32.4% > 2 to 3 yrs 7.7% 47.6% >3 to 4 yrs 7.0% >5 to 10 yrs 33.6% >4 to 5 yrs 9.4% As at 31 Mar 2018 By number of tenants. Flatted Factories Based on NLA. Hi-Tech Buildings Business Park Buildings Stack-Up / Ramp-Up Buildings Light Industrial Buildings Portfolio 67.6% of the tenants have leased the properties for more than 4 years Tenant retention rate of 83.8% in 4QFY17/18 20

21 Acquisition and Upgrading 7 Tai Seng Drive Estimated Project Cost S$95 million GFA 256,600 sq ft 7 Tai Seng Drive Completion of Upgrading 2H2019 Acquisition of a seven-storey property at a purchase consideration of S$68.0 million and upgrading the property into a high-specification building Upgrading works include increasing power and floor loading capacities and installing additional telecommunication infrastructure Land tenure: 30 years + 30 years (from 16 Mar 1993) 100% committed by an established information and communication technology company for an initial term of 25 years 1 with annual rental escalations 21 1 Subject to MIT exercising the option to extend the land lease for the additional 30 years.

22 AEI 30A Kallang Place and Kallang Basin 4 Cluster Estimated Cost S$77 million Additional GFA 336,000 sq ft 30A Kallang Place Completion 13 Feb 2018 Completed 14-storey Hi-Tech Building, 30A Kallang Place and improvement works at existing buildings in Kallang Basin 4 Cluster Committed leases for 40.2% of NLA or about 112,100 sq ft Strong leasing interest from companies looking for good quality industrial space in city fringe location 22

23 BTS Project 12 Sunview Drive Estimated Cost S$76 million GFA 242,000 sq ft Artist s impression of the BTS data centre Completion 2H2018 Development of a six-storey BTS data centre 100% committed by an established data centre operator Initial lease term of >10 years with staggered rental escalations and renewal options Situated on land area of about 96,800 sq ft Site allocated by JTC with zoning for Business 2 use and land tenure of 30 years Located in a specialised industrial park for data centres with ready-built infrastructure Completed structural works and external façade 23
24 Committed Sponsor with Aligned Interest REPUTABLE SPONSOR BENEFITS TO MIT Leading real estate development, investment and capital management company Owns and manages S$39.5 billion¹ of office, retail, logistics, industrial, residential, corporate lodging / serviced apartment, and student housing properties Manages 4 Singapore-listed real estate investment trusts and 6 private equity real estate funds with assets in Asia Pacific, UK and US Assets across 12 economies globally, with offices in Asia Pacific, UK and US¹ 24 ¹ As at 31 Mar ² Excluding Mapletree Business City. 1. Leverage on Sponsor s network Leverage on Mapletree s financial strength, market reach and network 2. Alignment of Sponsor s interest with Unitholders Mapletree s stake of 32.8% demonstrates support in MIT 3. In-house development capabilities Able to support growth of MIT by providing development capabilities 4. Right of first refusal to MIT Sponsor has granted right of first refusal to MIT over future sale or acquisition of (i) industrial or business park properties in Singapore² and (ii) 60% interest in the portfolio of 14 data centres in US Sponsor won the government tender for a 126,700 sq ft industrial site located next to Tai Seng MRT Station (18 Tai Seng)

25 Business Park Buildings, The Strategy and The Synergy 4Q & FY17/18 FINANCIAL PERFORMANCE
26 4Q & FY17/18 Results Highlights Growth driven by contribution from build-to-suit ( BTS ) project for HP Singapore Private Limited ( HP ) and 40% interest in portfolio of 14 data centres in United States FY17/18 Distributable Income: S$215.8 million ( 5.3% y-o-y) FY17/18 DPU: cents ( 3.2% y-o-y) 4QFY17/18 Distributable Income and DPU were S$55.5 million ( 7.2% y-o-y) and 2.95 cents ( 2.4% y-o-y) Portfolio update in 4QFY17/18 Overall Portfolio occupancy rate of 90.0% Completed asset enhancement initiative ( AEI ) at 30A Kallang Place on 13 Feb Positive leasing interest with commitment secured for 40.2% of NLA Assets under management up by 15.3% y-o-y to S$4,321.4 million 1 as at 31 Mar 2018 Due mainly to portfolio acquisition of 14 data centres in United States and increase of S$159.7 million in portfolio value for Singapore Portfolio Prudent capital management Hedged borrowings of 85.1% Aggregate leverage of 33.1% Included MIT s proportionate share of investment properties held by Mapletree Redwood Data Centre Trust, which is a 40:60 joint venture with Mapletree Investments Pte Ltd. 2 In accordance with Property Funds Guidelines, the aggregate leverage ratio includes proportionate share of borrowings of the joint venture and deposited property values.
27 Statement of Total Returns (Year-on-Year) 4QFY17/18 (S$ 000) 4QFY16/17 (S$ 000) / () Gross revenue 90,391 87, % Property operating expenses (22,512) (21,840) 3.1% Net property income 67,879 65, % Borrowing costs (9,269) (7,263) 27.6% Trust expenses (6,736) (7,374) (8.7%) Net income 51,874 51, % Net fair value gain on investment properties and investment properties under development 65,470 70,236 (6.8%) Share of joint venture 1 21,048 - ** Comprising: - Net profit after tax 3,172 - ** - Net fair value gain on investment properties 17,876 - ** Total return for the period before income tax 138, , % Income tax expense (32) (*) ** Total return for the period after income tax 138, , % Net non-tax deductible items (86,112) (69,821) 23.3% Distribution declared by joint venture 3,234 - ** Amount available for distribution 55,482 51, % Distribution per Unit (cents) % * Amount less than S$1,000 ** Not meaningful 27 1 Share of joint venture relates to MIT s 40.0% interest of the joint venture with Mapletree Investments Pte Ltd in a portfolio of 14 data centres in US through Mapletree Redwood Data Centre Trust.
28 Statement of Total Returns (Year-on-Year) FY17/18 (S$ 000) FY16/17 (S$ 000) / () Gross revenue 363, , % Property operating expenses (85,627) (83,735) 2.3% Net property income 277, , % Borrowing costs (34,055) (27,325) 24.6% Trust expenses (30,032) (29,170) 3.0% Net income 213, , % Net fair value gain on investment properties and investment properties under development 65,470 70,236 (6.8%) Share of joint venture 1 21,776 - ** Comprising: - Net profit after tax 3,900 - ** - Net fair value gain on investment properties 17,876 - ** Loss on divestment of investment property 2 (200) - ** Total return for the period before income tax 300, , % Income tax expense (32) (*) ** Total return for the period after income tax 300, , % Net non-tax deductible items (87,916) (65,611) 34.0% Distribution declared by joint venture 3,234 - ** Amount available for distribution 215, , % Distribution per Unit (cents) % 28 * Amount less than S$1,000 ** Not meaningful 1 Share of joint venture relates to MIT s 40.0% interest of the joint venture with Mapletree Investments Pte Ltd in a portfolio of 14 data centres in US through Mapletree Redwood Data Centre Trust. 2 Includes transaction costs of S$0.3 million incurred in relation to the divestment of 65 Tech Park Crescent at the sale price of S$ million, which was 34% higher than MIT s acquisition price of S$13.2 million.
29 Statement of Total Returns (Qtr-on-Qtr) 4QFY17/18 (S$ 000) 3QFY17/18 (S$ 000) / () Gross revenue 90,391 91,465 (1.2%) Property operating expenses (22,512) (20,610) 9.2% Net property income 67,879 70,855 (4.2%) Borrowing costs (9,269) (8,407) 10.3% Trust expenses (6,736) (7,850) (14.2%) Net income 51,874 54,598 (5.0%) Net fair value gain on investment properties and investment properties under development 65,470 - * Share of joint venture 1 21, * Comprising: - Net profit after tax 3, Net fair value gain on investment properties 17,876 - * Total return for the period before income tax 138,392 55, % Income tax expense (32) - * Total return for the period after income tax 138,360 55, % Net non-tax deductible items (86,112) (1,875) * Distribution declared by joint venture 3,234 - * Amount available for distribution 55,482 53, % Distribution per Unit (cents) % * Not meaningful 29 1 Share of joint venture relates to MIT s 40.0% interest of the joint venture with Mapletree Investments Pte Ltd in a portfolio of 14 data centres in US through Mapletree Redwood Data Centre Trust. 2 Distribution per Unit included an advanced distribution of 0.99 cent per unit for the period from 1 Oct 2017 to 1 Nov 2017, which was paid on 28 Nov The Distribution per Unit for the enlarged units in issue for the remaining period from 2 Nov 2017 to 31 Dec 2017 was 1.89 cents per unit.
30 Balance Sheet 31 Mar Dec 2017 / () 31 Mar 2017 / () Total assets (S$ 000) 4,154,320 4,289,101 (3.1%) 3,798, % Total liabilities (S$ 000) 1,374,248 1,617,368 (15.0%) 1,265, % Net assets attributable to Unitholders (S$ 000) 2,780,072 2,671, % 2,532, % Net asset value per Unit (S$) % % 1 Net tangible asset per unit was the same as net asset value per unit as there were no intangible assets as at the statement of position dates. 30
31 Higher Portfolio Value Property segment Valuation as at 31 Mar 2018 Local currency (mil) S$ mil 2 Valuation as at 31 Mar 2017 (S$ mil) Capitalisation rate Flatted Factories S$1, , , % to 7.75% Hi-Tech Buildings S$1, , , % to 7.00% Business Park Buildings S$ % Stack-up/Ramp-up Buildings S$ % Light Industrial Buildings 1 S$ % to 7.00% Singapore Portfolio S$3, , ,748.7 US Portfolio (100%) US$ , % to 8.50% US Portfolio (40%) US$ Total Portfolio 4, ,748.7 Excluding the divestment of 65 Tech Park Crescent 1 on 20 Jul 2017, the increase in portfolio value for Singapore Portfolio comprised a portfolio revaluation gain of S$65.5 million and capitalised cost of S$111.8 million from development and improvement works. The US Portfolio was valued at US$783.4 million (S$1,032.8 million), which was US$7.0 million (S$9.2 million) over previous valuation of US$776.4 million (S$1,023.6 million) conducted in Aug and Sep Net asset value per Unit increased from S$1.41 as at 31 Mar 2017 to S$1.47 as at 31 Mar Tech Park Crescent was valued at S$17.6 million as at 31 Mar Based on the exchange rate of US$1 to S$
32 Strong Balance Sheet Total debt (MIT Group) Weighted average tenor of debt Aggregate leverage ratio 1 31 Mar Dec 2017 S$1,219.8 million S$1,449.1 million 3.3 years 3.0 years 33.1% 33.8% Strong balance sheet to pursue growth opportunities BBB+ rating with Stable Outlook by Fitch Ratings 100% of loans unsecured with minimal covenants 1 In accordance with Property Funds Guidelines, the aggregate leverage ratio includes proportionate share of borrowings of the joint venture and deposited property values. As at 31 Mar 2018, total debt including MIT s proportionate share of joint venture debt is S$1,457.1 million. 32

33 Well Diversified Debt Maturity Profile DEBT MATURITY PROFILE As at 31 March 2018 Weighted Average Tenor of Debt = 3.3 years 33
34 Interest Rate Risk Management Fixed as a % of total debt Weighted average hedge tenor 31 Mar Dec % 60.7% 2.9 years 3.2 years About S$225 mil of interest rate hedges are due to expire in 2HFY18/19 4QFY17/18 3QFY17/18 Weighted average all-in funding cost Interest coverage ratio 2.9% 2.9% 6.7 times 7.2 times 34
35 Currency Risk Management S$ income 97% Hedged US$ income 2% Unhedged US$ income 1% 100% capital hedge: US$ investment in joint venture matched with US$ borrowings About 99% of FY17/18 net income stream are derived in / hedged into S$ As at 23 Apr

36 Stack-up/Ramp-up Buildings, Woodlands Spectrum OUTLOOK AND STRATEGY


37 Singapore Industrial Property Market DEMAND AND SUPPLY FOR MULTI-USER FACTORIES DEMAND AND SUPPLY FOR BUSINESS PARKS Total stock for factory space: 37.7 million sq m Potential net new supply of 1.0 million sq m in 2018, of which Multi-user factory space accounts for 0.3 million sq m Business park space accounts for million sq m Moderation in quantum of industrial land released through Industrial Government Land Sales Programme since 2013 Median rents for industrial real estate for 1Q2018 Multi-user Factory Space: S$1.76 psf/mth (-2.2% q-o-q) Business Park Space: S$4.30 psf/mth (+5.1% q-o-q) 37 Source: URA/JTC Realis, 26 Apr 2018
38 Outlook Singapore Singapore economy grew by 4.3% y-o-y in the quarter ended 31 Mar 2018, higher than 3.6% growth in preceding quarter¹. The wider economy and business sentiments of the small and medium enterprises in Singapore have been improving. Despite the positive outlook, threats to free trade and geopolitical tensions continue to threaten the growth momentum. Impending large supply of competing industrial space will exert pressure on both occupancy and rental rates. The Manager will continue to focus on tenant retention to maintain a stable portfolio occupancy. US According to 451 Research, LLC, growth of data and content as well as mobile services and the adoption of cloud services will continue to drive the demand for data centre space. The demand for edge data centres is also rising to meet the growing need for data to be stored close to its end users due to latency requirements. The supply for multi-tenant data centres in the United States (in net operational square feet) will grow by 8.8% while the demand will grow by 13.4% in This will underpin the stability of revenue contribution from the US Portfolio Ministry of Trade and Industry (Advance Estimates), 13 Apr Source: 451 Research, LLC, Mar 2018.


39 Delivering Sustainable Returns SECURE investments to deliver growth and diversification Pursue DPU-accretive acquisitions and development projects Secure BTS projects with pre-commitments from high-quality tenants Consider opportunistic divestments Valuecreating Investment Management Prudent Capital Management Proactive Asset Management IMPROVE competitiveness of properties Implement proactive marketing and leasing initiatives Deliver quality service and customised solutions Improve cost effectiveness to mitigate rising operating costs Unlock value through AEI OPTIMISE capital structure to provide financial flexibility 39 Maintain a strong balance sheet Diversify sources of funding Employ appropriate interest rate and foreign exchange rate risk management strategies
40 End of Presentation For enquiries, please contact Ms Melissa Tan, Vice President, Investor Relations, DID: (65) ,
Investor Presentation August 2017
 Investor Presentation August 2017 Important Notice This presentation shall be read in conjunction with Mapletree Industrial Trust s ( MIT ) financial results for First Quarter Financial Year 2017/2018
Investor Presentation March 2016
 Investor Presentation March 2016 Important Notice This presentation shall be read in conjunction with Mapletree Industrial Trust s ( MIT ) financial results for Third Quarter Financial Year 2015/2016 in
Investor Presentation November 2015
 Investor Presentation November 2015 Important Notice This presentation shall be read in conjunction with Mapletree Industrial Trust s ( MIT ) financial results for Second Quarter Financial Year 2015/2016
Notice of Annual General Meeting
 7 th Annual General Meeting 18 July 2017 Important Notice This presentation shall be read in conjunction with Mapletree Industrial Trust s ( MIT ) financial statements for the financial year ended 31 March
Investor Presentation. May 2013
 Investor Presentation May 2013 DISCLAIMER This presentation is for information only and does not constitute an offer or solicitation of an offer to subscribe for, acquire, purchase, dispose of or sell
(Constituted in the Republic of Singapore pursuant to a Trust Deed dated 29 January 2008 (as amended))
)") (Constituted in the Republic of Singapore pursuant to a Trust Deed dated 29 January 2008 (as amended)) ANNOUNCEMENT VALUATION OF MAPLETREE INDUSTRIAL TRUST S PROPERTIES 23 April 2018 In compliance with
(Constituted in the Republic of Singapore pursuant to a Trust Deed dated 29 January 2008 (as amended)) ANNOUNCEMENT VALUATION OF MAPLETREE INDUSTRIAL TRUST S PROPERTIES 23 April 2018 In compliance with
Mapletree Industrial Trust s 3QFY17/18 Distributable Income Grows 4.6% Year-on-Year
 (Constituted in the Republic of Singapore pursuant to a Trust Deed dated 29 January 2008 (as amended)) PRESS RELEASE Mapletree Industrial Trust s 3QFY17/18 Distributable Income Grows 4.6% Year-on-Year
Mapletree Industrial Trust Achieves Distribution Per Unit of 2.05 Cents for 2QFY2011 at 10.8% above Forecast 1
 PRESS RELEASE Mapletree Industrial Trust Achieves Distribution Per Unit of 2.05 Cents for 2QFY2011 at 10.8% above Forecast 1 Distribution per Unit ( DPU ) of 2.05 cents, higher than IPO Forecast ( Forecast
Mapletree Industrial Trust Delivers 9.0% Year-on-Year Growth for 1QFY13/14 Distributable Income
 (Constituted in Republic of Singapore pursuant to a Trust Deed dated 29 January 2008 (as amended)) PRESS RELEASE Mapletree Industrial Trust Delivers 9.0% Year-on-Year Growth for 1QFY13/14 Distributable
Mapletree Industrial Trust s 2QFY13/14 Distributable Income Increased 9.7% Year-on-Year to S$41.1 million
 (Constituted in Republic of Singapore pursuant to a Trust Deed dated 29 January 2008 (as amended)) PRESS RELEASE Mapletree Industrial Trust s 2QFY13/14 Distributable Income Increased 9.7% Year-on-Year
Investor Presentation. March 2011
 Investor Presentation March 2011 Mapletree Industrial Trust ( MIT ) Overview of Mapletree Industrial Trust Portfolio Highlights Robust, Resilient, Relevant & Reputable Financial Highlights First Financial
Mapletree Industrial Trust s 2QFY17/18 Distribution per Unit Increases 6.0% Year-on-Year
 NOT FOR DISTRIBUTION IN OR INTO THE UNITED STATES, EUROPEAN ECONOMIC AREA, CANADA, JAPAN OR AUSTRALIA (Constituted in the Republic of Singapore pursuant to a Trust Deed dated 29 January 2008 (as amended))
MAPLETREE INDUSTRIAL TRUST UNAUDITED FINANCIAL STATEMENT AND DISTRIBUTION ANNOUNCEMENT FOR THE FINANCIAL PERIOD FROM 1 APRIL 2018 TO 30 JUNE 2018
 (Constituted in the Republic of Singapore pursuant to a Trust Deed dated 29 January 2008 (as amended)) MAPLETREE INDUSTRIAL TRUST UNAUDITED FINANCIAL STATEMENT AND DISTRIBUTION TABLE OF CONTENTS Item No.
(Constituted in the Republic of Singapore pursuant to a Trust Deed dated 29 January 2008 (as amended))
)") (Constituted in the Republic of Singapore pursuant to a Trust Deed dated 29 January 2008 (as amended)) MAPLETREE INDUSTRIAL TRUST UNAUDITED FINANCIAL STATEMENT AND DISTRIBUTION TABLE OF CONTENTS Item No.
(Constituted in the Republic of Singapore pursuant to a Trust Deed dated 29 January 2008 (as amended)) MAPLETREE INDUSTRIAL TRUST UNAUDITED FINANCIAL STATEMENT AND DISTRIBUTION TABLE OF CONTENTS Item No.
Mapletree Industrial Trust Achieves Distributable Income of S$35.8 million for 4QFY11/12
 (Constituted in Republic of Singapore pursuant to a Trust Deed dated 29 January 2008 (as amended)) PRESS RELEASE Mapletree Industrial Trust Achieves Distributable Income of S$35.8 million for 4QFY11/12
(Constituted in the Republic of Singapore pursuant to a Trust Deed dated 29 January 2008 (as amended))
)") (Constituted in the Republic of Singapore pursuant to a Trust Deed dated 29 January 2008 (as amended)) MAPLETREE INDUSTRIAL TRUST UNAUDITED FINANCIAL STATEMENT AND DISTRIBUTION TABLE OF CONTENTS Item No.
(Constituted in the Republic of Singapore pursuant to a Trust Deed dated 29 January 2008 (as amended)) MAPLETREE INDUSTRIAL TRUST UNAUDITED FINANCIAL STATEMENT AND DISTRIBUTION TABLE OF CONTENTS Item No.
Mapletree Industrial Trust Achieves 12.0% Year-on-Year Increase in Distributable Income for 3QFY13/14
 (Constituted in Republic of Singapore pursuant to a Trust Deed dated 29 January 2008 (as amended)) PRESS RELEASE Mapletree Industrial Trust Achieves 12.0% Year-on-Year Increase in Distributable Income
OSK DMG ASEAN & Hong Kong Corporate Day June 2012
 OSK DMG ASEAN & Hong Kong Corporate Day 26-28 June 2012 2 Important Notice This material shall be read in conjunction with CIT s financial statements for the financial period ended 31 March 2012. The value
Financial Results for the Quarter / Year Ended 31 Mar April 2012
 Financial Results for the Quarter / Year Ended 31 Mar 2012 19 April 2012 Disclaimer This Presentation is focused on comparing results for the three months ended 31 Mar 2012 versus results achieved in the
FY2014 Financial Results Presentation
 FY2014 Financial Results Presentation 16 January 2015 16 International Business Park Important Notice This material shall be read in conjunction with CIT s results announcements for the financial period
FINANCIAL RESULTS For First Quarter ended 31 March 2015
 FINANCIAL RESULTS For First Quarter ended 31 March 2015 AGENDA Q1 Highlights Financial Performance Portfolio Performance AEI Updates Looking Ahead Unit Performance 2 Q1 HIGHLIGHTS Q1 HIGHLIGHTS FINANCIAL
4QFY2013 and 2HFY2013 Results Presentation. January 2014
 4QFY2013 and 2HFY2013 Results Presentation January 2014 1 Disclaimer This presentation should be read in conjunction with the financial statements of Soilbuild Business Space REIT for the period from 1
(Constituted in the Republic of Singapore pursuant to a Trust Deed dated 29 January 2008 (as amended))
)") (Constituted in the Republic of Singapore pursuant to a Trust Deed dated 29 January 2008 (as amended)) MAPLETREE INDUSTRIAL TRUST FINANCIAL STATEMENT AND DISTRIBUTION TABLE OF CONTENTS Item No. Description
(Constituted in the Republic of Singapore pursuant to a Trust Deed dated 29 January 2008 (as amended)) MAPLETREE INDUSTRIAL TRUST FINANCIAL STATEMENT AND DISTRIBUTION TABLE OF CONTENTS Item No. Description
AIMS AMP CAPITAL INDUSTRIAL REIT
 AIMS AMP CAPITAL INDUSTRIAL REIT FY2019: First Quarter Financial Results Ended 30 June 2018 Results Presentation 26 July 2018 1 Important notice Disclaimer This Presentation is focused on comparing actual
3Q2016 Financial Results Presentation 26 October Pioneer Crescent
 3Q2016 Financial Results Presentation 26 October 2016 25 Pioneer Crescent Content Executive Summary Real Estate Highlights Financial & Capital Management Highlights Appendix 2 3Q2016 Executive Summary
2Q2014 Financial Results 24 July Creating Value & Delivering Growth
 2Q2014 Financial Results 24 July 2014 1 Creating Value & Delivering Growth Important Notice This material shall be read in conjunction with CIT s financial statements for the financial period ended 30
Viva Industrial Trust 4Q2017 & FY2017 Results Presentation. 26 January 2018
 Viva Industrial Trust 4Q2017 & FY2017 Results Presentation 26 January 2018 1 Important Notice This presentation is for information purposes only and does not constitute or form part of an offer, invitation
SGX REIT & BT SEMINAR Tokyo, 30 June Pioneer Crescent
 SGX REIT & BT SEMINAR Tokyo, 30 June 3016 25 Pioneer Crescent Singapore Industrial REITs (S-REITs) 3 Key Features Bond-like listed security ( Dividend Play ) that provides steady income distribution stream
AIMS AMP CAPITAL INDUSTRIAL REIT
 AIMS AMP CAPITAL INDUSTRIAL REIT 3 rd Quarter Ended 31 December 2011 Results Presentation 20 January 2012 Important Notice Disclaimer This Presentation is focused on comparing actual results for the financial
FY2015 Financial Results Presentation
 FY2015 Financial Results Presentation 14 January 2016 16 International Business Park 2 Content Executive Summary Financial Summary Real Estate Highlights Financial & Capital Management Highlights Appendix
3Q 2012 Presentation Slides. 1 Nov 2012
 3Q 2012 Presentation Slides 1 Nov 2012 2 Important Notice This material shall be read in conjunction with CIT s financial statements for the financial period ended 30 Sep 2012. The value of units in CIT
1Q FY2009/10 Financial Results Presentation 17 July 2009
 1Q FY2009/10 Financial Results Presentation 17 July 2009 Disclaimers This Presentation is focused on comparing results for the three months ended 30 June 2009 versus actual results year-on-year ( yoy ).
AIMS AMP CAPITAL INDUSTRIAL REIT
 AIMS AMP CAPITAL INDUSTRIAL REIT FY2013: 2 nd Quarter Ended 30 September 2012 Results Presentation 24 October 2012 Important Notice Disclaimer This Presentation is focused on comparing actual results for
Financial Results for 4 th Quarter and Year Ended 31 December January 2019
 Financial Results for 4 th Quarter and Year Ended 31 December 2018 30 January 2019 Important Notice This presentation should be read in conjunction with the announcements released by OUE Commercial REIT
Macquarie ASEAN Conference. 26 Aug 2014
 Macquarie ASEAN Conference 26 Aug 2014 Important Notice Standard Chartered Securities (Singapore) Pte. Limited, CIMB Bank Berhad, Singapore Branch and Oversea-Chinese Banking Corporation Limited were the
Financial Results for the Quarter Ended 31 Dec January 2012
 Financial Results for the Quarter Ended 31 Dec 2011 19 January 2012 Disclaimer This Presentation is focused on comparing results for the three months ended 31 Dec 2011 versus results achieved in the three
Hong Kong Non-Deal Roadshow Hong Kong, 4 March International Business Park
 Hong Kong Non-Deal Roadshow Hong Kong, 4 March 2016 16 International Business Park 2 Content CIT FY2015 Results Executive Summary Financial Summary Real Estate Highlights Financial & Capital Management
MAPLETREE LOGISTICS TRUST S 4Q FY17/18 DISTRIBUTION PER UNIT RISES 4% TO CENTS
 For Immediate Release MAPLETREE LOGISTICS TRUST S 4Q FY17/18 DISTRIBUTION PER UNIT RISES 4% TO 1.937 CENTS Highlights: 4Q FY17/18 amount distributable to Unitholders grew 27% year-on-year to S$59.2 million
AIMS AMP CAPITAL INDUSTRIAL REIT
 AIMS AMP CAPITAL INDUSTRIAL REIT FY2018: Fourth Quarter Financial Results Ended 31 March 2018 Results Presentation 25 April 2018 1 Important notice Disclaimer This Presentation is focused on comparing
MAPLETREE LOGISTICS TRUST S 1Q FY14/15 DISTRIBUTION PER UNIT RISES 6% to 1.90 CENTS
 For Immediate Release MAPLETREE LOGISTICS TRUST S 1Q FY14/15 DISTRIBUTION PER UNIT RISES 6% to 1.90 CENTS Highlights: 6% year-on-year growth in amount distributable to Unitholders to S$46.6 million Recent
Investor Presentation for Citi ASEAN Investor Conference. 12 June 2014
 Investor Presentation for Citi ASEAN Investor Conference 2 June 204 Important Notice Standard Chartered Securities (Singapore) Pte. Limited, CIMB Bank Berhad, Singapore Branch and Oversea-Chinese Banking
Sabana Shari ah Compliant Industrial REIT 3Q 2018 Financial Results Presentation. 26 October 2018
 Sabana Shari ah Compliant Industrial REIT 3Q 2018 Financial Results Presentation 26 October 2018 Important Notice Disclaimer This presentation shall be read in conjunction with the financial information
REITs Symposium May 2018
 REITs Symposium 2018 19 May 2018 Important Notice This presentation shall be read in conjunction with OUE Commercial REIT s Financial Results announcement for 1Q 2018 dated 10 May 2018. This presentation
CLSA Asean Forum Bangkok, March International Business Park
 CLSA Asean Forum Bangkok, March 2016 16 International Business Park 2 Content Overview of CIT CIT FY2015 Financial Results Overview Financial & Capital Management Highlights Real Estate Highlights Singapore
AIMS AMP CAPITAL INDUSTRIAL REIT
 AIMS AMP CAPITAL INDUSTRIAL REIT FY2016: First Quarter Financial Results Ended 30 June 2015 Results Presentation 29 July 2015 Important notice Disclaimer This Presentation is focused on comparing actual
MAPLETREE LOGISTICS TRUST S QUARTERLY DISTRIBUTION PER UNIT RISES 10% YEAR-ON-YEAR
 For Immediate Release MAPLETREE LOGISTICS TRUST S QUARTERLY DISTRIBUTION PER UNIT RISES 10% YEAR-ON-YEAR Highlights: Distribution Per Unit ( DPU ) of 1.70 cents for the 3 months ended 31 March 2012 Portfolio
REITS Symposium Presentation 19 May 2018
 REITS Symposium Presentation 19 May 2018 Important Notice This presentation is for information purposes only and does not constitute or form part of an offer, invitation or solicitation of any offer to
SGX-REITAS Education Series
 SGX-REITAS Education Series 23 February 2016 16 International Business Park 2 Executive Summary Singapore Industrial Real Estate Sector Overview Role of Regulators in the Industrial Sector Overview of
Balance Sheet Positioned for Future Growth with No Major Refinancing Due Until 2016
 (Constituted in the Republic of Singapore pursuant to a trust deed dated 31 March 2006 (as amended)) Press Release Balance Sheet Positioned for Future Growth with No Major Refinancing Due Until 2016 Refinanced
Mapletree Commercial Trust s Distribution Per Unit for Full Year Up 4.9% to 9.04 Singapore Cents
 For Immediate Release Mapletree Commercial Trust s Distribution Per Unit for Full Year Up 4.9% to 9.04 Singapore Cents Gross revenue and net property income ( NPI ) for 4Q FY17/18 grew 1.3% and 1.2% respectively
Mapletree Commercial Trust s Income Available for Distribution for 2Q FY16/17 grew 25.4% year-on-year to S$53.7 million
 For Immediate Release Mapletree Commercial Trust s Income Available for Distribution for 2Q FY16/17 grew 25.4% year-on-year to S$53.7 million Gross revenue and net property income ( NPI ) for 2Q FY16/17
Financial Results for 4 th Quarter 2017 and Year Ended 31 December 2017
 Financial Results for 4 th Quarter 2017 and Year Ended 31 December 2017 31 January 2018 Important Notice This presentation shall be read in conjunction with OUE Commercial REIT s Financial Results announcement
AIMS AMP CAPITAL INDUSTRIAL REIT
 AIMS AMP CAPITAL INDUSTRIAL REIT FY2018: Second Quarter Financial Results Ended 30 September 2017 Results Presentation 26 October 2017 1 Important notice Disclaimer This Presentation is focused on comparing
Citi ASEAN Conference 12 June Tai Seng Street
 Citi ASEAN Conference 12 June 2014 1 16 Tai Seng Street Important Notice This material shall be read in conjunction with CIT s financial statements for the financial period ended 31 Mar 2014. The value
Mapletree Commercial Trust Results Announcement. For the period 27 April 2011 to 30 June 2011
 Mapletree Commercial Trust Results Announcement For the period 27 April 2011 to 30 June 2011 Disclaimer This presentation is for information only and does not constitute an invitation or offer to acquire,
Mapletree Commercial Trust s Distribution Per Unit for 2Q FY17/18 Up 9.3% to 2.24 Singapore Cents
 For Immediate Release Mapletree Commercial Trust s Distribution Per Unit for 2Q FY17/18 Up 9.3% to 2.24 Singapore Cents Gross revenue and net property income ( NPI ) for 2Q FY17/18 grew 21.7% and 23.4%
Financial Results Presentation 3Q2017
 Financial Results Presentation 3Q2017 Contents A 3Q2017 Results B C Financial Performance Prudent Capital Management D Real Estate Highlights E Market Outlook F Appendix 2 3Q2017 Results 3Q2017 At A Glance
Financial Results for 3 rd Quarter November 2017
 Financial Results for 3 rd Quarter 2017 2 November 2017 Important Notice This presentation shall be read in conjunction with OUE Commercial REIT s Financial Results announcement for 3Q 2017 dated 2 November
6 th Annual General Meeting 24 April International Business Park
 6 th Annual General Meeting 24 April 2015 16 International Business Park Important Notice This material shall be read in conjunction with CIT s results announcements for the financial period ended 31 December
Mapletree Commercial Trust
 Mapletree Commercial Trust 3Q FY17/18 Financial Results 24 January 2018 1 Important Notice This presentation is for information only and does not constitute an offer or solicitation of an offer to sell
27 January ARA-CWT Trust Management (Cache) Limited
 Limited") 4Q 2010 Financial Results 27 January 2011 ARA-CWT Trust Management (Cache) Limited Agenda 4Q 2010 Financial Results Portfolio Update Going Forward 2 Highlights 4Q 2010 Results Net Property Income of S$14.4m
4Q 2010 Financial Results 27 January 2011 ARA-CWT Trust Management (Cache) Limited Agenda 4Q 2010 Financial Results Portfolio Update Going Forward 2 Highlights 4Q 2010 Results Net Property Income of S$14.4m
Acquisition of 7000 AMK and the Proposed Equity Fund Raising. 14 December 2017
 Acquisition of 7000 AMK and the Proposed Equity Fund Raising 14 December 2017 Contents A Overview B Benefits of the Acquisition C Funding Structure and Financial Impact D Recent Developments E Conclusion
3Q2010 Financial Results. 20 October 2010
 3Q2010 Financial Results 20 October 2010 important notice The value of units in CIT ( Units ) and the income derived from them may fall as well as rise. Units are not investments, liabilities or obligations
MAPLETREE LOGISTICS TRUST S 1Q FY17/18 DPU RISES 2% YEAR-ON-YEAR TO CENTS
 For Immediate Release MAPLETREE LOGISTICS TRUST S 1Q FY17/18 DPU RISES 2% YEAR-ON-YEAR TO 1.887 CENTS Highlights: Amount distributable to Unitholders grew 2.5% year-on-year to S$47.2 million Stable operations
Mapletree Commercial Trust s Distribution Per Unit for YTD FY17/18 Up 6.4% to 6.77 Singapore Cents
 For Immediate Release Mapletree Commercial Trust s Distribution Per Unit for YTD FY17/18 Up 6.4% to 6.77 Singapore Cents Gross revenue and net property income ( NPI ) for 3Q FY17/18 grew 0.8% and 1.9%
FY2012 Financial Results Presentation
 FY2012 Financial Results Presentation 21 January 2013 Knowing. Believing. Delivering ARA-CWT Trust Management (Cache) Limited Agenda Overview & FY12 Key Highlights 4QFY12 & FY12 Full Year Financial Performance
MAPLETREE LOGISTICS TRUST S 3Q FY13/14 DISTRIBUTION PER UNIT RISES 7% YEAR-ON-YEAR
 For Immediate Release MAPLETREE LOGISTICS TRUST S 3Q FY13/14 DISTRIBUTION PER UNIT RISES 7% YEAR-ON-YEAR Highlights: Amount Distributable to Unitholders registered 8% year-on-year growth Results underpinned
AIMS AMP CAPITAL INDUSTRIAL REIT
 AIMS AMP CAPITAL INDUSTRIAL REIT FY2016: Second Quarter Financial Results Ended 30 September 2015 Results Presentation 29 October 2015 Important notice Disclaimer This Presentation is focused on comparing
Financial Results for 3 rd Quarter 2016
 Financial Results for 3 rd Quarter 2016 1 November 2016 Important Notice This presentation shall be read in conjunction with OUE Commercial REIT s Financial Results announcement for 3Q 2016 dated 1 November
AIMS AMP CAPITAL INDUSTRIAL REIT
 AIMS AMP CAPITAL INDUSTRIAL REIT FY2014: Third Quarter ended 31 December 2013 Results Presentation 29 January 2014 Important notice Disclaimer This Presentation is focused on comparing actual results for
FY2018 Results Presentation. 22 Jan 2019
 FY2018 Results Presentation 22 Jan 2019 Disclaimer This presentation may contain forward-looking statements that involve assumptions, risks and uncertainties. Actual future performance, outcomes and results
Presentation for REITs Symposium 2017
 Presentation for REITs Symposium 2017 27 May 2017 Important Notice This presentation shall be read in conjunction with OUE Commercial REIT s Financial Results announcement for 1Q 2017 dated 5 May 2017.
Mapletree Commercial Trust s 3Q FY18/19 Net Property Income Grew 2.2% Year-on-Year Distribution Per Unit Up 1.3% to 2.
 For Immediate Release Mapletree Commercial Trust s 3Q FY18/19 Net Property Income Grew 2.2% Year-on-Year Distribution Per Unit Up 1.3% to 2.33 Singapore Cents Gross revenue and net property income ( NPI
Mapletree Commercial Trust s Distribution Per Unit for 1Q FY17/18 Rose 9.9% to 2.23 Singapore Cents
 For Immediate Release Mapletree Commercial Trust s Distribution Per Unit for 1Q FY17/18 Rose 9.9% to 2.23 Singapore Cents Gross revenue and net property income ( NPI ) for 1Q FY17/18 grew 46.9% and 49.6%
SABANA SHARI AH COMPLIANT INDUSTRIAL REIT
 SABANA SHARI AH COMPLIANT INDUSTRIAL REIT 1Q 2015: First Quarter Ended 31 March 2015 Financial Results Presentation 20 April 2015 Important Notice Disclaimer This presentation shall be read in conjunction
Singapore Investor Roadshow
 Singapore Investor Roadshow 11 May 2015 16 International Business Park Important Notice This material shall be read in conjunction with CIT s results announcements for the financial period ended 31 December
AIMS AMP CAPITAL INDUSTRIAL REIT
 AIMS AMP CAPITAL INDUSTRIAL REIT 8 th ANNUAL GENERAL MEETING PRESENTATION 27 July 2017 1 Important notice Disclaimer This Presentation is focused on comparing actual results for the financial period from
MAPLETREE LOGISTICS TRUST DELIVERS 1.71 CENTS DISTRIBUTION PER UNIT FOR 2Q FY12/13
 For Immediate Release MAPLETREE LOGISTICS TRUST DELIVERS 1.71 CENTS DISTRIBUTION PER UNIT FOR 2Q FY12/13 Highlights: Amount distributable to Unitholders of S$41.4 million 99.2% occupancy rate, positive
Mapletree Commercial Trust
 Mapletree Commercial Trust 1Q FY18/19 Financial Results 26 July 2018 1 Important Notice This presentation is for information only and does not constitute an offer or solicitation of an offer to sell or
26 April ARA-CWT Trust Management (Cache) Limited
 Limited") 1Q 2011 Financial Results 26 April 2011 ARA-CWT Trust Management (Cache) Limited Agenda 1Q 2011 Financial i Results Portfolio Update Going Forward 2 Highlights 1Q 2011 Results Property Income slightly
1Q 2011 Financial Results 26 April 2011 ARA-CWT Trust Management (Cache) Limited Agenda 1Q 2011 Financial i Results Portfolio Update Going Forward 2 Highlights 1Q 2011 Results Property Income slightly
Citi-REITAS-SGX C-Suite Singapore REITs and Sponsors Forum
 Citi-REITAS-SGX C-Suite Singapore REITs and Sponsors Forum 23 August 2018 Important Notice This presentation shall be read in conjunction with OUE Commercial REIT s Financial Results announcement for 2Q
MAPLETREE LOGISTICS TRUST ENHANCES PORTFOLIO RETURNS THROUGH ASSET RECYCLING
 For Immediate Release MAPLETREE LOGISTICS TRUST ENHANCES PORTFOLIO RETURNS THROUGH ASSET RECYCLING Acquisition of Hyundai Logistics Centre (South Korea) for KRW 22.5 billion (~ S$24.6 million 1 ) Divestment
CIT reports steady 2Q2015 results and improved capital structure
 (Constituted in the Republic of Singapore pursuant to a trust deed dated 31 March 2006 (as amended)) Press Release CIT reports steady 2Q2015 results and improved capital structure Net property income increased
EC WORLD REIT Reports 2.6% Higher DPU for FY2018; Proposes Entry into New Master Lease Agreements to Significantly Lengthen Lease Expiry Profile
 NEWS RELEASE EC WORLD REIT Reports 2.6% Higher DPU for FY2018; Proposes Entry into New Master Lease Agreements to Significantly Lengthen Lease Expiry Profile 2.6% year-on-year ( y-o-y ) increase in DPU
AIMS AMP CAPITAL INDUSTRIAL REIT
 AIMS AMP CAPITAL INDUSTRIAL REIT FY2018: First Quarter Financial Results Ended 30 June 2017 Results Presentation 27 July 2017 1 Important notice Disclaimer This Presentation is focused on comparing actual
Mapletree Commercial Trust s Distribution per Unit for 1Q FY15/16 1 rose 3.1% year-on-year
 For Immediate Release Mapletree Commercial Trust s Distribution per Unit for 1Q FY15/16 1 rose 3.1% year-on-year Distribution per Unit ( DPU ) for 1Q FY15/16 up 3.1%, to 2.01 cents Property Operating Expenses
PROPOSED ACQUISITION OF 16 TAI SENG STREET
 (Constituted in the Republic of Singapore pursuant to a trust deed dated 31 March 2006 (as amended)) PROPOSED ACQUISITION OF 16 TAI SENG STREET 1. PROPOSED ACQUISITION OF 16 TAI SENG STREET 1.1 Cambridge
SGX - DBS Vickers - REITAS SREITS Corporate Day Investor Presentation
 SGX - DBS Vickers - REITAS SREITS Corporate Day Investor Presentation 27 Feb 1 Mar 2018 Important Notice This presentation shall be read in conjunction with OUE Commercial REIT s Financial Results announcement
Investor Presentation for Tokyo Non-Deal Roadshow. 25 August 2016
 Investor Presentation for Tokyo Non-Deal Roadshow 25 August 2016 Important Notice This presentation shall be read in conjunction with OUE Commercial REIT s Financial Results announcement for 1Q 2016 dated
MAPLETREE LOGISTICS TRUST DELIVERS STEADY PERFORMANCE FOR 1H FY16/17
 For Immediate Release MAPLETREE LOGISTICS TRUST DELIVERS STEADY PERFORMANCE FOR 1H FY16/17 Highlights: Maintained DPU at 1.86 cents for 2Q FY16/17 and 3.71 cents for 1H FY16/17 Stable portfolio occupancy
The Compelling Singapore REITs Story
 30-Oct-17 30-Nov-17 31-Dec-17 31-Jan-18 28-Feb-18 31-Mar-18 30-Apr-18 31-May-18 30-Jun-18 31-Jul-18 31-Aug-18 30-Sep-18 31-Oct-18 30-Nov-18 31-Dec-18 The Compelling Singapore REITs Story Quarterly Update:
Mapletree Commercial Trust
 Mapletree Commercial Trust 2Q & 1H FY18/19 Financial Results 24 October 2018 0 Important Notice This presentation is for information only and does not constitute an offer or solicitation of an offer to
Equity Fund Raising and Acquisitions. 21 October 2010
 Equity Fund Raising and Acquisitions 21 October 2010 important notice The value of units in CIT ( Units ) and the income derived from them may fall as well as rise. Units are not investments, liabilities
Investor Presentation
 Investor Presentation 15 September 2011 Knowing. Believing. Delivering ARA-CWT Trust Management (Cache) Limited Agenda REIT Overview Management Strategy 2Q 2011 Financial Results Portfolio Update Going
Introduction to Cache Logistics Trust
 Introduction to Cache Logistics Trust 30 May 2013 Tampines Regional Library Knowing. Believing. Delivering ARA-CWT Trust Management (Cache) Limited Agenda About Cache Logistics Trust 1QFY2013 Financial
Mapletree Commercial Trust Delivers Stable Returns
 For Immediate Release Mapletree Commercial Trust Delivers Stable Returns Distribution per Unit ( DPU ) for 3Q FY15/16 1 at 2.08 cents, bringing DPU for Year-To-Date ( YTD ) FY15/16 2 to 6.11 cents, up
SABANA SHARI AH COMPLIANT INDUSTRIAL REIT
 SABANA SHARI AH COMPLIANT INDUSTRIAL REIT 3Q 2016: Third Quarter Ended 30 September 2016 Financial Results Presentation 17 October 2016 Important Notice Disclaimer This presentation shall be read in conjunction
MAPLETREE LOGISTICS TRUST ACQUIRES MAPLETREE WUXI LOGISTICS PARK FROM SPONSOR AND UPDATES ON DIVESTMENT OF 30 WOODLANDS LOOP
 For Immediate Release MAPLETREE LOGISTICS TRUST ACQUIRES MAPLETREE WUXI LOGISTICS PARK FROM SPONSOR AND UPDATES ON DIVESTMENT OF 30 WOODLANDS LOOP Singapore, 19 November 2012 Mapletree Logistics Trust
Cambridge Industrial Trust Presentation on 3Q2007 Results. 30 Oct 2007
 Cambridge Industrial Trust Presentation on 3Q2007 Results 30 Oct 2007 References in this presentation Unless otherwise stated, all capitalised terms used shall have the same meaning as in the prospectus
SABANA SHARI AH COMPLIANT INDUSTRIAL REIT
 SABANA SHARI AH COMPLIANT INDUSTRIAL REIT 3Q 2017: Third Quarter Ended 30 September 2017 Financial Results Presentation 23 October 2017 Important Notice Disclaimer This presentation shall be read in conjunction