Investor Presentation August 2017
|
|
|
- Edwin Nash
- 6 years ago
- Views:
Transcription
1 Investor Presentation August 2017
2 Important Notice This presentation shall be read in conjunction with Mapletree Industrial Trust s ( MIT ) financial results for First Quarter Financial Year 2017/2018 in the SGXNET announcement dated 25 July This presentation is for information only and does not constitute an offer or solicitation of an offer to sell or invitation to subscribe for or acquire any units in Mapletree Industrial Trust ( Units ). The past performance of the Units and MIT is not indicative of the future performance of MIT or Mapletree Industrial Trust Management Ltd. (the Manager ). The value of Units and the income from them may rise or fall. Units are not obligations of, deposits in or guaranteed by the Manager or any of its affiliates. An investment in Units is subject to investment risks, including the possible loss of the principal amount invested. Investors have no right to request the Manager to redeem their Units while the Units are listed. It is intended that unitholders may only deal in their Units through trading on the Singapore Exchange Securities Trading Limited ( SGX-ST ). Listing of the Units on the SGX-ST does not guarantee a liquid market for the Units. This presentation may also contain forward-looking statements that involve risks and uncertainties. Actual future performance, outcomes and results may differ materially from those expressed in forward-looking statements as a result of risks, uncertainties and assumptions. Representative examples of these factors include general industry and economic conditions, interest rate trends, cost of capital, occupancy rate, construction and development risks, changes in operating expenses (including employees wages, benefits and training costs), governmental and public policy changes and the continued availability of financing. You are cautioned not to place undue reliance on these forward-looking statements, which are based on current view of management on future events. Nothing in this presentation should be construed as financial, investment, business, legal or tax advice and you should consult your own independent professional advisors. 2
3 Contents 1 Overview of Mapletree Industrial Trust 2 Portfolio Highlights 3 1QFY17/18 Financial Performance 4 Outlook and Strategy 3

4 Flatted Factory, Kolam Ayer 1 OVERVIEW OF MAPLETREE INDUSTRIAL TRUST
5 Overview of Mapletree Industrial Trust Sponsor Mapletree Investments Pte Ltd ( MIPL ) Owns 34.3% of MIT Public & Inst Unitholders 65.7% MIPL 34.3% Trustee Investmen t mandate Portfolio Focused on industrial real estate assets in Singapore, excluding properties primarily used for logistics purposes 86 properties valued at S$3.77 billion¹ 20.5 million sq ft GFA 15.6 million sq ft NLA MIT Portfolio Stack-up/ Ramp-up Buildings 12.1% Light Industrial Buildings 2.6% Manager Property Manager Flatted Factories 41.2% Manager Mapletree Industrial Trust Management Ltd. 100% owned by the Sponsor Business Park Buildings 15.1% Portfolio Value Property Manager Trustee Mapletree Facilities Services Pte. Ltd. 100% owned by the Sponsor DBS Trustee Limited Hi-Tech Buildings 29.0% S$3.77 billion 5 1 Based on MIT s book value of investment properties and investment properties under development as at 30 Jun This included 65 Tech Park Crescent which was divested on 20 Jul 2017.


6 Broad Spectrum of Industrial Facilities FLATTED FACTORIES High-rise multi-tenanted industrial buildings with basic common facilities used for light manufacturing activities. STACK-UP/RAMP-UP BUILDINGS Stacked-up factory space with vehicular access to upper floors. Multi-tenanted space suitable for manufacturing and assembly activities. HI-TECH BUILDINGS High specification industrial buildings with higher office content for tenants in technology and knowledge-intensive sectors. Usually fitted with air-conditioned lift lobbies and common areas. LIGHT INDUSTRIAL BUILDINGS Multi-storey developments usually occupied by an anchor tenant for light manufacturing activities. BUSINESS PARK BUILDINGS High-rise multi-tenanted buildings in specially designated Business Park zones. Serve as regional headquarters for MNCs as well as spaces for R&D and knowledge-intensive enterprises. 6

7 Strategically Located across Singapore Close to Public Transportation Networks and Established Industrial Estates Flatted Factories Hi-Tech Buildings Business Park Buildings Stack-up/Ramp-up Buildings Light Industrial Buildings¹ 7 ¹ 65 Tech Park Crescent was divested on 20 Jul 2017.
8 Sustainable and Growing Returns Distributable Income (S$ million) DPU (cents) Q¹ 4Q 1Q 2Q 3Q 4Q 1Q 2Q 3Q 4Q 1Q 2Q 3Q 4Q 1Q 2Q 3Q 4Q 1Q 2Q 3Q 4Q 1Q 2Q 3Q 4Q 1Q 0.00 FY10/11 FY11/12 FY12/13 FY13/14 FY14/15 FY15/16 FY16/17 FY17/18 Distributable Income (S$ million) DPU (cents) ¹ MIT was listed on 21 Oct
9 Healthy Returns since IPO COMPARATIVE TRADING PERFORMANCE SINCE IPO¹ MIT UNIT PRICE +99.5% 150 FTSE ST REITs INDEX +18.0% FTSE STRAITS TIMES INDEX +2.7% MIT s Return on Investment 0 Oct 10 Oct 11 Oct 12 Oct 13 Oct 14 Oct 15 Oct 16 Rebased MIT Unit Price Rebased FTSE ST REITs Index Rebased FTSE Straits Times Index Capital Appreciation Distribution Yield Total Return Listing on 21 Oct 2010 to 22 Aug %² 71.9%³ 171.4% 4 9 ¹ Rebased MIT s issue price of S$0.93 and opening unit prices of FTSE ST REITs Index and FTSE Straits Times Index on 21 Oct 2010 to 100. Source: Bloomberg. ² Based on MIT s closing unit price of S$1.855 on 22 Aug ³ MIT s distribution yield is based on DPU of S$0.669 over the issue price of S$0.93. ⁴ Sum of distributions and capital appreciation for the period over the issue price of S$0.93.


10 S$ billion FY10/11 Portfolio Growth since IPO S$2.70 billion FY11/12 Jul 2011 Acquired Flatted Factories from JTC S$400 million S$2.88 billion FY12/13 S$3.17 billion FY13/14 Jul 2013 Completed AEI at Woodlands Central S$30 million Oct 2013 Completed BTS project for Kulicke & Soffa S$50 million S$3.42 billion FY14/15 S$3.56 billion FY15/16 Oct 2015 Announced new AEI at Kallang Basin 4 S$77 million May 2014 Acquired Light Industrial Building at Changi North S$14 million S$3.75 billion FY16/17 Mar 2017 Secured new BTS data centre S$76 million S$3.77² billion FY17/18 2 Acquisitions 3 Asset Enhancement Initiatives ( AEI ) 4 Build-to-Suit ( BTS ) Projects Jan 2014 Completed AEI at Toa Payoh North 1 S$40 million Jan 2015 Completed BTS data centre for Equinix S$108 million Jun 2017 Completed BTS project for HP Singapore ( HP ) S$226 million 1 Valuation of investment properties as at 31 Mar of each financial year. FY10/11 2 Based FY11/12 on MIT s book value FY12/13 of investment properties FY13/14 and investment properties FY14/15 under development FY15/16 as at 30 Jun FY16/ This included 65 FY17/18 Tech Park Crescent which was divested on 20 Jul

11 Hi-Tech Buildings, build-to-suit project for HP PORTFOLIO HIGHLIGHTS

12 Portfolio Performance Occupancy Gross Rental Rate S$ psf/mth 100% 90% % % $ % $ % 60% $ % 40% $ % $ % 10% 0% $0.50 3Q 4Q 1Q 2Q 3Q 4Q 1Q 2Q 3Q 4Q 1Q 2Q 3Q 4Q 1Q 2Q 3Q 4Q 1Q 2Q 3Q 4Q 1Q 2Q 3Q 4Q 1Q FY10/11 FY11/12 FY12/13 FY13/14 FY14/15 FY15/16 FY16/17 FY17/18 FY17/18 Occupancy (LHS) Rental Rate (RHS) 12
13 Segmental Occupancy Levels 92.5% 91.7% 95.5% 93.8% 90.3% 90.5% 93.9% 94.2% 93.3% 93.7% 93.1% 92.6% Flatted Factories Hi-Tech Buildings Business Park Buildings Stack-Up/Ramp-Up Buildings Light Industrial Buildings MIT Portfolio Left Bar (4QFY16/17) Right Bar (1QFY17/18) 13
14 Rental Revisions Gross Rental Rate (S$ psf/mth) 1 For period 1QFY17/18 $3.82 $3.80 $3.65 $4.05 Before Renewal After Renewal New Leases Passing Rent $1.80 $1.82 $1.69 $1.70 $2.60 $2.55 $2.23 $2.40 $1.30 $1.30 $1.38 $1.57 $1.28 $1.32 Flatted Factories Hi-Tech Buildings Business Park Buildings Stack-Up/Ramp-Up Buildings Light Industrial Buildings2 Renewal Leases 167 Leases (484,524 sq ft) 23 Leases (86,743 sq ft) 12 Leases (102,387 sq ft) 13 Leases (254,967 sq ft) - New Leases 45 Leases (83,763 sq ft) 13 Leases (55,743 sq ft) 11 Leases (23,631 sq ft) 3 Leases (35,005 sq ft) 2 Leases (18,891 sq ft) 1 Gross Rental Rate figures exclude short term leases; except Passing Rent figures which include all leases. 2 Excluded information on the sole renewal lease at Light Industrial Buildings for confidentiality. 14
15 Tenant Retention LONG STAYING TENANTS RETENTION RATE FOR 1QFY17/18 >10 yrs 20.1% Up to 1 yr 10.9% >1 to 2 yrs 7.7% 77.4% 79.7% 77.8% 79.1% 74.8% More than 4 yrs 63.3% 4 yrs or less 36.7% > 2 to 3 yrs 8.7% 52.0% >3 to 4 yrs 9.4% >5 to 10 yrs 36.0% >4 to 5 yrs 7.2% Flatted Factories Hi-Tech Buildings Business Park Buildings Stack-Up / Ramp-Up Buildings Light Industrial Buildings Portfolio As at 30 Jun 2017 By number of tenants. Based on NLA. 63.3% of the tenants have leased the properties for more than 4 years Tenant retention rate of 74.8% in 1QFY17/18 15

16 Lease Expiry Profile EXPIRING LEASES BY GROSS RENTAL INCOME As at 30 June % 21.2% 23.7% 19.6% 15.1% FY17/18 FY18/19 FY19/20 FY20/21 FY21/22 & Beyond Flatted Factories Hi-Tech Buildings Business Park Buildings Stack-up / Ramp-up Buildings Light Industrial Buildings Portfolio WALE by Gross Rental Income = 3.1 years 16
17 Large and Diversified Tenant Base TOP 10 TENANTS BY GROSS RENTAL INCOME As at 30 June % Over 2,000 tenants Largest tenant contributes about 5.3% of Portfolio s Gross Rental Income Top 10 tenants forms 21.1% of Portfolio s Gross Rental Income 3.1% 2.6% 2.2% 1 1.5% 1.5% 1.4% 1.3% 1.2% 1.0% 1 Johnson & Johnson Pte. Ltd. will be terminating its lease 9 months earlier on 30 Sep 2017 with compensation of S$3.1 million. 17


18 Tenant Diversification Across Trade Sectors No single trade sector accounted >19% of Portfolio s Gross Rental Income 18 By Gross Rental Income As at 30 Jun 2017

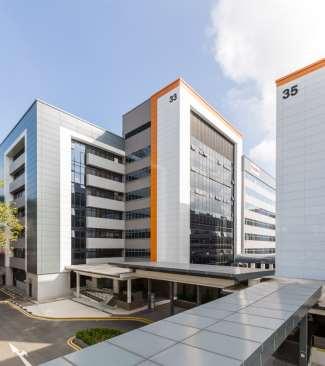
19 BTS Project 1 and 1A Depot Close Completed a 11-storey Hi-Tech Building (Phase One) and a 8-storey Hi-Tech Building (Phase Two) Estimated Cost GFA S$226 million 4 824,500 sq ft Completed MIT s first redevelopment project of a Flatted Factory Cluster into a purpose-built facility for HP 100% committed by HP for lease term of years 1 with annual rental escalations Phase One has a 6-month rent-free period 2 Phase Two lease will commence on 1 Sep 2017 with a rent-free period of 4.5 months 3 Completed Phase One: TOP on 21 Oct 2016 Phase Two: TOP on 22 Jun Rents are on a gross basis. MIT is responsible for property tax and property operating expenses. 2 Distributed over the first 18 months. 3 The first 2 months of rent-free period will begin upon the lease commencement while the remaining 2.5 months will be distributed evenly over the period from 1 Sep 2018 to 29 Feb Includes book value of S$56 million (as at 31 Mar 2014) prior to commencement of redevelopment.
 and improvement works at existing buildings Located at Kallang ipark, an upcoming industrial hub for high value and knowledge-based businesses Completed")
20 AEI 30A Kallang Place and Kallang Basin 4 Cluster Estimated Cost S$77 million Additional GFA 336,000 sq ft Artist s impression of new Hi-Tech Building Completion 1Q2018 Development of 14-storey Hi-Tech Building (at existing car park) and improvement works at existing buildings Located at Kallang ipark, an upcoming industrial hub for high value and knowledge-based businesses Completed sub-structure works Super-structure works completed up to 10 th storey Construction of 10 th storey slab and columns 20

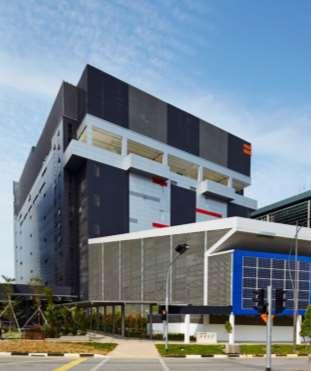
21 BTS Project New Data Centre Estimated Cost S$76 million¹ GFA 242,000 sq ft Artist s impression of the BTS data centre in the West Region of Singapore Completion 2H2018 Development of a six-storey BTS data centre 100% committed by an established data centre operator Initial lease term of >10 years with staggered rental escalations and renewal options Situated on land area of about 96,800 sq ft Site allocated by JTC with zoning for Business 2 use and land tenure of 30 years Located in a specialised industrial park for data centres with ready-built infrastructure Construction of pile caps and other sub-structure works is underway 21 1 Total development cost increased from S$60 million to S$76 million due to additional builder s works.
 Contributed 0.")
22 Divestment 65 Tech Park Crescent Completion of divestment of a three-storey Light Industrial Building with two mezzanine levels Sale price was above acquisition price of S$13.2 million 1 and book value of S$17.6 million 2 60-year land lease from 18 Aug 1993 (balance of 36 years) Contributed 0.3% to MIT portfolio s gross revenue in FY16/17 Use of proceeds from divestment to fund committed development projects Sale Price S$ million GFA 107,373 sq ft Completed 20 Jul Acquired by MIT on 21 Oct 2010 as part of the initial public offering portfolio. 2 As at 31 Mar 2017.
23 Committed Sponsor with Aligned Interest REPUTABLE SPONSOR BENEFITS TO MIT Leading real estate development, investment and capital management company Owns and manages S$39.5 billion¹ of office, retail, logistics, industrial, residential, corporate lodging / serviced apartment, and student housing properties Manages 4 Singapore-listed real estate investment trusts and 6 private equity real estate funds with assets in Asia Pacific, UK and US Assets across 12 economies globally, with offices in Asia Pacific, UK and US¹ 23 ¹ As at 31 Mar ² Excluding Mapletree Business City. 1. Leverage on Sponsor s network Leverage on Mapletree s financial strength, market reach and network 2. Alignment of Sponsor s interest with Unitholders Mapletree s stake of 34.3% demonstrates support in MIT 3. In-house development capabilities Able to support growth of MIT by providing development capabilities 4. Right of First Refusal to MIT Sponsor has granted right of first refusal to MIT over future sale or acquisition of industrial or business park properties in Singapore² Sponsor won the government tender for a 126,700 sq ft industrial site located next to Tai Seng MRT Station (18 Tai Seng)

24 Business Park Buildings, The Strategy and The Synergy 1QFY17/18 FINANCIAL PERFORMANCE
25 1QFY17/18 Results Highlights Consistent performance driven mainly by revenue contribution from Phase One of BTS project for HP 1QFY17/18 Distributable Income: S$52.9 million ( 2.7% y-o-y) 1QFY17/18 DPU: 2.92 cents ( 2.5% y-o-y) Portfolio performance in 1QFY17/18 Average portfolio passing rental rate increased to S$1.95 psf/mth Average portfolio occupancy of 92.6% Successfully completed largest BTS project for HP in Jun 2017 Phase Two lease will commence on 1 Sep 2017 with a rent-free period of 4.5 months Divestment of 65 Tech Park Crescent was announced in 1QFY17/18 and completed on 20 Jul 2017 Prudent capital management Low aggregate leverage of 29.8% Hedged borrowings of 72.8% 25
26 Statement of Total Returns (Year-on-Year) 1QFY17/18 (S$ 000) 1QFY16/17 (S$ 000) / () Gross revenue 88,812 84, % Property operating expenses (20,620) (20,293) 1.6% Net property income 68,192 63, % Borrowing costs (7,874) (6,481) 21.5% Trust expenses (7,693) (7,187) 7.0% Total return for the period before tax 52,625 50, % Income tax credit - * ** Total return for the period after tax 52,625 50, % Net non-tax deductible items 280 1,381 (79.7%) Amount available for distribution 52,905 51, % Distribution per Unit (cents) % * Amount less than S$1,000 ** Not meaningful 26
27 Statement of Total Returns (Qtr-on-Qtr) 1QFY17/18 (S$ 000) 4QFY16/17 (S$ 000) / () Gross revenue 88,812 87, % Property operating expenses (20,620) (21,840) (5.6%) Net property income 68,192 65, % Borrowing costs (7,874) (7,263) 8.4% Trust expenses (7,693) (7,374) 4.3% Net income 52,625 51, % Net fair value gain on investment properties and investment properties under development - 70,236 ** Total return for the period before tax 52, ,571 (56.7%) Income tax expense - (*) ** Total return for the period after tax 52, ,571 (56.7%) Net non-tax deductible items 280 (69,821) ** Amount available for distribution 52,905 51, % 27 Distribution per Unit (cents) % * Amount less than S$1,000 ** Not meaningful
28 Balance Sheet 30 Jun Mar 2017 / () Total assets (S$ 000) 3,819,454 3,798, % Total liabilities (S$ 000) 1,288,313 1,265, % Net assets attributable to Unitholders (S$ 000) 2,531,141 2,532,789 (0.1%) Net asset value per Unit (S$) (0.7%) 1 Net tangible asset per unit was the same as net asset value per unit as there were no intangible assets as at the statement of position dates. 2 The net asset value per Unit as at 30 Jun 2017 was lower for MIT Group and MIT mainly arising from the lower valuation of the interest rate swaps recognised in the hedging reserve as at 30 Jun
29 Strong Balance Sheet 30 Jun Mar 2017 Total debt S$1,139.5 million S$1,107.9 million Aggregate leverage ratio Weighted average tenor of debt 29.8% 29.2% 3.4 years 3.5 years Strong balance sheet to pursue growth opportunities BBB+ rating with Stable Outlook by Fitch Ratings 100% of loans unsecured with minimal covenants 29
30 Well Diversified Debt Maturity Profile DEBT MATURITY PROFILE As at 30 June 2017 Weighted Average Tenor of Debt = 3.4 years 27.4% 16.2% 15.4% % % 8.8% 8.3% % FY17/18 FY18/19 FY19/20 FY20/21 FY21/22 FY22/23 FY23/24 FY24/25 FY25/26 Bank Borrowings MTN * Amounts in S$ million
31 Interest Rate Risk Management Fixed as a % of total debt Weighted average hedge tenor 30 Jun Mar % 74.9% 3.7 years 4.0 years No hedges are due to expire in FY17/18 1QFY17/18 4QFY16/17 Weighted average all-in funding cost Interest coverage ratio 2.8% 2.7% 7.2 times 7.7 times 31

32 Stack-up/Ramp-up Buildings, Woodlands Spectrum OUTLOOK AND STRATEGY

² and movement of tenants are expected to exert pressure on rental and occupancy rates")
 Business Park Space: S$4.10 psf/mth (+3.")
33 Outlook DEMAND AND SUPPLY FOR MULTI-USER FACTORIES DEMAND AND SUPPLY FOR BUSINESS PARKS Singapore economy grew by 2.9% y-o-y in 2Q2017¹ Faster than 2.5% growth in 1Q2017 On track to achieve growth forecast of 2.0% 3.0% for 2017 Uncertain business environment Potential net new supply of 1.4 million sq m in 2017 (~3.9% of existing stock of factory space)² and movement of tenants are expected to exert pressure on rental and occupancy rates Moderation in quantum of industrial land released through Industrial Government Land Sales Programme since 2013 Median rents for industrial real estate for 2Q2017 Multi-user Factory Space: S$1.81 psf/mth (-1.1% q-o-q) Business Park Space: S$4.10 psf/mth (+3.3% q-o-q) 33 1 Ministry of Trade and Industry ( MTI ), 11 Aug URA/JTC Realis, 27 Jul 2017


34 Delivering Sustainable Returns SECURE investments to deliver growth and diversification Pursue DPU-accretive acquisitions and development projects Secure BTS projects with pre-commitments from high-quality tenants Consider opportunistic divestments Valuecreating Investment Management Prudent Capital Management Proactive Asset Management IMPROVE competitiveness of properties Implement proactive marketing and leasing initiatives Deliver quality service and customised solutions Improve cost effectiveness to mitigate rising operating costs Unlock value through AEI OPTIMISE capital structure to provide financial flexibility 34 Maintain a strong balance sheet Diversify sources of funding Employ appropriate interest rate management strategies
35 End of Presentation For enquiries, please contact Ms Melissa Tan, Vice President, Investor Relations, DID: (65) ,
Investor Presentation March 2016
 Investor Presentation March 2016 Important Notice This presentation shall be read in conjunction with Mapletree Industrial Trust s ( MIT ) financial results for Third Quarter Financial Year 2015/2016 in
Investor Presentation November 2015
 Investor Presentation November 2015 Important Notice This presentation shall be read in conjunction with Mapletree Industrial Trust s ( MIT ) financial results for Second Quarter Financial Year 2015/2016
Notice of Annual General Meeting
 7 th Annual General Meeting 18 July 2017 Important Notice This presentation shall be read in conjunction with Mapletree Industrial Trust s ( MIT ) financial statements for the financial year ended 31 March
Investor Presentation May 2018
 Investor Presentation May 2018 14 May 2018 Important Notice This presentation shall be read in conjunction with Mapletree Industrial Trust s ( MIT ) financial results for Fourth Quarter Financial Year
Investor Presentation. May 2013
 Investor Presentation May 2013 DISCLAIMER This presentation is for information only and does not constitute an offer or solicitation of an offer to subscribe for, acquire, purchase, dispose of or sell
Mapletree Industrial Trust Achieves Distribution Per Unit of 2.05 Cents for 2QFY2011 at 10.8% above Forecast 1
 PRESS RELEASE Mapletree Industrial Trust Achieves Distribution Per Unit of 2.05 Cents for 2QFY2011 at 10.8% above Forecast 1 Distribution per Unit ( DPU ) of 2.05 cents, higher than IPO Forecast ( Forecast
Investor Presentation. March 2011
 Investor Presentation March 2011 Mapletree Industrial Trust ( MIT ) Overview of Mapletree Industrial Trust Portfolio Highlights Robust, Resilient, Relevant & Reputable Financial Highlights First Financial
Mapletree Industrial Trust Delivers 9.0% Year-on-Year Growth for 1QFY13/14 Distributable Income
 (Constituted in Republic of Singapore pursuant to a Trust Deed dated 29 January 2008 (as amended)) PRESS RELEASE Mapletree Industrial Trust Delivers 9.0% Year-on-Year Growth for 1QFY13/14 Distributable
Mapletree Industrial Trust s 2QFY13/14 Distributable Income Increased 9.7% Year-on-Year to S$41.1 million
 (Constituted in Republic of Singapore pursuant to a Trust Deed dated 29 January 2008 (as amended)) PRESS RELEASE Mapletree Industrial Trust s 2QFY13/14 Distributable Income Increased 9.7% Year-on-Year
Mapletree Industrial Trust s 3QFY17/18 Distributable Income Grows 4.6% Year-on-Year
 (Constituted in the Republic of Singapore pursuant to a Trust Deed dated 29 January 2008 (as amended)) PRESS RELEASE Mapletree Industrial Trust s 3QFY17/18 Distributable Income Grows 4.6% Year-on-Year
Mapletree Industrial Trust Achieves 12.0% Year-on-Year Increase in Distributable Income for 3QFY13/14
 (Constituted in Republic of Singapore pursuant to a Trust Deed dated 29 January 2008 (as amended)) PRESS RELEASE Mapletree Industrial Trust Achieves 12.0% Year-on-Year Increase in Distributable Income
Mapletree Industrial Trust Achieves Distributable Income of S$35.8 million for 4QFY11/12
 (Constituted in Republic of Singapore pursuant to a Trust Deed dated 29 January 2008 (as amended)) PRESS RELEASE Mapletree Industrial Trust Achieves Distributable Income of S$35.8 million for 4QFY11/12
OSK DMG ASEAN & Hong Kong Corporate Day June 2012
 OSK DMG ASEAN & Hong Kong Corporate Day 26-28 June 2012 2 Important Notice This material shall be read in conjunction with CIT s financial statements for the financial period ended 31 March 2012. The value
Mapletree Industrial Trust s 2QFY17/18 Distribution per Unit Increases 6.0% Year-on-Year
 NOT FOR DISTRIBUTION IN OR INTO THE UNITED STATES, EUROPEAN ECONOMIC AREA, CANADA, JAPAN OR AUSTRALIA (Constituted in the Republic of Singapore pursuant to a Trust Deed dated 29 January 2008 (as amended))
(Constituted in the Republic of Singapore pursuant to a Trust Deed dated 29 January 2008 (as amended))
)") (Constituted in the Republic of Singapore pursuant to a Trust Deed dated 29 January 2008 (as amended)) MAPLETREE INDUSTRIAL TRUST UNAUDITED FINANCIAL STATEMENT AND DISTRIBUTION TABLE OF CONTENTS Item No.
(Constituted in the Republic of Singapore pursuant to a Trust Deed dated 29 January 2008 (as amended)) MAPLETREE INDUSTRIAL TRUST UNAUDITED FINANCIAL STATEMENT AND DISTRIBUTION TABLE OF CONTENTS Item No.
FY2014 Financial Results Presentation
 FY2014 Financial Results Presentation 16 January 2015 16 International Business Park Important Notice This material shall be read in conjunction with CIT s results announcements for the financial period
MAPLETREE INDUSTRIAL TRUST UNAUDITED FINANCIAL STATEMENT AND DISTRIBUTION ANNOUNCEMENT FOR THE FINANCIAL PERIOD FROM 1 APRIL 2018 TO 30 JUNE 2018
 (Constituted in the Republic of Singapore pursuant to a Trust Deed dated 29 January 2008 (as amended)) MAPLETREE INDUSTRIAL TRUST UNAUDITED FINANCIAL STATEMENT AND DISTRIBUTION TABLE OF CONTENTS Item No.
3Q2016 Financial Results Presentation 26 October Pioneer Crescent
 3Q2016 Financial Results Presentation 26 October 2016 25 Pioneer Crescent Content Executive Summary Real Estate Highlights Financial & Capital Management Highlights Appendix 2 3Q2016 Executive Summary
4QFY2013 and 2HFY2013 Results Presentation. January 2014
 4QFY2013 and 2HFY2013 Results Presentation January 2014 1 Disclaimer This presentation should be read in conjunction with the financial statements of Soilbuild Business Space REIT for the period from 1
Financial Results for the Quarter / Year Ended 31 Mar April 2012
 Financial Results for the Quarter / Year Ended 31 Mar 2012 19 April 2012 Disclaimer This Presentation is focused on comparing results for the three months ended 31 Mar 2012 versus results achieved in the
2Q2014 Financial Results 24 July Creating Value & Delivering Growth
 2Q2014 Financial Results 24 July 2014 1 Creating Value & Delivering Growth Important Notice This material shall be read in conjunction with CIT s financial statements for the financial period ended 30
Citi ASEAN Conference 12 June Tai Seng Street
 Citi ASEAN Conference 12 June 2014 1 16 Tai Seng Street Important Notice This material shall be read in conjunction with CIT s financial statements for the financial period ended 31 Mar 2014. The value
SGX REIT & BT SEMINAR Tokyo, 30 June Pioneer Crescent
 SGX REIT & BT SEMINAR Tokyo, 30 June 3016 25 Pioneer Crescent Singapore Industrial REITs (S-REITs) 3 Key Features Bond-like listed security ( Dividend Play ) that provides steady income distribution stream
3Q 2012 Presentation Slides. 1 Nov 2012
 3Q 2012 Presentation Slides 1 Nov 2012 2 Important Notice This material shall be read in conjunction with CIT s financial statements for the financial period ended 30 Sep 2012. The value of units in CIT
AIMS AMP CAPITAL INDUSTRIAL REIT
 AIMS AMP CAPITAL INDUSTRIAL REIT 3 rd Quarter Ended 31 December 2011 Results Presentation 20 January 2012 Important Notice Disclaimer This Presentation is focused on comparing actual results for the financial
MAPLETREE LOGISTICS TRUST S 1Q FY14/15 DISTRIBUTION PER UNIT RISES 6% to 1.90 CENTS
 For Immediate Release MAPLETREE LOGISTICS TRUST S 1Q FY14/15 DISTRIBUTION PER UNIT RISES 6% to 1.90 CENTS Highlights: 6% year-on-year growth in amount distributable to Unitholders to S$46.6 million Recent
FY2015 Financial Results Presentation
 FY2015 Financial Results Presentation 14 January 2016 16 International Business Park 2 Content Executive Summary Financial Summary Real Estate Highlights Financial & Capital Management Highlights Appendix
(Constituted in the Republic of Singapore pursuant to a Trust Deed dated 29 January 2008 (as amended))
)") (Constituted in the Republic of Singapore pursuant to a Trust Deed dated 29 January 2008 (as amended)) MAPLETREE INDUSTRIAL TRUST FINANCIAL STATEMENT AND DISTRIBUTION TABLE OF CONTENTS Item No. Description
(Constituted in the Republic of Singapore pursuant to a Trust Deed dated 29 January 2008 (as amended)) MAPLETREE INDUSTRIAL TRUST FINANCIAL STATEMENT AND DISTRIBUTION TABLE OF CONTENTS Item No. Description
SGX-REITAS Education Series
 SGX-REITAS Education Series 23 February 2016 16 International Business Park 2 Executive Summary Singapore Industrial Real Estate Sector Overview Role of Regulators in the Industrial Sector Overview of
AIMS AMP CAPITAL INDUSTRIAL REIT
 AIMS AMP CAPITAL INDUSTRIAL REIT FY2013: 2 nd Quarter Ended 30 September 2012 Results Presentation 24 October 2012 Important Notice Disclaimer This Presentation is focused on comparing actual results for
Sabana Shari ah Compliant Industrial REIT 3Q 2018 Financial Results Presentation. 26 October 2018
 Sabana Shari ah Compliant Industrial REIT 3Q 2018 Financial Results Presentation 26 October 2018 Important Notice Disclaimer This presentation shall be read in conjunction with the financial information
Balance Sheet Positioned for Future Growth with No Major Refinancing Due Until 2016
 (Constituted in the Republic of Singapore pursuant to a trust deed dated 31 March 2006 (as amended)) Press Release Balance Sheet Positioned for Future Growth with No Major Refinancing Due Until 2016 Refinanced
AIMS AMP CAPITAL INDUSTRIAL REIT
 AIMS AMP CAPITAL INDUSTRIAL REIT FY2014: Third Quarter ended 31 December 2013 Results Presentation 29 January 2014 Important notice Disclaimer This Presentation is focused on comparing actual results for
FY2012 Financial Results Presentation
 FY2012 Financial Results Presentation 21 January 2013 Knowing. Believing. Delivering ARA-CWT Trust Management (Cache) Limited Agenda Overview & FY12 Key Highlights 4QFY12 & FY12 Full Year Financial Performance
Hong Kong Non-Deal Roadshow Hong Kong, 4 March International Business Park
 Hong Kong Non-Deal Roadshow Hong Kong, 4 March 2016 16 International Business Park 2 Content CIT FY2015 Results Executive Summary Financial Summary Real Estate Highlights Financial & Capital Management
Investor Presentation for Citi ASEAN Investor Conference. 12 June 2014
 Investor Presentation for Citi ASEAN Investor Conference 2 June 204 Important Notice Standard Chartered Securities (Singapore) Pte. Limited, CIMB Bank Berhad, Singapore Branch and Oversea-Chinese Banking
AIMS AMP CAPITAL INDUSTRIAL REIT
 AIMS AMP CAPITAL INDUSTRIAL REIT FY2019: First Quarter Financial Results Ended 30 June 2018 Results Presentation 26 July 2018 1 Important notice Disclaimer This Presentation is focused on comparing actual
1Q FY2009/10 Financial Results Presentation 17 July 2009
 1Q FY2009/10 Financial Results Presentation 17 July 2009 Disclaimers This Presentation is focused on comparing results for the three months ended 30 June 2009 versus actual results year-on-year ( yoy ).
MAPLETREE LOGISTICS TRUST S QUARTERLY DISTRIBUTION PER UNIT RISES 10% YEAR-ON-YEAR
 For Immediate Release MAPLETREE LOGISTICS TRUST S QUARTERLY DISTRIBUTION PER UNIT RISES 10% YEAR-ON-YEAR Highlights: Distribution Per Unit ( DPU ) of 1.70 cents for the 3 months ended 31 March 2012 Portfolio
CIT reports steady 2Q2015 results and improved capital structure
 (Constituted in the Republic of Singapore pursuant to a trust deed dated 31 March 2006 (as amended)) Press Release CIT reports steady 2Q2015 results and improved capital structure Net property income increased
Viva Industrial Trust 4Q2017 & FY2017 Results Presentation. 26 January 2018
 Viva Industrial Trust 4Q2017 & FY2017 Results Presentation 26 January 2018 1 Important Notice This presentation is for information purposes only and does not constitute or form part of an offer, invitation
CLSA Asean Forum Bangkok, March International Business Park
 CLSA Asean Forum Bangkok, March 2016 16 International Business Park 2 Content Overview of CIT CIT FY2015 Financial Results Overview Financial & Capital Management Highlights Real Estate Highlights Singapore
Financial Results for 3 rd Quarter November 2017
 Financial Results for 3 rd Quarter 2017 2 November 2017 Important Notice This presentation shall be read in conjunction with OUE Commercial REIT s Financial Results announcement for 3Q 2017 dated 2 November
Macquarie ASEAN Conference. 26 Aug 2014
 Macquarie ASEAN Conference 26 Aug 2014 Important Notice Standard Chartered Securities (Singapore) Pte. Limited, CIMB Bank Berhad, Singapore Branch and Oversea-Chinese Banking Corporation Limited were the
MAPLETREE LOGISTICS TRUST S 3Q FY13/14 DISTRIBUTION PER UNIT RISES 7% YEAR-ON-YEAR
 For Immediate Release MAPLETREE LOGISTICS TRUST S 3Q FY13/14 DISTRIBUTION PER UNIT RISES 7% YEAR-ON-YEAR Highlights: Amount Distributable to Unitholders registered 8% year-on-year growth Results underpinned
AIMS AMP CAPITAL INDUSTRIAL REIT
 AIMS AMP CAPITAL INDUSTRIAL REIT FY2016: First Quarter Financial Results Ended 30 June 2015 Results Presentation 29 July 2015 Important notice Disclaimer This Presentation is focused on comparing actual
Mapletree Commercial Trust s Distribution Per Unit for 2Q FY17/18 Up 9.3% to 2.24 Singapore Cents
 For Immediate Release Mapletree Commercial Trust s Distribution Per Unit for 2Q FY17/18 Up 9.3% to 2.24 Singapore Cents Gross revenue and net property income ( NPI ) for 2Q FY17/18 grew 21.7% and 23.4%
Mapletree Commercial Trust Results Announcement. For the period 27 April 2011 to 30 June 2011
 Mapletree Commercial Trust Results Announcement For the period 27 April 2011 to 30 June 2011 Disclaimer This presentation is for information only and does not constitute an invitation or offer to acquire,
Financial Results for the Quarter Ended 31 Dec January 2012
 Financial Results for the Quarter Ended 31 Dec 2011 19 January 2012 Disclaimer This Presentation is focused on comparing results for the three months ended 31 Dec 2011 versus results achieved in the three
MAPLETREE LOGISTICS TRUST S 4Q FY17/18 DISTRIBUTION PER UNIT RISES 4% TO CENTS
 For Immediate Release MAPLETREE LOGISTICS TRUST S 4Q FY17/18 DISTRIBUTION PER UNIT RISES 4% TO 1.937 CENTS Highlights: 4Q FY17/18 amount distributable to Unitholders grew 27% year-on-year to S$59.2 million
26 April ARA-CWT Trust Management (Cache) Limited
 Limited") 1Q 2011 Financial Results 26 April 2011 ARA-CWT Trust Management (Cache) Limited Agenda 1Q 2011 Financial i Results Portfolio Update Going Forward 2 Highlights 1Q 2011 Results Property Income slightly
1Q 2011 Financial Results 26 April 2011 ARA-CWT Trust Management (Cache) Limited Agenda 1Q 2011 Financial i Results Portfolio Update Going Forward 2 Highlights 1Q 2011 Results Property Income slightly
FINANCIAL RESULTS For First Quarter ended 31 March 2015
 FINANCIAL RESULTS For First Quarter ended 31 March 2015 AGENDA Q1 Highlights Financial Performance Portfolio Performance AEI Updates Looking Ahead Unit Performance 2 Q1 HIGHLIGHTS Q1 HIGHLIGHTS FINANCIAL
3Q2010 Financial Results. 20 October 2010
 3Q2010 Financial Results 20 October 2010 important notice The value of units in CIT ( Units ) and the income derived from them may fall as well as rise. Units are not investments, liabilities or obligations
27 January ARA-CWT Trust Management (Cache) Limited
 Limited") 4Q 2010 Financial Results 27 January 2011 ARA-CWT Trust Management (Cache) Limited Agenda 4Q 2010 Financial Results Portfolio Update Going Forward 2 Highlights 4Q 2010 Results Net Property Income of S$14.4m
4Q 2010 Financial Results 27 January 2011 ARA-CWT Trust Management (Cache) Limited Agenda 4Q 2010 Financial Results Portfolio Update Going Forward 2 Highlights 4Q 2010 Results Net Property Income of S$14.4m
6 th Annual General Meeting 24 April International Business Park
 6 th Annual General Meeting 24 April 2015 16 International Business Park Important Notice This material shall be read in conjunction with CIT s results announcements for the financial period ended 31 December
Singapore Investor Roadshow
 Singapore Investor Roadshow 11 May 2015 16 International Business Park Important Notice This material shall be read in conjunction with CIT s results announcements for the financial period ended 31 December
Mapletree Commercial Trust s Distribution Per Unit for YTD FY17/18 Up 6.4% to 6.77 Singapore Cents
 For Immediate Release Mapletree Commercial Trust s Distribution Per Unit for YTD FY17/18 Up 6.4% to 6.77 Singapore Cents Gross revenue and net property income ( NPI ) for 3Q FY17/18 grew 0.8% and 1.9%
AIMS AMP CAPITAL INDUSTRIAL REIT
 AIMS AMP CAPITAL INDUSTRIAL REIT FY2018: Fourth Quarter Financial Results Ended 31 March 2018 Results Presentation 25 April 2018 1 Important notice Disclaimer This Presentation is focused on comparing
Financial Results for 4 th Quarter and Year Ended 31 December January 2019
 Financial Results for 4 th Quarter and Year Ended 31 December 2018 30 January 2019 Important Notice This presentation should be read in conjunction with the announcements released by OUE Commercial REIT
Mapletree Commercial Trust s Distribution Per Unit for 1Q FY17/18 Rose 9.9% to 2.23 Singapore Cents
 For Immediate Release Mapletree Commercial Trust s Distribution Per Unit for 1Q FY17/18 Rose 9.9% to 2.23 Singapore Cents Gross revenue and net property income ( NPI ) for 1Q FY17/18 grew 46.9% and 49.6%
Presentation for REITs Symposium 2017
 Presentation for REITs Symposium 2017 27 May 2017 Important Notice This presentation shall be read in conjunction with OUE Commercial REIT s Financial Results announcement for 1Q 2017 dated 5 May 2017.
MAPLETREE LOGISTICS TRUST DELIVERS 1.71 CENTS DISTRIBUTION PER UNIT FOR 2Q FY12/13
 For Immediate Release MAPLETREE LOGISTICS TRUST DELIVERS 1.71 CENTS DISTRIBUTION PER UNIT FOR 2Q FY12/13 Highlights: Amount distributable to Unitholders of S$41.4 million 99.2% occupancy rate, positive
Financial Results Presentation 3Q2017
 Financial Results Presentation 3Q2017 Contents A 3Q2017 Results B C Financial Performance Prudent Capital Management D Real Estate Highlights E Market Outlook F Appendix 2 3Q2017 Results 3Q2017 At A Glance
Investor Presentation
 Investor Presentation 15 September 2011 Knowing. Believing. Delivering ARA-CWT Trust Management (Cache) Limited Agenda REIT Overview Management Strategy 2Q 2011 Financial Results Portfolio Update Going
AIMS AMP CAPITAL INDUSTRIAL REIT
 AIMS AMP CAPITAL INDUSTRIAL REIT FY2016: Second Quarter Financial Results Ended 30 September 2015 Results Presentation 29 October 2015 Important notice Disclaimer This Presentation is focused on comparing
REITs Symposium May 2018
 REITs Symposium 2018 19 May 2018 Important Notice This presentation shall be read in conjunction with OUE Commercial REIT s Financial Results announcement for 1Q 2018 dated 10 May 2018. This presentation
EC WORLD REIT Reports 2.6% Higher DPU for FY2018; Proposes Entry into New Master Lease Agreements to Significantly Lengthen Lease Expiry Profile
 NEWS RELEASE EC WORLD REIT Reports 2.6% Higher DPU for FY2018; Proposes Entry into New Master Lease Agreements to Significantly Lengthen Lease Expiry Profile 2.6% year-on-year ( y-o-y ) increase in DPU
Mapletree Commercial Trust s Income Available for Distribution for 2Q FY16/17 grew 25.4% year-on-year to S$53.7 million
 For Immediate Release Mapletree Commercial Trust s Income Available for Distribution for 2Q FY16/17 grew 25.4% year-on-year to S$53.7 million Gross revenue and net property income ( NPI ) for 2Q FY16/17
Mapletree Commercial Trust s 3Q FY18/19 Net Property Income Grew 2.2% Year-on-Year Distribution Per Unit Up 1.3% to 2.
 For Immediate Release Mapletree Commercial Trust s 3Q FY18/19 Net Property Income Grew 2.2% Year-on-Year Distribution Per Unit Up 1.3% to 2.33 Singapore Cents Gross revenue and net property income ( NPI
Financial Results for 3 rd Quarter 2016
 Financial Results for 3 rd Quarter 2016 1 November 2016 Important Notice This presentation shall be read in conjunction with OUE Commercial REIT s Financial Results announcement for 3Q 2016 dated 1 November
MAPLETREE LOGISTICS TRUST S 1Q FY17/18 DPU RISES 2% YEAR-ON-YEAR TO CENTS
 For Immediate Release MAPLETREE LOGISTICS TRUST S 1Q FY17/18 DPU RISES 2% YEAR-ON-YEAR TO 1.887 CENTS Highlights: Amount distributable to Unitholders grew 2.5% year-on-year to S$47.2 million Stable operations
SABANA SHARI AH COMPLIANT INDUSTRIAL REIT
 SABANA SHARI AH COMPLIANT INDUSTRIAL REIT 1Q 2015: First Quarter Ended 31 March 2015 Financial Results Presentation 20 April 2015 Important Notice Disclaimer This presentation shall be read in conjunction
AIMS AMP CAPITAL INDUSTRIAL REIT
 AIMS AMP CAPITAL INDUSTRIAL REIT FY2018: Second Quarter Financial Results Ended 30 September 2017 Results Presentation 26 October 2017 1 Important notice Disclaimer This Presentation is focused on comparing
PROPOSED ACQUISITION OF 16 TAI SENG STREET
 (Constituted in the Republic of Singapore pursuant to a trust deed dated 31 March 2006 (as amended)) PROPOSED ACQUISITION OF 16 TAI SENG STREET 1. PROPOSED ACQUISITION OF 16 TAI SENG STREET 1.1 Cambridge
Viva Industrial Trust 3Q2014 Financial Results. 21 October 2014
 Viva Industrial Trust 3Q2014 Financial Results 21 October 2014 Important Notice This presentation is for information purposes only and does not constitute or form part of an offer, invitation or solicitation
Acquisition of 7000 AMK and the Proposed Equity Fund Raising. 14 December 2017
 Acquisition of 7000 AMK and the Proposed Equity Fund Raising 14 December 2017 Contents A Overview B Benefits of the Acquisition C Funding Structure and Financial Impact D Recent Developments E Conclusion
Citi-REITAS-SGX C-Suite Singapore REITs and Sponsors Forum
 Citi-REITAS-SGX C-Suite Singapore REITs and Sponsors Forum 23 August 2018 Important Notice This presentation shall be read in conjunction with OUE Commercial REIT s Financial Results announcement for 2Q
Financial Results for 4 th Quarter 2017 and Year Ended 31 December 2017
 Financial Results for 4 th Quarter 2017 and Year Ended 31 December 2017 31 January 2018 Important Notice This presentation shall be read in conjunction with OUE Commercial REIT s Financial Results announcement
Investor Presentation for Tokyo Non-Deal Roadshow. 25 August 2016
 Investor Presentation for Tokyo Non-Deal Roadshow 25 August 2016 Important Notice This presentation shall be read in conjunction with OUE Commercial REIT s Financial Results announcement for 1Q 2016 dated
MAPLETREE LOGISTICS TRUST DELIVERS STEADY PERFORMANCE FOR 1H FY16/17
 For Immediate Release MAPLETREE LOGISTICS TRUST DELIVERS STEADY PERFORMANCE FOR 1H FY16/17 Highlights: Maintained DPU at 1.86 cents for 2Q FY16/17 and 3.71 cents for 1H FY16/17 Stable portfolio occupancy
AIMS AMP CAPITAL INDUSTRIAL REIT
 AIMS AMP CAPITAL INDUSTRIAL REIT 8 th ANNUAL GENERAL MEETING PRESENTATION 27 July 2017 1 Important notice Disclaimer This Presentation is focused on comparing actual results for the financial period from
Cambridge Industrial Trust Financial results for the first quarter ended 31 March April
 1 Cambridge Industrial Trust Financial results for the first quarter ended 31 March 2010 21 April 2010 www.cambridgeindustrialtrust.com important notice 2 The value of units in CIT ( Units ) and the income
FY2018 Results Presentation. 22 Jan 2019
 FY2018 Results Presentation 22 Jan 2019 Disclaimer This presentation may contain forward-looking statements that involve assumptions, risks and uncertainties. Actual future performance, outcomes and results
SGX - DBS Vickers - REITAS SREITS Corporate Day Investor Presentation
 SGX - DBS Vickers - REITAS SREITS Corporate Day Investor Presentation 27 Feb 1 Mar 2018 Important Notice This presentation shall be read in conjunction with OUE Commercial REIT s Financial Results announcement
Mapletree Commercial Trust s Distribution per Unit for 1Q FY15/16 1 rose 3.1% year-on-year
 For Immediate Release Mapletree Commercial Trust s Distribution per Unit for 1Q FY15/16 1 rose 3.1% year-on-year Distribution per Unit ( DPU ) for 1Q FY15/16 up 3.1%, to 2.01 cents Property Operating Expenses
AIMS AMP CAPITAL INDUSTRIAL REIT MANAGEMENT LIMITED
 AIMS AMP CAPITAL INDUSTRIAL REIT MANAGEMENT LIMITED As Manager of AIMS AMP Capital Industrial REIT 1 Raffles Place, #21-01 One Raffles Place Singapore 048616 (Constituted in the Republic of Singapore pursuant
VIVA INDUSTRIAL TRUST POSTS Q2 DPS OF CENTS
 Viva Industrial Trust Management Pte. Ltd. Viva Asset Management Pte. Ltd. 750 Chai Chee Road #04-03 Technopark@Chai Chee Singapore 469000 NEWS RELEASE VIVA INDUSTRIAL TRUST POSTS Q2 DPS OF 1.723 CENTS
1Q2009 Results. 24 April 2009
 Cambridge Industrial Trust 1Q2009 Results 24 April 2009 Presentation Outline 1Q09 Highlights ht 1Q09 Financial Highlights Risk Management Strategy for 2009 2 1Q09 Achievements Occupancy remains high at
Equity Fund Raising and Acquisitions. 21 October 2010
 Equity Fund Raising and Acquisitions 21 October 2010 important notice The value of units in CIT ( Units ) and the income derived from them may fall as well as rise. Units are not investments, liabilities
SABANA SHARI AH COMPLIANT INDUSTRIAL REIT
 SABANA SHARI AH COMPLIANT INDUSTRIAL REIT 3Q 2017: Third Quarter Ended 30 September 2017 Financial Results Presentation 23 October 2017 Important Notice Disclaimer This presentation shall be read in conjunction
Mapletree Commercial Trust s Distribution Per Unit for Full Year Up 4.9% to 9.04 Singapore Cents
 For Immediate Release Mapletree Commercial Trust s Distribution Per Unit for Full Year Up 4.9% to 9.04 Singapore Cents Gross revenue and net property income ( NPI ) for 4Q FY17/18 grew 1.3% and 1.2% respectively
Cambridge Industrial Trust Presentation on 3Q2007 Results. 30 Oct 2007
 Cambridge Industrial Trust Presentation on 3Q2007 Results 30 Oct 2007 References in this presentation Unless otherwise stated, all capitalised terms used shall have the same meaning as in the prospectus
Mapletree Commercial Trust
 Mapletree Commercial Trust 3Q FY17/18 Financial Results 24 January 2018 1 Important Notice This presentation is for information only and does not constitute an offer or solicitation of an offer to sell
AIMS AMP Capital Industrial REIT announces DPU of 2.50 cents in 1Q FY2019
 AIMS AMP CAPITAL INDUSTRIAL REIT MANAGEMENT LIMITED As Manager of AIMS AMP Capital Industrial REIT One George Street, #23-03 Singapore 049145 Media Release AIMS AMP Capital Industrial REIT announces DPU
SABANA SHARI AH COMPLIANT INDUSTRIAL REIT
 SABANA SHARI AH COMPLIANT INDUSTRIAL REIT 3Q 2016: Third Quarter Ended 30 September 2016 Financial Results Presentation 17 October 2016 Important Notice Disclaimer This presentation shall be read in conjunction
MAPLETREE LOGISTICS TRUST ACQUIRES MAPLETREE WUXI LOGISTICS PARK FROM SPONSOR AND UPDATES ON DIVESTMENT OF 30 WOODLANDS LOOP
 For Immediate Release MAPLETREE LOGISTICS TRUST ACQUIRES MAPLETREE WUXI LOGISTICS PARK FROM SPONSOR AND UPDATES ON DIVESTMENT OF 30 WOODLANDS LOOP Singapore, 19 November 2012 Mapletree Logistics Trust
Mapletree Commercial Trust Delivers Stable Returns
 For Immediate Release Mapletree Commercial Trust Delivers Stable Returns Distribution per Unit ( DPU ) for 3Q FY15/16 1 at 2.08 cents, bringing DPU for Year-To-Date ( YTD ) FY15/16 2 to 6.11 cents, up
1Q FY19 Financial Results
 1Q FY19 Financial Results 4 January 2019 Disclaimer This presentation is for information only and does not constitute an invitation or offer to a c q u i r e, p u r c h a s e or s u b s c r i b e f o r
VIVA INDUSTRIAL TRUST REPORTS NET PROPERTY INCOME OF S$21 MILLION AND DPS OF CENTS IN 2Q2018
 Viva Industrial Trust Management Pte. Ltd. Viva Asset Management Pte. Ltd. 750 Chai Chee Road #04-03 Viva Business Park Singapore 469000 NEWS RELEASE VIVA INDUSTRIAL TRUST REPORTS NET PROPERTY INCOME OF