Sabana Shari ah Compliant Industrial REIT 3Q 2018 Financial Results Presentation. 26 October 2018
|
|
|
- Ophelia Barber
- 5 years ago
- Views:
Transcription


1 Sabana Shari ah Compliant Industrial REIT 3Q 2018 Financial Results Presentation 26 October 2018
2 Important Notice Disclaimer This presentation shall be read in conjunction with the financial information of Sabana Shari ah Compliant Industrial Real Estate Investment Trust ( Sabana REIT or the Trust ) for the third quarter from 1 July 2018 to 30 September 2018 ( 3Q 2018 ). This presentation may contain forward looking statements that involve risks and uncertainties. Actual future performance, outcomes and results may differ materially from those expressed in forward looking statements as a result of a number of risks, uncertainties and assumptions. Representative examples of these factors include (without limitation) general industry and economic conditions, interest rate trends, cost of capital and capital availability, competition from similar developments, shifts in expected levels of property rental income, changes in operating expenses, including employee wages, benefits and training, property expenses and governmental and public policy changes and the continued availability of financing in the amounts and the terms necessary to support future business. You are cautioned not to place undue reliance on these forward looking statements, which are based on current view of management on future events. Any discrepancies in the tables included in this presentation between the listed amounts and total thereof are due to rounding. 2
3 Agenda I. Key Highlights for 3Q II. Financial Performance and Capital Management 8 III. Portfolio Performance 14 IV. Outlook and Key Takeaways 21 V. Appendix: Distribution Details & Non Shari ah Compliant Income 24 3
4 I. Key Highlights for 3Q II. Financial Performance and Capital Management 8 III. Portfolio Performance 14 IV. Outlook and Key Takeaways 21 V. Appendix: Distribution Details & Non Shari ah Compliant Income 24 4
5 Key Highlights for 3Q 2018 For the quarter ended 30 September 2018 DPU Gross Revenue (S$) 19.86m DPU Net Property Income (S$) 12.63m DPU Distributable Income (S$) 8.07m DPU DPU (Cents) Q2017: S$20.86m 3Q2017: S$13.40m 3Q2017: S$8.34m 3Q2017: 0.79 cents Significant Updates Announced divestments of non performing and mature properties to fund future growth: 9 Tai Seng Drive and 1 Tuas Avenue 4 for S$ million Active portfolio management: Renewed all four remaining master leases expiring in
6 Operational Highlights for 3Q 2018 Disciplined Execution of Phase 1 of Growth Plan 1a. Divest Non Performing and Mature Assets 1b. Continue to Actively Manage and Optimise Portfolio Announced divestments of 9 Tai Seng Drive and 1 Tuas Avenue 4 properties Successfully renewed remaining four master leases expiring this year Secured a new lease in October resulting from proactive leasing management efforts ALL UNDERPINNED BY Prudent Capital and Risk Management & Ongoing Cost Rationalisation Steady aggregate leverage at 38.6% (3Q 2017: 36.0%) Improved profit coverage ratio to 3.7 times (3Q 2017: 3.6 times) No refinancing requirements till 2Q
7 I. Key Highlights for 3Q II. Financial Performance and Capital Management 8 III. Portfolio Performance 14 IV. Outlook and Key Takeaways 21 V. Appendix: Distribution Details & Non Shari ah Compliant Income 24 7
8 Financial Performance At a Glance (YoY) For the quarter ended 30 September 2018 (in S$'000) 3Q Q 2017 Variance (%) Gross revenue 19,855 20,859 (4.8) Net property income 12,633 13,400 (5.7) Amount available for distribution 8,072 8,336 (3.2) DPU (cents) (2) (2.5) Annualised DPU (cents) (2.6) Distribution per unit (DPU) declined: On lower revenue from lower contribution from some multi tenanted properties and lower rental reversions amid challenging market Mitigated by ongoing proactive cost optimisation Active asset and lease management mitigated rate of NPI decline: Property expenses down by 3.2% on lower impairment losses, cost savings from divested properties and lower net repair and maintenance expenses incurred for multi tenanted properties Net finance costs significantly reduced: Down 9.1% on repayment using divestment proceeds and refinancing with lower cost facilities 8
9 Financial Performance At a Glance (QoQ) For the quarter ended 30 September 2018 (in S$'000) 3Q Q 2018 Variance (%) Gross revenue 19,855 20,080 (1.1) Net property income 12,633 12, Amount available for distribution 8,072 8,639 (6.6) Distribution Per Unit (DPU): Lower by 6.1% mainly due to the absence of the one time gain from the recovery of expenses from 6 Woodlands Loop in 2Q 2018 DPU (cents) (6.1) Annualised DPU (cents) (7.3) 9
10 Financial Performance At a Glance (YTD) For the period ended 30 September 2018 (in S$'000) 9M M 2017 Variance (%) Gross revenue 60,938 64,801 (6.0) Net property income 39,789 39, Amount available for distribution 25,955 (1) 26,222 (2) (1.0) DPU (cents) (3) (0.4) Distribution per unit (DPU): Mitigated by ongoing proactive cost optimisation Net Property Income improved: Reduction in property expenses more than offset lower gross revenue as a result of active asset and lease management Net finance costs significantly reduced: Down 15.0% YoY on repayment using divestment proceeds and refinancing with lower cost facilities Annualised DPU (cents) (0.6) (1) The Manager had forgone 20% of its fees, approximately S$238,000, for 1Q (2) The Manager had forgone 25% and 75% of its fees, approximately S$310,000 and S$944,000, for 2Q 2017 and 1Q 2017 respectively. (3) Based on 1,053,083,530 units issued. 10
11 Preserving Balance Sheet Resilience (S$ 000) As at 30 Sep 2018 As at 31 Dec 2017 Investment properties 876, ,400 Investment properties held for divestment 50,600 12,900 Other assets 10,587 10,809 Total assets 937, ,109 Borrowings, at amortised cost 359, ,806 Other liabilities 24,171 28,758 Total liabilities 383, ,564 Net assets attributable to Unitholders 554, ,545 Strengthened balance sheet: Net proceeds from divestments of 6 Woodlands Loop used to pay down borrowings No refinancing requirements until 2Q 2019 after repaying borrowings with new lower cost facilities Units in issue 1,053,083,530 1,053,083,530 NAV per unit (S$) Adjusted NAV per unit (1) (S$) (1) Excludes the amount of approximately S$8.1 million (31 December 2017: S$8.8 million) available for distribution for the quarter ended 30 September
12 Continued Capital Structure Optimisation As at 30 Sep 2018 As at 31 Dec 2017 Borrowings S$361.0 million S$367.5 million Aggregate leverage (1) 38.6% 38.2% Proportion of total borrowings on fixed rates 72.0% 76.2% Average all in financing cost (2) 4.1% 3.9% Term CMF S$120.0 million S$120.0 million Revolving CMF Term Murabahah Facility S$11.0 million S$70.0 million Revolving Murabahah Facility S$30.0 million S$27.5 million Trust Certificates S$100.0 million S$190.0 million Term Loan Facility S$30.0 million S$30.0 million Weighted average tenor of borrowings 1.6 years 1.8 years Profit cover (3) 3.7 times 4.1 times Unencumbered assets S$239.0 million S$268.7 million (1) Ratio of total borrowings and deferred payment over deposited property as defined in the Property Funds Appendix of the Code on Collective Investment Schemes. (2) Inclusive of amortisation of transaction costs. (3) Ratio of net property income over profit expense (excluding amortisation of transaction costs and other fees for 3Q 2018 (31 December 2017: 4Q 2017). 12
13 Evenly Staggered Borrowings Maturity Maturities of total outstanding borrowings of S$361.0 million evenly staggered over next 3 years As at 30 September S$ million (1) Term CMF Revolving CMF Trust Certificates Term Murabahah Facility Revolving Murabahah Facility Term Loan Facility (1) Excludes S$7.0 million undrawn Revolving CMF 13
14 I. Key Highlights for 3Q II. Financial Performance and Capital Management 8 III. Portfolio Performance 14 IV. Outlook and Key Takeaways 21 V. Appendix: Distribution Details & Non Shari ah Compliant Income 24 14


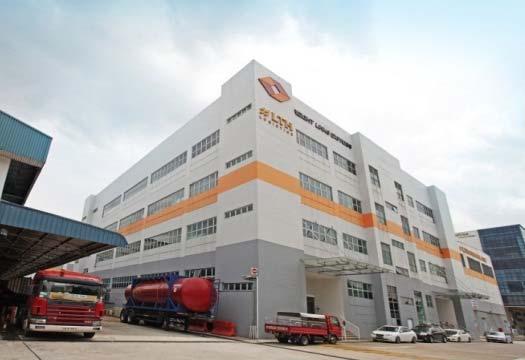
15 19 Properties Across 4 Industrial Segments Portfolio Value S$939.3 million Total GFA (sq ft) 4.3 million Total NLA (sq ft) 3.5 million Tenant Base 118 tenants Our properties are diversified into four industrial segments across Singapore, close to expressways and public transportation. Asset Breakdown by NLA for 3Q 2018 (1) 9.4% High tech Industrial Chemical Warehouse & Logistics Warehouse & Logistics General Industrial 13.0% 35.9% 41.7% Woodlands Causeway Gross Revenue by Asset Type for 3Q 2018 (1) 9.1% 7.4% Tuas 2 nd Link Changi Airport 26.1% 57.4% West Coast Park East Coast Park (1) As at 30 September
16 Occupancy Rates As at 30 Sep 2018 As at 30 Jun 2018 Total portfolio GFA 4,325,010 sq ft 4,325,010 sq ft Portfolio occupancy 7 properties, master leases (1) 100.0% 100.0% 10 properties, multi-tenanted (2) Would be 85.1% if 2 ongoing 79.1% 79.7% 19 properties, total portfolio (3) divestments had closed by 30 Sep 81.4% 84.5% Weighted average master lease term to expiry (4) 2.5 years 2.0 years Weighted average unexpired lease term for the underlying land (5) 32.8 years 33.0 years Weighted average portfolio lease term to expiry (6) 2.4 years 2.3 years (1) 5 triple net & 2 single net master leases. (2) 151 Lorong Chuan, 8 Commonwealth Lane, 9 Tai Seng Drive, 15 Jalan Kilang Barat, 23 Serangoon North Avenue 5, 508 Chai Chee Lane, 34 Penjuru Lane, 2 Toh Tuck Link, 123 Genting Lane and 39 Ubi Road 1. (3) By Net Lettable Area ( NLA ). 1 Tuas Avenue 4 (NLA 120,340 sq ft) and 21 Joo Koon Crescent (95,667 sq ft) are currently vacant. (4) Weighted by gross rental income (master leases of 7 properties). (5) Weighted by Gross Floor Area ( GFA ). (6) Weighted by gross rental income (7 master leases and 10 multi tenanted properties). 16

 Industry (Warehouse) Comparisons to Singapore industrial average occupancy")
17 Occupancy Levels Occupancy levels over the years 90% 80% 89.2% 89.0% 89.1% 88.9% 89.1% 88.4% 87.5% 81.4% 89.4% 70% 60% 50% 40% 30% 3Q Q Q 2018 (1) (1) Sabana REIT Portfolio Industry (Factory) Industry (Warehouse) Comparisons to Singapore industrial average occupancy levels (1) Source: Quarterly Market Report by Jurong Town Corporation. 17
18 Long Weighted Average Leasehold For Underlying Land Long underlying land leases, with an average of 32.8 years by GFA 49.9% 20.9% 9.6% 6.7% 12.9% Beyond 2061 Percentage of unexpired land lease term by GFA (1) (1) As at 30 September
19 Diversified Base of Quality Tenants As at 30 Sep 2018 As at 30 Jun 2018 Total NLA (sq ft) 3,534,703 (1) 3,533,127 Total number of tenants Weighted average lease term to expiry (mths) (2) No concentration in any single trade sector exceeding 16% Fashion & Apparel 7.6% Others 11.8% Logistics 10.0% F & B 0.9% (1) Adjusted due to reconfiguration of space. (2) Weighted by tenancy gross rental income. (3) As at 30 September Printing 2.4% Healthcare 4.6% Engineering 7.1% Construction & Utilities 1.6% Chemical 8.6% Electronics 15.1% Info Technology 12.7% R & D 1.1% Storage 5.3% Telecommunication & Data Warehousing 10.1% General Manufacturing Industries 1.1% Tenants industry diversification by NLA (3) 19
 10.4% 17.1% 7.2% 4.2% 9.0% 11.8% 2018 2019 2020 2021 Beyond 2021 Master Lease Multi tenanted (1) As at 30 September 2018.")
20 Balanced and Proactive Lease Management Lease Type by NLA for 3Q 2018 (1) Lease Expiry by NLA (1) Master Leases 36.5% Multitenanted 63.5% 100% 90% 80% 70% 60% 50% 40% 30% 20% 10% 0% 6.5% 14.9% 18.9% (2) 10.4% 17.1% 7.2% 4.2% 9.0% 11.8% Beyond 2021 Master Lease Multi tenanted (1) As at 30 September (2) Three properties: 33 & 35 Penjuru Lane, 18 Gul Drive and 51 Penjuru Road. Master tenants are Sponsor related companies. 20
21 I. Key Highlights for 3Q II. Financial Performance and Capital Management 8 III. Portfolio Performance 14 IV. Outlook and Key Takeaways 21 V. Appendix: Distribution Details & Non Shari ah Compliant Income 24 21
22 Outlook Singapore Economic Outlook Based on Ministry of Trade and Industry (MTI) s advance estimates, Singapore s GDP grew 2.6% y o y in 3Q 2018 (2Q 2018: 4.1%; 3Q 2017: 5.5%) (1) MTI forecasts growth of 2.5% to 3.5% for 2018 (2) Monetary Authority of Singapore (MAS) expects inflation to rise modestly in near term before stabilising at just below 2% (3) Industrial Property Outlook JTC data shows continued oversupply and islandwide vacancy of 10.9% as at 3Q 2018 (4). Overall rent reversion for 2018 likely to stay negative Colliers foresees a pick up in interest in industrial properties as rents bottom out and stabilise, with increasing interest from institutional investors in the remainder of 2018 (5) Savills expects that rents for industrial spaces will likely continue to face pressure amid an upcoming supply of 11.7 million sq ft in industrial space in 2018 (6) Sabana REIT Market conditions remain challenging. Continue to focus on executing growth plan: Improve occupancy and drive revenue, active asset management, selective divestments o Announced divestments of 9 Tai Seng Drive and 1 Tuas Avenue 4 o Renewed all four remaining master leases expiring in 2018 o Secured a new lease in October Talks with authorities on asset enhancement initiatives (AEI) for New Tech Park ongoing Sources: (1) Singapore s GDP Grew by 2.6 Per Cent in the Third Quarter of Ministry of Trade and Industry. 12 October (2) MTI Maintains 2018 GDP Growth Forecast at 2.5 to 3.5 Per Cent. Ministry of Trade and Industry. 13 August (3) MAS Monetary Policy Statement. Monetary Authority of Singapore. 12 October (4) JTC Quarterly Market Report. Industrial Properties. Third Quarter JTC. 25 October (5) Colliers Quarterly: Singapore Investment Q Colliers International Singapore. 13 August (6) Briefing Industrial Sector. Savills World Research Singapore. 23 August
23 Key Takeaways RESULTS DPU performance amid challenging conditions; Continued execution of refreshed growth strategy o Proactive lease management and cost rationalisation Balance sheet continued to remain resilient and well capitalised to meet commitments o Selective divestments further bolster balance sheet to pursue opportunities like AEI GROWTH STRATEGY Divest non performing and mature assets, actively manage and optimise portfolio o Continue to review portfolio to fund future growth o Announced divestments of 9 Tai Seng Drive and 1 Tuas Avenue 4 for S$ million o Renewed all four remaining master leases expiring in 2018 o Continue proactive leasing management efforts o Secured a new lease in October for 508 Chai Chee Lane Undertake asset enhancement initiatives (AEIs) o Ongoing talks with authorities on AEI for New Tech Park 23
24 I. Key Highlights for 3Q II. Financial Performance and Capital Management 8 III. Portfolio Performance 14 IV. Outlook and Key Takeaways 21 V. Appendix: Distribution Details & Non Shari ah Compliant Income 24 24
25 Appendix: Distribution Details Sabana REIT Code: M1GU Distribution period DPU (cents) 1 July 2018 to 30 September Distribution Timetable Last date that the Units are quoted on a cum distribution basis 31 October 2018 Ex date Books closure date 1 November 2018, 9am 5 November 2018, 5pm Distribution payment date 29 November 2018 Disbursement of non Shari ah income to approved charities 29 November 2018 or earlier 25

26 Appendix: Non Shari ah Compliant Income Sabana REIT distributes its non Shari ah compliant income on a quarterly basis as assessed, to various charitable causes. Details on the contribution and beneficiary for 3Q 2018 as follows: Organisation: SG Enable TODAY Enable Fund Purpose: Sabana REIT s 3Q 2018 non Shari ah income amounting to S$1,376 will be directed to support their cause of outreach to the Singapore community. 26
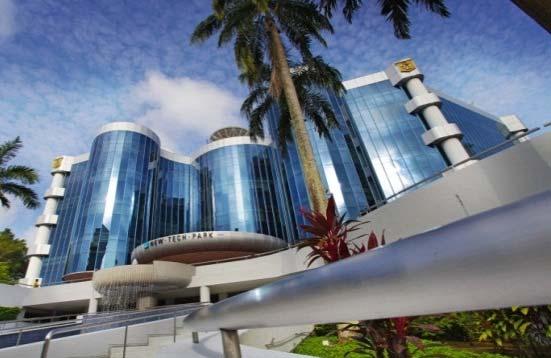
27 Sabana Real Estate Investment Management Pte. Ltd. 151 Lorong Chuan #02-03 New Tech Park Singapore Tel: Fax: For enquiries, please contact: Ms Grace Chew Ms Josephine Chew Sabana Real Estate Investment Management Pte. Ltd. WATATAWA Consulting Tel: Tel: Mr Ong Chor Hao WATATAWA Consulting Tel:
SABANA SHARI AH COMPLIANT INDUSTRIAL REIT
 SABANA SHARI AH COMPLIANT INDUSTRIAL REIT 3Q 2017: Third Quarter Ended 30 September 2017 Financial Results Presentation 23 October 2017 Important Notice Disclaimer This presentation shall be read in conjunction
SABANA SHARI AH COMPLIANT INDUSTRIAL REIT
 SABANA SHARI AH COMPLIANT INDUSTRIAL REIT 3Q 2016: Third Quarter Ended 30 September 2016 Financial Results Presentation 17 October 2016 Important Notice Disclaimer This presentation shall be read in conjunction
SABANA SHARI AH COMPLIANT INDUSTRIAL REIT
 SABANA SHARI AH COMPLIANT INDUSTRIAL REIT 1Q 2017: First Quarter Ended 31 March 2017 Financial Results Presentation 9 May 2017 Important Notice Disclaimer This presentation shall be read in conjunction
SABANA SHARI AH COMPLIANT INDUSTRIAL REIT
 SABANA SHARI AH COMPLIANT INDUSTRIAL REIT 1Q 2015: First Quarter Ended 31 March 2015 Financial Results Presentation 20 April 2015 Important Notice Disclaimer This presentation shall be read in conjunction
SABANA SHARI AH COMPLIANT INDUSTRIAL REIT
 SABANA SHARI AH COMPLIANT INDUSTRIAL REIT 4Q 2016 and FY 2016: Fourth Quarter and Full Year Ended 31 December 2016 Financial Results Presentation 25 January 2017 Important Notice Disclaimer This presentation
SABANA SHARI AH COMPLIANT INDUSTRIAL REIT. Investor Presentation November 2014
 SABANA SHARI AH COMPLIANT INDUSTRIAL REIT Investor Presentation November 2014 Important notice Disclaimer This presentation shall be read in conjunction with the financial information of Sabana Shari ah
3Q2016 Financial Results Presentation 26 October Pioneer Crescent
 3Q2016 Financial Results Presentation 26 October 2016 25 Pioneer Crescent Content Executive Summary Real Estate Highlights Financial & Capital Management Highlights Appendix 2 3Q2016 Executive Summary
AIMS AMP CAPITAL INDUSTRIAL REIT
 AIMS AMP CAPITAL INDUSTRIAL REIT 3 rd Quarter Ended 31 December 2011 Results Presentation 20 January 2012 Important Notice Disclaimer This Presentation is focused on comparing actual results for the financial
3Q 2012 Presentation Slides. 1 Nov 2012
 3Q 2012 Presentation Slides 1 Nov 2012 2 Important Notice This material shall be read in conjunction with CIT s financial statements for the financial period ended 30 Sep 2012. The value of units in CIT
FY2014 Financial Results Presentation
 FY2014 Financial Results Presentation 16 January 2015 16 International Business Park Important Notice This material shall be read in conjunction with CIT s results announcements for the financial period
OSK DMG ASEAN & Hong Kong Corporate Day June 2012
 OSK DMG ASEAN & Hong Kong Corporate Day 26-28 June 2012 2 Important Notice This material shall be read in conjunction with CIT s financial statements for the financial period ended 31 March 2012. The value
FY2015 Financial Results Presentation
 FY2015 Financial Results Presentation 14 January 2016 16 International Business Park 2 Content Executive Summary Financial Summary Real Estate Highlights Financial & Capital Management Highlights Appendix
Citi ASEAN Conference 12 June Tai Seng Street
 Citi ASEAN Conference 12 June 2014 1 16 Tai Seng Street Important Notice This material shall be read in conjunction with CIT s financial statements for the financial period ended 31 Mar 2014. The value
AIMS AMP CAPITAL INDUSTRIAL REIT
 AIMS AMP CAPITAL INDUSTRIAL REIT FY2013: 2 nd Quarter Ended 30 September 2012 Results Presentation 24 October 2012 Important Notice Disclaimer This Presentation is focused on comparing actual results for
2Q2014 Financial Results 24 July Creating Value & Delivering Growth
 2Q2014 Financial Results 24 July 2014 1 Creating Value & Delivering Growth Important Notice This material shall be read in conjunction with CIT s financial statements for the financial period ended 30
Singapore Investor Roadshow
 Singapore Investor Roadshow 11 May 2015 16 International Business Park Important Notice This material shall be read in conjunction with CIT s results announcements for the financial period ended 31 December
AIMS AMP CAPITAL INDUSTRIAL REIT
 AIMS AMP CAPITAL INDUSTRIAL REIT FY2016: First Quarter Financial Results Ended 30 June 2015 Results Presentation 29 July 2015 Important notice Disclaimer This Presentation is focused on comparing actual
AIMS AMP CAPITAL INDUSTRIAL REIT
 AIMS AMP CAPITAL INDUSTRIAL REIT FY2019: First Quarter Financial Results Ended 30 June 2018 Results Presentation 26 July 2018 1 Important notice Disclaimer This Presentation is focused on comparing actual
Hong Kong Non-Deal Roadshow Hong Kong, 4 March International Business Park
 Hong Kong Non-Deal Roadshow Hong Kong, 4 March 2016 16 International Business Park 2 Content CIT FY2015 Results Executive Summary Financial Summary Real Estate Highlights Financial & Capital Management
FY2012 Financial Results Presentation
 FY2012 Financial Results Presentation 21 January 2013 Knowing. Believing. Delivering ARA-CWT Trust Management (Cache) Limited Agenda Overview & FY12 Key Highlights 4QFY12 & FY12 Full Year Financial Performance
SABANA REIT 3Q 2013 GROSS REVENUE INCREASE 6.3% Y O Y, CONTINUES TO GROW VIA ACQUISITION
 SABANA SHARI AH COMPLIANT INDUSTRIAL REAL ESTATE INVESTMENT TRUST (a real estate investment trust constituted on 29 October 2010 under the laws of the Republic of Singapore) SABANA REIT 3Q 2013 GROSS REVENUE
AIMS AMP CAPITAL INDUSTRIAL REIT
 AIMS AMP CAPITAL INDUSTRIAL REIT FY2016: Second Quarter Financial Results Ended 30 September 2015 Results Presentation 29 October 2015 Important notice Disclaimer This Presentation is focused on comparing
SUMMARY OF RESULTS FOR SABANA GROUP. Note: Please refer to Item 6 on Page 15 for the DPU computation. Page 2. Group Quarter Fav /
 FOR THIRD QUARTER FROM 1 JULY 2014 AND PERIOD FROM 1 JANUARY 2014 INTRODUCTION Sabana Shari ah Compliant Industrial Real Estate Investment ( Sabana Shari ah Compliant REIT or ) is a real estate investment
Notice of Annual General Meeting
 7 th Annual General Meeting 18 July 2017 Important Notice This presentation shall be read in conjunction with Mapletree Industrial Trust s ( MIT ) financial statements for the financial year ended 31 March
CLSA Asean Forum Bangkok, March International Business Park
 CLSA Asean Forum Bangkok, March 2016 16 International Business Park 2 Content Overview of CIT CIT FY2015 Financial Results Overview Financial & Capital Management Highlights Real Estate Highlights Singapore
AIMS AMP CAPITAL INDUSTRIAL REIT
 AIMS AMP CAPITAL INDUSTRIAL REIT FY2018: Second Quarter Financial Results Ended 30 September 2017 Results Presentation 26 October 2017 1 Important notice Disclaimer This Presentation is focused on comparing
DONALD HAN APPOINTED AS NEW CEO AND NEW INDEPENDENT DIRECTOR JOINS BOARD; 4Q DPU OF 0.83 SINGAPORE CENTS REPORTED
 SABANA SHARI AH COMPLIANT INDUSTRIAL REAL ESTATE INVESTMENT TRUST (a real estate investment trust constituted on 29 October 2010 under the laws of the Republic of Singapore) DONALD HAN APPOINTED AS NEW
AIMS AMP CAPITAL INDUSTRIAL REIT
 AIMS AMP CAPITAL INDUSTRIAL REIT FY2018: Fourth Quarter Financial Results Ended 31 March 2018 Results Presentation 25 April 2018 1 Important notice Disclaimer This Presentation is focused on comparing
Viva Industrial Trust
 Viva Industrial Trust Financial Results for the Period from 4 November 2013 to 31 December 2013 25 February 2014 Important Notice This presentation is for information purposes only and does not constitute
AIMS AMP CAPITAL INDUSTRIAL REIT
 AIMS AMP CAPITAL INDUSTRIAL REIT FY2018: First Quarter Financial Results Ended 30 June 2017 Results Presentation 27 July 2017 1 Important notice Disclaimer This Presentation is focused on comparing actual
Viva Industrial Trust 4Q2017 & FY2017 Results Presentation. 26 January 2018
 Viva Industrial Trust 4Q2017 & FY2017 Results Presentation 26 January 2018 1 Important Notice This presentation is for information purposes only and does not constitute or form part of an offer, invitation
4QFY2013 and 2HFY2013 Results Presentation. January 2014
 4QFY2013 and 2HFY2013 Results Presentation January 2014 1 Disclaimer This presentation should be read in conjunction with the financial statements of Soilbuild Business Space REIT for the period from 1
1Q2009 Results. 24 April 2009
 Cambridge Industrial Trust 1Q2009 Results 24 April 2009 Presentation Outline 1Q09 Highlights ht 1Q09 Financial Highlights Risk Management Strategy for 2009 2 1Q09 Achievements Occupancy remains high at
AIMS AMP CAPITAL INDUSTRIAL REIT
 AIMS AMP CAPITAL INDUSTRIAL REIT FY2014: Third Quarter ended 31 December 2013 Results Presentation 29 January 2014 Important notice Disclaimer This Presentation is focused on comparing actual results for
Financial Results for the Quarter / Year Ended 31 Mar April 2012
 Financial Results for the Quarter / Year Ended 31 Mar 2012 19 April 2012 Disclaimer This Presentation is focused on comparing results for the three months ended 31 Mar 2012 versus results achieved in the
1Q FY2009/10 Financial Results Presentation 17 July 2009
 1Q FY2009/10 Financial Results Presentation 17 July 2009 Disclaimers This Presentation is focused on comparing results for the three months ended 30 June 2009 versus actual results year-on-year ( yoy ).
3Q2010 Financial Results. 20 October 2010
 3Q2010 Financial Results 20 October 2010 important notice The value of units in CIT ( Units ) and the income derived from them may fall as well as rise. Units are not investments, liabilities or obligations
Investor Presentation August 2017
 Investor Presentation August 2017 Important Notice This presentation shall be read in conjunction with Mapletree Industrial Trust s ( MIT ) financial results for First Quarter Financial Year 2017/2018
Investor Presentation March 2016
 Investor Presentation March 2016 Important Notice This presentation shall be read in conjunction with Mapletree Industrial Trust s ( MIT ) financial results for Third Quarter Financial Year 2015/2016 in
Cambridge Industrial Trust Financial results for the first quarter ended 31 March April
 1 Cambridge Industrial Trust Financial results for the first quarter ended 31 March 2010 21 April 2010 www.cambridgeindustrialtrust.com important notice 2 The value of units in CIT ( Units ) and the income
Financial Results Presentation 3Q2017
 Financial Results Presentation 3Q2017 Contents A 3Q2017 Results B C Financial Performance Prudent Capital Management D Real Estate Highlights E Market Outlook F Appendix 2 3Q2017 Results 3Q2017 At A Glance
Balance Sheet Positioned for Future Growth with No Major Refinancing Due Until 2016
 (Constituted in the Republic of Singapore pursuant to a trust deed dated 31 March 2006 (as amended)) Press Release Balance Sheet Positioned for Future Growth with No Major Refinancing Due Until 2016 Refinanced
AIMS AMP CAPITAL INDUSTRIAL REIT
 AIMS AMP CAPITAL INDUSTRIAL REIT 8 th ANNUAL GENERAL MEETING PRESENTATION 27 July 2017 1 Important notice Disclaimer This Presentation is focused on comparing actual results for the financial period from
SGX REIT & BT SEMINAR Tokyo, 30 June Pioneer Crescent
 SGX REIT & BT SEMINAR Tokyo, 30 June 3016 25 Pioneer Crescent Singapore Industrial REITs (S-REITs) 3 Key Features Bond-like listed security ( Dividend Play ) that provides steady income distribution stream
Introduction to Cache Logistics Trust
 Introduction to Cache Logistics Trust 30 May 2013 Tampines Regional Library Knowing. Believing. Delivering ARA-CWT Trust Management (Cache) Limited Agenda About Cache Logistics Trust 1QFY2013 Financial
1Q FY2013 Financial Results Presentation
 1Q FY2013 Financial Results Presentation 24 April 2013 Knowing. Believing. Delivering ARA-CWT Trust Management (Cache) Limited Agenda Key Highlights Financial Performance Capital Management Asset Management
6 th Annual General Meeting 24 April International Business Park
 6 th Annual General Meeting 24 April 2015 16 International Business Park Important Notice This material shall be read in conjunction with CIT s results announcements for the financial period ended 31 December
26 April ARA-CWT Trust Management (Cache) Limited
 Limited") 1Q 2011 Financial Results 26 April 2011 ARA-CWT Trust Management (Cache) Limited Agenda 1Q 2011 Financial i Results Portfolio Update Going Forward 2 Highlights 1Q 2011 Results Property Income slightly
1Q 2011 Financial Results 26 April 2011 ARA-CWT Trust Management (Cache) Limited Agenda 1Q 2011 Financial i Results Portfolio Update Going Forward 2 Highlights 1Q 2011 Results Property Income slightly
SGX-REITAS Education Series
 SGX-REITAS Education Series 23 February 2016 16 International Business Park 2 Executive Summary Singapore Industrial Real Estate Sector Overview Role of Regulators in the Industrial Sector Overview of
Viva Industrial Trust 2Q2018 Results Presentation. 13 August 2018
 Viva Industrial Trust 2Q2018 Results Presentation 13 August 2018 1 Important Notice This presentation is for information purposes only and does not constitute or form part of an offer, invitation or solicitation
MAPLETREE LOGISTICS TRUST S 3Q FY13/14 DISTRIBUTION PER UNIT RISES 7% YEAR-ON-YEAR
 For Immediate Release MAPLETREE LOGISTICS TRUST S 3Q FY13/14 DISTRIBUTION PER UNIT RISES 7% YEAR-ON-YEAR Highlights: Amount Distributable to Unitholders registered 8% year-on-year growth Results underpinned
Cambridge Industrial Trust Presentation on 3Q2007 Results. 30 Oct 2007
 Cambridge Industrial Trust Presentation on 3Q2007 Results 30 Oct 2007 References in this presentation Unless otherwise stated, all capitalised terms used shall have the same meaning as in the prospectus
Investor Presentation. May 2013
 Investor Presentation May 2013 DISCLAIMER This presentation is for information only and does not constitute an offer or solicitation of an offer to subscribe for, acquire, purchase, dispose of or sell
AIMS AMP CAPITAL INDUSTRIAL REIT
 AIMS AMP CAPITAL INDUSTRIAL REIT FY2017: Fourth Quarter Financial Results Ended 31 March 2017 Results Presentation 27 April 2017 1 Important notice Disclaimer This Presentation is focused on comparing
27 January ARA-CWT Trust Management (Cache) Limited
 Limited") 4Q 2010 Financial Results 27 January 2011 ARA-CWT Trust Management (Cache) Limited Agenda 4Q 2010 Financial Results Portfolio Update Going Forward 2 Highlights 4Q 2010 Results Net Property Income of S$14.4m
4Q 2010 Financial Results 27 January 2011 ARA-CWT Trust Management (Cache) Limited Agenda 4Q 2010 Financial Results Portfolio Update Going Forward 2 Highlights 4Q 2010 Results Net Property Income of S$14.4m
Cache Logistics Trust 2011 Annual General Meeting
 Cache Logistics Trust 2011 Annual General Meeting 18 April 2012 Knowing. Believing. Delivering ARA-CWT Trust Management (Cache) Limited Agenda REIT Overview FY2011 Performance Portfolio Going Forward 2
Results Slide 3. Balance sheet Slide 8. Operational performance Slide 11. Growth strategy and market outlook Slide 16
 1Q FY18 Financial Results 5 January 2018 Disclaimer This presentation is for information only and does not constitute an invitation or offer to a c q u i r e, p u r c h a s e or s u b s c r i b e f o r
CIT reports steady 2Q2015 results and improved capital structure
 (Constituted in the Republic of Singapore pursuant to a trust deed dated 31 March 2006 (as amended)) Press Release CIT reports steady 2Q2015 results and improved capital structure Net property income increased
Viva Industrial Trust 4Q2016 & FY2016 Financial Results. 26 January 2017
 Viva Industrial Trust 4Q2016 & FY2016 Financial Results 26 January 2017 1 Important Notice This presentation is for information purposes only and does not constitute or form part of an offer, invitation
FINANCIAL RESULTS For First Quarter ended 31 March 2015
 FINANCIAL RESULTS For First Quarter ended 31 March 2015 AGENDA Q1 Highlights Financial Performance Portfolio Performance AEI Updates Looking Ahead Unit Performance 2 Q1 HIGHLIGHTS Q1 HIGHLIGHTS FINANCIAL
Mapletree Industrial Trust Achieves Distribution Per Unit of 2.05 Cents for 2QFY2011 at 10.8% above Forecast 1
 PRESS RELEASE Mapletree Industrial Trust Achieves Distribution Per Unit of 2.05 Cents for 2QFY2011 at 10.8% above Forecast 1 Distribution per Unit ( DPU ) of 2.05 cents, higher than IPO Forecast ( Forecast
MAPLETREE LOGISTICS TRUST S 1Q FY17/18 DPU RISES 2% YEAR-ON-YEAR TO CENTS
 For Immediate Release MAPLETREE LOGISTICS TRUST S 1Q FY17/18 DPU RISES 2% YEAR-ON-YEAR TO 1.887 CENTS Highlights: Amount distributable to Unitholders grew 2.5% year-on-year to S$47.2 million Stable operations
Acquisition of 7000 AMK and the Proposed Equity Fund Raising. 14 December 2017
 Acquisition of 7000 AMK and the Proposed Equity Fund Raising 14 December 2017 Contents A Overview B Benefits of the Acquisition C Funding Structure and Financial Impact D Recent Developments E Conclusion
MAPLETREE LOGISTICS TRUST S 4Q FY17/18 DISTRIBUTION PER UNIT RISES 4% TO CENTS
 For Immediate Release MAPLETREE LOGISTICS TRUST S 4Q FY17/18 DISTRIBUTION PER UNIT RISES 4% TO 1.937 CENTS Highlights: 4Q FY17/18 amount distributable to Unitholders grew 27% year-on-year to S$59.2 million
MAPLETREE LOGISTICS TRUST S QUARTERLY DISTRIBUTION PER UNIT RISES 10% YEAR-ON-YEAR
 For Immediate Release MAPLETREE LOGISTICS TRUST S QUARTERLY DISTRIBUTION PER UNIT RISES 10% YEAR-ON-YEAR Highlights: Distribution Per Unit ( DPU ) of 1.70 cents for the 3 months ended 31 March 2012 Portfolio
Financial Results for the Quarter Ended 31 Dec January 2012
 Financial Results for the Quarter Ended 31 Dec 2011 19 January 2012 Disclaimer This Presentation is focused on comparing results for the three months ended 31 Dec 2011 versus results achieved in the three
Investor Presentation November 2015
 Investor Presentation November 2015 Important Notice This presentation shall be read in conjunction with Mapletree Industrial Trust s ( MIT ) financial results for Second Quarter Financial Year 2015/2016
Viva Industrial Trust 3Q2014 Financial Results. 21 October 2014
 Viva Industrial Trust 3Q2014 Financial Results 21 October 2014 Important Notice This presentation is for information purposes only and does not constitute or form part of an offer, invitation or solicitation
Financial Results for 4 th Quarter 2017 and Year Ended 31 December 2017
 Financial Results for 4 th Quarter 2017 and Year Ended 31 December 2017 31 January 2018 Important Notice This presentation shall be read in conjunction with OUE Commercial REIT s Financial Results announcement
Financial Results for 3 rd Quarter November 2017
 Financial Results for 3 rd Quarter 2017 2 November 2017 Important Notice This presentation shall be read in conjunction with OUE Commercial REIT s Financial Results announcement for 3Q 2017 dated 2 November
1Q FY19 Financial Results
 1Q FY19 Financial Results 4 January 2019 Disclaimer This presentation is for information only and does not constitute an invitation or offer to a c q u i r e, p u r c h a s e or s u b s c r i b e f o r
Financial Results for Third Quarter ended 30 September October
 Financial Results for Third Quarter ended 30 September 2009 27 October 2009 www.cambridgeindustrialtrust.com 1 Important Notice The value of units in CIT ( Units ) and the income derived from them may
Investor Presentation
 Investor Presentation 15 September 2011 Knowing. Believing. Delivering ARA-CWT Trust Management (Cache) Limited Agenda REIT Overview Management Strategy 2Q 2011 Financial Results Portfolio Update Going
INTERESTED PERSON TRANSACTIONS PROPOSED ACQUISITION OF 47 CHANGI SOUTH AVENUE 2 SINGAPORE
 SABANA SHARI AH COMPLIANT INDUSTRIAL REAL ESTATE INVESTMENT TRUST (A real estate investment trust constituted on 29 October 2010 under the laws of the Republic of Singapore) 1. INTRODUCTION INTERESTED
Viva Industrial Trust 2Q2017 & 1H2017 Results Presentation. 26 July 2017
 Viva Industrial Trust 2Q2017 & 1H2017 Results Presentation 26 July 2017 1 Important Notice This presentation is for information purposes only and does not constitute or form part of an offer, invitation
Mapletree Industrial Trust Achieves Distributable Income of S$35.8 million for 4QFY11/12
 (Constituted in Republic of Singapore pursuant to a Trust Deed dated 29 January 2008 (as amended)) PRESS RELEASE Mapletree Industrial Trust Achieves Distributable Income of S$35.8 million for 4QFY11/12
VIVA INDUSTRIAL TRUST REPORTS NET PROPERTY INCOME OF S$21 MILLION AND DPS OF CENTS IN 2Q2018
 Viva Industrial Trust Management Pte. Ltd. Viva Asset Management Pte. Ltd. 750 Chai Chee Road #04-03 Viva Business Park Singapore 469000 NEWS RELEASE VIVA INDUSTRIAL TRUST REPORTS NET PROPERTY INCOME OF
Financial Results for 4 th Quarter and Year Ended 31 December January 2019
 Financial Results for 4 th Quarter and Year Ended 31 December 2018 30 January 2019 Important Notice This presentation should be read in conjunction with the announcements released by OUE Commercial REIT
(Constituted in the Republic of Singapore pursuant to a trust deed dated 31 March 2006 (as amended))
)") (Constituted in the Republic of Singapore pursuant to a trust deed dated 31 March 2006 (as amended)) ASSET VALUATION Pursuant to Rule 703 of the SGX-ST Listing Manual, ESR Funds Management (S) Limited,
(Constituted in the Republic of Singapore pursuant to a trust deed dated 31 March 2006 (as amended)) ASSET VALUATION Pursuant to Rule 703 of the SGX-ST Listing Manual, ESR Funds Management (S) Limited,
Mapletree Commercial Trust
 Mapletree Commercial Trust 3Q FY17/18 Financial Results 24 January 2018 1 Important Notice This presentation is for information only and does not constitute an offer or solicitation of an offer to sell
2Q FY18 Financial Results 6 April 2018
 2Q FY18 Financial Results 6 April 2018 Disclaimer This presentation is for information only and does not constitute an invitation or offer to a c q u i r e, p u r c h a s e or s u b s c r i b e f o r u
Ascendas Reit s Total Amount Available for Distribution for FY16/17 grew 18.0% y-o-y to S$446.3 million
 25 April 2017 Ascendas Reit s Total Amount Available for Distribution for FY16/17 grew 18.0% y-o-y to S$446.3 million Highlights: 1. FY16/17 Distribution per Unit (DPU) grew by 2.5% year-on-year (y-o-y)
MAPLETREE LOGISTICS TRUST DELIVERS 1.71 CENTS DISTRIBUTION PER UNIT FOR 2Q FY12/13
 For Immediate Release MAPLETREE LOGISTICS TRUST DELIVERS 1.71 CENTS DISTRIBUTION PER UNIT FOR 2Q FY12/13 Highlights: Amount distributable to Unitholders of S$41.4 million 99.2% occupancy rate, positive
Cambridge Industrial Trust. 29 Jan 2008
 Cambridge Industrial Trust Full Year 2007 Results 29 Jan 2008 FY2007 Results Presentation Outline FY 2007 Milestones 4Q2007 Financial Results Capital Management Strategy Acquisition Highlights Portfolio
SABANA SHARI AH COMPLIANT INDUSTRIAL REIT. Dialogue Session with Securities Investors Association (Singapore) 21 April 2017
 21 April 2017") SABANA SHARI AH COMPLIANT INDUSTRIAL REIT Dialogue Session with Securities Investors Association (Singapore) 21 April 2017 Disclaimer This presentation should be read in conjunction with the circular to
SABANA SHARI AH COMPLIANT INDUSTRIAL REIT Dialogue Session with Securities Investors Association (Singapore) 21 April 2017 Disclaimer This presentation should be read in conjunction with the circular to
Sabana REIT reports on-forecast Net Property Income and Distributable Income for 3Q2011
 SABANA SHARI AH COMPLIANT INDUSTRIAL REAL ESTATE INVESTMENT TRUST (a real estate investment trust constituted on 29 October 2010 under the laws of the Republic of Singapore) Sabana REIT reports on-forecast
MAPLETREE LOGISTICS TRUST DELIVERS STEADY PERFORMANCE FOR 1H FY16/17
 For Immediate Release MAPLETREE LOGISTICS TRUST DELIVERS STEADY PERFORMANCE FOR 1H FY16/17 Highlights: Maintained DPU at 1.86 cents for 2Q FY16/17 and 3.71 cents for 1H FY16/17 Stable portfolio occupancy
Mapletree Logistics Trust s 2Q FY17/18 Distribution per Unit Grows 1.5% Year-on-Year
 For Immediate Release Mapletree Logistics Trust s 2Q FY17/18 Distribution per Unit Grows 1.5% Year-on-Year Amount distributable to Unitholders increased 3.5% year-on-year to S$48.2 million Continuing,
Ascendas Reit s Total Amount Available for Distribution for 2Q FY16/17 rose 12.3% y-o-y to S$112.5 million
 20 October 2016 Ascendas Reit s Total Amount Available for Distribution for 2Q FY16/17 rose 12.3% y-o-y to S$112.5 million Highlights: 1. 2Q FY16/17 performance boosted mainly by contributions from the
World s LARGEST. Listed Shari ah Compliant Industrial REIT by Total Assets. As at 31 December 2016
 CONTENTS 02 Letter to Unitholders 05 Corporate Profile 06 Core Values 07 Vision and Mission 08 Our Strategy 09 Our Trust Structure 10 Shari ah Compliance Commonly Asked Questions 12 2016 Significant Events
FY2016. Financial Results
 FY2016 Financial Results 6 October 2016 Disclaimer This presentation is for information only and does not constitute an invitation or offer to a c q u i r e, p u r c h a s e or s u b s c r i b e f o r
Mapletree Industrial Trust Delivers 9.0% Year-on-Year Growth for 1QFY13/14 Distributable Income
 (Constituted in Republic of Singapore pursuant to a Trust Deed dated 29 January 2008 (as amended)) PRESS RELEASE Mapletree Industrial Trust Delivers 9.0% Year-on-Year Growth for 1QFY13/14 Distributable
OUE C-REIT Achieved Distribution of S$17.8 million in 3Q 2017, 3.2% Higher YoY
 PRESS RELEASE For Immediate Release OUE C-REIT Achieved Distribution of S$17.8 million in 3Q 2017, 3.2% Higher YoY Key Highlights: 3Q 2017 amount available for distribution of S$17.8 million increased
2Q FY16. Financial Results
 2Q FY16 Financial Results 4 April 2016 Disclaimer This presentation is for information only and does not constitute an invitation or offer to a c q u i r e, p u r c h a s e or s u b s c r i b e f o r u
Cache Logistics Trust 2013 ANNUAL GENERAL MEETING
 Cache Logistics Trust 2013 ANNUAL GENERAL MEETING 16 April 2014 Enduring. Evolving. Growing. ARA-CWT Trust Management (Cache) Limited Overview Sponsor REIT Manager Property Manager Issue Statistics Substantial
Mapletree Commercial Trust
 Mapletree Commercial Trust 1Q FY17/18 Financial Results 27 July 2017 1 Important Notice This presentation is for information only and does not constitute an offer or solicitation of an offer to sell or
Financial Results for 3 rd Quarter 2016
 Financial Results for 3 rd Quarter 2016 1 November 2016 Important Notice This presentation shall be read in conjunction with OUE Commercial REIT s Financial Results announcement for 3Q 2016 dated 1 November
VIVA INDUSTRIAL TRUST REPORTS 3.5% YEAR-ON-YEAR INCREASE IN NET PROPERTY INCOME TO S$21 MILLION AND DPS OF CENTS FOR 1Q2018
 Viva Industrial Trust Management Pte. Ltd. Viva Asset Management Pte. Ltd. 750 Chai Chee Road #04-03 Viva Business Park Singapore 469000 NEWS RELEASE VIVA INDUSTRIAL TRUST REPORTS 3.5% YEAR-ON-YEAR INCREASE
SABANA SHARI AH COMPLIANT INDUSTRIAL REAL ESTATE INVESTMENT TRUST REQUISITION TO CONVENE EXTRAORDINARY GENERAL MEETING OF UNITHOLDERS
 SABANA SHARI AH COMPLIANT INDUSTRIAL REAL ESTATE INVESTMENT TRUST (a real estate investment trust constituted on 29 October 2010 under the laws of the Republic of Singapore) REQUISITION TO CONVENE EXTRAORDINARY
MAPLETREE LOGISTICS TRUST S 1Q FY14/15 DISTRIBUTION PER UNIT RISES 6% to 1.90 CENTS
 For Immediate Release MAPLETREE LOGISTICS TRUST S 1Q FY14/15 DISTRIBUTION PER UNIT RISES 6% to 1.90 CENTS Highlights: 6% year-on-year growth in amount distributable to Unitholders to S$46.6 million Recent