Mapletree Commercial Trust
|
|
|
- Randell Underwood
- 5 years ago
- Views:
Transcription


1 Mapletree Commercial Trust 1Q FY17/18 Financial Results 27 July
2 Important Notice This presentation is for information only and does not constitute an offer or solicitation of an offer to sell or invitation to subscribe for or acquire any units in Mapletree Commercial Trust ( MCT ) and units in MCT ( Units ). The past performance of the Units and MCT is not indicative of the future performance of MCT or Mapletree Commercial Trust Management Ltd. ( Manager ). The value of Units and the income from them may rise or fall. Units are not obligations of, deposits in or guaranteed by the Manger or any of its affiliates, An investment in Units is subject to investment risks, including the possible loss of the principal amount invested. Investors have no right to request the Manager to redeem their Units while the Units are listed. It is intended that unitholders may only deal in their Units through trading on the SGX-ST. Listing of the Units on the SGX-ST does not guarantee a liquid market for the Units This presentation may also contain forward-looking statements that involve risks and uncertainties. Actual future performance, outcomes and results may differ materially from those expressed in forward-looking statements as a result of risks, uncertainties and assumptions. Representative examples of these factors include general industry and economic conditions, interest rate trends, cost of capital, occupancy rate, construction and development risks, changes in operating expenses (including employees wages, benefits and training costs), governmental and public policy changes and the continued availability of financing. You are cautioned not to place undue reliance on these forward-looking statements, which are based on current view of management on future events. Nothing in this presentation should be construed as financial, investment, business, legal or tax advice and you should consult your own independent professional advisors. This presentation shall be read in conjunction with MCT s financial results for First Quarter from 1 April 2017 to 30 June 2017 in the SGXNET announcement dated 27 July

3 Agenda Key Highlights Financial Performance Portfolio Updates Outlook 3

4 Key Highlights VivoCity 4
5 Key Highlights Financial Performance Gross revenue and net property income ( NPI ) for 1Q FY17/18 grew 46.9% and 49.6% respectively from 1Q FY16/17 Distribution per unit ( DPU ) for 1Q FY17/18 grew 9.9% to 2.23 Singapore cents, driven by the accretive acquisition of Mapletree Business City I ( MBC I ), as well as positive contributions from VivoCity, Mapletree Anson and PSA Building Portfolio Performance VivoCity achieved 7.2% and 3.8% growth in shopper traffic and tenant sales respectively Asset enhancement initiative ( AEI ) on Level 1 and Level 2 on track, with shops progressively commenced trading from May 2017 Addition of a 3,000 square metre public library in VivoCity under the Community/Sports Facility Scheme ( CSFS ) 5
6 Key Highlights Capital Management Well-distributed debt maturity profile, with no more than 20% of debt due for refinancing in any financial year. No refinancing due in FY17/18 Maintained healthy balance sheet with 36.4% aggregate leverage and 3.8 years average term to maturity of debt. Weighted average cost of financing at 2.67% p.a. 6

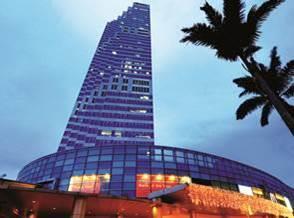
7 Financial Performance Bank of America Merrill Lynch HarbourFront 7
8 1Q FY17/18 Financial Scorecard 1Q FY17/18 DPU up 9.9% to 2.23 Singapore cents Led by Positive Contributions from MBC I, VivoCity, Mapletree Anson and PSA Building S$ 000 unless otherwise stated 1Q FY17/18 1Q FY16/17 Variance Gross Revenue 107,766 73, % Property Operating Expenses (23,585) (17,093) 38.0% Net Property Income 84,181 56, % Net Finance Costs (15,460) (10,630) 45.4% Income Available for Distribution 64,375 43, % Distribution per Unit (cents) % 8
9 Balance Sheet Robust Balance Sheet through Proactive Capital Management S$ 000 unless otherwise stated As at 30 June 2017 As at 31 March 2017 Investment Properties 6,341,720 6,337,000 Other Assets 56,847 68,653 Total Assets 6,398,567 6,405,653 Borrowings 2,328,498 2,329,754 Other Liabilities 115, ,446 Net Assets 3,954,139 3,957,453 Units in Issue ( 000) 2,876,313 2,871,143 Net Asset Value per Unit (S$) Lower net asset value per unit as compared to 31 March 2017 mainly due to mark-to-market fair value changes of the derivative financial instruments 9
10 Key Financial Indicators Maintained Healthy Financial Indicators As at 30 June 2017 As at 31 March 2017 Total Debt Outstanding S$2,327.6 mil S$2,327.6 mil % Fixed Debt 73.7% 81.2% Gearing Ratio 36.4% % Interest Coverage Ratio (YTD) 4.9 times 4.9 times Average Term to Maturity of Debt 3.8 years 4.0 years Weighted Average All-In Cost of Debt (p.a.) 2.67% % 3 Unencumbered Assets as % of Total Assets 100% 100% MCT Corporate Rating (by Moody s) Baa1 Baa1 1. Based on total gross borrowings divided by total assets. Correspondingly, the ratio of total gross borrowings to total net assets is 58.9% 2. Annualised based on the quarter ended 30 June For the year ended 31 March
11 Gross Debt (S$ mil) Debt Maturity Profile (as at 30 June 2017) Well-Distributed with less than 20% of Debt Due for Refinancing in Any Financial Year Total gross debt: S$2,327.6 mil No refinancing due in FY17/ Fixed Rate Notes Bank Debt % of Total Debt FY17/18 FY18/19 FY19/20 FY20/21 FY21/22 FY22/23 FY23/24 FY24/25 FY25/26 FY26/27-13% 17% 19% 19% 20% 4% - - 8% 11
12 Distribution Details 1Q FY17/18 DPU of 2.23 Singapore cents Distribution Period 1 April June 2017 Distribution Amount 2.23 Singapore cents per unit Distribution Timetable Notice of Books Closure Date Thursday, 27 July 2017 Last Day of Trading on cum Basis Tuesday, 1 August 2017 Ex-Date Wednesday, 2 August 2017 Books Closure Date 5:00 pm, Friday, 4 August 2017 Distribution Payment Date Wednesday, 30 August

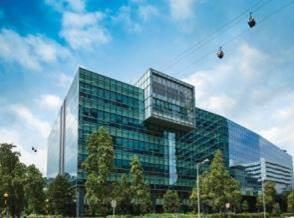
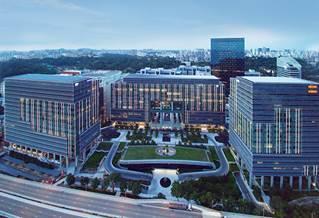
13 Key Highlights Portfolio Updates Mapletree Business City I 13
14 Portfolio Revenue and Net Property Income Strong Growth in Gross Revenue and NPI Driven by MBC I Existing Portfolio 1 Gross Revenue and NPI up 4.1% and 3.4% respectively Gross Revenue Net Property Income 46.9% 49.6% (S$mil) (S$mil) Q FY16/17 1Q FY17/18 1Q FY16/17 VivoCity PSA Building Mapletree Anson MLHF 1Q FY17/18 MBC I 1. Refers to VivoCity, PSA Building, Mapletree Anson and MLHF 2. Total may not add up due to rounding differences 14
15 Portfolio Occupancy Overall Portfolio Committed Occupancy at 98.5% As at 31 March 2017 As at 30 June 2017 VivoCity 99.0% 98.9% 1 MBC I 99.0% 99.1% 2 PSA Building 98.3% 95.5% 3 Mapletree Anson 100% 99.2% MLHF 79.2% 91.6% MCT Portfolio 97.9% 98.1% 1. Committed occupancy for VivoCity is 99.6% 2. Committed occupancy for MBC I is 99.4% 3. Committed occupancy for PSA Building is 95.7% 15
16 1Q FY17/18 Leasing Update Achieved 0.5% Rental Uplift for Entire Portfolio in 1Q FY17/18 Number of Leases Committed Retention Rate (by NLA) % Change in Fixed Rents 1 Retail % 1.7% 2 Office/ Business Park % -3.3% 3 MCT Portfolio % 0.5% 1. Based on average of the fixed rents over the lease period of the new leases divided by the preceding fixed rents of the expiring leases 2. Includes the effect from trade mix changes and units subdivided and/or amalgamated 3. Excluding MBC I, office portfolio rental uplift is 0.2%. MBC I s rent reversion is -5.9% 16
17 As % of Gross Rental Revenue Lease Expiry Profile (as at 30 June 2017) Portfolio Resilience Supported by Manageable Lease Expiries Portfolio WALE Office/Business Park Retail 2.7 years 3.4 years 2.0 years 18.2% 17.6% 14.6% 14.4% 7.9% 6.9% 7.2% 5.0% 3.9% 4.4% FY17/18 FY18/19 FY19/20 FY20/21 FY21/22 & Beyond Retail Office/Business Park 17
18 VivoCity Shopper Traffic and Tenant Sales Continued Growth in Shopper Traffic and Tenant Sales Shopper Traffic (mil) Tenant Sales (S$ mil) 1 7.2% 3.8% Q FY16/17 1Q FY17/ Q FY16/17 1Q FY17/18 1. Includes estimates of Tenant Sales for a small portion of tenants 18


19 VivoCity Asset Enhancement Initiatives Ongoing Conversion of Space on Level 1 and Level 2 to Improve Yield Fully committed with estimated ROI of approximately 25% on stabilised basis 1 Shops progressively commenced trading from May AEI expected to complete by 2Q FY17/18 1. Based on estimated capital expenditure of about S$3 mil 19


20 VivoCity Asset Enhancement Initiatives Adding a Public Library on Level 3 to strengthen VivoCity s offerings Convert part of Level 3 to a 3,000 square metre public library, with bonus GFA granted under the CSFS Further enhances VivoCity s positioning as a family-centric destination mall AEI targeted to commence in 3Q FY17/18 and complete by 3Q FY18/19 Photographs of library users are for reference only, courtesy of the National Library Board 20


21 VivoCity Focusing on Families and Children Overwhelming and positive response from shoppers Successful Launch of VivoCity Kids Club More than 5,500 registered kids club members over launch weekend (17-18 June 2017) Complements VivoCity s family-centric positioning and encourages continued patronage 21

22 Outlook VivoCity 22
23 Outlook Singapore Economy The Singapore economy grew 2.5% year-on-year in the second quarter of 2017, the same pace of growth as in the previous quarter. On a quarter-on-quarter seasonally-adjusted annualised basis, the economy expanded 0.4%, in contrast to the 1.9% contraction in the preceding quarter. Retail According to CBRE, Singapore s shopper habits have changed, resulting in tenant sales taking a hit, although consumer sentiments seem to be relatively healthy. Orchard Road and Suburban rents respectively declined for the tenth and seventh straight quarter in Q In the absence of clear demand drivers, rental outlook for the rest of the year and into 2018 is muted and vacancy is expected to continue to rise in H Office Leasing activity in the office market remained relatively subdued in Q with most of the leasing activity and interest concentrated on developments in the Core CBD region. CBRE noted that there is a general consensus that the office sector has improved and the worst could be over. However, outlook remains patchy with landlords of better quality buildings being better placed to capture projected upswings in rents. Sources: Singapore s Ministry of Trade and Industry Press Release, 14 July 2017 and CBRE MarketView Singapore Q
24 Outlook Business Park According to CBRE, Q was a relatively muted quarter. While leasing and enquiry activity has been slow in recent quarters, business parks in the city fringe have remained competitive as they offer very high-quality products in well-connected locations. Looking forward, CBRE expects rents to hold steady for the City Fringe micromarket with some downward pressure expected for business parks in the Rest of Island micromarket. Supply-side pressure remains relatively insignificant given the limited number of projects in the pipeline Overall MCT s portfolio is expected to remain resilient, supported by manageable expiries in its office/business park properties and VivoCity s relatively stable performance. 24
25 Thank You For enquiries, please contact: Teng Li Yeng Investor Relations Tel:
Mapletree Commercial Trust
 Mapletree Commercial Trust 3Q FY17/18 Financial Results 24 January 2018 1 Important Notice This presentation is for information only and does not constitute an offer or solicitation of an offer to sell
Mapletree Commercial Trust
 Mapletree Commercial Trust 3Q FY16/17 Financial Results 25 January 2017 1 Important Notice This presentation is for information only and does not constitute an offer or solicitation of an offer to sell
Mapletree Commercial Trust
 Mapletree Commercial Trust 1Q FY18/19 Financial Results 26 July 2018 1 Important Notice This presentation is for information only and does not constitute an offer or solicitation of an offer to sell or
Mapletree Commercial Trust
 Mapletree Commercial Trust 2Q & 1H FY18/19 Financial Results 24 October 2018 0 Important Notice This presentation is for information only and does not constitute an offer or solicitation of an offer to
Mapletree Commercial Trust s Distribution Per Unit for 1Q FY17/18 Rose 9.9% to 2.23 Singapore Cents
 For Immediate Release Mapletree Commercial Trust s Distribution Per Unit for 1Q FY17/18 Rose 9.9% to 2.23 Singapore Cents Gross revenue and net property income ( NPI ) for 1Q FY17/18 grew 46.9% and 49.6%
Mapletree Commercial Trust s Distribution Per Unit for 2Q FY17/18 Up 9.3% to 2.24 Singapore Cents
 For Immediate Release Mapletree Commercial Trust s Distribution Per Unit for 2Q FY17/18 Up 9.3% to 2.24 Singapore Cents Gross revenue and net property income ( NPI ) for 2Q FY17/18 grew 21.7% and 23.4%
Mapletree Commercial Trust s Distribution Per Unit for YTD FY17/18 Up 6.4% to 6.77 Singapore Cents
 For Immediate Release Mapletree Commercial Trust s Distribution Per Unit for YTD FY17/18 Up 6.4% to 6.77 Singapore Cents Gross revenue and net property income ( NPI ) for 3Q FY17/18 grew 0.8% and 1.9%
Mapletree Commercial Trust
 Mapletree Commercial Trust 4Q & FY17/18 Financial Results 24 April 2018 1 Important Notice This presentation is for information only and does not constitute an offer or solicitation of an offer to sell
MAPLETREE COMMERCIAL TRUST UNAUDITED FINANCIAL STATEMENTS AND DISTRIBUTION ANNOUNCEMENT FOR THE FIRST QUARTER FROM 1 APRIL 2017 TO 30 JUNE 2017
 (Constituted in the Republic of Singapore pursuant to a Trust Deed dated 5 August 005 (as amended)) MAPLETREE COMMERCIAL TRUST UNAUDITED FINANCIAL STATEMENTS AND TABLE OF CONTENTS Item No. Description
Mapletree Commercial Trust s 3Q FY18/19 Net Property Income Grew 2.2% Year-on-Year Distribution Per Unit Up 1.3% to 2.
 For Immediate Release Mapletree Commercial Trust s 3Q FY18/19 Net Property Income Grew 2.2% Year-on-Year Distribution Per Unit Up 1.3% to 2.33 Singapore Cents Gross revenue and net property income ( NPI
Mapletree Commercial Trust s Distribution Per Unit for Full Year Up 4.9% to 9.04 Singapore Cents
 For Immediate Release Mapletree Commercial Trust s Distribution Per Unit for Full Year Up 4.9% to 9.04 Singapore Cents Gross revenue and net property income ( NPI ) for 4Q FY17/18 grew 1.3% and 1.2% respectively
Mapletree Commercial Trust s Income Available for Distribution for 2Q FY16/17 grew 25.4% year-on-year to S$53.7 million
 For Immediate Release Mapletree Commercial Trust s Income Available for Distribution for 2Q FY16/17 grew 25.4% year-on-year to S$53.7 million Gross revenue and net property income ( NPI ) for 2Q FY16/17
Mapletree Commercial Trust Delivers Stable Returns
 For Immediate Release Mapletree Commercial Trust Delivers Stable Returns Distribution per Unit ( DPU ) for 3Q FY15/16 1 at 2.08 cents, bringing DPU for Year-To-Date ( YTD ) FY15/16 2 to 6.11 cents, up
Mapletree Commercial Trust
 Mapletree Commercial Trust 3Q FY18/19 Financial Results 23 January 2019 0 Important Notice This presentation is for information only and does not constitute an offer or solicitation of an offer to sell
Mapletree Commercial Trust Results Announcement. For the period 27 April 2011 to 30 June 2011
 Mapletree Commercial Trust Results Announcement For the period 27 April 2011 to 30 June 2011 Disclaimer This presentation is for information only and does not constitute an invitation or offer to acquire,
Mapletree Commercial Trust s Distribution per Unit for 1Q FY15/16 1 rose 3.1% year-on-year
 For Immediate Release Mapletree Commercial Trust s Distribution per Unit for 1Q FY15/16 1 rose 3.1% year-on-year Distribution per Unit ( DPU ) for 1Q FY15/16 up 3.1%, to 2.01 cents Property Operating Expenses
MAPLETREE COMMERCIAL TRUST UNAUDITED FINANCIAL STATEMENTS AND DISTRIBUTION ANNOUNCEMENT FOR THE FIRST QUARTER FROM 1 APRIL 2018 TO 30 JUNE 2018
 (Constituted in the Republic of Singapore pursuant to a Trust Deed dated 25 August 2005 (as amended)) MAPLETREE COMMERCIAL TRUST UNAUDITED FINANCIAL STATEMENTS AND TABLE OF CONTENTS Item No. Description
7 th Annual General Meeting. 25 July 2018
 7 th Annual General Meeting 25 July 2018 1 Important Notice This presentation is for information only and does not constitute an offer or solicitation of an offer to sell or invitation to subscribe for
(Constituted in the Republic of Singapore pursuant to a Trust Deed dated 25 August 2005 (as amended))
)") (Constituted in the Republic of Singapore pursuant to a Trust Deed dated 5 August 005 (as amended)) MAPLETREE COMMERCIAL TRUST UNAUDITED FINANCIAL STATEMENTS AND TABLE OF CONTENTS Item No. Description
(Constituted in the Republic of Singapore pursuant to a Trust Deed dated 5 August 005 (as amended)) MAPLETREE COMMERCIAL TRUST UNAUDITED FINANCIAL STATEMENTS AND TABLE OF CONTENTS Item No. Description
(Constituted in the Republic of Singapore pursuant to a Trust Deed dated 25 August 2005 (as amended))
)") (Constituted in the Republic of Singapore pursuant to a Trust Deed dated 25 August 2005 (as amended)) MAPLETREE COMMERCIAL TRUST UNAUDITED FINANCIAL STATEMENTS AND TABLE OF CONTENTS Item No. Description
(Constituted in the Republic of Singapore pursuant to a Trust Deed dated 25 August 2005 (as amended)) MAPLETREE COMMERCIAL TRUST UNAUDITED FINANCIAL STATEMENTS AND TABLE OF CONTENTS Item No. Description
Results Slide 3. Balance sheet Slide 8. Operational performance Slide 11. Growth strategy and market outlook Slide 16
 1Q FY18 Financial Results 5 January 2018 Disclaimer This presentation is for information only and does not constitute an invitation or offer to a c q u i r e, p u r c h a s e or s u b s c r i b e f o r
3Q2016 Financial Results Presentation 26 October Pioneer Crescent
 3Q2016 Financial Results Presentation 26 October 2016 25 Pioneer Crescent Content Executive Summary Real Estate Highlights Financial & Capital Management Highlights Appendix 2 3Q2016 Executive Summary
(Constituted in the Republic of Singapore pursuant to a Trust Deed dated 25 August 2005 (as amended))
)") (Constituted in the Republic of Singapore pursuant to a Trust Deed dated 5 August 005 (as amended)) MAPLETREE COMMERCIAL TRUST UNAUDITED FINANCIAL STATEMENTS AND TABLE OF CONTENTS Item No. Description
(Constituted in the Republic of Singapore pursuant to a Trust Deed dated 5 August 005 (as amended)) MAPLETREE COMMERCIAL TRUST UNAUDITED FINANCIAL STATEMENTS AND TABLE OF CONTENTS Item No. Description
2Q FY18 Financial Results 6 April 2018
 2Q FY18 Financial Results 6 April 2018 Disclaimer This presentation is for information only and does not constitute an invitation or offer to a c q u i r e, p u r c h a s e or s u b s c r i b e f o r u
FINANCIAL RESULTS For First Quarter ended 31 March 2015
 FINANCIAL RESULTS For First Quarter ended 31 March 2015 AGENDA Q1 Highlights Financial Performance Portfolio Performance AEI Updates Looking Ahead Unit Performance 2 Q1 HIGHLIGHTS Q1 HIGHLIGHTS FINANCIAL
Financial Results for the Quarter / Year Ended 31 Mar April 2012
 Financial Results for the Quarter / Year Ended 31 Mar 2012 19 April 2012 Disclaimer This Presentation is focused on comparing results for the three months ended 31 Mar 2012 versus results achieved in the
4QFY2013 and 2HFY2013 Results Presentation. January 2014
 4QFY2013 and 2HFY2013 Results Presentation January 2014 1 Disclaimer This presentation should be read in conjunction with the financial statements of Soilbuild Business Space REIT for the period from 1
Financial Results for 4 th Quarter and Year Ended 31 December January 2019
 Financial Results for 4 th Quarter and Year Ended 31 December 2018 30 January 2019 Important Notice This presentation should be read in conjunction with the announcements released by OUE Commercial REIT
2Q FY16. Financial Results
 2Q FY16 Financial Results 4 April 2016 Disclaimer This presentation is for information only and does not constitute an invitation or offer to a c q u i r e, p u r c h a s e or s u b s c r i b e f o r u
K-REIT Asia Unaudited Results for the Second Quarter and Half Year Ended 30 June 2011
 PRESS RELEASE K-REIT Asia Unaudited Results for the Second Quarter and Half Year Ended 30 June 2011 18 July 2011 The Directors of K-REIT Asia Management Limited, as manager of K-REIT Asia, announce the
3Q 2012 Presentation Slides. 1 Nov 2012
 3Q 2012 Presentation Slides 1 Nov 2012 2 Important Notice This material shall be read in conjunction with CIT s financial statements for the financial period ended 30 Sep 2012. The value of units in CIT
1Q FY19 Financial Results
 1Q FY19 Financial Results 4 January 2019 Disclaimer This presentation is for information only and does not constitute an invitation or offer to a c q u i r e, p u r c h a s e or s u b s c r i b e f o r
MNACT s DPU for 3Q FY18/19 was 3.2% higher than 3Q FY17/18
 For Immediate Release MNACT s DPU for Q FY8/9 was.% higher than Q FY7/8 Highlights Driven by acquisition of Japan Properties and higher contribution from existing properties 89% of expiring/expired leases
REITs Symposium May 2018
 REITs Symposium 2018 19 May 2018 Important Notice This presentation shall be read in conjunction with OUE Commercial REIT s Financial Results announcement for 1Q 2018 dated 10 May 2018. This presentation
Frasers Commercial Trust 3QFY13 Financial Results. 24 July 2013
 Frasers Commercial Trust 3QFY13 Financial Results 24 July 2013 Important notice Certain statements in this Presentation constitute forward-looking statements, including forward-looking financial information.
CIT reports steady 2Q2015 results and improved capital structure
 (Constituted in the Republic of Singapore pursuant to a trust deed dated 31 March 2006 (as amended)) Press Release CIT reports steady 2Q2015 results and improved capital structure Net property income increased
Notice of Annual General Meeting
 7 th Annual General Meeting 18 July 2017 Important Notice This presentation shall be read in conjunction with Mapletree Industrial Trust s ( MIT ) financial statements for the financial year ended 31 March
Financial Results for 3 rd Quarter November 2017
 Financial Results for 3 rd Quarter 2017 2 November 2017 Important Notice This presentation shall be read in conjunction with OUE Commercial REIT s Financial Results announcement for 3Q 2017 dated 2 November
K-REIT Asia s Distributable Income for First Half 2012 (1H 2012) Grew by 94.6% Year-on-Year
 Grew by 94.6% Year-on-Year") PRESS RELEASE K-REIT Asia Unaudited Results for the Second Quarter and Half Year Ended 30 June 2012 16 July 2012 The Directors of K-REIT Asia Management Limited, as manager of K-REIT Asia, announce the
PRESS RELEASE K-REIT Asia Unaudited Results for the Second Quarter and Half Year Ended 30 June 2012 16 July 2012 The Directors of K-REIT Asia Management Limited, as manager of K-REIT Asia, announce the
Financial Results for 3 rd Quarter 2016
 Financial Results for 3 rd Quarter 2016 1 November 2016 Important Notice This presentation shall be read in conjunction with OUE Commercial REIT s Financial Results announcement for 3Q 2016 dated 1 November
Presentation for REITs Symposium 2017
 Presentation for REITs Symposium 2017 27 May 2017 Important Notice This presentation shall be read in conjunction with OUE Commercial REIT s Financial Results announcement for 1Q 2017 dated 5 May 2017.
FY2015 Financial Results Presentation
 FY2015 Financial Results Presentation 14 January 2016 16 International Business Park 2 Content Executive Summary Financial Summary Real Estate Highlights Financial & Capital Management Highlights Appendix
Citi-REITAS-SGX C-Suite Singapore REITs and Sponsors Forum
 Citi-REITAS-SGX C-Suite Singapore REITs and Sponsors Forum 23 August 2018 Important Notice This presentation shall be read in conjunction with OUE Commercial REIT s Financial Results announcement for 2Q
Results for the Third Quarter ended 30 September October 2008
 Results for the Third Quarter ended 30 September 2008 21 October 2008 Disclaimer This Presentation is focused on comparing results for the three months ended 30 September 2008 versus results achieved in
MAPLETREE LOGISTICS TRUST S 1Q FY17/18 DPU RISES 2% YEAR-ON-YEAR TO CENTS
 For Immediate Release MAPLETREE LOGISTICS TRUST S 1Q FY17/18 DPU RISES 2% YEAR-ON-YEAR TO 1.887 CENTS Highlights: Amount distributable to Unitholders grew 2.5% year-on-year to S$47.2 million Stable operations
Financial Results for 4 th Quarter 2017 and Year Ended 31 December 2017
 Financial Results for 4 th Quarter 2017 and Year Ended 31 December 2017 31 January 2018 Important Notice This presentation shall be read in conjunction with OUE Commercial REIT s Financial Results announcement
MAPLETREE LOGISTICS TRUST DELIVERS STEADY PERFORMANCE FOR 1H FY16/17
 For Immediate Release MAPLETREE LOGISTICS TRUST DELIVERS STEADY PERFORMANCE FOR 1H FY16/17 Highlights: Maintained DPU at 1.86 cents for 2Q FY16/17 and 3.71 cents for 1H FY16/17 Stable portfolio occupancy
SGX REIT & BT SEMINAR Tokyo, 30 June Pioneer Crescent
 SGX REIT & BT SEMINAR Tokyo, 30 June 3016 25 Pioneer Crescent Singapore Industrial REITs (S-REITs) 3 Key Features Bond-like listed security ( Dividend Play ) that provides steady income distribution stream
SGX - DBS Vickers - REITAS SREITS Corporate Day Investor Presentation
 SGX - DBS Vickers - REITAS SREITS Corporate Day Investor Presentation 27 Feb 1 Mar 2018 Important Notice This presentation shall be read in conjunction with OUE Commercial REIT s Financial Results announcement
Financial Results for the Quarter Ended 31 Dec January 2012
 Financial Results for the Quarter Ended 31 Dec 2011 19 January 2012 Disclaimer This Presentation is focused on comparing results for the three months ended 31 Dec 2011 versus results achieved in the three
BUILDING ON OUR STRENGTHS BHG RETAIL REIT FINANCIAL RESULTS FOR THE 2 ND QUARTER AND HALF YEAR ENDED 30 JUNE AUGUST 2018
 BUILDING ON OUR STRENGTHS BHG RETAIL REIT FINANCIAL RESULTS FOR THE 2 ND QUARTER AND HALF YEAR ENDED 30 JUNE 2018 8 AUGUST 2018 Disclaimer Certain statements made in this presentation may not be based
MAPLETREE LOGISTICS TRUST S QUARTERLY DISTRIBUTION PER UNIT RISES 10% YEAR-ON-YEAR
 For Immediate Release MAPLETREE LOGISTICS TRUST S QUARTERLY DISTRIBUTION PER UNIT RISES 10% YEAR-ON-YEAR Highlights: Distribution Per Unit ( DPU ) of 1.70 cents for the 3 months ended 31 March 2012 Portfolio
CAPITALAND MALL TRUST Singapore s First & Largest Retail REIT. First Quarter 2017 Financial Results
 CAPITALAND MALL TRUST Singapore s First & Largest Retail REIT First Quarter 2017 Financial Results 20 April 2017 Disclaimer This presentation may contain forward-looking statements that involve assumptions,
SABANA SHARI AH COMPLIANT INDUSTRIAL REIT
 SABANA SHARI AH COMPLIANT INDUSTRIAL REIT 1Q 2015: First Quarter Ended 31 March 2015 Financial Results Presentation 20 April 2015 Important Notice Disclaimer This presentation shall be read in conjunction
Variance (%) Distribution Period 1 July 2018 to 30 September 2018
 Distribution Period 1 July 2018 to 30 September 2018") PRESS RELEASE OUE H-Trust reports DPS of 1.28 cents for 3Q2018 Crowne Plaza Changi Airport continues to demonstrate progressive improvements with 6.3% y-o-y increase in RevPAR to S$187 Achieved high occupancy
PRESS RELEASE OUE H-Trust reports DPS of 1.28 cents for 3Q2018 Crowne Plaza Changi Airport continues to demonstrate progressive improvements with 6.3% y-o-y increase in RevPAR to S$187 Achieved high occupancy
Mapletree Greater China Commercial Trust. Financial Results for the Period from 1 April 2015 to 30 June 2015
 Mapletree Greater China Commercial Trust Financial Results for the Period from 1 April 2015 to 30 June 2015 Disclaimer This presentation is for information only and does not constitute an invitation or
FY2016. Financial Results
 FY2016 Financial Results 6 October 2016 Disclaimer This presentation is for information only and does not constitute an invitation or offer to a c q u i r e, p u r c h a s e or s u b s c r i b e f o r
Sabana Shari ah Compliant Industrial REIT 3Q 2018 Financial Results Presentation. 26 October 2018
 Sabana Shari ah Compliant Industrial REIT 3Q 2018 Financial Results Presentation 26 October 2018 Important Notice Disclaimer This presentation shall be read in conjunction with the financial information
Keppel REIT. Second Quarter and First Half 2017 Financial Results. 18 July 2017
 Keppel REIT Second Quarter and First Half 2017 Financial Results 18 July 2017 Outline Key Highlights for 1H 2017 3 Financial Performance & Capital Management 6 Portfolio Performance 10 Market Updates 14
Hong Kong Non-Deal Roadshow Hong Kong, 4 March International Business Park
 Hong Kong Non-Deal Roadshow Hong Kong, 4 March 2016 16 International Business Park 2 Content CIT FY2015 Results Executive Summary Financial Summary Real Estate Highlights Financial & Capital Management
Investor Presentation March 2016
 Investor Presentation March 2016 Important Notice This presentation shall be read in conjunction with Mapletree Industrial Trust s ( MIT ) financial results for Third Quarter Financial Year 2015/2016 in
CLSA Asean Forum Bangkok, March International Business Park
 CLSA Asean Forum Bangkok, March 2016 16 International Business Park 2 Content Overview of CIT CIT FY2015 Financial Results Overview Financial & Capital Management Highlights Real Estate Highlights Singapore
Investor Presentation for Tokyo Non-Deal Roadshow. 25 August 2016
 Investor Presentation for Tokyo Non-Deal Roadshow 25 August 2016 Important Notice This presentation shall be read in conjunction with OUE Commercial REIT s Financial Results announcement for 1Q 2016 dated
CAPITALAND MALL TRUST Singapore s First & Largest REIT
 Photo Credit: Chun Kwong Leong, Singapore CAPITALAND MALL TRUST Singapore s First & Largest REIT 1Q 2016 Financial Results 15 April 2016 Disclaimer This presentation may contain forward-looking statements
SABANA SHARI AH COMPLIANT INDUSTRIAL REIT
 SABANA SHARI AH COMPLIANT INDUSTRIAL REIT 3Q 2017: Third Quarter Ended 30 September 2017 Financial Results Presentation 23 October 2017 Important Notice Disclaimer This presentation shall be read in conjunction
First Quarter 2017 Financial Results 19 April Q 2017 Financial Results 19 April 2017
 First Quarter 2017 Financial Results 19 April 2017 1Q 2017 Financial Results 19 April 2017 Outline Key Highlights for 1Q 2017 3 Financial Highlights & Capital Management 4 Portfolio Performance 10 Market
SGREIT achieves DPU of 1.18 cents for 4Q FY16/17
 Media release by: YTL Starhill Global REIT Management Limited (YTL Starhill Global) Manager of: Starhill Global Real Estate Investment Trust (SGREIT) SGREIT achieves DPU of 1.18 cents for 4Q FY16/17 HIGHLIGHTS
MGCCT Achieves Stable DPU of cents for 1H FY17/18
 For Immediate Release MGCCT Achieves Stable DPU of 3.714 cents for 1H FY17/18 1H FY17/18 Available Distribution per Unit ( DPU ) 1 was 3.714 cents, 2.9% higher compared to 1H FY16/17 81.3% of FY17/18 expired/expiring
MAPLETREE LOGISTICS TRUST S 3Q FY13/14 DISTRIBUTION PER UNIT RISES 7% YEAR-ON-YEAR
 For Immediate Release MAPLETREE LOGISTICS TRUST S 3Q FY13/14 DISTRIBUTION PER UNIT RISES 7% YEAR-ON-YEAR Highlights: Amount Distributable to Unitholders registered 8% year-on-year growth Results underpinned
MGCCT Achieves Stable DPU of cents for 1Q FY17/18
 For Immediate Release MGCCT Achieves Stable DPU of 1.851 cents for 1Q FY17/18 Gross revenue and net property income ( NPI ) for 1Q FY17/18 grew 4.6% and 3.7% respectively compared to 1Q FY16/17 1Q FY17/18
Annual General Meeting. 28 April 2010
 CapitaCommercial Trust Annual General Meeting Presentation 28 April 2010 Important Notice The past performance of CCT is not indicative of the future performance of CCT. Similarly, the past performance
NOT FOR DISTRIBUTION IN OR INTO THE UNITED STATES, EUROPEAN ECONOMIC AREA, CANADA, JAPAN OR AUSTRALIA
 NOT FOR DISTRIBUTION IN OR INTO THE UNITED STATES, EUROPEAN ECONOMIC AREA, CANADA, JAPAN OR AUSTRALIA (Constituted in the Republic of Singapore pursuant to a Trust Deed dated 25 August 2005 (as amended))
Singapore Investor Roadshow
 Singapore Investor Roadshow 11 May 2015 16 International Business Park Important Notice This material shall be read in conjunction with CIT s results announcements for the financial period ended 31 December
Mapletree Logistics Trust s 2Q FY17/18 Distribution per Unit Grows 1.5% Year-on-Year
 For Immediate Release Mapletree Logistics Trust s 2Q FY17/18 Distribution per Unit Grows 1.5% Year-on-Year Amount distributable to Unitholders increased 3.5% year-on-year to S$48.2 million Continuing,
FY2018 Results Presentation. 22 Jan 2019
 FY2018 Results Presentation 22 Jan 2019 Disclaimer This presentation may contain forward-looking statements that involve assumptions, risks and uncertainties. Actual future performance, outcomes and results
Viva Industrial Trust 4Q2017 & FY2017 Results Presentation. 26 January 2018
 Viva Industrial Trust 4Q2017 & FY2017 Results Presentation 26 January 2018 1 Important Notice This presentation is for information purposes only and does not constitute or form part of an offer, invitation
FY2014 Financial Results Presentation
 FY2014 Financial Results Presentation 16 January 2015 16 International Business Park Important Notice This material shall be read in conjunction with CIT s results announcements for the financial period
OUE C-REIT Achieved Distribution of S$17.8 million in 3Q 2017, 3.2% Higher YoY
 PRESS RELEASE For Immediate Release OUE C-REIT Achieved Distribution of S$17.8 million in 3Q 2017, 3.2% Higher YoY Key Highlights: 3Q 2017 amount available for distribution of S$17.8 million increased
growth and inorganic growth through yield accretive acquisitions from our Sponsor and third parties.
 PRESS RELEASE OUE H-Trust reports DPS of 1.17 cents for 2Q2018 Crowne Plaza Changi Airport s operating performance has progressively improved with RevPAR increasing 10.5% Higher occupancy of 97.4% at Mandarin
AIMS AMP CAPITAL INDUSTRIAL REIT
 AIMS AMP CAPITAL INDUSTRIAL REIT FY2014: Third Quarter ended 31 December 2013 Results Presentation 29 January 2014 Important notice Disclaimer This Presentation is focused on comparing actual results for
MAPLETREE LOGISTICS TRUST S 4Q FY17/18 DISTRIBUTION PER UNIT RISES 4% TO CENTS
 For Immediate Release MAPLETREE LOGISTICS TRUST S 4Q FY17/18 DISTRIBUTION PER UNIT RISES 4% TO 1.937 CENTS Highlights: 4Q FY17/18 amount distributable to Unitholders grew 27% year-on-year to S$59.2 million
OUE C-REIT s FY2015 Distribution 22.2% Higher YoY, 4Q 2015 DPU Exceeded Circular Forecast by 20.4%
 PRESS RELEASE For Immediate Release OUE C-REIT s FY2015 Distribution 22.2% Higher YoY, 4Q 2015 DPU Exceeded Circular Forecast by 20.4% Key Highlights: 4Q 2015 distribution per unit ( DPU ) exceeded Circular
OUE C-REIT Achieved Higher YoY Distribution of S$17.8 million in 2Q 2017
 PRESS RELEASE For Immediate Release OUE C-REIT Achieved Higher YoY Distribution of S$17.8 million in 2Q 2017 Key Highlights: 2Q 2017 amount available for distribution of S$17.8 million increased 0.6% year-on-year
CAPITALAND MALL TRUST
 CAPITALAND MALL TRUST Singapore s First & Largest Retail REIT First Quarter 2018 Financial Results 20 April 2018 1 Disclaimer This presentation may contain forward-looking statements that involve assumptions,
Balance Sheet Positioned for Future Growth with No Major Refinancing Due Until 2016
 (Constituted in the Republic of Singapore pursuant to a trust deed dated 31 March 2006 (as amended)) Press Release Balance Sheet Positioned for Future Growth with No Major Refinancing Due Until 2016 Refinanced
AIMS AMP CAPITAL INDUSTRIAL REIT
 AIMS AMP CAPITAL INDUSTRIAL REIT FY2018: First Quarter Financial Results Ended 30 June 2017 Results Presentation 27 July 2017 1 Important notice Disclaimer This Presentation is focused on comparing actual
 General Announcement Page 1 of 1 General Announcement Form Version 8.2 (Enhanced) Initiated by CS_TMF GLOBAL SERVICES MALAYSIA on 18/07/2014 11:09:44 AM Ownership transfer to CS_TMF GLOBAL SERVICES MALAYSIA/EDMS/KLSE
Mapletree Industrial Trust Achieves 12.0% Year-on-Year Increase in Distributable Income for 3QFY13/14
 (Constituted in Republic of Singapore pursuant to a Trust Deed dated 29 January 2008 (as amended)) PRESS RELEASE Mapletree Industrial Trust Achieves 12.0% Year-on-Year Increase in Distributable Income
Investor Presentation August 2017
 Investor Presentation August 2017 Important Notice This presentation shall be read in conjunction with Mapletree Industrial Trust s ( MIT ) financial results for First Quarter Financial Year 2017/2018
Citi ASEAN Conference 12 June Tai Seng Street
 Citi ASEAN Conference 12 June 2014 1 16 Tai Seng Street Important Notice This material shall be read in conjunction with CIT s financial statements for the financial period ended 31 Mar 2014. The value
NOT FOR DISTRIBUTION IN OR INTO THE UNITED STATES, EUROPEAN ECONOMIC AREA, CANADA, JAPAN OR AUSTRALIA
 NOT FOR DISTRIBUTION IN OR INTO THE UNITED STATES, EUROPEAN ECONOMIC AREA, CANADA, JAPAN OR AUSTRALIA (Constituted in the Republic of Singapore pursuant to a Trust Deed dated 14 February 2013 (as amended))
Mapletree Industrial Trust Achieves Distributable Income of S$35.8 million for 4QFY11/12
 (Constituted in Republic of Singapore pursuant to a Trust Deed dated 29 January 2008 (as amended)) PRESS RELEASE Mapletree Industrial Trust Achieves Distributable Income of S$35.8 million for 4QFY11/12
FY2012 Financial Results Presentation
 FY2012 Financial Results Presentation 21 January 2013 Knowing. Believing. Delivering ARA-CWT Trust Management (Cache) Limited Agenda Overview & FY12 Key Highlights 4QFY12 & FY12 Full Year Financial Performance
Investor Presentation November 2015
 Investor Presentation November 2015 Important Notice This presentation shall be read in conjunction with Mapletree Industrial Trust s ( MIT ) financial results for Second Quarter Financial Year 2015/2016
Results for the Second Quarter ended 30 June July 2008
 Results for the Second Quarter ended 30 June 2008 18 July 2008 Disclaimer This Presentation is focused on comparing results for the three months ended 30 June 2008 versus results achieved in the three
2Q2014 Financial Results 24 July Creating Value & Delivering Growth
 2Q2014 Financial Results 24 July 2014 1 Creating Value & Delivering Growth Important Notice This material shall be read in conjunction with CIT s financial statements for the financial period ended 30
SPH REIT delivered consistent returns
 For Immediate Release October 11, 2018 PRESS RELEASE SPH REIT delivered consistent returns FY2018 DPU was 5.54 cents, an increase of 0.2% year-on-year Maintained high occupancy of 99.4% Two months contribution
OSK DMG ASEAN & Hong Kong Corporate Day June 2012
 OSK DMG ASEAN & Hong Kong Corporate Day 26-28 June 2012 2 Important Notice This material shall be read in conjunction with CIT s financial statements for the financial period ended 31 March 2012. The value
SPH REIT s 4Q FY14 Distribution of 1.39 cents exceeds Forecast by 6.1%
 For Immediate Release October 13, 2014 PRESS RELEASE SPH REIT s 4Q FY14 Distribution of 1.39 cents exceeds Forecast by 6.1% Paragon and The Clementi Mall achieved healthy rental reversion of 10.5% and
6 th Annual General Meeting 24 April International Business Park
 6 th Annual General Meeting 24 April 2015 16 International Business Park Important Notice This material shall be read in conjunction with CIT s results announcements for the financial period ended 31 December