Mapletree Commercial Trust
|
|
|
- Nicholas Nathaniel Preston
- 5 years ago
- Views:
Transcription


1 Mapletree Commercial Trust 1Q FY18/19 Financial Results 26 July
2 Important Notice This presentation is for information only and does not constitute an offer or solicitation of an offer to sell or invitation to subscribe for or acquire any units in Mapletree Commercial Trust ( MCT and units in MCT ( Units )). The past performance of the Units and MCT is not indicative of the future performance of MCT or Mapletree Commercial Trust Management Ltd. ( Manager ). The value of Units and the income from them may rise or fall. Units are not obligations of, deposits in or guaranteed by the Manager or any of its affiliates. An investment in Units is subject to investment risks, including the possible loss of the principal amount invested. Investors have no right to request the Manager to redeem their Units while the Units are listed. It is intended that unitholders may only deal in their Units through trading on the SGX-ST. Listing of the Units on the SGX-ST does not guarantee a liquid market for the Units. This presentation may also contain forward-looking statements that involve risks and uncertainties. Actual future performance, outcomes and results may differ materially from those expressed in forward-looking statements as a result of risks, uncertainties and assumptions. Representative examples of these factors include general industry and economic conditions, interest rate trends, cost of capital, occupancy rate, construction and development risks, changes in operating expenses (including employees wages, benefits and training costs), governmental and public policy changes and the continued availability of financing. You are cautioned not to place undue reliance on these forward-looking statements, which are based on current view of management on future events. Nothing in this presentation should be construed as financial, investment, business, legal or tax advice and you should consult your own independent professional advisors. This presentation shall be read in conjunction with MCT s financial results for First Quarter from 1 April 2018 to 30 June 2018 in the SGXNET announcement dated 26 July

3 Agenda Key Highlights Financial Performance Portfolio Updates Outlook 3

4 Key Highlights VivoCity 4
5 Key Highlights Financial Performance Gross revenue for 1Q FY18/19 grew 0.7% from 1Q FY17/18. NPI for the same period grew 2.1% year-on-year driven by higher contribution from VivoCity, Bank of America Merrill Lynch HarbourFront ( MLHF ), PSA Building and Mapletree Business City ( MBC I ) DPU for 1Q FY18/19 held steady at 2.23 Singapore cents in spite of downtime from the ongoing asset enhancement initiatives ( AEI ) at VivoCity Portfolio Performance VivoCity achieved 0.4% growth in shopper traffic. Tenant sales temporarily affected by spaces vacated to make way for public library on Level 3, and to create concept stores on Level 1 Basement 1 extension launched in June 2018, adding 24,000 square feet of new retail space that houses 10 exciting lifestyle and athleisure brands New and larger format concept stores by Zara, Superdry and Pull & Bear opened in 1Q FY18/19, further defining VivoCity s position as a key destination mall 5
6 Key Highlights Capital Management Entered into committed revolving credit facilities totalling S$150.0 million, and increased Multicurrency Medium Term Note ( MTN ) Programme limit from S$1.0 billion to S$3.0 billion in June 2018 to enhance financial flexibility Secured term loan facilities aggregating S$260.0 million in July 2018 for refinancing Maintained ample debt headroom. Debt maturity profile remained well-distributed with no more than 20% of debt due for refinancing in any financial year. 6

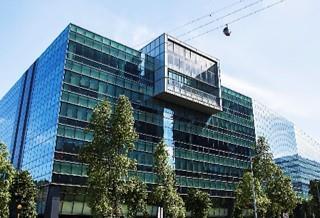
7 Financial Performance Mapletree Business City I 7
8 1Q FY18/19 Financial Scorecard 1Q FY18/19 DPU held steady at 2.23 Singapore cents Led by higher NPI contribution from VivoCity, MLHF, PSA Building and MBC I S$ 000 unless otherwise stated 1Q FY18/19 1Q FY17/18 Variance Gross Revenue 108, , % Property Operating Expenses (22,595) (23,585) 4.2% Net Property Income 85,938 84, % Net Finance Costs (16,895) (15,460) 9.3% Income Available for Distribution 64,610 64, % Distribution per Unit (cents)
9 Balance Sheet Maintained robust balance sheet through prudent and active capital management S$ 000 unless otherwise stated As at 30 June 2018 As at 31 March 2018 Investment Properties 6,685,844 6,682,000 Other Assets 68,942 58,813 Total Assets 6,754,786 6,740,813 Net Borrowings 2,347,418 2,329,431 Other Liabilities 117, ,009 Net Assets 4,290,252 4,283,373 Units in Issue ( 000) 2,885,761 2,880,156 Net Asset Value per Unit (S$)
10 Key Financial Indicators Debt headroom of ~S$1.2 bil based on 45% gearing limit Every 25 bps change in Swap Offer Rate estimated to impact DPU by 0.05 cents As at 30 June 2018 As at 31 March 2018 As at 30 June 2017 Total Debt Outstanding S$2,345.6 mil S$2,327.6 mil S$2,327.6 mil % Fixed Rate Debt 75.3% 78.9% 73.7% Gearing Ratio 34.7% % 36.4% Interest Coverage Ratio (YTD) 4.6 times 4.8 times 4.9 times Average Term to Maturity of Debt 3.6 years 3.9 years 3.8 years Weighted Average All-In Cost of Debt (p.a.) Unencumbered Assets as % of Total Assets 2.91% % % 4 100% 100% 100% MCT Corporate Rating (by Moody s) Baa1 Baa1 Baa1 1. Based on total gross borrowings divided by total assets. Correspondingly, the ratio of total gross borrowings to total net assets is 54.7% 2. Annualised based on the quarter ended 30 June For the year ended 31 March Annualised based on the quarter ended 30 June
11 Gross Debt (S$ mil) Debt Maturity Profile (as at 30 June 2018) Well-distributed with no more than 20% of debt due for refinancing in any financial year Total gross debt: S$2,345.6 mil Entered into committed revolving credit facilities totalling S$150.0 mil Increased MTN Programme limit from S$1.0 bil to S$3.0 bil Secured S$85.0 mil 5-year and S$175.0 mil 5.75-year term loan facilities in July 2018 for refinancing New term loan facilities secured in July 2018 Bank Debt Medium Term Note ("MTN") To be refinanced % of Total Debt FY18/19 FY19/20 FY20/21 FY21/22 FY22/23 FY23/24 FY24/25 FY25/26 FY26/27 FY27/28 6% 11% 19% 19% 20% 9% 5% - 7% 4% 11
12 Distribution Details Distribution Period 1 April June 2018 Distribution Amount 2.23 Singapore cents per unit Distribution Timetable Notice of Books Closure Date Thursday, 26 July 2018 Last Day of Trading on cum Basis Tuesday, 31 July 2018 Ex-Date Wednesday, 1 August 2018 Books Closure Date 5:00 pm, Friday, 3 August 2018 Distribution Payment Date Friday, 31 August

13 Portfolio Updates VivoCity 13
14 Portfolio Revenue and Net Property Income Continued growth in portfolio gross revenue and NPI in spite of downtime at VivoCity Gross Revenue Net Property Income 0.7% 2.1% (S$mil) (S$mil) Q FY17/18 1Q FY18/19 1Q FY17/18 1Q FY18/19 VivoCity MBC I PSA Building Mapletree Anson MLHF 1. Total may not add up due to rounding differences 14
15 Portfolio Occupancy Overall portfolio committed occupancy at 99.2% As at 30 June 2017 As at 31 March 2018 Occupancy as at 30 June 2018 Actual Committed VivoCity 98.9% 93.1% % % MBC I 99.1% 99.4% 98.6% 98.6% PSA Building 95.5% 96.1% 95.4% 98.7% Mapletree Anson 99.2% 86.6% 90.8% 100.0% MLHF 91.6% 100.0% 100.0% 100.0% MCT Portfolio 98.1% 96.1% 96.4% 99.2% 1. This actual occupancy is based on VivoCity s enlarged NLA of 1,077,191 square feet resulting from the added public library on Level 3 and bonus GFA (from the Community/Sports Facilities Scheme) deployed to extend Basement 1. The additional NLA on Level 3 and Basement 1 has been fully committed, but Basement 1 was opened only in June 2018 while Level 3 is currently undergoing fitting-out 15
16 1Q FY18/19 Leasing Update Achieved 1.2% portfolio rental reversion 1 Number of Leases Committed Retention Rate (by NLA) % Change in Fixed Rents 2 Retail % 2.1% 3 Office/Business Park % -5.3% Including rent review % MCT Portfolio % 0.3% MCT Portfolio (including rent review 1 ) % 1. Includes the effect of rent review by a key tenant at MBC I for ~195,000 square feet of space 2. Based on the average of the fixed rents over the lease period of the new leases divided by the preceding fixed rents of the expiring leases 3. Includes the effect from trade mix changes and units subdivided and/or amalgamated 16
17 As % of Gross Rental Revenue Lease Expiry Profile (as at 30 June 2018) Portfolio resilience supported by manageable lease expiries WALE Committed Basis Portfolio 2.6 years 1 Retail 2.3 years Office/Business Park 3.0 years 14.3% 15.3% 14.8% 7.5% 5.1% 6.4% 10.0% 10.5% 8.7% 7.3% FY18/19 FY19/20 FY20/21 FY21/22 FY22/23 & Beyond Retail Office/Business Park 1. Portfolio WALE was 2.2 years based on the date of commencement of leases 17
18 VivoCity Shopper Traffic and Tenant Sales Shopper traffic grew 0.4% Tenant sales temporarily affected by spaces vacated to make way for public library on Level 3, and to create concept stores on Level 1 Shopper Traffic (mil) 0.4% Tenant Sales (S$ mil) 4.1% Q FY17/18 1Q FY18/ Q FY17/18 1Q FY18/19 1. Includes estimates of tenant sales for a small portion of tenants 18


19 VivoCity Ongoing AEI View from Lobby L on Basement 1 Basement 1 extension opened in June


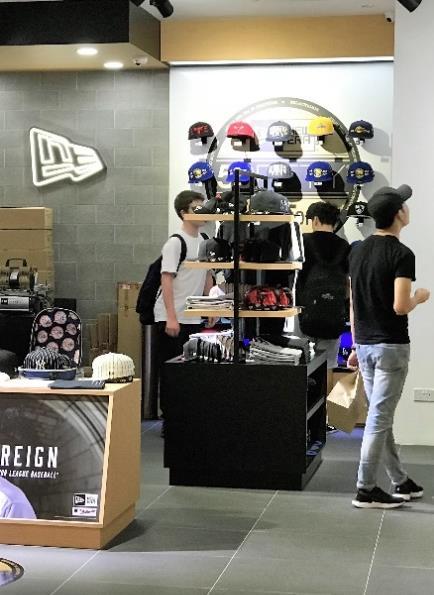


20 VivoCity Ongoing AEI (continued) Exciting lifestyle and athleisure brands in Basement 1 extension adidas adidas Originals Fila L.E. Underground Mi New Era Nike Spectacle Hut Popular Weston Corp 20


21 VivoCity Ongoing AEI (continued) Improving vertical connectivity and mobility within the mall with new escalator Floorplan for Basement 2 MRT New escalator node Existing escalator at Lobby L Level 1 escalator landing Side Elevation of New Escalator Connecting Basement 2 and Level 1 through New Basement 1 Space Basement 1 escalator landing L1 B1 New Retail B2 Basement 2 escalator landing 21


22 VivoCity Ongoing AEI (continued) Public library on Level 3 to open by 2H FY18/19 Convert part of Level 3 to a 32,000 sq ft public library Bonus GFA 1 added 24,000 sq ft of contiguous retail space on Basement 1 Entire AEI to deliver ROI of approximately 10% on a stabilised basis 2 Photographs of library users are for reference only, courtesy of the National Library Board 1. Bonus GFA granted under the Community/Sports Facilities Scheme 2. Based on currently estimated capital expenditure of approximately S$16 mil. This includes expenditure for related works such as addition of escalator and carpark deck, installation of solar panels on new carpark shelter and various M&E upgrading works 22


23 New and Larger Format Concept Stores Further defines VivoCity s positioning as key destination mall Zara expanded from ~16,000 sq ft to ~33,000 sq ft Reopened in May 2018 and carries its complete collections for women, men and kids 23

")


24 New and Larger Format Concept Stores (continued) Further defines VivoCity s positioning as key destination mall Pull & Bear Superdry 24

25 Outlook Bank of America Merrill Lynch HarbourFront 25
26 Outlook Singapore Economy The Singapore economy grew 3.8% year-on-year in the second quarter of 2018, moderating from the 4.3% growth in the previous quarter. On a quarter-on-quarter seasonally-adjusted annualised basis, the economy expanded at a slower pace of 1.0% compared to the 1.5% growth in the preceding quarter. Retail According to CBRE, retail leasing activity remained steady. The retail market sentiment is expected to remain upbeat in the mid-term given solid macro indicators underpinned by healthy consumer and business confidence. The tourism sector is also expected to perform well in In the mid- to long-term, CBRE expects a more stable and sustainable rental growth, even though key challenges arising from tight labour market conditions and high occupancy costs remain. Office Islandwide vacancy remained healthy with strengthening market fundamentals. Grade A Core CBD rents registered a robust 4.1% quarter-on-quarter increase in Q2 2018, the fastest pace of growth since Q Key demand drivers had thus far been concentrated in flexible space operators, technology firms and insurance companies. Sources: The Singapore Ministry of Trade and Industry Press Release, 13 July 2018 and CBRE MarketView Singapore Q
27 Outlook Office (cont d) The medium-term rental outlook remains positive especially for the Grade A segment, aided by a tapering supply pipeline. However, potential risks remain, particularly on the demand side in light of recent escalations in global trade disputes and their possible dampening effects on global economic growth. Both landlords and occupiers will need careful navigation through the next 6 to 12 months. Business Park After a relatively subdued past 12 months, the business park market registered an uptick in leasing activity and interest in Q as islandwide vacancy rate fell. Rents for City Fringe business parks registered an increase of 0.9% quarter-on-quarter, its fourth consecutive quarter of growth while the Rest of Island submarket saw a slight uptick of 1.4% quarter-on-quarter. The future supply pipeline for business parks remains tight. Brighter prospects are possible for the market as a whole, although rental gains will be concentrated in the City Fringe submarket. Overall MCT s portfolio is expected to remain resilient, as we continue our proactive asset management effort and focus on retaining quality tenants to maintain portfolio stability. 27
28 Thank You For enquiries, please contact: Teng Li Yeng Investor Relations Tel:
Mapletree Commercial Trust
 Mapletree Commercial Trust 2Q & 1H FY18/19 Financial Results 24 October 2018 0 Important Notice This presentation is for information only and does not constitute an offer or solicitation of an offer to
Mapletree Commercial Trust
 Mapletree Commercial Trust 3Q FY17/18 Financial Results 24 January 2018 1 Important Notice This presentation is for information only and does not constitute an offer or solicitation of an offer to sell
Mapletree Commercial Trust
 Mapletree Commercial Trust 1Q FY17/18 Financial Results 27 July 2017 1 Important Notice This presentation is for information only and does not constitute an offer or solicitation of an offer to sell or
Mapletree Commercial Trust
 Mapletree Commercial Trust 4Q & FY17/18 Financial Results 24 April 2018 1 Important Notice This presentation is for information only and does not constitute an offer or solicitation of an offer to sell
Mapletree Commercial Trust
 Mapletree Commercial Trust 3Q FY16/17 Financial Results 25 January 2017 1 Important Notice This presentation is for information only and does not constitute an offer or solicitation of an offer to sell
Mapletree Commercial Trust
 Mapletree Commercial Trust 3Q FY18/19 Financial Results 23 January 2019 0 Important Notice This presentation is for information only and does not constitute an offer or solicitation of an offer to sell
Mapletree Commercial Trust s Distribution Per Unit for 2Q FY17/18 Up 9.3% to 2.24 Singapore Cents
 For Immediate Release Mapletree Commercial Trust s Distribution Per Unit for 2Q FY17/18 Up 9.3% to 2.24 Singapore Cents Gross revenue and net property income ( NPI ) for 2Q FY17/18 grew 21.7% and 23.4%
Mapletree Commercial Trust s Distribution Per Unit for Full Year Up 4.9% to 9.04 Singapore Cents
 For Immediate Release Mapletree Commercial Trust s Distribution Per Unit for Full Year Up 4.9% to 9.04 Singapore Cents Gross revenue and net property income ( NPI ) for 4Q FY17/18 grew 1.3% and 1.2% respectively
Mapletree Commercial Trust s Distribution Per Unit for 1Q FY17/18 Rose 9.9% to 2.23 Singapore Cents
 For Immediate Release Mapletree Commercial Trust s Distribution Per Unit for 1Q FY17/18 Rose 9.9% to 2.23 Singapore Cents Gross revenue and net property income ( NPI ) for 1Q FY17/18 grew 46.9% and 49.6%
Mapletree Commercial Trust s 3Q FY18/19 Net Property Income Grew 2.2% Year-on-Year Distribution Per Unit Up 1.3% to 2.
 For Immediate Release Mapletree Commercial Trust s 3Q FY18/19 Net Property Income Grew 2.2% Year-on-Year Distribution Per Unit Up 1.3% to 2.33 Singapore Cents Gross revenue and net property income ( NPI
Mapletree Commercial Trust s Distribution Per Unit for YTD FY17/18 Up 6.4% to 6.77 Singapore Cents
 For Immediate Release Mapletree Commercial Trust s Distribution Per Unit for YTD FY17/18 Up 6.4% to 6.77 Singapore Cents Gross revenue and net property income ( NPI ) for 3Q FY17/18 grew 0.8% and 1.9%
MAPLETREE COMMERCIAL TRUST UNAUDITED FINANCIAL STATEMENTS AND DISTRIBUTION ANNOUNCEMENT FOR THE FIRST QUARTER FROM 1 APRIL 2018 TO 30 JUNE 2018
 (Constituted in the Republic of Singapore pursuant to a Trust Deed dated 25 August 2005 (as amended)) MAPLETREE COMMERCIAL TRUST UNAUDITED FINANCIAL STATEMENTS AND TABLE OF CONTENTS Item No. Description
7 th Annual General Meeting. 25 July 2018
 7 th Annual General Meeting 25 July 2018 1 Important Notice This presentation is for information only and does not constitute an offer or solicitation of an offer to sell or invitation to subscribe for
Mapletree Commercial Trust Delivers Stable Returns
 For Immediate Release Mapletree Commercial Trust Delivers Stable Returns Distribution per Unit ( DPU ) for 3Q FY15/16 1 at 2.08 cents, bringing DPU for Year-To-Date ( YTD ) FY15/16 2 to 6.11 cents, up
Mapletree Commercial Trust s Income Available for Distribution for 2Q FY16/17 grew 25.4% year-on-year to S$53.7 million
 For Immediate Release Mapletree Commercial Trust s Income Available for Distribution for 2Q FY16/17 grew 25.4% year-on-year to S$53.7 million Gross revenue and net property income ( NPI ) for 2Q FY16/17
Mapletree Commercial Trust Results Announcement. For the period 27 April 2011 to 30 June 2011
 Mapletree Commercial Trust Results Announcement For the period 27 April 2011 to 30 June 2011 Disclaimer This presentation is for information only and does not constitute an invitation or offer to acquire,
MAPLETREE COMMERCIAL TRUST UNAUDITED FINANCIAL STATEMENTS AND DISTRIBUTION ANNOUNCEMENT FOR THE FIRST QUARTER FROM 1 APRIL 2017 TO 30 JUNE 2017
 (Constituted in the Republic of Singapore pursuant to a Trust Deed dated 5 August 005 (as amended)) MAPLETREE COMMERCIAL TRUST UNAUDITED FINANCIAL STATEMENTS AND TABLE OF CONTENTS Item No. Description
Mapletree Commercial Trust s Distribution per Unit for 1Q FY15/16 1 rose 3.1% year-on-year
 For Immediate Release Mapletree Commercial Trust s Distribution per Unit for 1Q FY15/16 1 rose 3.1% year-on-year Distribution per Unit ( DPU ) for 1Q FY15/16 up 3.1%, to 2.01 cents Property Operating Expenses
(Constituted in the Republic of Singapore pursuant to a Trust Deed dated 25 August 2005 (as amended))
)") (Constituted in the Republic of Singapore pursuant to a Trust Deed dated 25 August 2005 (as amended)) MAPLETREE COMMERCIAL TRUST UNAUDITED FINANCIAL STATEMENTS AND TABLE OF CONTENTS Item No. Description
(Constituted in the Republic of Singapore pursuant to a Trust Deed dated 25 August 2005 (as amended)) MAPLETREE COMMERCIAL TRUST UNAUDITED FINANCIAL STATEMENTS AND TABLE OF CONTENTS Item No. Description
(Constituted in the Republic of Singapore pursuant to a Trust Deed dated 25 August 2005 (as amended))
)") (Constituted in the Republic of Singapore pursuant to a Trust Deed dated 5 August 005 (as amended)) MAPLETREE COMMERCIAL TRUST UNAUDITED FINANCIAL STATEMENTS AND TABLE OF CONTENTS Item No. Description
(Constituted in the Republic of Singapore pursuant to a Trust Deed dated 5 August 005 (as amended)) MAPLETREE COMMERCIAL TRUST UNAUDITED FINANCIAL STATEMENTS AND TABLE OF CONTENTS Item No. Description
3Q2016 Financial Results Presentation 26 October Pioneer Crescent
 3Q2016 Financial Results Presentation 26 October 2016 25 Pioneer Crescent Content Executive Summary Real Estate Highlights Financial & Capital Management Highlights Appendix 2 3Q2016 Executive Summary
Results Slide 3. Balance sheet Slide 8. Operational performance Slide 11. Growth strategy and market outlook Slide 16
 1Q FY18 Financial Results 5 January 2018 Disclaimer This presentation is for information only and does not constitute an invitation or offer to a c q u i r e, p u r c h a s e or s u b s c r i b e f o r
2Q FY18 Financial Results 6 April 2018
 2Q FY18 Financial Results 6 April 2018 Disclaimer This presentation is for information only and does not constitute an invitation or offer to a c q u i r e, p u r c h a s e or s u b s c r i b e f o r u
FINANCIAL RESULTS For First Quarter ended 31 March 2015
 FINANCIAL RESULTS For First Quarter ended 31 March 2015 AGENDA Q1 Highlights Financial Performance Portfolio Performance AEI Updates Looking Ahead Unit Performance 2 Q1 HIGHLIGHTS Q1 HIGHLIGHTS FINANCIAL
4QFY2013 and 2HFY2013 Results Presentation. January 2014
 4QFY2013 and 2HFY2013 Results Presentation January 2014 1 Disclaimer This presentation should be read in conjunction with the financial statements of Soilbuild Business Space REIT for the period from 1
Financial Results for 4 th Quarter 2017 and Year Ended 31 December 2017
 Financial Results for 4 th Quarter 2017 and Year Ended 31 December 2017 31 January 2018 Important Notice This presentation shall be read in conjunction with OUE Commercial REIT s Financial Results announcement
3Q 2012 Presentation Slides. 1 Nov 2012
 3Q 2012 Presentation Slides 1 Nov 2012 2 Important Notice This material shall be read in conjunction with CIT s financial statements for the financial period ended 30 Sep 2012. The value of units in CIT
MNACT s DPU for 3Q FY18/19 was 3.2% higher than 3Q FY17/18
 For Immediate Release MNACT s DPU for Q FY8/9 was.% higher than Q FY7/8 Highlights Driven by acquisition of Japan Properties and higher contribution from existing properties 89% of expiring/expired leases
Financial Results for the Quarter / Year Ended 31 Mar April 2012
 Financial Results for the Quarter / Year Ended 31 Mar 2012 19 April 2012 Disclaimer This Presentation is focused on comparing results for the three months ended 31 Mar 2012 versus results achieved in the
Financial Results for 3 rd Quarter 2016
 Financial Results for 3 rd Quarter 2016 1 November 2016 Important Notice This presentation shall be read in conjunction with OUE Commercial REIT s Financial Results announcement for 3Q 2016 dated 1 November
Financial Results for 4 th Quarter and Year Ended 31 December January 2019
 Financial Results for 4 th Quarter and Year Ended 31 December 2018 30 January 2019 Important Notice This presentation should be read in conjunction with the announcements released by OUE Commercial REIT
FY2015 Financial Results Presentation
 FY2015 Financial Results Presentation 14 January 2016 16 International Business Park 2 Content Executive Summary Financial Summary Real Estate Highlights Financial & Capital Management Highlights Appendix
2Q FY16. Financial Results
 2Q FY16 Financial Results 4 April 2016 Disclaimer This presentation is for information only and does not constitute an invitation or offer to a c q u i r e, p u r c h a s e or s u b s c r i b e f o r u
SGX - DBS Vickers - REITAS SREITS Corporate Day Investor Presentation
 SGX - DBS Vickers - REITAS SREITS Corporate Day Investor Presentation 27 Feb 1 Mar 2018 Important Notice This presentation shall be read in conjunction with OUE Commercial REIT s Financial Results announcement
FY2014 Financial Results Presentation
 FY2014 Financial Results Presentation 16 January 2015 16 International Business Park Important Notice This material shall be read in conjunction with CIT s results announcements for the financial period
REITs Symposium May 2018
 REITs Symposium 2018 19 May 2018 Important Notice This presentation shall be read in conjunction with OUE Commercial REIT s Financial Results announcement for 1Q 2018 dated 10 May 2018. This presentation
1Q FY19 Financial Results
 1Q FY19 Financial Results 4 January 2019 Disclaimer This presentation is for information only and does not constitute an invitation or offer to a c q u i r e, p u r c h a s e or s u b s c r i b e f o r
Notice of Annual General Meeting
 7 th Annual General Meeting 18 July 2017 Important Notice This presentation shall be read in conjunction with Mapletree Industrial Trust s ( MIT ) financial statements for the financial year ended 31 March
Hong Kong Non-Deal Roadshow Hong Kong, 4 March International Business Park
 Hong Kong Non-Deal Roadshow Hong Kong, 4 March 2016 16 International Business Park 2 Content CIT FY2015 Results Executive Summary Financial Summary Real Estate Highlights Financial & Capital Management
CLSA Asean Forum Bangkok, March International Business Park
 CLSA Asean Forum Bangkok, March 2016 16 International Business Park 2 Content Overview of CIT CIT FY2015 Financial Results Overview Financial & Capital Management Highlights Real Estate Highlights Singapore
CIT reports steady 2Q2015 results and improved capital structure
 (Constituted in the Republic of Singapore pursuant to a trust deed dated 31 March 2006 (as amended)) Press Release CIT reports steady 2Q2015 results and improved capital structure Net property income increased
MGCCT Achieves Stable DPU of cents for 1Q FY17/18
 For Immediate Release MGCCT Achieves Stable DPU of 1.851 cents for 1Q FY17/18 Gross revenue and net property income ( NPI ) for 1Q FY17/18 grew 4.6% and 3.7% respectively compared to 1Q FY16/17 1Q FY17/18
Frasers Commercial Trust 3QFY13 Financial Results. 24 July 2013
 Frasers Commercial Trust 3QFY13 Financial Results 24 July 2013 Important notice Certain statements in this Presentation constitute forward-looking statements, including forward-looking financial information.
CAPITALAND MALL TRUST Singapore s First & Largest REIT
 Photo Credit: Chun Kwong Leong, Singapore CAPITALAND MALL TRUST Singapore s First & Largest REIT 1Q 2016 Financial Results 15 April 2016 Disclaimer This presentation may contain forward-looking statements
Unaudited Results of Keppel-KBS US REIT for the Financial Period since Listing on 9 November 2017 to 31 December 2018
 MEDIA RELEASE Unaudited Results of Keppel-KBS US REIT for the Financial Period since Listing on 9 November 2017 to 31 December 2018 24 January 2019 The Directors of Keppel-KBS US REIT Management Pte. Ltd.,
Investor Presentation for Tokyo Non-Deal Roadshow. 25 August 2016
 Investor Presentation for Tokyo Non-Deal Roadshow 25 August 2016 Important Notice This presentation shall be read in conjunction with OUE Commercial REIT s Financial Results announcement for 1Q 2016 dated
Citi-REITAS-SGX C-Suite Singapore REITs and Sponsors Forum
 Citi-REITAS-SGX C-Suite Singapore REITs and Sponsors Forum 23 August 2018 Important Notice This presentation shall be read in conjunction with OUE Commercial REIT s Financial Results announcement for 2Q
Annual General Meeting. 28 April 2010
 CapitaCommercial Trust Annual General Meeting Presentation 28 April 2010 Important Notice The past performance of CCT is not indicative of the future performance of CCT. Similarly, the past performance
Financial Results for 3 rd Quarter November 2017
 Financial Results for 3 rd Quarter 2017 2 November 2017 Important Notice This presentation shall be read in conjunction with OUE Commercial REIT s Financial Results announcement for 3Q 2017 dated 2 November
MGCCT Achieves Stable DPU of cents for 1H FY17/18
 For Immediate Release MGCCT Achieves Stable DPU of 3.714 cents for 1H FY17/18 1H FY17/18 Available Distribution per Unit ( DPU ) 1 was 3.714 cents, 2.9% higher compared to 1H FY16/17 81.3% of FY17/18 expired/expiring
Mapletree Industrial Trust Achieves 12.0% Year-on-Year Increase in Distributable Income for 3QFY13/14
 (Constituted in Republic of Singapore pursuant to a Trust Deed dated 29 January 2008 (as amended)) PRESS RELEASE Mapletree Industrial Trust Achieves 12.0% Year-on-Year Increase in Distributable Income
Presentation for REITs Symposium 2017
 Presentation for REITs Symposium 2017 27 May 2017 Important Notice This presentation shall be read in conjunction with OUE Commercial REIT s Financial Results announcement for 1Q 2017 dated 5 May 2017.
Viva Industrial Trust 4Q2017 & FY2017 Results Presentation. 26 January 2018
 Viva Industrial Trust 4Q2017 & FY2017 Results Presentation 26 January 2018 1 Important Notice This presentation is for information purposes only and does not constitute or form part of an offer, invitation
CAPITALAND MALL TRUST Singapore s First & Largest Retail REIT. First Quarter 2017 Financial Results
 CAPITALAND MALL TRUST Singapore s First & Largest Retail REIT First Quarter 2017 Financial Results 20 April 2017 Disclaimer This presentation may contain forward-looking statements that involve assumptions,
Mapletree Greater China Commercial Trust. Financial Results for the Period from 1 April 2015 to 30 June 2015
 Mapletree Greater China Commercial Trust Financial Results for the Period from 1 April 2015 to 30 June 2015 Disclaimer This presentation is for information only and does not constitute an invitation or
Singapore Investor Roadshow
 Singapore Investor Roadshow 11 May 2015 16 International Business Park Important Notice This material shall be read in conjunction with CIT s results announcements for the financial period ended 31 December
FY2016. Financial Results
 FY2016 Financial Results 6 October 2016 Disclaimer This presentation is for information only and does not constitute an invitation or offer to a c q u i r e, p u r c h a s e or s u b s c r i b e f o r
Sabana Shari ah Compliant Industrial REIT 3Q 2018 Financial Results Presentation. 26 October 2018
 Sabana Shari ah Compliant Industrial REIT 3Q 2018 Financial Results Presentation 26 October 2018 Important Notice Disclaimer This presentation shall be read in conjunction with the financial information
SGX REIT & BT SEMINAR Tokyo, 30 June Pioneer Crescent
 SGX REIT & BT SEMINAR Tokyo, 30 June 3016 25 Pioneer Crescent Singapore Industrial REITs (S-REITs) 3 Key Features Bond-like listed security ( Dividend Play ) that provides steady income distribution stream
3Q2010 Financial Results. 20 October 2010
 3Q2010 Financial Results 20 October 2010 important notice The value of units in CIT ( Units ) and the income derived from them may fall as well as rise. Units are not investments, liabilities or obligations
Financial Results for the Quarter Ended 31 Dec January 2012
 Financial Results for the Quarter Ended 31 Dec 2011 19 January 2012 Disclaimer This Presentation is focused on comparing results for the three months ended 31 Dec 2011 versus results achieved in the three
Investor Presentation March 2016
 Investor Presentation March 2016 Important Notice This presentation shall be read in conjunction with Mapletree Industrial Trust s ( MIT ) financial results for Third Quarter Financial Year 2015/2016 in
Investor Presentation August 2017
 Investor Presentation August 2017 Important Notice This presentation shall be read in conjunction with Mapletree Industrial Trust s ( MIT ) financial results for First Quarter Financial Year 2017/2018
MMP REIT 3Q 2006 DISTRIBUTABLE INCOME EXCEEDS IPO PROJECTION BY 9%
 Media release Embargoed till after 5.00pm MMP REIT 3Q 2006 DISTRIBUTABLE INCOME EXCEEDS IPO PROJECTION BY 9% ANNUALISED TRADING YIELD AT 5.93% 1 HIGHLIGHTS Distributable income of 1.44 cents per unit beats
 General Announcement Page 1 of 1 General Announcement Form Version 8.2 (Enhanced) Initiated by CS_TMF GLOBAL SERVICES MALAYSIA on 18/07/2014 11:09:44 AM Ownership transfer to CS_TMF GLOBAL SERVICES MALAYSIA/EDMS/KLSE
K-REIT Asia Unaudited Results for the Second Quarter and Half Year Ended 30 June 2011
 PRESS RELEASE K-REIT Asia Unaudited Results for the Second Quarter and Half Year Ended 30 June 2011 18 July 2011 The Directors of K-REIT Asia Management Limited, as manager of K-REIT Asia, announce the
SABANA SHARI AH COMPLIANT INDUSTRIAL REIT
 SABANA SHARI AH COMPLIANT INDUSTRIAL REIT 1Q 2015: First Quarter Ended 31 March 2015 Financial Results Presentation 20 April 2015 Important Notice Disclaimer This presentation shall be read in conjunction
K-REIT Asia s Distributable Income for First Half 2012 (1H 2012) Grew by 94.6% Year-on-Year
 Grew by 94.6% Year-on-Year") PRESS RELEASE K-REIT Asia Unaudited Results for the Second Quarter and Half Year Ended 30 June 2012 16 July 2012 The Directors of K-REIT Asia Management Limited, as manager of K-REIT Asia, announce the
PRESS RELEASE K-REIT Asia Unaudited Results for the Second Quarter and Half Year Ended 30 June 2012 16 July 2012 The Directors of K-REIT Asia Management Limited, as manager of K-REIT Asia, announce the
MMP REIT REPORTS RECORD QUARTERLY DPU, UP 11.4% FROM IPO PROJECTION; NAV RISES 18.4% ON HIGHER PROPERTY VALUATIONS
 Media release Embargoed from release until after 5.00pm MMP REIT REPORTS RECORD QUARTERLY DPU, UP 11.4% FROM IPO PROJECTION; NAV RISES 18.4% ON HIGHER PROPERTY VALUATIONS HIGHLIGHTS 4Q 2006 DPU of 1.47
BUILDING ON OUR STRENGTHS BHG RETAIL REIT FINANCIAL RESULTS FOR THE 2 ND QUARTER AND HALF YEAR ENDED 30 JUNE AUGUST 2018
 BUILDING ON OUR STRENGTHS BHG RETAIL REIT FINANCIAL RESULTS FOR THE 2 ND QUARTER AND HALF YEAR ENDED 30 JUNE 2018 8 AUGUST 2018 Disclaimer Certain statements made in this presentation may not be based
Citi ASEAN Conference 12 June Tai Seng Street
 Citi ASEAN Conference 12 June 2014 1 16 Tai Seng Street Important Notice This material shall be read in conjunction with CIT s financial statements for the financial period ended 31 Mar 2014. The value
OUE C-REIT s FY2015 Distribution 22.2% Higher YoY, 4Q 2015 DPU Exceeded Circular Forecast by 20.4%
 PRESS RELEASE For Immediate Release OUE C-REIT s FY2015 Distribution 22.2% Higher YoY, 4Q 2015 DPU Exceeded Circular Forecast by 20.4% Key Highlights: 4Q 2015 distribution per unit ( DPU ) exceeded Circular
2Q2014 Financial Results 24 July Creating Value & Delivering Growth
 2Q2014 Financial Results 24 July 2014 1 Creating Value & Delivering Growth Important Notice This material shall be read in conjunction with CIT s financial statements for the financial period ended 30
Variance (%) Distribution Period 1 July 2018 to 30 September 2018
 Distribution Period 1 July 2018 to 30 September 2018") PRESS RELEASE OUE H-Trust reports DPS of 1.28 cents for 3Q2018 Crowne Plaza Changi Airport continues to demonstrate progressive improvements with 6.3% y-o-y increase in RevPAR to S$187 Achieved high occupancy
PRESS RELEASE OUE H-Trust reports DPS of 1.28 cents for 3Q2018 Crowne Plaza Changi Airport continues to demonstrate progressive improvements with 6.3% y-o-y increase in RevPAR to S$187 Achieved high occupancy
Investor Presentation November 2015
 Investor Presentation November 2015 Important Notice This presentation shall be read in conjunction with Mapletree Industrial Trust s ( MIT ) financial results for Second Quarter Financial Year 2015/2016
OSK DMG ASEAN & Hong Kong Corporate Day June 2012
 OSK DMG ASEAN & Hong Kong Corporate Day 26-28 June 2012 2 Important Notice This material shall be read in conjunction with CIT s financial statements for the financial period ended 31 March 2012. The value
CapitaLand Retail China Trust Singapore s First Listed China Shopping Mall REIT
 CapitaLand Retail China Trust Singapore s First Listed China Shopping Mall REIT Annual General Meeting 25 April 2018 0 Annual General Meeting 2018 *25 April 2018* Disclaimer This presentation may contain
FY2012 Financial Results Presentation
 FY2012 Financial Results Presentation 21 January 2013 Knowing. Believing. Delivering ARA-CWT Trust Management (Cache) Limited Agenda Overview & FY12 Key Highlights 4QFY12 & FY12 Full Year Financial Performance
SGX-REITAS Education Series
 SGX-REITAS Education Series 23 February 2016 16 International Business Park 2 Executive Summary Singapore Industrial Real Estate Sector Overview Role of Regulators in the Industrial Sector Overview of
Keppel REIT. Second Quarter and First Half 2017 Financial Results. 18 July 2017
 Keppel REIT Second Quarter and First Half 2017 Financial Results 18 July 2017 Outline Key Highlights for 1H 2017 3 Financial Performance & Capital Management 6 Portfolio Performance 10 Market Updates 14
Balance Sheet Positioned for Future Growth with No Major Refinancing Due Until 2016
 (Constituted in the Republic of Singapore pursuant to a trust deed dated 31 March 2006 (as amended)) Press Release Balance Sheet Positioned for Future Growth with No Major Refinancing Due Until 2016 Refinanced
OUE C-REIT Achieved Higher YoY Distribution of S$17.8 million in 2Q 2017
 PRESS RELEASE For Immediate Release OUE C-REIT Achieved Higher YoY Distribution of S$17.8 million in 2Q 2017 Key Highlights: 2Q 2017 amount available for distribution of S$17.8 million increased 0.6% year-on-year
CAPITALAND MALL TRUST
 CAPITALAND MALL TRUST Singapore s First & Largest Retail REIT First Quarter 2018 Financial Results 20 April 2018 1 Disclaimer This presentation may contain forward-looking statements that involve assumptions,
Investor Presentation for Citi ASEAN Investor Conference. 12 June 2014
 Investor Presentation for Citi ASEAN Investor Conference 2 June 204 Important Notice Standard Chartered Securities (Singapore) Pte. Limited, CIMB Bank Berhad, Singapore Branch and Oversea-Chinese Banking
MAPLETREE LOGISTICS TRUST S 3Q FY13/14 DISTRIBUTION PER UNIT RISES 7% YEAR-ON-YEAR
 For Immediate Release MAPLETREE LOGISTICS TRUST S 3Q FY13/14 DISTRIBUTION PER UNIT RISES 7% YEAR-ON-YEAR Highlights: Amount Distributable to Unitholders registered 8% year-on-year growth Results underpinned
MAPLETREE LOGISTICS TRUST DELIVERS STEADY PERFORMANCE FOR 1H FY16/17
 For Immediate Release MAPLETREE LOGISTICS TRUST DELIVERS STEADY PERFORMANCE FOR 1H FY16/17 Highlights: Maintained DPU at 1.86 cents for 2Q FY16/17 and 3.71 cents for 1H FY16/17 Stable portfolio occupancy
MAPLETREE LOGISTICS TRUST S QUARTERLY DISTRIBUTION PER UNIT RISES 10% YEAR-ON-YEAR
 For Immediate Release MAPLETREE LOGISTICS TRUST S QUARTERLY DISTRIBUTION PER UNIT RISES 10% YEAR-ON-YEAR Highlights: Distribution Per Unit ( DPU ) of 1.70 cents for the 3 months ended 31 March 2012 Portfolio
Results for the Third Quarter ended 30 September October 2008
 Results for the Third Quarter ended 30 September 2008 21 October 2008 Disclaimer This Presentation is focused on comparing results for the three months ended 30 September 2008 versus results achieved in
MAPLETREE LOGISTICS TRUST S 1Q FY17/18 DPU RISES 2% YEAR-ON-YEAR TO CENTS
 For Immediate Release MAPLETREE LOGISTICS TRUST S 1Q FY17/18 DPU RISES 2% YEAR-ON-YEAR TO 1.887 CENTS Highlights: Amount distributable to Unitholders grew 2.5% year-on-year to S$47.2 million Stable operations
MAPLETREE LOGISTICS TRUST S 1Q FY14/15 DISTRIBUTION PER UNIT RISES 6% to 1.90 CENTS
 For Immediate Release MAPLETREE LOGISTICS TRUST S 1Q FY14/15 DISTRIBUTION PER UNIT RISES 6% to 1.90 CENTS Highlights: 6% year-on-year growth in amount distributable to Unitholders to S$46.6 million Recent
First Quarter 2017 Financial Results 19 April Q 2017 Financial Results 19 April 2017
 First Quarter 2017 Financial Results 19 April 2017 1Q 2017 Financial Results 19 April 2017 Outline Key Highlights for 1Q 2017 3 Financial Highlights & Capital Management 4 Portfolio Performance 10 Market
AIMS AMP CAPITAL INDUSTRIAL REIT
 AIMS AMP CAPITAL INDUSTRIAL REIT FY2018: First Quarter Financial Results Ended 30 June 2017 Results Presentation 27 July 2017 1 Important notice Disclaimer This Presentation is focused on comparing actual
AIMS AMP CAPITAL INDUSTRIAL REIT
 AIMS AMP CAPITAL INDUSTRIAL REIT FY2014: Third Quarter ended 31 December 2013 Results Presentation 29 January 2014 Important notice Disclaimer This Presentation is focused on comparing actual results for
OUE C-REIT Achieved Distribution of S$17.8 million in 3Q 2017, 3.2% Higher YoY
 PRESS RELEASE For Immediate Release OUE C-REIT Achieved Distribution of S$17.8 million in 3Q 2017, 3.2% Higher YoY Key Highlights: 3Q 2017 amount available for distribution of S$17.8 million increased
AIMS AMP CAPITAL INDUSTRIAL REIT
 AIMS AMP CAPITAL INDUSTRIAL REIT FY2013: 2 nd Quarter Ended 30 September 2012 Results Presentation 24 October 2012 Important Notice Disclaimer This Presentation is focused on comparing actual results for
AIMS AMP CAPITAL INDUSTRIAL REIT
 AIMS AMP CAPITAL INDUSTRIAL REIT FY2018: Second Quarter Financial Results Ended 30 September 2017 Results Presentation 26 October 2017 1 Important notice Disclaimer This Presentation is focused on comparing
6 th Annual General Meeting 24 April International Business Park
 6 th Annual General Meeting 24 April 2015 16 International Business Park Important Notice This material shall be read in conjunction with CIT s results announcements for the financial period ended 31 December
MEDIA RELEASE. Unaudited Results of Keppel REIT for the First Quarter Ended 31 March April 2015
 MEDIA RELEASE Unaudited Results of Keppel REIT for the First Quarter Ended 31 March 2015 13 April 2015 The Directors of Keppel REIT Management Limited, as Manager of Keppel REIT, are pleased to announce
FY2018 Results Presentation. 22 Jan 2019
 FY2018 Results Presentation 22 Jan 2019 Disclaimer This presentation may contain forward-looking statements that involve assumptions, risks and uncertainties. Actual future performance, outcomes and results