SABANA SHARI AH COMPLIANT INDUSTRIAL REIT
|
|
|
- Joleen Wilson
- 6 years ago
- Views:
Transcription

1 SABANA SHARI AH COMPLIANT INDUSTRIAL REIT 3Q 2017: Third Quarter Ended 30 September 2017 Financial Results Presentation 23 October 2017
2 Important Notice Disclaimer This presentation shall be read in conjunction with the financial information of Sabana Shari ah Compliant Industrial Real Estate Investment Trust ( Sabana REIT or the Trust ) for the third quarter from 1 July 2017 to 30 September 2017 ( 3Q 2017 ). This presentation may contain forward-looking statements that involve risks and uncertainties. Actual future performance, outcomes and results may differ materially from those expressed in forward-looking statements as a result of a number of risks, uncertainties and assumptions. Representative examples of these factors include (without limitation) general industry and economic conditions, interest rate trends, cost of capital and capital availability, competition from similar developments, shifts in expected levels of property rental income, changes in operating expenses, including employee wages, benefits and training, property expenses and governmental and public policy changes and the continued availability of financing in the amounts and the terms necessary to support future business. You are cautioned not to place undue reliance on these forward looking statements, which are based on current view of management on future events. Any discrepancies in the tables included in this presentation between the listed amounts and total thereof are due to rounding. 2
3 Contents I. Key Highlights 5 II. Financial Performance 7 III. Capital Management 12 IV. Portfolio Performance 15 V. Outlook and Strategy 25 VI. 3Q 2017 Non-Shari ah Income 28 VII. Distribution Details 30 3
4 Contents I. Key Highlights 5 II. Financial Performance 7 III. Capital Management 12 IV. Portfolio Performance 15 V. Outlook and Strategy 25 VI. 3Q 2017 Non-Shari ah Income 28 VII. Distribution Details 30 4
5 Key Highlights for 3Q 2017 Results Distribution per Unit ( DPU ) and distributable income of 0.79 Singapore cents and S$8.3 million respectively for 3Q 2017 Balance sheet Aggregate leverage and weighted average all-in cost of borrowings in 3Q 2017 reduced to 36.0% and 3.9% respectively Total value of unencumbered assets increased from S$323.3 million (including 218 Pandan Loop) in second quarter to S$507.2 million (excluding divested 218 Pandan Loop) in third quarter The net sales proceeds from the divestment of 218 Pandan Loop was used mainly to reduce the Trust s existing borrowings and lower its recurring financing costs The proceeds from the rights issue, as previously announced, has been fully utilized to primarily repay maturing short-term borrowings, lowering the gearing from 43.2% as at 31 December 2016 to 36.0% as at 30 September 2017 Tenancy As at 30 September 2017, multi-tenancy and overall portfolio occupancy levels stood at 80.4% (1) and 88.4% (2) respectively Strategic Review Strategic Review is still underway; talks are ongoing but no binding agreements have been entered into (1) 151 Lorong Chuan, 8 Commonwealth Lane, 9 Tai Seng Drive, 15 Jalan Kilang Barat, 23 Serangoon North Avenue 5, 508 Chai Chee Lane, 34 Penjuru Lane, 2 Toh Tuck Link, 123 Genting Lane and 39 Ubi Road 1. (2) By Net Lettable Area ( NLA ). 5

6 Contents I. Key Highlights 5 II. Financial Performance 7 III. Capital Management 12 IV. Portfolio Performance 15 V. Outlook and Strategy 25 VI. 3Q 2017 Non-Shari ah Income 28 VII. Distribution Details 30 6
7 Financial Performance For the quarter ended 30 September 2017 (in S$'000) 3Q Q 2017 Variance (%) 3Q Q 2016 Variance (%) Gross revenue 20,859 21,964 (5.0) 20,859 23,031 (9.4) Net property income ( NPI ) 13,400 12, ,400 13,911 (3.7) Income available for distribution 8,336 8,568 (2.7) 8,336 8,858 (5.9) DPU (cents) 0.79 (1,2) 0.81 (3) (2.5) 0.79 (1,2) 1.06 (4) (25.5) Annualised DPU (cents) (3.7) (4) (25.8) (1) Based on 1,053,083,530 units issued as at 30 September (2) For 3Q 2017, the Manager received 100% of its fees fully in cash as the ordinary resolution to authorise the Manager to issue units and to make or grant convertible instruments was not passed at the Annual General Meeting held on 28 April Without the general mandate to issue new units, the Manager is not able to continue to receive 80.0% of its base fee in units and has to receive its fees fully in cash from 1Q 2017 onwards. The DPU for 3Q2017 of 0.79 cents would have instead been approximately 0.88 cents had the Manager been able to continue receiving 80.0% of its base fee in units. (3) The DPU for 2Q2017 of 0.81 cents would have instead been approximately 0.87 cents had the Manager been able to continue receiving 80.0% of its base fee in units and approximately 0.78 cents had the Manager not elected to forgo 25% of its fees for 2Q2017. (4) DPU for prior periods has been restated to reflect the effect of bonus element in the Rights Issue. 7
8 3Q 2017 QoQ Financial Performance (in S$'000) 3Q Q 2017 Variance (%) Gross revenue 20,859 21,964 (5.0) Property expenses (7,459) (9,031) 17.4 NPI 13,400 12, Net finance costs (4,066) (3,974) (2.3) Manager's fees (1,238) (930) (33.1) Trustee's fees (104) (106) 1.9 Other trust expenses (630) (1,296) 51.4 Net income 7,362 6, Net change in fair value of financial derivatives 236 (556) Net change in fair value of investment properties - (27,876) Gain on divestment of investment properties 1,816 - NM Total return for the period 9,414 (21,805) Gross Revenue decreased by 5.0% mainly due to non-recognition of revenue for master leases at 1 Tuas Avenue 4 and 6 Woodlands Loop as collections are no longer probable. Net Property Income increased by 3.6% mainly due to 17.4% savings in property expenses. Property expenses decreased by 17.4% mainly due to lower impairment losses on master tenants at 1 Tuas Avenue 4 and 6 Woodlands Loop, arising from revenue not recognized in 3Q Net finance costs increased marginally by 2.3% despite lower profit expense in 3Q2017 mainly due to lower Ta widh charged to tenants and hence lower finance income compared to 2Q2017. Other trust expenses decreased by 51.4% mainly due to the one-time legal, professional and advisory fees relating to the Extra-ordinary General Meeting in 2Q Income available for distribution decreased by 2.7% mainly due to higher manager s fees payable in cash in 3Q 2017 due to a 25% manager s fee waiver in 2Q 2017 only. Distribution adjustments (1) (1,078) 30,373 (103.5) Income available for distribution 8,336 8,568 (2.7) NM denotes not meaningful. (1) Comprise Trustee s fees, donation of non-shari ah compliant income, amortisation of capitalised transaction costs incurred on borrowings, straight-lining adjustments on rental income for accounting purposes, net change in fair value of financial derivatives and investment properties, gain on divestment of investment properties and other expenses which are nondeductible for tax purposes. 8
9 3Q 2017 YoY Financial Performance (in S$'000) 3Q Q 2016 Variance (1) (%) Gross revenue 20,859 23,031 (9.4) Property expenses (7,459) (9,120) 18.2 NPI 13,400 13,911 (3.7) Net finance costs (4,066) (5,295) 23.2 Manager's fees (1,238) (1,332) 7.1 Trustee's fees (104) (111) 6.3 Donation of non-shari'ah compliant income - (23) Other trust expenses (630) (225) (180.0) Net income 7,362 6, Net change in fair value of financial derivatives 236 (464) Gain on divestment of investment properties 1,816 - NM Total return for the period 9,414 6, Distribution adjustments (2) (1,078) 2,397 (145.0) Income available for distribution 8,336 8,858 (5.9) Gross revenue decreased by 9.4% year-on-year ( YoY ) due to non-recognition of revenue for master leases at 1 Tuas Avenue 4 and 6 Woodlands Loop as collections are no longer probable, conversion of 39 Ubi Road 1 into multi-tenanted arrangements in 4Q2016, and lower contribution from 151 Lorong Chuan, 8 Commonwealth Lane, 508 Chai Chee Lane and 2 Toh Tuck Link; positively offset by higher contribution from 9 Tai Seng Drive and 15 Jalan Kilang Barat on a YoY basis. Property expenses decreased by 18.2% YoY as a result of lower property tax, land rent, utilities and marketing expenses from certain multi-tenanted and non-triplenet master tenanted properties, as well as lower impairment loss on master tenant at1 Tuas Avenue 4. Net finance costs decreased by 23.2% mainly due to lower profit expense from lower outstanding borrowings YoY due to repayment of the then outstanding borrowings using the net proceeds from the Rights Issue and the net divestment proceeds from 218 Pandan Loop. Other trust expenses increased by 180.0% mainly due to higher professional and advisory fees relating to the on-going strategic review on YoY basis. Income available for distribution lowered by 5.9% mainly due to lower NPI and higher Manager s fees paid in cash, positively offset by lower profit expense arising from lower outstanding borrowings and lower non-taxable straight-lining adjustments on rental income. (1) Please refer to section 8 of the financial statements and distribution announcement for 3Q 2017 for a more detailed explanation of the variances. (2) Comprise the portion of Manager s fees paid/payable in units, Trustee s fees, donation of non-shari ah compliant income, amortisation of capitalised transaction costs incurred on borrowings, straight-lining adjustments on rental income for accounting purposes, net change in fair value of financial derivatives, gain on divestment of investment properties and other expenses which are non-deductible for tax purposes. 9
10 Resilient Balance Sheet As at 30 September 2017 S$'000 Investment properties 955,451 Investment properties held for divestment 12,250 Other assets 14,672 Total assets 982,373 Borrowings, at amortised cost 351,392 Other liabilities 29,340 Total liabilities 380,732 Net assets attributable to Unitholders 601,641 Units in issue 1,053,083,530 NAV per unit (S$) 0.57 Adjusted NAV per unit (1) (S$) 0.56 (1) Excludes distributable income of approximately S$8.3 million available for distribution for the quarter ended 30 September

11 Contents I. Key Highlights 5 II. Financial Performance 7 III. Capital Management 12 IV. Portfolio Performance 15 V. Outlook and Strategy 25 VI. 3Q 2017 Non-Shari ah Income 28 VII. Distribution Details 30 11
12 Stronger Capital Structure At A Glance As at 30 September 2017 Borrowings S$353.0 million Aggregate leverage (1) 36.0% Proportion of total borrowings on fixed rates 79.3% Average all-in financing cost (2) 3.9% Outstanding Term Commodity Murabaha Facility ( CMF ) Revolving Murabahah Facility Trust Certificates Weighted average tenor of borrowings Profit cover (3) Unencumbered assets S$120.0 million S$43.0 million S$190.0 million 1.5 years 3.6 times S$507.2 million (1) Ratio of total borrowings and deferred payment over deposited property as defined in the Property Funds Appendix of the Code on Collective Investment Schemes. (2) Inclusive of amortisation of transaction costs. (3) Ratio of Net Property Income over profit expense (excluding amortisation of transaction costs and other fees) for the period from 1 July 2017 to 30 September
13 S$ millions Evenly Staggered Borrowings Maturity As at 30 September (1) (1) (2) CMF Multicurrency Islamic Trust Certificates Revolving Murabahah Facility Maturities of total outstanding borrowings of S$353.0 million evenly staggered over next 3 years. (1) Excludes S$5.9 million of undrawn Revolving Murabahah Facility. (2) Excludes S$18.0 million of undrawn Revolving CMF. 13
14 Contents I. Key Highlights 5 II. Financial Performance 7 III. Capital Management 12 IV. Portfolio Performance 15 V. 25 Outlook and Strategy VI. 3Q 2017 Non-Shari ah Income 28 VII. Distribution Details 30 14

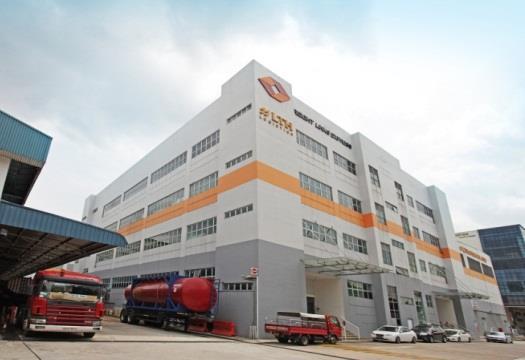
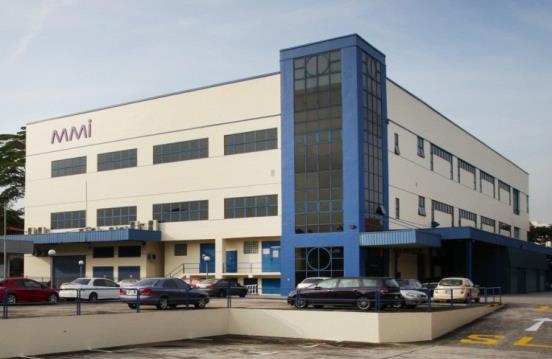
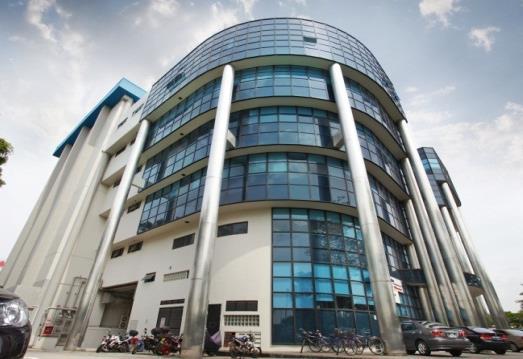
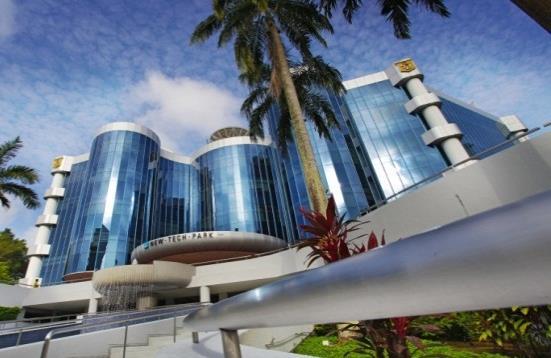
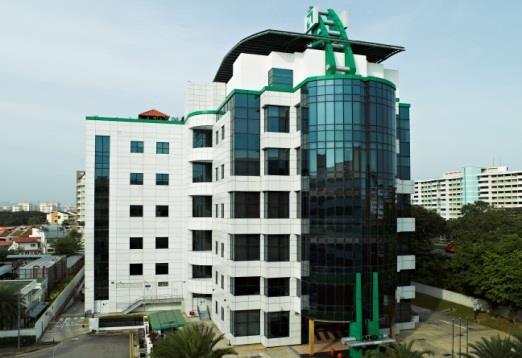
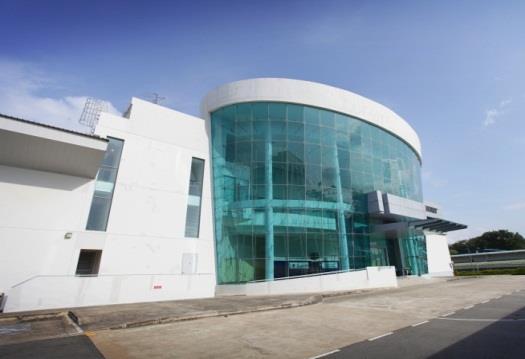
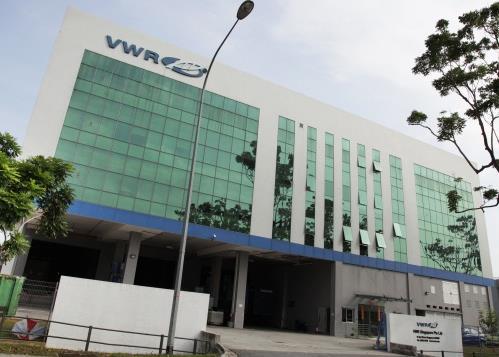
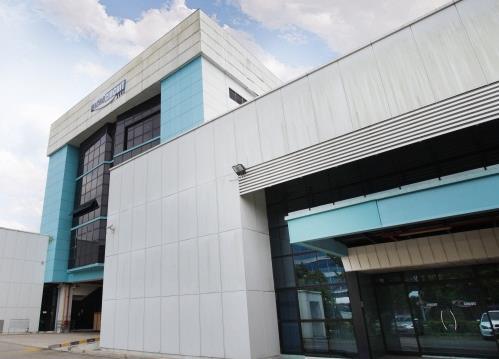
15 Property Locations Our properties are diversified into four industrial segments across Singapore, close to expressways and public transportation. 15
16 Occupancy Rates As at 30 September 2017 As at 30 June 2017 Total portfolio GFA 4,353,300 sq ft (1) 4,403,674 sq ft Portfolio occupancy 10 properties, master leases (2) 100.0% 100.0% 10 properties, multi-tenanted (3) 80.4% 80.4% 20 properties, total portfolio (4) 88.4% 87.3% Weighted average master lease term to expiry (5) 2.1 years 2.4 years Weighted average unexpired lease term for the underlying land (6) 33.8 years 34.1 years Weighted average portfolio lease term to expiry (7) 2.3 years 2.4 years (1) Adjusted due to divestment of 218 Pandan Loop. (2) 5 triple net & 5 single net master leases. (3) 151 Lorong Chuan, 8 Commonwealth Lane, 9 Tai Seng Drive, 15 Jalan Kilang Barat, 23 Serangoon North Avenue 5, 508 Chai Chee Lane, 34 Penjuru Lane, 2 Toh Tuck Link, 123 Genting Lane and 39 Ubi Road 1. (4) By Net Lettable Area ( NLA ). (5) Weighted by gross rental income (master leases of 10 properties). (6) Weighted by Gross Floor Area ( GFA ) (7) Weighted by gross rental income (10 master leases and 10 multi-tenanted properties). 16
 Sabana REIT Portfolio Industry")

17 Occupancy Levels Comparisons to Singapore industrial average occupancy levels 100% 90% 80% 70% 60% Q1 Q2 Q3 Q4 Q1 Q2 Q3 Q4 Q1 Q2 Q3 Q4 Q1 Q2 Q3 Q4 Q1 Q2 Q3 Q4 Q1 Q2 Q3 Q4 Q1 Q2 Q (2) Sabana REIT Portfolio Industry (Factory) Industry (Warehouse) (1) (1) (1) Source: Property Market Information by Urban Redevelopment Authority and Quarterly Market Report by Jurong Town Corporation. (2) 3Q 2017 data are not available as at 30 September 2017 from Jurong Town Corporation. 17
18 Diverse Asset Types Sabana REIT s portfolio is diversified in the following asset types: High-tech Industrial Chemical Warehouse & Logistics Asset Breakdown by NLA for 3Q 2017 (1) General Industrial 15.1% Chemical Warehouse & Logistics 9.3% High-tech Industrial 41.4% Warehouse & Logistics General Industrial Gross Revenue by Asset Type for 3Q 2017 Chemical Warehouse & Logistics General 8.3% Industrial 9.3% Warehouse & Logistics 24.6% High-tech Industrial 57.8% Warehouse & Logistics 34.2% (1) As at 30 September
19 Long Weighted Average Leasehold For Underlying Land Percentage of unexpired land lease term by GFA (1) 51.4% 19.6% 9.5% 6.7% 12.8% Beyond 2061 Well distributed, long underlying land leases, with an average of 33.8 years by GFA. (1) As at 30 September
20 Quality Assets Attract Quality Tenants As at 30 September 2017 As at 30 June 2017 Total NLA (sq ft) 3,561,627 (1) 3,604,730 Total number of direct and sub-tenants Weighted average lease term to expiry (mths) (2) (1) Adjusted due to divestment of 218 Pandan Loop. (2) Weighted by sub-tenancy gross rental income. 20
21 Diverse Sub-tenant Base Sub-tenants industry diversification by NLA (1) : Printing 2.4% Healthcare 3.4% Others 12.1% Logistics 9.3% R & D 1.1% Info Technology 12.6% Engineering 7.4% Construction & Utilities 3.3% Storage 5.7% Chemical 8.2% F & B 1.1% General Manufacturing Industries 1.2% Electronics 13.8% Fashion & Apparel 8.1% Telecommunication & Data Warehousing 10.3% No concentration in any single trade sector exceeding 15% (1) As at 30 September
22 Proactive Lease Management 70.0% Lease Expiry by NLA (1) 60.0% 50.0% 40.0% 30.0% 20.0% 5.5% 2.2% (2) 11.6% 13.6% 10.0% 0.0% 10.3% 17.3% (3) 10.7% 6.5% 12.9% 9.4% Beyond 2020 Master Lease Multi-tenanted (1) As at 30 September (2) One property: 6 Woodlands Loop. (3) Three properties: 33 & 35 Penjuru Lane, 18 Gul Drive and 51 Penjuru Road. Master tenants are Sponsor related companies. 22
23 Balanced Lease Management Lease Type by NLA for 3Q 2017 (1) Master Leases 40.7% Multitenanted 59.3% (1) As at 30 September
24 Contents I. Key Highlights 5 II. Financial Performance 7 III. Capital Management 12 IV. Portfolio Performance 15 V. 25 Outlook and Strategy VI. 3Q 2017 Non-Shari ah Income 28 VII. Distribution Details 30 24
25 Outlook Singapore Economy Singapore s economic growth outlook for 3Q 2017 Based on advance estimates released by Ministry of Trade and Industry, Singapore s GDP grew by 4.6% on a y-o-y basis in the third quarter of 2017, higher than the 2.9% growth in the second quarter (1). On a q-o-q seasonally-adjusted annualised basis, the economy expanded by 6.3%, improving from the 2.4% growth in the previous quarter. GDP forecast consensus among private economists remained at 2.5% (2) for Singapore Industrial Sector Industrial property outlook The 2Q 2017 industrial property market report by JTC has estimated about 2.5 million sqm of industrial space to come on-stream in the second half of 2017 and The additional supply of industrial space coming on-stream will likely exert further downward pressures on prices and rentals (3). Sources: (1) Singapore s GDP Grew by 4.6 Per Cent in the Third Quarter of Ministry of Trade and Industry. 13 October Web. 13 October (2) Economic Policy Group Survey of Professional Forecasters. Monetary Authority of Singapore. September Web. September (3) JTC Quarterly Market Report. Industrial Properties Second Quarter Q Web. 2Q
26 Strategy The Trust Management Strategy The Manager continues to be proactive in rebalancing and strengthening its portfolio, despite the challenging overall market. Improving the Trust s portfolio occupancy and retaining existing tenants remains a top priority for the Manager and it will continue to proactively manage its lease expiry profile through aggressive marketing and leasing efforts. The Manager remains committed to proactively managing its capital structure and has commenced discussions with the lenders to explore different refinancing options for the S$90.0 million Islamic Trust Certificates Series I due March The Manager is currently in talks on the possible renewal/extension of the four (1) master leases expiring this year, three of which are Sponsor-related properties. 6 Woodlands Loop is being considered for divestment. Strategic Review Update As announced previously on 7 August 2017, the Manager is still in discussions with ESR Funds Management (S) Limited to explore options in connection with the Strategic Review. At this point, Sabana REIT has not entered into any definitive legally binding agreement. Accordingly, there can be no assurance that any transaction or agreements will eventually materialise pursuant to these discussions. The Manager will make the necessary announcements in accordance with its obligations under the listing rules as and when there are any material developments arising out of the Strategic Review exercise. (1) 21 Joon Koon Crescent, 33 & 35 Penjuru Lane, 18 Gul Drive and 51 Penjuru Road. 26

27 Contents I. Key Highlights 5 II. Financial Performance 7 III. Capital Management 12 IV. Portfolio Performance 15 V. Outlook and Strategy 25 VI. 3Q 2017 Non-Shari ah Income 28 VII. Distribution Details 30 27
28 3Q 2017 Non-Shari ah Income Sabana REIT gives out its non-shari ah income on a quarterly basis, to charitable causes After taking into consideration the Ta widh and Ta widh processing cost for the quarter, there will be no non-shari ah compliant income subjected to cleansing and to be donated to charitable causes for 3Q

29 Contents I. Key Highlights 5 II. Financial Performance 7 III. Capital Management 12 IV. Portfolio Performance 15 V. Outlook and Strategy 25 VI. 3Q 2017 Non-Shari ah Income 28 VII. Distribution Details 30 29
30 Distribution Details Sabana REIT Code: MIGU Distribution period DPU (cents) 1 July 2017 to 30 September Distribution Timetable Last date that the Units are quoted on a cum - distribution basis 26 October 2017 Ex-date Books closure date 27 October 2017, 9am 31 October 2017, 5pm Distribution payment date 28 November

31 Thank you Sabana Real Estate Investment Management Pte. Ltd. 151 Lorong Chuan #02-03 New Tech Park Singapore Tel: Fax: For enquiries, please contact: Mr Bobby Tay Chief Strategy Officer & Head of Investor Relations Tel: Ms Jasmine Teo Manager, Investor Relations Tel:
SABANA SHARI AH COMPLIANT INDUSTRIAL REIT
 SABANA SHARI AH COMPLIANT INDUSTRIAL REIT 1Q 2017: First Quarter Ended 31 March 2017 Financial Results Presentation 9 May 2017 Important Notice Disclaimer This presentation shall be read in conjunction
SABANA SHARI AH COMPLIANT INDUSTRIAL REIT
 SABANA SHARI AH COMPLIANT INDUSTRIAL REIT 3Q 2016: Third Quarter Ended 30 September 2016 Financial Results Presentation 17 October 2016 Important Notice Disclaimer This presentation shall be read in conjunction
Sabana Shari ah Compliant Industrial REIT 3Q 2018 Financial Results Presentation. 26 October 2018
 Sabana Shari ah Compliant Industrial REIT 3Q 2018 Financial Results Presentation 26 October 2018 Important Notice Disclaimer This presentation shall be read in conjunction with the financial information
SABANA SHARI AH COMPLIANT INDUSTRIAL REIT
 SABANA SHARI AH COMPLIANT INDUSTRIAL REIT 1Q 2015: First Quarter Ended 31 March 2015 Financial Results Presentation 20 April 2015 Important Notice Disclaimer This presentation shall be read in conjunction
SABANA SHARI AH COMPLIANT INDUSTRIAL REIT
 SABANA SHARI AH COMPLIANT INDUSTRIAL REIT 4Q 2016 and FY 2016: Fourth Quarter and Full Year Ended 31 December 2016 Financial Results Presentation 25 January 2017 Important Notice Disclaimer This presentation
SABANA SHARI AH COMPLIANT INDUSTRIAL REIT. Investor Presentation November 2014
 SABANA SHARI AH COMPLIANT INDUSTRIAL REIT Investor Presentation November 2014 Important notice Disclaimer This presentation shall be read in conjunction with the financial information of Sabana Shari ah
SUMMARY OF RESULTS FOR SABANA GROUP. Note: Please refer to Item 6 on Page 15 for the DPU computation. Page 2. Group Quarter Fav /
 FOR THIRD QUARTER FROM 1 JULY 2014 AND PERIOD FROM 1 JANUARY 2014 INTRODUCTION Sabana Shari ah Compliant Industrial Real Estate Investment ( Sabana Shari ah Compliant REIT or ) is a real estate investment
AIMS AMP CAPITAL INDUSTRIAL REIT
 AIMS AMP CAPITAL INDUSTRIAL REIT 3 rd Quarter Ended 31 December 2011 Results Presentation 20 January 2012 Important Notice Disclaimer This Presentation is focused on comparing actual results for the financial
3Q2016 Financial Results Presentation 26 October Pioneer Crescent
 3Q2016 Financial Results Presentation 26 October 2016 25 Pioneer Crescent Content Executive Summary Real Estate Highlights Financial & Capital Management Highlights Appendix 2 3Q2016 Executive Summary
3Q 2012 Presentation Slides. 1 Nov 2012
 3Q 2012 Presentation Slides 1 Nov 2012 2 Important Notice This material shall be read in conjunction with CIT s financial statements for the financial period ended 30 Sep 2012. The value of units in CIT
AIMS AMP CAPITAL INDUSTRIAL REIT
 AIMS AMP CAPITAL INDUSTRIAL REIT FY2013: 2 nd Quarter Ended 30 September 2012 Results Presentation 24 October 2012 Important Notice Disclaimer This Presentation is focused on comparing actual results for
SABANA REIT 3Q 2013 GROSS REVENUE INCREASE 6.3% Y O Y, CONTINUES TO GROW VIA ACQUISITION
 SABANA SHARI AH COMPLIANT INDUSTRIAL REAL ESTATE INVESTMENT TRUST (a real estate investment trust constituted on 29 October 2010 under the laws of the Republic of Singapore) SABANA REIT 3Q 2013 GROSS REVENUE
OSK DMG ASEAN & Hong Kong Corporate Day June 2012
 OSK DMG ASEAN & Hong Kong Corporate Day 26-28 June 2012 2 Important Notice This material shall be read in conjunction with CIT s financial statements for the financial period ended 31 March 2012. The value
Citi ASEAN Conference 12 June Tai Seng Street
 Citi ASEAN Conference 12 June 2014 1 16 Tai Seng Street Important Notice This material shall be read in conjunction with CIT s financial statements for the financial period ended 31 Mar 2014. The value
FY2014 Financial Results Presentation
 FY2014 Financial Results Presentation 16 January 2015 16 International Business Park Important Notice This material shall be read in conjunction with CIT s results announcements for the financial period
AIMS AMP CAPITAL INDUSTRIAL REIT
 AIMS AMP CAPITAL INDUSTRIAL REIT FY2016: First Quarter Financial Results Ended 30 June 2015 Results Presentation 29 July 2015 Important notice Disclaimer This Presentation is focused on comparing actual
AIMS AMP CAPITAL INDUSTRIAL REIT
 AIMS AMP CAPITAL INDUSTRIAL REIT FY2018: Second Quarter Financial Results Ended 30 September 2017 Results Presentation 26 October 2017 1 Important notice Disclaimer This Presentation is focused on comparing
AIMS AMP CAPITAL INDUSTRIAL REIT
 AIMS AMP CAPITAL INDUSTRIAL REIT FY2016: Second Quarter Financial Results Ended 30 September 2015 Results Presentation 29 October 2015 Important notice Disclaimer This Presentation is focused on comparing
AIMS AMP CAPITAL INDUSTRIAL REIT
 AIMS AMP CAPITAL INDUSTRIAL REIT FY2018: First Quarter Financial Results Ended 30 June 2017 Results Presentation 27 July 2017 1 Important notice Disclaimer This Presentation is focused on comparing actual
FY2015 Financial Results Presentation
 FY2015 Financial Results Presentation 14 January 2016 16 International Business Park 2 Content Executive Summary Financial Summary Real Estate Highlights Financial & Capital Management Highlights Appendix
AIMS AMP CAPITAL INDUSTRIAL REIT
 AIMS AMP CAPITAL INDUSTRIAL REIT FY2019: First Quarter Financial Results Ended 30 June 2018 Results Presentation 26 July 2018 1 Important notice Disclaimer This Presentation is focused on comparing actual
2Q2014 Financial Results 24 July Creating Value & Delivering Growth
 2Q2014 Financial Results 24 July 2014 1 Creating Value & Delivering Growth Important Notice This material shall be read in conjunction with CIT s financial statements for the financial period ended 30
DONALD HAN APPOINTED AS NEW CEO AND NEW INDEPENDENT DIRECTOR JOINS BOARD; 4Q DPU OF 0.83 SINGAPORE CENTS REPORTED
 SABANA SHARI AH COMPLIANT INDUSTRIAL REAL ESTATE INVESTMENT TRUST (a real estate investment trust constituted on 29 October 2010 under the laws of the Republic of Singapore) DONALD HAN APPOINTED AS NEW
Singapore Investor Roadshow
 Singapore Investor Roadshow 11 May 2015 16 International Business Park Important Notice This material shall be read in conjunction with CIT s results announcements for the financial period ended 31 December
FY2012 Financial Results Presentation
 FY2012 Financial Results Presentation 21 January 2013 Knowing. Believing. Delivering ARA-CWT Trust Management (Cache) Limited Agenda Overview & FY12 Key Highlights 4QFY12 & FY12 Full Year Financial Performance
AIMS AMP CAPITAL INDUSTRIAL REIT
 AIMS AMP CAPITAL INDUSTRIAL REIT FY2014: Third Quarter ended 31 December 2013 Results Presentation 29 January 2014 Important notice Disclaimer This Presentation is focused on comparing actual results for
AIMS AMP CAPITAL INDUSTRIAL REIT
 AIMS AMP CAPITAL INDUSTRIAL REIT FY2018: Fourth Quarter Financial Results Ended 31 March 2018 Results Presentation 25 April 2018 1 Important notice Disclaimer This Presentation is focused on comparing
Balance Sheet Positioned for Future Growth with No Major Refinancing Due Until 2016
 (Constituted in the Republic of Singapore pursuant to a trust deed dated 31 March 2006 (as amended)) Press Release Balance Sheet Positioned for Future Growth with No Major Refinancing Due Until 2016 Refinanced
Hong Kong Non-Deal Roadshow Hong Kong, 4 March International Business Park
 Hong Kong Non-Deal Roadshow Hong Kong, 4 March 2016 16 International Business Park 2 Content CIT FY2015 Results Executive Summary Financial Summary Real Estate Highlights Financial & Capital Management
CLSA Asean Forum Bangkok, March International Business Park
 CLSA Asean Forum Bangkok, March 2016 16 International Business Park 2 Content Overview of CIT CIT FY2015 Financial Results Overview Financial & Capital Management Highlights Real Estate Highlights Singapore
1Q2009 Results. 24 April 2009
 Cambridge Industrial Trust 1Q2009 Results 24 April 2009 Presentation Outline 1Q09 Highlights ht 1Q09 Financial Highlights Risk Management Strategy for 2009 2 1Q09 Achievements Occupancy remains high at
SGX REIT & BT SEMINAR Tokyo, 30 June Pioneer Crescent
 SGX REIT & BT SEMINAR Tokyo, 30 June 3016 25 Pioneer Crescent Singapore Industrial REITs (S-REITs) 3 Key Features Bond-like listed security ( Dividend Play ) that provides steady income distribution stream
4QFY2013 and 2HFY2013 Results Presentation. January 2014
 4QFY2013 and 2HFY2013 Results Presentation January 2014 1 Disclaimer This presentation should be read in conjunction with the financial statements of Soilbuild Business Space REIT for the period from 1
Acquisition of 7000 AMK and the Proposed Equity Fund Raising. 14 December 2017
 Acquisition of 7000 AMK and the Proposed Equity Fund Raising 14 December 2017 Contents A Overview B Benefits of the Acquisition C Funding Structure and Financial Impact D Recent Developments E Conclusion
Investor Presentation. May 2013
 Investor Presentation May 2013 DISCLAIMER This presentation is for information only and does not constitute an offer or solicitation of an offer to subscribe for, acquire, purchase, dispose of or sell
Cambridge Industrial Trust Financial results for the first quarter ended 31 March April
 1 Cambridge Industrial Trust Financial results for the first quarter ended 31 March 2010 21 April 2010 www.cambridgeindustrialtrust.com important notice 2 The value of units in CIT ( Units ) and the income
AIMS AMP CAPITAL INDUSTRIAL REIT
 AIMS AMP CAPITAL INDUSTRIAL REIT 8 th ANNUAL GENERAL MEETING PRESENTATION 27 July 2017 1 Important notice Disclaimer This Presentation is focused on comparing actual results for the financial period from
Sabana REIT reports on-forecast Net Property Income and Distributable Income for 3Q2011
 SABANA SHARI AH COMPLIANT INDUSTRIAL REAL ESTATE INVESTMENT TRUST (a real estate investment trust constituted on 29 October 2010 under the laws of the Republic of Singapore) Sabana REIT reports on-forecast
Notice of Annual General Meeting
 7 th Annual General Meeting 18 July 2017 Important Notice This presentation shall be read in conjunction with Mapletree Industrial Trust s ( MIT ) financial statements for the financial year ended 31 March
1Q FY2009/10 Financial Results Presentation 17 July 2009
 1Q FY2009/10 Financial Results Presentation 17 July 2009 Disclaimers This Presentation is focused on comparing results for the three months ended 30 June 2009 versus actual results year-on-year ( yoy ).
3Q2010 Financial Results. 20 October 2010
 3Q2010 Financial Results 20 October 2010 important notice The value of units in CIT ( Units ) and the income derived from them may fall as well as rise. Units are not investments, liabilities or obligations
Viva Industrial Trust 4Q2017 & FY2017 Results Presentation. 26 January 2018
 Viva Industrial Trust 4Q2017 & FY2017 Results Presentation 26 January 2018 1 Important Notice This presentation is for information purposes only and does not constitute or form part of an offer, invitation
26 April ARA-CWT Trust Management (Cache) Limited
 Limited") 1Q 2011 Financial Results 26 April 2011 ARA-CWT Trust Management (Cache) Limited Agenda 1Q 2011 Financial i Results Portfolio Update Going Forward 2 Highlights 1Q 2011 Results Property Income slightly
1Q 2011 Financial Results 26 April 2011 ARA-CWT Trust Management (Cache) Limited Agenda 1Q 2011 Financial i Results Portfolio Update Going Forward 2 Highlights 1Q 2011 Results Property Income slightly
SABANA SHARI AH COMPLIANT INDUSTRIAL REIT. Dialogue Session with Securities Investors Association (Singapore) 21 April 2017
 21 April 2017") SABANA SHARI AH COMPLIANT INDUSTRIAL REIT Dialogue Session with Securities Investors Association (Singapore) 21 April 2017 Disclaimer This presentation should be read in conjunction with the circular to
SABANA SHARI AH COMPLIANT INDUSTRIAL REIT Dialogue Session with Securities Investors Association (Singapore) 21 April 2017 Disclaimer This presentation should be read in conjunction with the circular to
Financial Results for the Quarter / Year Ended 31 Mar April 2012
 Financial Results for the Quarter / Year Ended 31 Mar 2012 19 April 2012 Disclaimer This Presentation is focused on comparing results for the three months ended 31 Mar 2012 versus results achieved in the
Financial Results Presentation 3Q2017
 Financial Results Presentation 3Q2017 Contents A 3Q2017 Results B C Financial Performance Prudent Capital Management D Real Estate Highlights E Market Outlook F Appendix 2 3Q2017 Results 3Q2017 At A Glance
MAPLETREE LOGISTICS TRUST S 3Q FY13/14 DISTRIBUTION PER UNIT RISES 7% YEAR-ON-YEAR
 For Immediate Release MAPLETREE LOGISTICS TRUST S 3Q FY13/14 DISTRIBUTION PER UNIT RISES 7% YEAR-ON-YEAR Highlights: Amount Distributable to Unitholders registered 8% year-on-year growth Results underpinned
FINANCIAL STATEMENTS ANNOUNCEMENT FOR THE FINANCIAL PERIOD ENDED 30 SEPTEMBER 2018 ( 3Q2018 )
") FOR THE FINANCIAL PERIOD ENDED 30 SEPTEMBER 2018 ( 3Q2018 ) The Directors of ESR Funds Management (S) Limited ( ESR-FM ), as manager ( Manager ) of ESR- REIT, are pleased to announce the unaudited results
FOR THE FINANCIAL PERIOD ENDED 30 SEPTEMBER 2018 ( 3Q2018 ) The Directors of ESR Funds Management (S) Limited ( ESR-FM ), as manager ( Manager ) of ESR- REIT, are pleased to announce the unaudited results
Ascendas Reit s Total Amount Available for Distribution for FY16/17 grew 18.0% y-o-y to S$446.3 million
 25 April 2017 Ascendas Reit s Total Amount Available for Distribution for FY16/17 grew 18.0% y-o-y to S$446.3 million Highlights: 1. FY16/17 Distribution per Unit (DPU) grew by 2.5% year-on-year (y-o-y)
Viva Industrial Trust
 Viva Industrial Trust Financial Results for the Period from 4 November 2013 to 31 December 2013 25 February 2014 Important Notice This presentation is for information purposes only and does not constitute
SABANA SHARI AH COMPLIANT INDUSTRIAL REAL ESTATE INVESTMENT TRUST LISTING OF
 SABANA SHARI AH COMPLIANT INDUSTRIAL REAL ESTATE INVESTMENT TRUST (a real estate investment trust constituted on 29 October 2010 under the laws of the Republic of Singapore) LISTING OF SABANA SHARI AH
AIMS AMP CAPITAL INDUSTRIAL REIT
 AIMS AMP CAPITAL INDUSTRIAL REIT FY2017: Fourth Quarter Financial Results Ended 31 March 2017 Results Presentation 27 April 2017 1 Important notice Disclaimer This Presentation is focused on comparing
27 January ARA-CWT Trust Management (Cache) Limited
 Limited") 4Q 2010 Financial Results 27 January 2011 ARA-CWT Trust Management (Cache) Limited Agenda 4Q 2010 Financial Results Portfolio Update Going Forward 2 Highlights 4Q 2010 Results Net Property Income of S$14.4m
4Q 2010 Financial Results 27 January 2011 ARA-CWT Trust Management (Cache) Limited Agenda 4Q 2010 Financial Results Portfolio Update Going Forward 2 Highlights 4Q 2010 Results Net Property Income of S$14.4m
Introduction to Cache Logistics Trust
 Introduction to Cache Logistics Trust 30 May 2013 Tampines Regional Library Knowing. Believing. Delivering ARA-CWT Trust Management (Cache) Limited Agenda About Cache Logistics Trust 1QFY2013 Financial
Cache Logistics Trust 2011 Annual General Meeting
 Cache Logistics Trust 2011 Annual General Meeting 18 April 2012 Knowing. Believing. Delivering ARA-CWT Trust Management (Cache) Limited Agenda REIT Overview FY2011 Performance Portfolio Going Forward 2
Investor Presentation August 2017
 Investor Presentation August 2017 Important Notice This presentation shall be read in conjunction with Mapletree Industrial Trust s ( MIT ) financial results for First Quarter Financial Year 2017/2018
Ascendas Reit s Total Amount Available for Distribution for 2Q FY16/17 rose 12.3% y-o-y to S$112.5 million
 20 October 2016 Ascendas Reit s Total Amount Available for Distribution for 2Q FY16/17 rose 12.3% y-o-y to S$112.5 million Highlights: 1. 2Q FY16/17 performance boosted mainly by contributions from the
CIT reports steady 2Q2015 results and improved capital structure
 (Constituted in the Republic of Singapore pursuant to a trust deed dated 31 March 2006 (as amended)) Press Release CIT reports steady 2Q2015 results and improved capital structure Net property income increased
1Q FY2013 Financial Results Presentation
 1Q FY2013 Financial Results Presentation 24 April 2013 Knowing. Believing. Delivering ARA-CWT Trust Management (Cache) Limited Agenda Key Highlights Financial Performance Capital Management Asset Management
Sabana Shari ah Compliant Industrial REIT. Kevin Xayaraj Tay, CEO, Sabana Real Estate Investment Management Pte Ltd
 Sabana Shari ah Compliant Industrial REIT Kevin Xayaraj Tay, CEO, Sabana Real Estate Investment Management Pte Ltd What is Sabana REIT World s largest listed Shari ah Compliant REIT First listed REIT globally
Investor Presentation March 2016
 Investor Presentation March 2016 Important Notice This presentation shall be read in conjunction with Mapletree Industrial Trust s ( MIT ) financial results for Third Quarter Financial Year 2015/2016 in
INTERESTED PERSON TRANSACTIONS PROPOSED ACQUISITION OF 47 CHANGI SOUTH AVENUE 2 SINGAPORE
 SABANA SHARI AH COMPLIANT INDUSTRIAL REAL ESTATE INVESTMENT TRUST (A real estate investment trust constituted on 29 October 2010 under the laws of the Republic of Singapore) 1. INTRODUCTION INTERESTED
VIVA INDUSTRIAL TRUST REPORTS NET PROPERTY INCOME OF S$21 MILLION AND DPS OF CENTS IN 2Q2018
 Viva Industrial Trust Management Pte. Ltd. Viva Asset Management Pte. Ltd. 750 Chai Chee Road #04-03 Viva Business Park Singapore 469000 NEWS RELEASE VIVA INDUSTRIAL TRUST REPORTS NET PROPERTY INCOME OF
6 th Annual General Meeting 24 April International Business Park
 6 th Annual General Meeting 24 April 2015 16 International Business Park Important Notice This material shall be read in conjunction with CIT s results announcements for the financial period ended 31 December
Viva Industrial Trust 2Q2018 Results Presentation. 13 August 2018
 Viva Industrial Trust 2Q2018 Results Presentation 13 August 2018 1 Important Notice This presentation is for information purposes only and does not constitute or form part of an offer, invitation or solicitation
Results Slide 3. Balance sheet Slide 8. Operational performance Slide 11. Growth strategy and market outlook Slide 16
 1Q FY18 Financial Results 5 January 2018 Disclaimer This presentation is for information only and does not constitute an invitation or offer to a c q u i r e, p u r c h a s e or s u b s c r i b e f o r
Financial Results for Third Quarter ended 30 September October
 Financial Results for Third Quarter ended 30 September 2009 27 October 2009 www.cambridgeindustrialtrust.com 1 Important Notice The value of units in CIT ( Units ) and the income derived from them may
Cambridge Industrial Trust Presentation on 3Q2007 Results. 30 Oct 2007
 Cambridge Industrial Trust Presentation on 3Q2007 Results 30 Oct 2007 References in this presentation Unless otherwise stated, all capitalised terms used shall have the same meaning as in the prospectus
PROPOSED ACQUISITION OF 72 EUNOS AVENUE 7, SINGAPORE
 SABANA SHARI AH COMPLIANT INDUSTRIAL REAL ESTATE INVESTMENT TRUST (a real estate investment trust constituted on 29 October 2010 under the laws of the Republic of Singapore) 1. INTRODUCTION PROPOSED ACQUISITION
SGX-REITAS Education Series
 SGX-REITAS Education Series 23 February 2016 16 International Business Park 2 Executive Summary Singapore Industrial Real Estate Sector Overview Role of Regulators in the Industrial Sector Overview of
Mapletree Industrial Trust Achieves Distribution Per Unit of 2.05 Cents for 2QFY2011 at 10.8% above Forecast 1
 PRESS RELEASE Mapletree Industrial Trust Achieves Distribution Per Unit of 2.05 Cents for 2QFY2011 at 10.8% above Forecast 1 Distribution per Unit ( DPU ) of 2.05 cents, higher than IPO Forecast ( Forecast
FY2018 Results Presentation. 22 Jan 2019
 FY2018 Results Presentation 22 Jan 2019 Disclaimer This presentation may contain forward-looking statements that involve assumptions, risks and uncertainties. Actual future performance, outcomes and results
MAPLETREE LOGISTICS TRUST S 4Q FY17/18 DISTRIBUTION PER UNIT RISES 4% TO CENTS
 For Immediate Release MAPLETREE LOGISTICS TRUST S 4Q FY17/18 DISTRIBUTION PER UNIT RISES 4% TO 1.937 CENTS Highlights: 4Q FY17/18 amount distributable to Unitholders grew 27% year-on-year to S$59.2 million
(Constituted in the Republic of Singapore pursuant to a trust deed dated 31 March 2006 (as amended))
)") (Constituted in the Republic of Singapore pursuant to a trust deed dated 31 March 2006 (as amended)) ASSET VALUATION Pursuant to Rule 703 of the SGX-ST Listing Manual, ESR Funds Management (S) Limited,
(Constituted in the Republic of Singapore pursuant to a trust deed dated 31 March 2006 (as amended)) ASSET VALUATION Pursuant to Rule 703 of the SGX-ST Listing Manual, ESR Funds Management (S) Limited,
(a real estate investment trust constituted on 13 December 2012 under the laws of the Republic of Singapore)
") (a real estate investment trust constituted on 13 December 2012 under the laws of the Republic of Singapore) SOILBUILD BUSINESS SPACE REIT UNAUDITED FINANCIAL STATEMENTS AND TABLE OF CONTENTS Item No.
(a real estate investment trust constituted on 13 December 2012 under the laws of the Republic of Singapore) SOILBUILD BUSINESS SPACE REIT UNAUDITED FINANCIAL STATEMENTS AND TABLE OF CONTENTS Item No.
MAPLETREE LOGISTICS TRUST S 1Q FY17/18 DPU RISES 2% YEAR-ON-YEAR TO CENTS
 For Immediate Release MAPLETREE LOGISTICS TRUST S 1Q FY17/18 DPU RISES 2% YEAR-ON-YEAR TO 1.887 CENTS Highlights: Amount distributable to Unitholders grew 2.5% year-on-year to S$47.2 million Stable operations
Investor Presentation November 2015
 Investor Presentation November 2015 Important Notice This presentation shall be read in conjunction with Mapletree Industrial Trust s ( MIT ) financial results for Second Quarter Financial Year 2015/2016
World s LARGEST. Listed Shari ah Compliant Industrial REIT by Total Assets. As at 31 December 2016
 CONTENTS 02 Letter to Unitholders 05 Corporate Profile 06 Core Values 07 Vision and Mission 08 Our Strategy 09 Our Trust Structure 10 Shari ah Compliance Commonly Asked Questions 12 2016 Significant Events
MAPLETREE LOGISTICS TRUST S QUARTERLY DISTRIBUTION PER UNIT RISES 10% YEAR-ON-YEAR
 For Immediate Release MAPLETREE LOGISTICS TRUST S QUARTERLY DISTRIBUTION PER UNIT RISES 10% YEAR-ON-YEAR Highlights: Distribution Per Unit ( DPU ) of 1.70 cents for the 3 months ended 31 March 2012 Portfolio
Mapletree Commercial Trust
 Mapletree Commercial Trust 1Q FY17/18 Financial Results 27 July 2017 1 Important Notice This presentation is for information only and does not constitute an offer or solicitation of an offer to sell or
Financial Results for 3 rd Quarter November 2017
 Financial Results for 3 rd Quarter 2017 2 November 2017 Important Notice This presentation shall be read in conjunction with OUE Commercial REIT s Financial Results announcement for 3Q 2017 dated 2 November
Financial Results Presentation 4Q/FY2017
 Financial Results Presentation 4Q/FY2017 Contents A FY2017 Results B C Financial Performance Prudent Capital Management D Real Estate Highlights E Market Outlook and Strategy F Appendix 2 FY2017 Results
Proposed Merger (the Merger ) with Viva Industrial Trust. 18 May 2018
 with Viva Industrial Trust. 18 May 2018") Proposed Merger (the Merger ) with Viva Industrial Trust 18 May 2018 Contents 1 2 3 4 5 6 Transaction Overview Key Benefits of the Merger Approvals Required Indicative Timeline Conclusion Appendix 2 Important
Proposed Merger (the Merger ) with Viva Industrial Trust 18 May 2018 Contents 1 2 3 4 5 6 Transaction Overview Key Benefits of the Merger Approvals Required Indicative Timeline Conclusion Appendix 2 Important
MAPLETREE LOGISTICS TRUST DELIVERS STEADY PERFORMANCE FOR 1H FY16/17
 For Immediate Release MAPLETREE LOGISTICS TRUST DELIVERS STEADY PERFORMANCE FOR 1H FY16/17 Highlights: Maintained DPU at 1.86 cents for 2Q FY16/17 and 3.71 cents for 1H FY16/17 Stable portfolio occupancy
Financial Results for 4 th Quarter 2017 and Year Ended 31 December 2017
 Financial Results for 4 th Quarter 2017 and Year Ended 31 December 2017 31 January 2018 Important Notice This presentation shall be read in conjunction with OUE Commercial REIT s Financial Results announcement
Financial Results for the Quarter Ended 31 Dec January 2012
 Financial Results for the Quarter Ended 31 Dec 2011 19 January 2012 Disclaimer This Presentation is focused on comparing results for the three months ended 31 Dec 2011 versus results achieved in the three
AIMS AMP CAPITAL INDUSTRIAL REIT MANAGEMENT LIMITED
 AIMS AMP CAPITAL INDUSTRIAL REIT MANAGEMENT LIMITED As Manager of AIMS AMP Capital Industrial REIT 1 Raffles Place, #21-01 One Raffles Place Singapore 048616 Media Release AIMS AMP Capital Industrial REIT
Mapletree Industrial Trust Delivers 9.0% Year-on-Year Growth for 1QFY13/14 Distributable Income
 (Constituted in Republic of Singapore pursuant to a Trust Deed dated 29 January 2008 (as amended)) PRESS RELEASE Mapletree Industrial Trust Delivers 9.0% Year-on-Year Growth for 1QFY13/14 Distributable
VIVA INDUSTRIAL TRUST REPORTS 3.5% YEAR-ON-YEAR INCREASE IN NET PROPERTY INCOME TO S$21 MILLION AND DPS OF CENTS FOR 1Q2018
 Viva Industrial Trust Management Pte. Ltd. Viva Asset Management Pte. Ltd. 750 Chai Chee Road #04-03 Viva Business Park Singapore 469000 NEWS RELEASE VIVA INDUSTRIAL TRUST REPORTS 3.5% YEAR-ON-YEAR INCREASE
PART I - INFORMATION REQUIRED FOR ANNOUNCEMENTS OF QUARTERLY (Q1, Q2 & Q3), HALF-YEAR AND FULL YEAR RESULTS
, HALF-YEAR AND FULL YEAR RESULTS") FREIGHT LINKS EXPRESS HOLDINGS LIMITED (Company Registration No. 198600061G) Unaudited Third Quarter Financial Statement Announcement Ended 31 January 2011 PART I - INFORMATION REQUIRED FOR ANNOUNCEMENTS
FREIGHT LINKS EXPRESS HOLDINGS LIMITED (Company Registration No. 198600061G) Unaudited Third Quarter Financial Statement Announcement Ended 31 January 2011 PART I - INFORMATION REQUIRED FOR ANNOUNCEMENTS
Viva Industrial Trust 3Q2014 Financial Results. 21 October 2014
 Viva Industrial Trust 3Q2014 Financial Results 21 October 2014 Important Notice This presentation is for information purposes only and does not constitute or form part of an offer, invitation or solicitation
Proposed Merger with Viva Industrial Trust. 29 January 2018
 Proposed Merger with Viva Industrial Trust 29 January 2018 1 Important Notice This material shall be read in conjunction with ESR-REIT s results announcements for the financial period ended 31 December
AIMS AMP Capital Industrial REIT sustains stable DPU of 2.50 cents for 3Q FY2019
 AIMS AMP CAPITAL INDUSTRIAL REIT MANAGEMENT LIMITED As Manager of AIMS AMP Capital Industrial REIT One George Street, #23-03 Singapore 049145 Media Release AIMS AMP Capital Industrial REIT sustains stable
Mapletree Industrial Trust Achieves Distributable Income of S$35.8 million for 4QFY11/12
 (Constituted in Republic of Singapore pursuant to a Trust Deed dated 29 January 2008 (as amended)) PRESS RELEASE Mapletree Industrial Trust Achieves Distributable Income of S$35.8 million for 4QFY11/12
Mapletree Logistics Trust s 2Q FY17/18 Distribution per Unit Grows 1.5% Year-on-Year
 For Immediate Release Mapletree Logistics Trust s 2Q FY17/18 Distribution per Unit Grows 1.5% Year-on-Year Amount distributable to Unitholders increased 3.5% year-on-year to S$48.2 million Continuing,
Investor Presentation
 Investor Presentation 15 September 2011 Knowing. Believing. Delivering ARA-CWT Trust Management (Cache) Limited Agenda REIT Overview Management Strategy 2Q 2011 Financial Results Portfolio Update Going
Viva Industrial Trust. Extraordinary General Meeting & Scheme Meeting
 Viva Industrial Trust Extraordinary General Meeting & Scheme Meeting 31 August 2018 1 Disclaimer NOT FOR RELEASE, PUBLICATION OR DISTRIBUTION, IN WHOLE OR IN PART, IN, INTO OR FROM ANY JURISDICTION WHERE
Acquisition of 7 Penjuru Close, Singapore November 2009
 Acquisition of 7 Penjuru Close, Singapore 608779 9 November 2009 0 0 Agenda Details of the property: 7 Penjuru Close, Singapore 608779 Impact on MapletreeLog Acquisition is DPU accretive Tenant diversification
2Q FY18 Financial Results 6 April 2018
 2Q FY18 Financial Results 6 April 2018 Disclaimer This presentation is for information only and does not constitute an invitation or offer to a c q u i r e, p u r c h a s e or s u b s c r i b e f o r u
Financial Results for 4 th Quarter and Year Ended 31 December January 2019
 Financial Results for 4 th Quarter and Year Ended 31 December 2018 30 January 2019 Important Notice This presentation should be read in conjunction with the announcements released by OUE Commercial REIT