Investor Presentation. March 2011
|
|
|
- Chad Ross
- 5 years ago
- Views:
Transcription


1 Investor Presentation March 2011
2 Mapletree Industrial Trust ( MIT ) Overview of Mapletree Industrial Trust Portfolio Highlights Robust, Resilient, Relevant & Reputable Financial Highlights First Financial Results (21 Oct to 31 Dec 2010) Conclusion 1

3 2 Overview of Mapletree Industrial Trust
 Transaction Type: Distribution of Units: Offer Price: Total Units: Lock-up Period: Initial Public Offering Public & institutional investors: 69%")
4 Largest S-REIT IPO S$1.188 billion 1 (US$0.938 billion) 2 raised via Initial Public Offering on SGX Mainboard 21 October 2010 Institutional Subscription of 39.6x Public Offer Subscription of 27.7x Ticker / Listing: MINT / Singapore Exchange (SGX) Transaction Type: Distribution of Units: Offer Price: Total Units: Lock-up Period: Initial Public Offering Public & institutional investors: 69% Mapletree Investments Pte Ltd (Sponsor): 31% S$0.93 (US$0.73) 1,462,664,000 units 180 days lock-up on Sponsor, Sponsor entities and Manager 1 Includes Mapletree Cornerstone Subscription Units 2 Based on exchange rate of S$/US$ = (4 Mar 2011) Source: Bloomberg 85 Joint Global Coordinators 85 3 Joint Bookrunners, Issue Managers and Underwriters 3
5 Overview of Mapletree Industrial Trust Sponsor Mapletree Investments Pte Ltd ( MIPL ) Public & Inst Unitholders MIPL Investment mandate Owns 31% of MIT Focused on income producing real estate in Singapore primarily used for industrial purposes, excluding properties primarily used for logistics purposes 69% 31% Trustee Manager Portfolio Manager Property Manager Trustee 70 properties valued at S$2.1 billion (US$1.7billion) 1 1.5million sq m GFA 1.1million sq m NLA Mapletree Industrial Trust Management Ltd. 100% owned by the Sponsor Mapletree Facilities Services Pte. Ltd. 100% owned by the Sponsor DBS Trustee Limited Portfolio 3 Business Park Buildings 53 Flatted Factories (Grouped into 22 clusters 2 ) 7 Stack-up / Ramp-up Buildings (Grouped into 1 cluster 2 ) 6 Light Industrial Buildings 3 1 Warehouse Property Manager 1 Based on exchange rate of S$/US$ = (Source: Bloomberg on 4 Mar 2011) 2 A property cluster consists of one or more individual buildings situated on the same land lot or adjoining land lots 3 Includes 26 Woodlands Loop, which is a property comprising 3 individual buildings 4

 2 S$2.1 billion (US$1.")
6 70 Properties Spanning 4 Key Property Types One of the largest industrial landlords in Singapore Total assets of approx. S$2.2 billion (US$1.7billion) 1 Total GFA of approx. 1.5 million sq m Total NLA of approx. 1.1 million sq m Tenant base of more than 1,500 MNCs, listed companies & local enterprises Largest tenant base among industrial S-REITs Stack-up/ Ramp-up Buildings Light Industrial Buildings 9% 1% Warehouse 15% By Valuation 2 53% Flatted Factories Business Park Buildings Flatted Factories Business Park Buildings 21% 1 Based on exchange rate of S$/US$ = (Source: Bloomberg on 4 Mar 11) 2 S$2.1 billion (US$1.7billion) 1 as at 31 August 2010 based on the higher of the 2 valuations for each property by CBRE and Colliers 5 Stack-up / Ramp-up Buildings Light Industrial Buildings
7 Strategically Located Across Singapore Johor Causeway Woodlands East Woodlands Region Woodlands Central Tampines Region Jurong East Region Serangoon North Loyang Second Link International Business Park Seaport Seaport Clementi West Telok Blangah Tanglin Halt Toa Payoh North Redhill Tiong Bahru Kolam Ayer Seaport Kampong Ampat Kallang Basin CBD Kaki Bukit Changi North Changi Business Park LEGEND Business Park Buildings Flatted Factories Airport Stack-up/Ramp-Up Buildings Light Industrial Buildings Warehouse Regional Centres Major Expressways 6


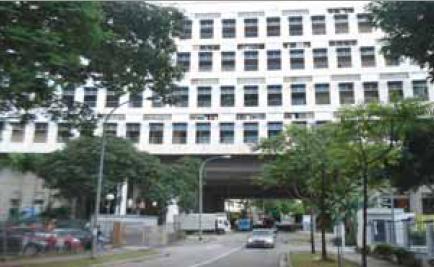


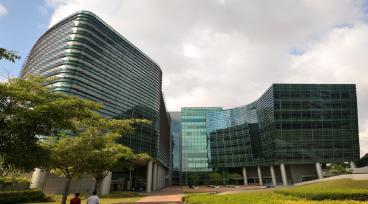
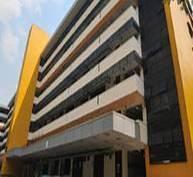
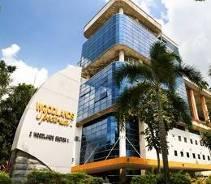
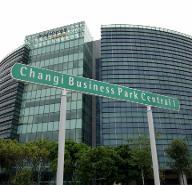
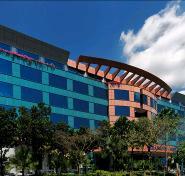
8 Selected MIT Properties The Signature The Synergy The Strategy Kaki Bukit Kampong Ampat Telok Blangah Loyang 1 Redhill 1 Woodlands Central Woodlands Spectrum 1 & 2 19 Tai Seng Drive Tata Communications Exchange LEGEND Business Park Buildings Flatted Factories Stack-up/Ramp-Up Buildings Light Industrial Buildings 7
9 8 Portfolio Highlights
10 Robust, Resilient Relevant & Reputable Strong Embedded Organic Growth Potential Large, Diversified and Resilient Portfolio with Market Presence Strong Market Fundamentals Potential Growth Opportunity from Active Asset Mgt and Acquisitions Experienced Manager and Committed Sponsor 9

11 Rental Rate (S$) Embedded Organic Growth Rental cap : 99.3% renewed at maximum of cap 10 For 3QFY10 (1 October 2010 to 31 December 2010)
 by Gross Rental Income = 2.")
12 % Expiring Leases by Gross Rental Income Well-Positioned to Capitalise on Growth Weighted Average Lease Expiry ( WALE ) by Gross Rental Income = 2.7 years 11 As at 31 December 2010


13 Healthy Occupancy & Passing Rents Occupancy Continued Resilience in Portfolio Rental Rate (S$) 3QFY10 (1 October 2010 to 31 December 2010) 12

14 Average Retention Rate (%) Strong Tenant Retention Long Staying Tenants High Retention Rate for 3QFY10 >5 to 10 yrs 25.3% >10 yrs 12.6% Up to 1 yr 13.3% >1 to 2 yrs 8.2% 100% 90% 80% 70% 60% 84.1% 75.1% 88.2% 89.0% 80.6% 48.4% >2 to 3 yrs 12.2% 50% 40% 30% 20% >4 to 5 yrs 10.5% >3 to 4 yrs 17.9% As at 31 December % 0% Business Park Flatted Factory Stack-Up / Ramp-Up Based on NLA. Not meaningful for Light Industrial Buildings as no leases were due for renewal NM Light Industrial Warehouse Portfolio 48.4% of the tenants have leased the properties for more than 4 years High tenant retention rate of 80.6% in 3QFY10 13


15 High Quality Tenant Base Over 1,500 tenants. No single tenant contributes >5% to Monthly Gross Rental Income As at 31 December

16 Diversity of Tenant Trade Sector No concentration in any single trade sector 15 As at 31 December 2010
17 Relevance of Singapore in Asia Ranking # 1 # 2 # 3 # 4 # 5 Ease of Doing Business 1 Most Open Economy for International Trade and Investment 2 Most Competitive Economy 3 Best Business Environment 4 Best Economic Dynamism 5 APAC Talent Index 6 Best Country to Work in 3 World s Freest Economy 7 Sources 1. World Bank, Doing Business 2010 Report 2. The Global Enabling Trade Report IMD World Competitiveness Yearbook EIU Country Forecasts Newsweek, The World s Best Countries Heidrick & Struggles and the EIU, Overall Talent Index The Heritage Foundation & Wall Street Journal, 2010 Index of Economic Freedom 8. BERI Report 2010-I City with Best Investment Potential 8 16

18 Favourable Singapore Economic Outlook Manufacturing consistently contributes about 25% of Singapore s GDP 1 Manufacturing Info & Comm Business Services Financial Services Wholesale & Retail Trade 2010 Y-o-Y Growth 1 Real GDP: +14.5% Manufacturing: +29.7% Manufacturing sector remains relevant and continues to be the largest contributor to Singapore s GDP Our tenant profile tracks 5 major sectors Manufacturing Information & Communications Business Services Financial Services Wholesale & Retail Trade which together make up approximately two-thirds of Singapore s GDP Favourable Singapore economic outlook driving demand for industrial space Industrial Production Growth 2011F 2012F 2013F 4.0% 5.5% 5.7% Real GDP Growth 4.3% 5.1% 5.1% 1 Real GDP is based on 2005 prices Source: Singapore Department of Statistics / Colliers International Singapore Research, Economist Intelligence Unit (9 August 2010) 17
 Demand and Supply for Business")


19 Positive Outlook for Industrial Property Demand and Supply for Flatted Factories ( F) Demand and Supply for Business Parks ( F) Demand for flatted factories and business parks outstrip supply Forecasted rise in occupancy rates will lend support to rents and values Government initiatives to drive growth in higher value-add industries bodes well for business parks which will experience limited supply in 2011 and 2012 Source: Realis, URA / Colliers International Singapore Research as at 2Q
20 Net New Demand ('000 sq m) Defensible Industrial Property Sector The industrial property sector is the only sector with positive net new demand every year since 2000 Net New Demand for Industrial Sector Dot.com crisis, 911 SARS Global Financial Crisis Industrial Office Retail Source: Realis / URA 19

21 Asset-Led Growth Opportunities Management plans to improve the yield of the Properties by active asset management Property Management Optimisation of tenant mix Providing value-added services, e.g. amenities, transportation services 1003 & 3752 Bukit Merah Central The Synergy Lease Management Pro-active marketing & renegotiation of leases Tenant relationship management Built-in rental escalation Asset Management Strategy Asset Enhancement Conversion of common space to increase NLA Enhancement of infrastructure for e-business space 20


22 Opportunities for Acquisition & Development Acquisition Potential Multi-User, Single-User Factories and Business Parks Market Share 1 Development Strategy Built-to-Suit ( BTS ) projects Development of empty land plots Development of under-utilised plot ratios Capacity for up to S$219.3 million of development activities 2 Example of BTS Tata Communications Exchange Offers ample acquisition growth opportunities for MIT 1 Asset Investment Criteria Positive impact on Distributions 4 2 Location 5 3 Asset Enhancement Potential Tenant Composition & Lease Expiry Profile Building & Facilities Specifications 6 Land Lease Maturity 1 Based on NLA as at 2Q Based on 10% development limit of MIT s deposited property (as at 31 Dec 2010) Source: Realis, URA / Colliers International Singapore Research 21


23 Asset Enhancement Initiative Conversion of Redhill 2 Flatted Factory space (7 th Floor) into e-business space Project Status Expected Cost Expected Completion Date Under Construction S$2.86 million 4QFY10 Proposed Reception area Proposed Lift Lobby 22 As at 31 December 2010
 1 of office, logistics, industrial, residential and retail/lifestyle properties Extensive regional network in Singapore, China, Hong Kong, India, Japan, Malaysia, South Korea and Vietnam")
24 Proven Management & Committed Sponsor Benefits to MIT 1 Leverage on Sponsor s network Leading Asia-focused real estate and capital management company Owns and manages S$12.9 billion (US$10.2 billion) 1 of office, logistics, industrial, residential and retail/lifestyle properties Extensive regional network in Singapore, China, Hong Kong, India, Japan, Malaysia, South Korea and Vietnam Business model: Incubate, develop and rejuvenate real estate assets Unlock asset value through origination of REITs and private real estate funds Leverage on Mapletree s financial strength, market reach and network 2 Alignment of Sponsor s interest with Unitholders Committed Sponsor s stake of 31% in MIT 3 Development capabilities Able to support growth of MIT by developing and warehousing assets to offer to MIT 4 Right of First Refusal to MIT Sponsor has granted right of first refusal to MIT over future sale or acquisition of industrial or business park properties 2 Proven management track record Acquired and managed portfolio from JTC since 1 July 2008 and grew revenue through the financial crisis Sourced for, developed and managed portfolio under Mapletree Industrial Fund 1 Based on exchange rate of S$/US$ = (Source: Bloomberg on 4 Mar 2011) 2 Excluding Mapletree Business City and Comtech 23
25 24 Financial Highlights

26 REIT Level Financials REIT Mgmt Fee Property Mgmt Fee Base: 0.5% of Deposited Property Performance: 3.6% of NPI 100% paid in cash Property Mgmt: 2.0% of Gross Revenue Lease Mgmt: 1.0% of Gross Revenue 100% paid in cash Distributable Income, DPU and DPU Yield Annualised DPU Yield: 6.59% 2 DPU : 7.46 cents DPU : 3.10cents1 DPU Yield: 7.04%3 Trustee Fee 1 st S$1bn: 0.02% of Deposited Property 2 nd S$1bn: 0.015% of Deposited Property Thereafter: 0.010% of Deposited Property Distribution Payout 100% of distributable income for period from Listing to 31 March For the period from Listing Date of 21 October 2010 to 31 March 2011 (Source: MIT Prospectus) 2 Based on MIT s price on 4 Mar 2011 of $1.06 and the annualised forecast DPU for the period from Listing Date to 31 March 2011, together with accompanying assumptions in the Prospectus 3 Based on MIT s price on 4 Mar 2011 of $1.06 and the annualised forecast DPU for the full financial year from 1 April 2011 to 31 March 2012, together with accompanying assumptions in the Prospectus
 % of Debt Hedged 67.9% NIL NIL 25% 30% 30% 15% Estimated Average Interest Costs Additional Debt Headroom 2.")
27 Gross Debt (S$ m) Capital Structure Debt Maturity Profile Borrowing Cost Details Total Debt S$837.0 m Aggregate Leverage 38.0% Credit Rating BBB+ (Fitch Ratings) % of Debt Hedged 67.9% NIL NIL 25% 30% 30% 15% Estimated Average Interest Costs Additional Debt Headroom 2.4% per annum S$256m (based on 45% aggregate leverage) 26 As at 31 December 2010
28 27 First Financial Results (21 Oct to 31 Dec 2010)
29 First Financial Results Key Highlights DPU of 1.52 cents for period 21 Oct to 31 Dec 2010 exceeds forecast by 13.4% Higher gross revenue from higher rentals and a one-off rental collection backdated to the start of the lease Lower property expenses due to lower utility cost from energy saving initiatives and tariff, lower maintenance expenses and a one off recovery of bad debts previously written-off Excluding one-off effects, DPU would have been 1.46 cents (exceeding forecast by 9.0%) Healthy average occupancy rate of 92.3% and average passing rent of $1.45 per square foot per month for 3QFY10 Retention rate of 81% in 3QFY10; Rental rates renewed at average of 21.9% above previous rates Proactive leasing : only 2.6% of leases due for renewal in 4QFY10 outstanding 28
30 Actual Versus Prospect Statement Actual 21 Oct 31 Dec 10 (S$ 000) Forecast 1 21 Oct 31 Dec 10 (S$ 000) Increase / (Decrease) % Gross revenue 41,509 39, % Property operating expenses (11,916) (12,392) (3.8%) Net Property Income 29,593 27, % Interest on borrowings (3,955) (4,107) (3.3%) Non property trust expenses (3,767) (3,827) (1.6%) Net income before tax & distribution 21,871 19, % Net non-tax deductible items % Adjusted taxable income available for distribution to unitholders 22,282 19, % Distribution per Unit (cents) % Footnote: 1 The Forecast figures formed part of the Forecast Year 2010/2011 figures disclosed in the Prospectus dated 12 October 2010 (the Prospectus ). 29
31 Healthy Balance Sheet Actual 31 Dec 10 (S$ 000) Total Assets 2,193,171 Total Liabilities 917,747 Net Assets Attributable to Unitholders 1,275,424 Net Asset Value per Unit (S$)
32 MIT Price (S$) Price Performance of MIT Average Daily Trading Volume of 6.3 million units 1 Price Market Capitalization (S$) (US$) 2 (S$) (US$) 2 IPO billion 1.07 billion 4 Mar billion 1.22 billion 31 1 Excludes first 5 days of trading (IPO effect) 2 Based on exchange rate of S$/US$ = (4 Mar 2011) Source: Bloomberg (4 Mar 2011)
33 32 Conclusion
34 Stable Portfolio with Growth Potential Strong Embedded Organic Growth Potential Healthy Occupancy Rates and Passing Rents Large, Diversified and Resilient Portfolio with Market Presence > 1,500 tenants, largest one contributes less than 5% of Revenue Strong Market Fundamentals Singapore Economic Growth in 2011 : +4% to +6% Potential Growth Opportunity from Active Asset Mgt and Acquisitions Conversion of conventional flatted factory space to e-biz space Experienced Manager and Committed Sponsor Realizing revenue potential and managing expenses 33
35 Contact Us Ms Melissa Tan Senior Manager, Investor Relations DID: Website: Visit our website and sign up for alerts to receive the latest announcements on MIT 34
36 35 Thank You
Investor Presentation. May 2013
 Investor Presentation May 2013 DISCLAIMER This presentation is for information only and does not constitute an offer or solicitation of an offer to subscribe for, acquire, purchase, dispose of or sell
Investor Presentation March 2016
 Investor Presentation March 2016 Important Notice This presentation shall be read in conjunction with Mapletree Industrial Trust s ( MIT ) financial results for Third Quarter Financial Year 2015/2016 in
Investor Presentation November 2015
 Investor Presentation November 2015 Important Notice This presentation shall be read in conjunction with Mapletree Industrial Trust s ( MIT ) financial results for Second Quarter Financial Year 2015/2016
Investor Presentation August 2017
 Investor Presentation August 2017 Important Notice This presentation shall be read in conjunction with Mapletree Industrial Trust s ( MIT ) financial results for First Quarter Financial Year 2017/2018
Mapletree Industrial Trust Achieves Distribution Per Unit of 2.05 Cents for 2QFY2011 at 10.8% above Forecast 1
 PRESS RELEASE Mapletree Industrial Trust Achieves Distribution Per Unit of 2.05 Cents for 2QFY2011 at 10.8% above Forecast 1 Distribution per Unit ( DPU ) of 2.05 cents, higher than IPO Forecast ( Forecast
Mapletree Industrial Trust Delivers 9.0% Year-on-Year Growth for 1QFY13/14 Distributable Income
 (Constituted in Republic of Singapore pursuant to a Trust Deed dated 29 January 2008 (as amended)) PRESS RELEASE Mapletree Industrial Trust Delivers 9.0% Year-on-Year Growth for 1QFY13/14 Distributable
Mapletree Industrial Trust Achieves Distributable Income of S$35.8 million for 4QFY11/12
 (Constituted in Republic of Singapore pursuant to a Trust Deed dated 29 January 2008 (as amended)) PRESS RELEASE Mapletree Industrial Trust Achieves Distributable Income of S$35.8 million for 4QFY11/12
Mapletree Industrial Trust Achieves 12.0% Year-on-Year Increase in Distributable Income for 3QFY13/14
 (Constituted in Republic of Singapore pursuant to a Trust Deed dated 29 January 2008 (as amended)) PRESS RELEASE Mapletree Industrial Trust Achieves 12.0% Year-on-Year Increase in Distributable Income
Investor Presentation May 2018
 Investor Presentation May 2018 14 May 2018 Important Notice This presentation shall be read in conjunction with Mapletree Industrial Trust s ( MIT ) financial results for Fourth Quarter Financial Year
Mapletree Industrial Trust s 2QFY13/14 Distributable Income Increased 9.7% Year-on-Year to S$41.1 million
 (Constituted in Republic of Singapore pursuant to a Trust Deed dated 29 January 2008 (as amended)) PRESS RELEASE Mapletree Industrial Trust s 2QFY13/14 Distributable Income Increased 9.7% Year-on-Year
Mapletree Industrial Trust s 3QFY17/18 Distributable Income Grows 4.6% Year-on-Year
 (Constituted in the Republic of Singapore pursuant to a Trust Deed dated 29 January 2008 (as amended)) PRESS RELEASE Mapletree Industrial Trust s 3QFY17/18 Distributable Income Grows 4.6% Year-on-Year
Notice of Annual General Meeting
 7 th Annual General Meeting 18 July 2017 Important Notice This presentation shall be read in conjunction with Mapletree Industrial Trust s ( MIT ) financial statements for the financial year ended 31 March
(Constituted in the Republic of Singapore pursuant to a Trust Deed dated 29 January 2008 (as amended))
)") (Constituted in the Republic of Singapore pursuant to a Trust Deed dated 29 January 2008 (as amended)) ANNOUNCEMENT VALUATION OF MAPLETREE INDUSTRIAL TRUST S PROPERTIES 23 April 2018 In compliance with
(Constituted in the Republic of Singapore pursuant to a Trust Deed dated 29 January 2008 (as amended)) ANNOUNCEMENT VALUATION OF MAPLETREE INDUSTRIAL TRUST S PROPERTIES 23 April 2018 In compliance with
Financial Statements. contents. Important Note All currencies are denoted in Singapore Dollar.
 Financial Statements Important Note All currencies are denoted in Dollar. contents 98 Report of the Trustee 99 Statement by the Manager 100 Independent Auditor s Report 101 Statements of Total Return 102
FOCUS SUSTAINABILITY GROWTH
 FINANCIAL STATEMENTS Report of the Trustee 126 Statement by the Manager 127 Independent Auditor s Report 128 Statements of Total Return 132 Statements of Financial Position 133 Distribution Statements
27 January ARA-CWT Trust Management (Cache) Limited
 Limited") 4Q 2010 Financial Results 27 January 2011 ARA-CWT Trust Management (Cache) Limited Agenda 4Q 2010 Financial Results Portfolio Update Going Forward 2 Highlights 4Q 2010 Results Net Property Income of S$14.4m
4Q 2010 Financial Results 27 January 2011 ARA-CWT Trust Management (Cache) Limited Agenda 4Q 2010 Financial Results Portfolio Update Going Forward 2 Highlights 4Q 2010 Results Net Property Income of S$14.4m
FINANCIAL STATEMENTS CONTENTS 97.
 STRATEGIC DIRECTION PEOPLE PORTFOLIO GOVERNANCE AND ADDITIONAL INFORMATION 97. FINANCIAL STATEMENTS CONTENTS Report of the Trustee 98 Statement by the Manager 99 Independent Auditor s Report 100 Statements
Investor Presentation for Citi ASEAN Investor Conference. 12 June 2014
 Investor Presentation for Citi ASEAN Investor Conference 2 June 204 Important Notice Standard Chartered Securities (Singapore) Pte. Limited, CIMB Bank Berhad, Singapore Branch and Oversea-Chinese Banking
26 April ARA-CWT Trust Management (Cache) Limited
 Limited") 1Q 2011 Financial Results 26 April 2011 ARA-CWT Trust Management (Cache) Limited Agenda 1Q 2011 Financial i Results Portfolio Update Going Forward 2 Highlights 1Q 2011 Results Property Income slightly
1Q 2011 Financial Results 26 April 2011 ARA-CWT Trust Management (Cache) Limited Agenda 1Q 2011 Financial i Results Portfolio Update Going Forward 2 Highlights 1Q 2011 Results Property Income slightly
FY2012 Financial Results Presentation
 FY2012 Financial Results Presentation 21 January 2013 Knowing. Believing. Delivering ARA-CWT Trust Management (Cache) Limited Agenda Overview & FY12 Key Highlights 4QFY12 & FY12 Full Year Financial Performance
Investor Presentation
 Investor Presentation 15 September 2011 Knowing. Believing. Delivering ARA-CWT Trust Management (Cache) Limited Agenda REIT Overview Management Strategy 2Q 2011 Financial Results Portfolio Update Going
4QFY2013 and 2HFY2013 Results Presentation. January 2014
 4QFY2013 and 2HFY2013 Results Presentation January 2014 1 Disclaimer This presentation should be read in conjunction with the financial statements of Soilbuild Business Space REIT for the period from 1
Mapletree Industrial Trust s 2QFY17/18 Distribution per Unit Increases 6.0% Year-on-Year
 NOT FOR DISTRIBUTION IN OR INTO THE UNITED STATES, EUROPEAN ECONOMIC AREA, CANADA, JAPAN OR AUSTRALIA (Constituted in the Republic of Singapore pursuant to a Trust Deed dated 29 January 2008 (as amended))
Cache Logistics Trust launches IPO
 ARA-CWT Trust Management (Cache) Limited (as manager of Cache Logistics Trust) 6 Temasek Boulevard #16-02 Suntec Tower Four Singapore 038986 Tel: (65) 6835 9232 Fax: (65) 6835 9672 www.cache-reit.com PRESS
Macquarie ASEAN Conference. 26 Aug 2014
 Macquarie ASEAN Conference 26 Aug 2014 Important Notice Standard Chartered Securities (Singapore) Pte. Limited, CIMB Bank Berhad, Singapore Branch and Oversea-Chinese Banking Corporation Limited were the
Viva Industrial Trust 4Q2017 & FY2017 Results Presentation. 26 January 2018
 Viva Industrial Trust 4Q2017 & FY2017 Results Presentation 26 January 2018 1 Important Notice This presentation is for information purposes only and does not constitute or form part of an offer, invitation
(Constituted in the Republic of Singapore pursuant to a Trust Deed dated 29 January 2008 (as amended))
)") (Constituted in the Republic of Singapore pursuant to a Trust Deed dated 29 January 2008 (as amended)) MAPLETREE INDUSTRIAL TRUST FINANCIAL STATEMENT AND DISTRIBUTION TABLE OF CONTENTS Item No. Description
(Constituted in the Republic of Singapore pursuant to a Trust Deed dated 29 January 2008 (as amended)) MAPLETREE INDUSTRIAL TRUST FINANCIAL STATEMENT AND DISTRIBUTION TABLE OF CONTENTS Item No. Description
Sabana Shari ah Compliant Industrial REIT 3Q 2018 Financial Results Presentation. 26 October 2018
 Sabana Shari ah Compliant Industrial REIT 3Q 2018 Financial Results Presentation 26 October 2018 Important Notice Disclaimer This presentation shall be read in conjunction with the financial information
Financial Results for the Quarter / Year Ended 31 Mar April 2012
 Financial Results for the Quarter / Year Ended 31 Mar 2012 19 April 2012 Disclaimer This Presentation is focused on comparing results for the three months ended 31 Mar 2012 versus results achieved in the
OSK DMG ASEAN & Hong Kong Corporate Day June 2012
 OSK DMG ASEAN & Hong Kong Corporate Day 26-28 June 2012 2 Important Notice This material shall be read in conjunction with CIT s financial statements for the financial period ended 31 March 2012. The value
PROPOSED ACQUISITION OF A 50% INTEREST IN 11 LOGISTICS PROPERTIES IN CHINA
 For Immediate Release PROPOSED ACQUISITION OF A 50% INTEREST IN 11 LOGISTICS PROPERTIES IN CHINA Strategic opportunity to extend MLT s presence in China, an attractive logistics market Addition of 11 new,
1Q FY2013 Financial Results Presentation
 1Q FY2013 Financial Results Presentation 24 April 2013 Knowing. Believing. Delivering ARA-CWT Trust Management (Cache) Limited Agenda Key Highlights Financial Performance Capital Management Asset Management
Introduction to Cache Logistics Trust
 Introduction to Cache Logistics Trust 30 May 2013 Tampines Regional Library Knowing. Believing. Delivering ARA-CWT Trust Management (Cache) Limited Agenda About Cache Logistics Trust 1QFY2013 Financial
AIMS AMP CAPITAL INDUSTRIAL REIT
 AIMS AMP CAPITAL INDUSTRIAL REIT 3 rd Quarter Ended 31 December 2011 Results Presentation 20 January 2012 Important Notice Disclaimer This Presentation is focused on comparing actual results for the financial
Financial Results for 4 th Quarter 2017 and Year Ended 31 December 2017
 Financial Results for 4 th Quarter 2017 and Year Ended 31 December 2017 31 January 2018 Important Notice This presentation shall be read in conjunction with OUE Commercial REIT s Financial Results announcement
MAPLETREE LOGISTICS TRUST S 4Q FY17/18 DISTRIBUTION PER UNIT RISES 4% TO CENTS
 For Immediate Release MAPLETREE LOGISTICS TRUST S 4Q FY17/18 DISTRIBUTION PER UNIT RISES 4% TO 1.937 CENTS Highlights: 4Q FY17/18 amount distributable to Unitholders grew 27% year-on-year to S$59.2 million
Cache Logistics Trust 2011 Annual General Meeting
 Cache Logistics Trust 2011 Annual General Meeting 18 April 2012 Knowing. Believing. Delivering ARA-CWT Trust Management (Cache) Limited Agenda REIT Overview FY2011 Performance Portfolio Going Forward 2
MAPLETREE LOGISTICS TRUST S 1Q FY14/15 DISTRIBUTION PER UNIT RISES 6% to 1.90 CENTS
 For Immediate Release MAPLETREE LOGISTICS TRUST S 1Q FY14/15 DISTRIBUTION PER UNIT RISES 6% to 1.90 CENTS Highlights: 6% year-on-year growth in amount distributable to Unitholders to S$46.6 million Recent
Viva Industrial Trust
 Viva Industrial Trust Financial Results for the Period from 4 November 2013 to 31 December 2013 25 February 2014 Important Notice This presentation is for information purposes only and does not constitute
MAPLETREE LOGISTICS TRUST S QUARTERLY DISTRIBUTION PER UNIT RISES 10% YEAR-ON-YEAR
 For Immediate Release MAPLETREE LOGISTICS TRUST S QUARTERLY DISTRIBUTION PER UNIT RISES 10% YEAR-ON-YEAR Highlights: Distribution Per Unit ( DPU ) of 1.70 cents for the 3 months ended 31 March 2012 Portfolio
AIMS AMP CAPITAL INDUSTRIAL REIT
 AIMS AMP CAPITAL INDUSTRIAL REIT FY2013: 2 nd Quarter Ended 30 September 2012 Results Presentation 24 October 2012 Important Notice Disclaimer This Presentation is focused on comparing actual results for
Citi-REITAS-SGX C-Suite Singapore REITs and Sponsors Forum
 Citi-REITAS-SGX C-Suite Singapore REITs and Sponsors Forum 23 August 2018 Important Notice This presentation shall be read in conjunction with OUE Commercial REIT s Financial Results announcement for 2Q
Financial Results Presentation 3Q2017
 Financial Results Presentation 3Q2017 Contents A 3Q2017 Results B C Financial Performance Prudent Capital Management D Real Estate Highlights E Market Outlook F Appendix 2 3Q2017 Results 3Q2017 At A Glance
SGX - DBS Vickers - REITAS SREITS Corporate Day Investor Presentation
 SGX - DBS Vickers - REITAS SREITS Corporate Day Investor Presentation 27 Feb 1 Mar 2018 Important Notice This presentation shall be read in conjunction with OUE Commercial REIT s Financial Results announcement
SABANA SHARI AH COMPLIANT INDUSTRIAL REIT
 SABANA SHARI AH COMPLIANT INDUSTRIAL REIT 3Q 2017: Third Quarter Ended 30 September 2017 Financial Results Presentation 23 October 2017 Important Notice Disclaimer This presentation shall be read in conjunction
Proposed Merger with Viva Industrial Trust. 29 January 2018
 Proposed Merger with Viva Industrial Trust 29 January 2018 1 Important Notice This material shall be read in conjunction with ESR-REIT s results announcements for the financial period ended 31 December
Hong Kong Non-Deal Roadshow Hong Kong, 4 March International Business Park
 Hong Kong Non-Deal Roadshow Hong Kong, 4 March 2016 16 International Business Park 2 Content CIT FY2015 Results Executive Summary Financial Summary Real Estate Highlights Financial & Capital Management
FY2015 Financial Results Presentation
 FY2015 Financial Results Presentation 14 January 2016 16 International Business Park 2 Content Executive Summary Financial Summary Real Estate Highlights Financial & Capital Management Highlights Appendix
FY2014 Financial Results Presentation
 FY2014 Financial Results Presentation 16 January 2015 16 International Business Park Important Notice This material shall be read in conjunction with CIT s results announcements for the financial period
MAPLETREE LOGISTICS TRUST ENHANCES PORTFOLIO RETURNS THROUGH ASSET RECYCLING
 For Immediate Release MAPLETREE LOGISTICS TRUST ENHANCES PORTFOLIO RETURNS THROUGH ASSET RECYCLING Acquisition of Hyundai Logistics Centre (South Korea) for KRW 22.5 billion (~ S$24.6 million 1 ) Divestment
MAPLETREE LOGISTICS TRUST S 3Q FY13/14 DISTRIBUTION PER UNIT RISES 7% YEAR-ON-YEAR
 For Immediate Release MAPLETREE LOGISTICS TRUST S 3Q FY13/14 DISTRIBUTION PER UNIT RISES 7% YEAR-ON-YEAR Highlights: Amount Distributable to Unitholders registered 8% year-on-year growth Results underpinned
Financial Results for 3 rd Quarter November 2017
 Financial Results for 3 rd Quarter 2017 2 November 2017 Important Notice This presentation shall be read in conjunction with OUE Commercial REIT s Financial Results announcement for 3Q 2017 dated 2 November
3Q 2012 Presentation Slides. 1 Nov 2012
 3Q 2012 Presentation Slides 1 Nov 2012 2 Important Notice This material shall be read in conjunction with CIT s financial statements for the financial period ended 30 Sep 2012. The value of units in CIT
3Q2016 Financial Results Presentation 26 October Pioneer Crescent
 3Q2016 Financial Results Presentation 26 October 2016 25 Pioneer Crescent Content Executive Summary Real Estate Highlights Financial & Capital Management Highlights Appendix 2 3Q2016 Executive Summary
Financial Results for the Quarter Ended 31 Dec January 2012
 Financial Results for the Quarter Ended 31 Dec 2011 19 January 2012 Disclaimer This Presentation is focused on comparing results for the three months ended 31 Dec 2011 versus results achieved in the three
REITs Symposium May 2018
 REITs Symposium 2018 19 May 2018 Important Notice This presentation shall be read in conjunction with OUE Commercial REIT s Financial Results announcement for 1Q 2018 dated 10 May 2018. This presentation
Viva Industrial Trust 2Q2018 Results Presentation. 13 August 2018
 Viva Industrial Trust 2Q2018 Results Presentation 13 August 2018 1 Important Notice This presentation is for information purposes only and does not constitute or form part of an offer, invitation or solicitation
2Q2014 Financial Results 24 July Creating Value & Delivering Growth
 2Q2014 Financial Results 24 July 2014 1 Creating Value & Delivering Growth Important Notice This material shall be read in conjunction with CIT s financial statements for the financial period ended 30
Mapletree Logistics Trust To Acquire Remaining 38% of Hong Kong Property, Shatin No. 3, for HKD610 Million
 For Immediate Release Mapletree Logistics Trust To Acquire Remaining 38% of Hong Kong Property, Shatin No. 3, for HKD60 Million Singapore, 5 January 208 Mapletree Logistics Trust Management Ltd., as manager
MAPLETREE LOGISTICS TRUST EXPANDS PRESENCE IN SYDNEY, AUSTRALIA WITH A$85 MILLION ACQUISITION
 For Immediate Release MAPLETREE LOGISTICS TRUST EXPANDS PRESENCE IN SYDNEY, AUSTRALIA WITH A$85 MILLION ACQUISITION Singapore, 29 May 2016 Mapletree Logistics Trust Management Ltd., as manager (the Manager
MAPLETREE LOGISTICS TRUST DELIVERS 1.71 CENTS DISTRIBUTION PER UNIT FOR 2Q FY12/13
 For Immediate Release MAPLETREE LOGISTICS TRUST DELIVERS 1.71 CENTS DISTRIBUTION PER UNIT FOR 2Q FY12/13 Highlights: Amount distributable to Unitholders of S$41.4 million 99.2% occupancy rate, positive
Presentation for REITs Symposium 2017
 Presentation for REITs Symposium 2017 27 May 2017 Important Notice This presentation shall be read in conjunction with OUE Commercial REIT s Financial Results announcement for 1Q 2017 dated 5 May 2017.
Financial Results for 4 th Quarter and Year Ended 31 December January 2019
 Financial Results for 4 th Quarter and Year Ended 31 December 2018 30 January 2019 Important Notice This presentation should be read in conjunction with the announcements released by OUE Commercial REIT
Investor Presentation for Tokyo Non-Deal Roadshow. 25 August 2016
 Investor Presentation for Tokyo Non-Deal Roadshow 25 August 2016 Important Notice This presentation shall be read in conjunction with OUE Commercial REIT s Financial Results announcement for 1Q 2016 dated
MAPLETREE LOGISTICS TRUST S 1Q FY17/18 DPU RISES 2% YEAR-ON-YEAR TO CENTS
 For Immediate Release MAPLETREE LOGISTICS TRUST S 1Q FY17/18 DPU RISES 2% YEAR-ON-YEAR TO 1.887 CENTS Highlights: Amount distributable to Unitholders grew 2.5% year-on-year to S$47.2 million Stable operations
AIMS AMP CAPITAL INDUSTRIAL REIT
 AIMS AMP CAPITAL INDUSTRIAL REIT FY2014: Third Quarter ended 31 December 2013 Results Presentation 29 January 2014 Important notice Disclaimer This Presentation is focused on comparing actual results for
DBS Pulse of Asia Conference. 5 January 2015
 DBS Pulse of Asia Conference 5 January 2015 Disclaimer This presentation should be read in conjunction with the financial statements of Soilbuild Business Space REIT ( Soilbuild REIT ) for the period from
Mapletree Commercial Trust s 3Q FY18/19 Net Property Income Grew 2.2% Year-on-Year Distribution Per Unit Up 1.3% to 2.
 For Immediate Release Mapletree Commercial Trust s 3Q FY18/19 Net Property Income Grew 2.2% Year-on-Year Distribution Per Unit Up 1.3% to 2.33 Singapore Cents Gross revenue and net property income ( NPI
MAPLETREE LOGISTICS TRUST ACQUIRES MAPLETREE WUXI LOGISTICS PARK FROM SPONSOR AND UPDATES ON DIVESTMENT OF 30 WOODLANDS LOOP
 For Immediate Release MAPLETREE LOGISTICS TRUST ACQUIRES MAPLETREE WUXI LOGISTICS PARK FROM SPONSOR AND UPDATES ON DIVESTMENT OF 30 WOODLANDS LOOP Singapore, 19 November 2012 Mapletree Logistics Trust
MAPLETREE LOGISTICS TRUST DELIVERS STEADY PERFORMANCE FOR 1H FY16/17
 For Immediate Release MAPLETREE LOGISTICS TRUST DELIVERS STEADY PERFORMANCE FOR 1H FY16/17 Highlights: Maintained DPU at 1.86 cents for 2Q FY16/17 and 3.71 cents for 1H FY16/17 Stable portfolio occupancy
SABANA SHARI AH COMPLIANT INDUSTRIAL REIT
 SABANA SHARI AH COMPLIANT INDUSTRIAL REIT 1Q 2015: First Quarter Ended 31 March 2015 Financial Results Presentation 20 April 2015 Important Notice Disclaimer This presentation shall be read in conjunction
CLSA Asean Forum Bangkok, March International Business Park
 CLSA Asean Forum Bangkok, March 2016 16 International Business Park 2 Content Overview of CIT CIT FY2015 Financial Results Overview Financial & Capital Management Highlights Real Estate Highlights Singapore
MAPLETREE INDUSTRIAL TRUST UNAUDITED FINANCIAL STATEMENT AND DISTRIBUTION ANNOUNCEMENT FOR THE FINANCIAL PERIOD FROM 1 APRIL 2018 TO 30 JUNE 2018
 (Constituted in the Republic of Singapore pursuant to a Trust Deed dated 29 January 2008 (as amended)) MAPLETREE INDUSTRIAL TRUST UNAUDITED FINANCIAL STATEMENT AND DISTRIBUTION TABLE OF CONTENTS Item No.
1Q FY2009/10 Financial Results Presentation 17 July 2009
 1Q FY2009/10 Financial Results Presentation 17 July 2009 Disclaimers This Presentation is focused on comparing results for the three months ended 30 June 2009 versus actual results year-on-year ( yoy ).
Results for the Third Quarter ended 30 September October 2008
 Results for the Third Quarter ended 30 September 2008 21 October 2008 Disclaimer This Presentation is focused on comparing results for the three months ended 30 September 2008 versus results achieved in
Viva Industrial Trust 3Q2014 Financial Results. 21 October 2014
 Viva Industrial Trust 3Q2014 Financial Results 21 October 2014 Important Notice This presentation is for information purposes only and does not constitute or form part of an offer, invitation or solicitation
(Constituted in the Republic of Singapore pursuant to a Trust Deed dated 29 January 2008 (as amended))
)") (Constituted in the Republic of Singapore pursuant to a Trust Deed dated 29 January 2008 (as amended)) MAPLETREE INDUSTRIAL TRUST UNAUDITED FINANCIAL STATEMENT AND DISTRIBUTION TABLE OF CONTENTS Item No.
(Constituted in the Republic of Singapore pursuant to a Trust Deed dated 29 January 2008 (as amended)) MAPLETREE INDUSTRIAL TRUST UNAUDITED FINANCIAL STATEMENT AND DISTRIBUTION TABLE OF CONTENTS Item No.
Mapletree Commercial Trust s Income Available for Distribution for 2Q FY16/17 grew 25.4% year-on-year to S$53.7 million
 For Immediate Release Mapletree Commercial Trust s Income Available for Distribution for 2Q FY16/17 grew 25.4% year-on-year to S$53.7 million Gross revenue and net property income ( NPI ) for 2Q FY16/17
AIMS AMP CAPITAL INDUSTRIAL REIT
 AIMS AMP CAPITAL INDUSTRIAL REIT FY2016: First Quarter Financial Results Ended 30 June 2015 Results Presentation 29 July 2015 Important notice Disclaimer This Presentation is focused on comparing actual
Unless otherwise stated, all capitalized terms used in this announcement shall have the same meaning as in the Prospectus.
 Cache Logistics Trust Unaudited Financial Statements & Distribution Announcement for the period from 11 February 2010 (date of constitution) to 31 December 2010 INTRODUCTION Cache Logistics Trust ( Cache
Financial Results for 3 rd Quarter 2016
 Financial Results for 3 rd Quarter 2016 1 November 2016 Important Notice This presentation shall be read in conjunction with OUE Commercial REIT s Financial Results announcement for 3Q 2016 dated 1 November
Mapletree Commercial Trust s Distribution Per Unit for YTD FY17/18 Up 6.4% to 6.77 Singapore Cents
 For Immediate Release Mapletree Commercial Trust s Distribution Per Unit for YTD FY17/18 Up 6.4% to 6.77 Singapore Cents Gross revenue and net property income ( NPI ) for 3Q FY17/18 grew 0.8% and 1.9%
Proposed Merger (the Merger ) with Viva Industrial Trust. 18 May 2018
 with Viva Industrial Trust. 18 May 2018") Proposed Merger (the Merger ) with Viva Industrial Trust 18 May 2018 Contents 1 2 3 4 5 6 Transaction Overview Key Benefits of the Merger Approvals Required Indicative Timeline Conclusion Appendix 2 Important
Proposed Merger (the Merger ) with Viva Industrial Trust 18 May 2018 Contents 1 2 3 4 5 6 Transaction Overview Key Benefits of the Merger Approvals Required Indicative Timeline Conclusion Appendix 2 Important
Light Industrial. Unitholders Meeting 28 June 2007
 Business & Science Park Light Industrial Warehouse Retail Facilities Hi-Tech Industrial Logistics and Distribution Unitholders Meeting 28 June 2007 Members of the Panel Mr Lew Syn Pau, Chairman Mr Gregory
Results for the First Quarter ended 31 March April 2008
 Results for the First Quarter ended 31 March 2008 24 April 2008 Disclaimer This Presentation is focused on comparing results for the three months ended 31 March 2008 versus results achieved in the three
Cache Logistics Trust 2013 ANNUAL GENERAL MEETING
 Cache Logistics Trust 2013 ANNUAL GENERAL MEETING 16 April 2014 Enduring. Evolving. Growing. ARA-CWT Trust Management (Cache) Limited Overview Sponsor REIT Manager Property Manager Issue Statistics Substantial
Unaudited Results of Keppel KBS US REIT for the Financial Period since Listing on 9 November 2017 to 31 March 2018
 MEDIA RELEASE Unaudited Results of Keppel KBS US REIT for the Financial Period since Listing on 9 November 2017 to 31 March 2018 17 April 2018 The Directors of Keppel KBS US REIT Management Pte. Ltd.,
Presentation for DBS Pulse of Asia Conference. January 2016
 Presentation for DBS Pulse of Asia Conference January 2016 Important Notice Standard Chartered Securities (Singapore) Pte. Limited, CIMB Bank Berhad, Singapore Branch and Oversea-Chinese Banking Corporation
Citi ASEAN Conference 12 June Tai Seng Street
 Citi ASEAN Conference 12 June 2014 1 16 Tai Seng Street Important Notice This material shall be read in conjunction with CIT s financial statements for the financial period ended 31 Mar 2014. The value
Acquisition of 7000 AMK and the Proposed Equity Fund Raising. 14 December 2017
 Acquisition of 7000 AMK and the Proposed Equity Fund Raising 14 December 2017 Contents A Overview B Benefits of the Acquisition C Funding Structure and Financial Impact D Recent Developments E Conclusion
Results for the Second Quarter ended 30 June July 2008
 Results for the Second Quarter ended 30 June 2008 18 July 2008 Disclaimer This Presentation is focused on comparing results for the three months ended 30 June 2008 versus results achieved in the three
Portfolio Analysis & Review
 As of 31 March 2015, MLT s portfolio comprises 117 logistics properties across seven geographic markets in Asia Singapore, Japan, Hong Kong, South Korea, China, Malaysia and Vietnam. Strategically located
MAPLETREELOG S 1Q 2007 DISTRIBUTABLE INCOME UP 84.2% YEAR-ON-YEAR
 For Immediate Release MAPLETREELOG S 1Q 2007 DISTRIBUTABLE INCOME UP 84.2% YEAR-ON-YEAR Highlights: Distributable income of S$15.3 million for the three months ended 31 March 2007 ( 1Q 2007 ) is 84.2%
SABANA SHARI AH COMPLIANT INDUSTRIAL REIT
 SABANA SHARI AH COMPLIANT INDUSTRIAL REIT 3Q 2016: Third Quarter Ended 30 September 2016 Financial Results Presentation 17 October 2016 Important Notice Disclaimer This presentation shall be read in conjunction
SABANA SHARI AH COMPLIANT INDUSTRIAL REIT
 SABANA SHARI AH COMPLIANT INDUSTRIAL REIT 1Q 2017: First Quarter Ended 31 March 2017 Financial Results Presentation 9 May 2017 Important Notice Disclaimer This presentation shall be read in conjunction
Mapletree Commercial Trust Results Announcement. For the period 27 April 2011 to 30 June 2011
 Mapletree Commercial Trust Results Announcement For the period 27 April 2011 to 30 June 2011 Disclaimer This presentation is for information only and does not constitute an invitation or offer to acquire,
PROPOSED ACQUISITION OF 72 LOYANG WAY, SINGAPORE
 (a real estate investment trust constituted on 13 December 2012 under the laws of the Republic of Singapore) PROPOSED ACQUISITION OF 72 LOYANG WAY, SINGAPORE 508762 1. INTRODUCTION SB REIT Management Pte.
Mapletree Commercial Trust s Distribution Per Unit for 2Q FY17/18 Up 9.3% to 2.24 Singapore Cents
 For Immediate Release Mapletree Commercial Trust s Distribution Per Unit for 2Q FY17/18 Up 9.3% to 2.24 Singapore Cents Gross revenue and net property income ( NPI ) for 2Q FY17/18 grew 21.7% and 23.4%
Cache Logistics Trust Reports Income Available for Distribution of S$16.2 million in 4Q FY18
 CACHE LOGISTICS TRUST (Constituted in the Republic of Singapore pursuant to a Trust Deed dated 11 February 2010 as amended and restated) Press Release Cache Logistics Trust Reports Income Available for