Robert Haddad Ashley Hughes AmirAli Motamedi Masoudieh
|
|
|
- Charlotte O’Neal’
- 5 years ago
- Views:
Transcription


1 Robert Haddad Ashley Hughes AmirAli Motamedi Masoudieh


2 Size and Composition Business and Economic Analysis Financial Analysis Valuation Analysis Recommendation
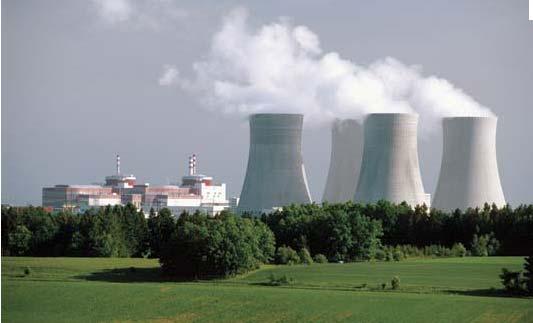
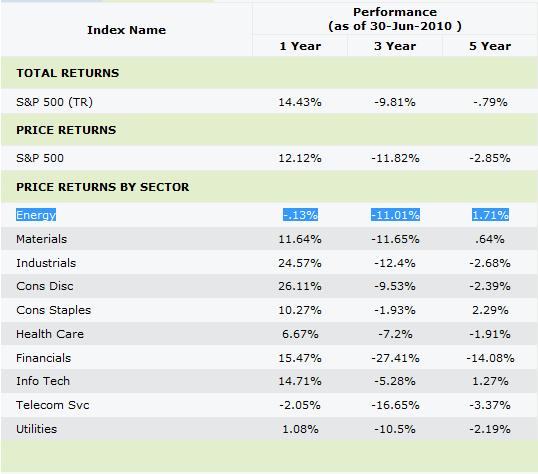
3 Composed of companies involved in the production and supply of energy 166 Energy Sector Stocks with >$1B Mkt Cap (non ADR) 39 Energy Sector Companies in S&P % of the S&P 500 $1.079 Trillion in Market Cap in S&P 500
4 Composed of companies involved in the production and supply of energy 166 Energy Sector Stocks with >$1B Mkt Cap (non ADR) 39 Energy Sector Companies in S&P % of the S&P 500 $1.079 Trillion in Market Cap in S&P 500


5 Telecommunication Services, 3.00% Utilities, 3.76% Materials, 3.44% Information Technology, 18.69% Consumer Discretionary, 10.12% Consumer Staples, 11.53% Energy, 10.69% Energy Sector S&P: 10.69% SIM: 9.07% 1.61% Underweight Industrials, 10.38% Financials, 16.31% Health Care, 12.09%
6 % SIM Under/Overweight S&P 500 As of 6/30/10 Utilities Telecommunication Services Materials Information Technology Industrials Health Care Financials Energy Consumer Staples Consumer Discretionary -5.0% -4.0% -3.0% -2.0% -1.0% 0.0% 1.0% 2.0% 3.0% Currently Underweight in Energy by 1.61%
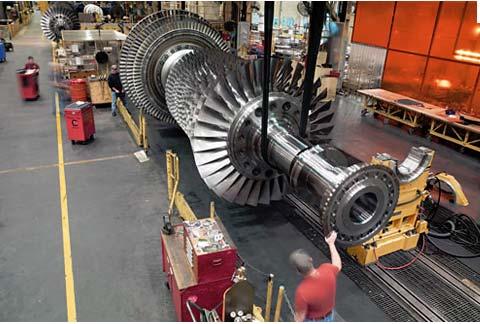
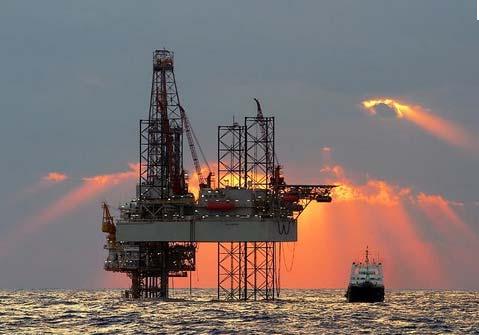
7 SIM Stocks / Our Stocks Oil & Gas Drilling Oil & Gas Equipment & Services Noble Corp. National Oilwell Varco Inc., Cameron Int l, FMC Technologies Integrated Oil & Gas Chevron Oil & Gas Exploration & Production Oil & Gas Refining & Marketing Oil & Gas Storage & Transportation Coal & Consumable Fuels


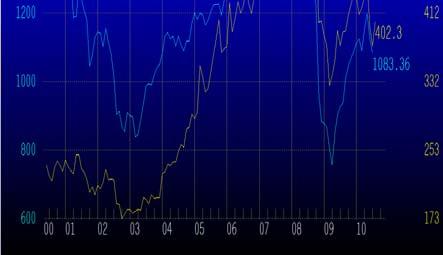
8 Largest Companies Top Performers Company Stock Price Rank Market Cap (billions) Company 1 Yr Price Change Exxon Mobil Pioneer Natural Resources % Chevron Smith International 58.17% ConocoPhillips FMC Technologies 54.11% Schlumberger Sunoco 37.08% Occidental Petroleum EOG Resources 37.01%
9
10


11
12
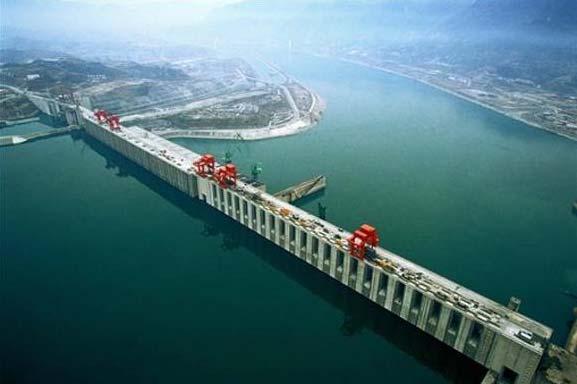
13 Oil Natural Gas Fossil Fuels Coal Electric Power Solar Wind Renewable Hydropower Nuclear Geothermal Bioenergy Fusion Hydrogen
14
15
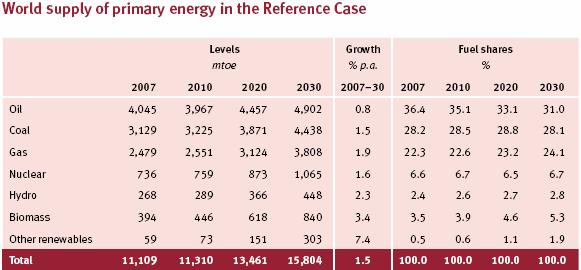
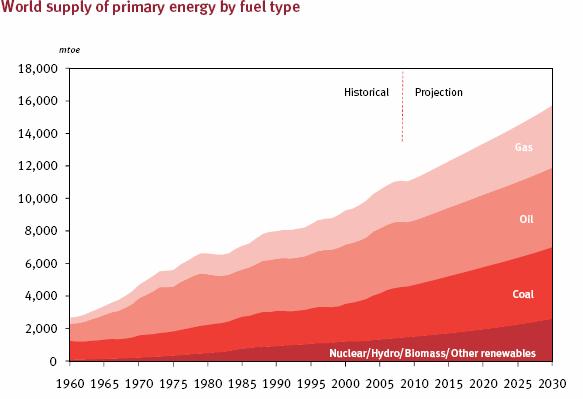
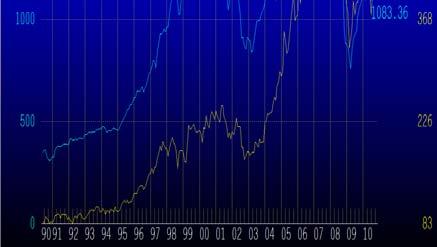
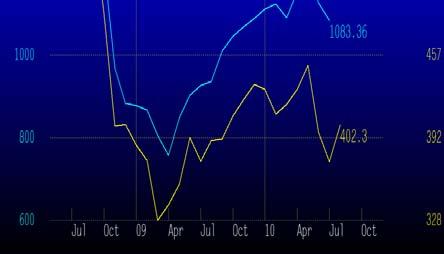
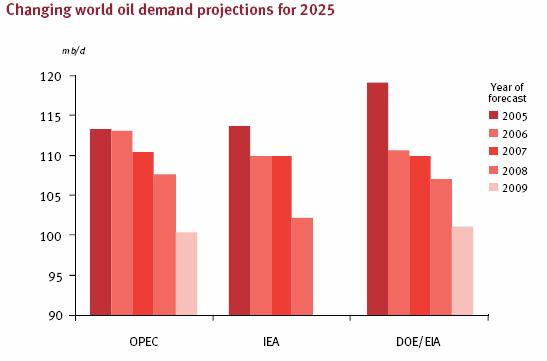
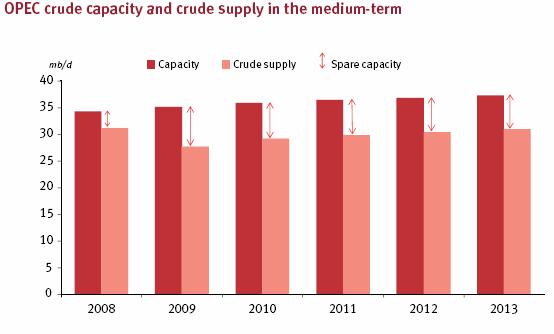
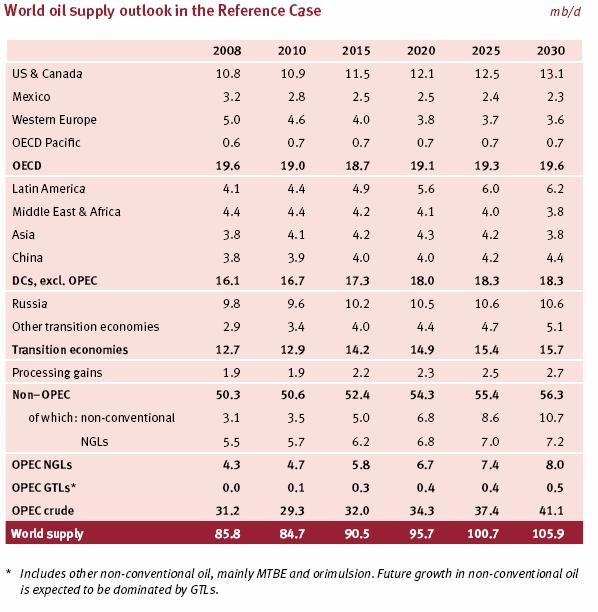
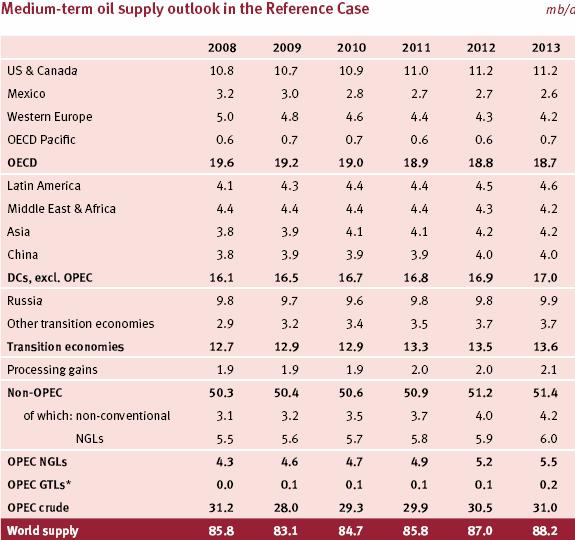
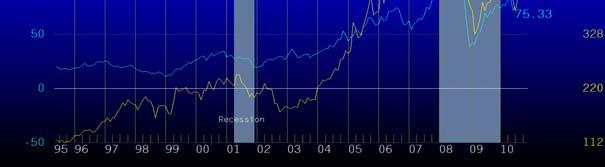
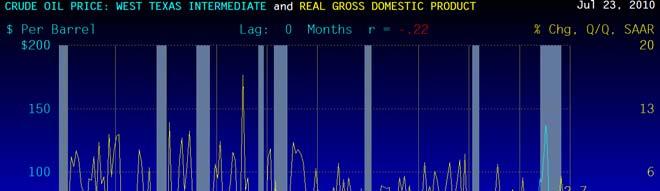
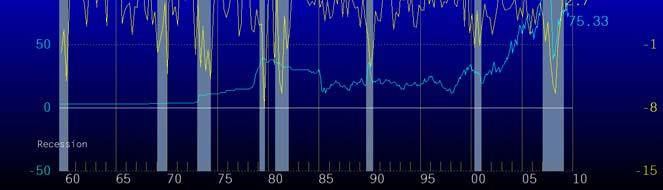
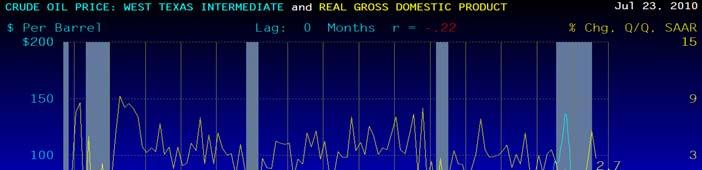
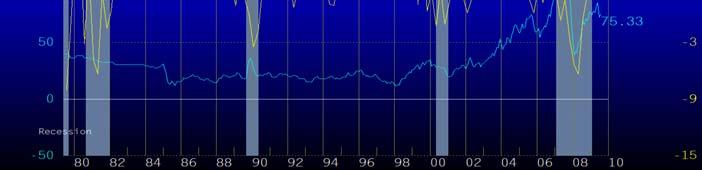
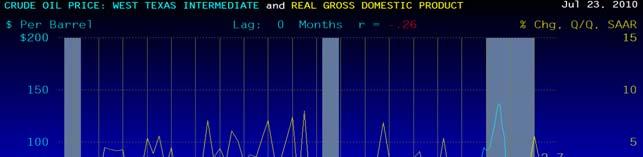
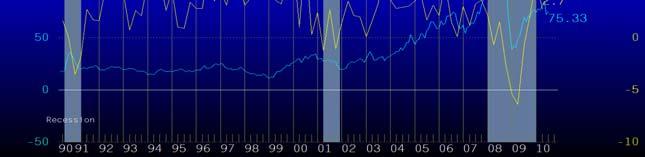
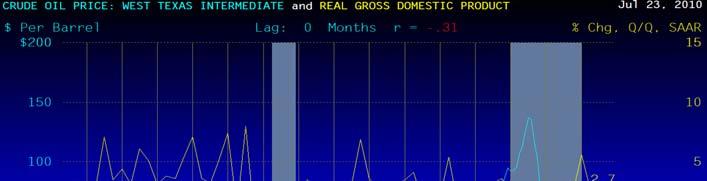
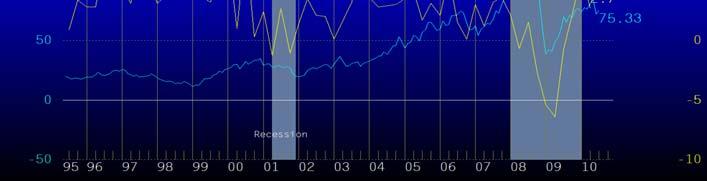
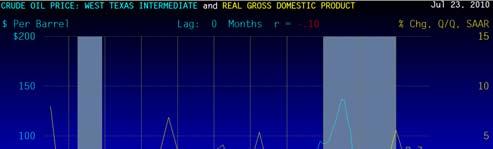
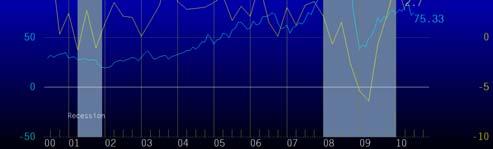
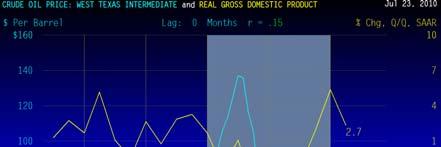
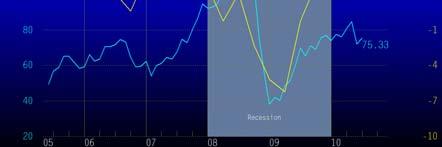
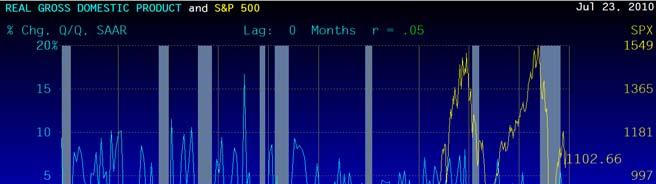
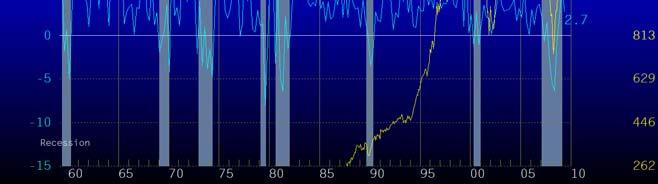
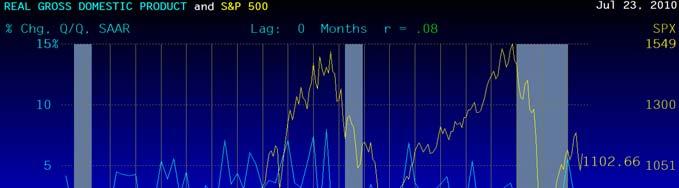
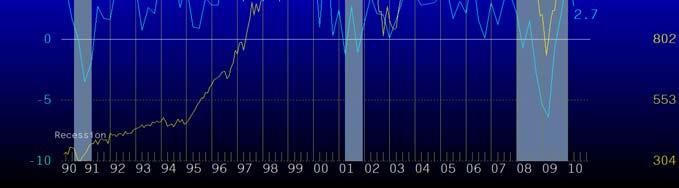
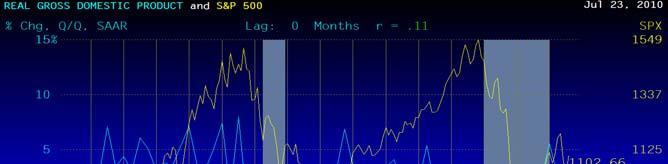
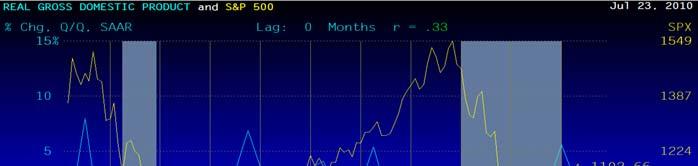
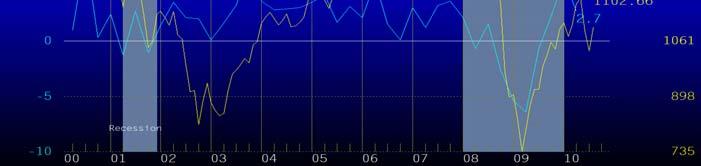
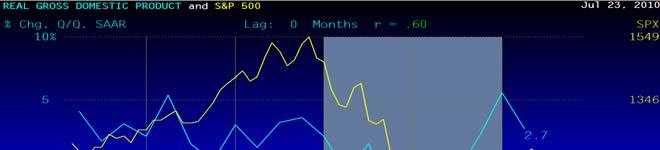
16 Current & Forecasted Oil Production Capacity Current & Forecasted World Oil Demand Current &Forecasted GDP Predominantly From Industrial & Agricultural Output Current & Forecasted Level of World Population and Number of Cars Current Estimates of World Oil Reserves The level of Political, Economical and Social Stability in Oil Producing Countries OPEC Decisions The Current and Projected Level of Investment Requirments Infrastructural Components of The Energy Sector


17 10,000,000 9,000,000 8,000,000 7,000,000 6,000,000 5,000,000 4,000,000 3,000,000 2,000,000 1,000,000 0 Russia Saudi Arabia United States China Iran India Canada Mexico European Union Iraq Norway United Arab Emirates Kuwait Algeria Venezuela Brazil Angola Nigeria United Kingdom Kyrgyzstan Libya Kazakhstan Thailand Azerbaijan Indonesia Oman Qatar Malaysia Egypt Argentina CIA Factbook


18 20,000,000 18,000,000 16,000,000 14,000,000 12,000,000 10,000,000 8,000,000 6,000,000 4,000,000 2,000,000 0 United States European Union China Japan Russia India Germany Brazil Saudi Arabia Canada Korea, South France Mexico United Kingdom Italy Indonesia Spain Iran Netherlands Australia Singapore Taiwan Venezuela Belgium Egypt Thailand Turkey Argentina South Africa Malaysia CIA Factbook


19 300,000,000, ,000,000, ,000,000, ,000,000, ,000,000,000 50,000,000,000 0 Saudi Arabia Canada Iran Iraq Kuwait Venezuela United Arab Emirates Russia Libya Nigeria Kazakhstan Qatar United States China Algeria Angola Mexico Brazil Azerbaijan Sudan Norway India European Union Oman Vietnam Egypt Indonesia Ecuador United Kingdom Yemen

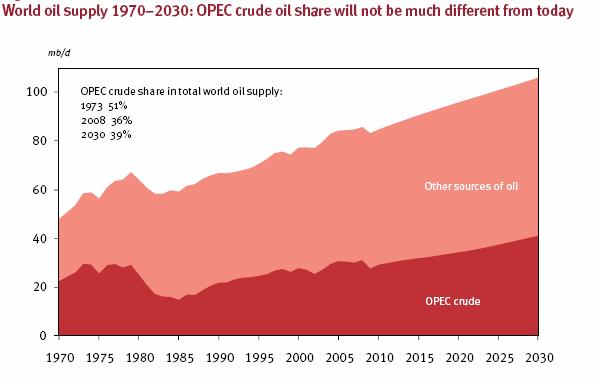
20 OPEC Bulleting

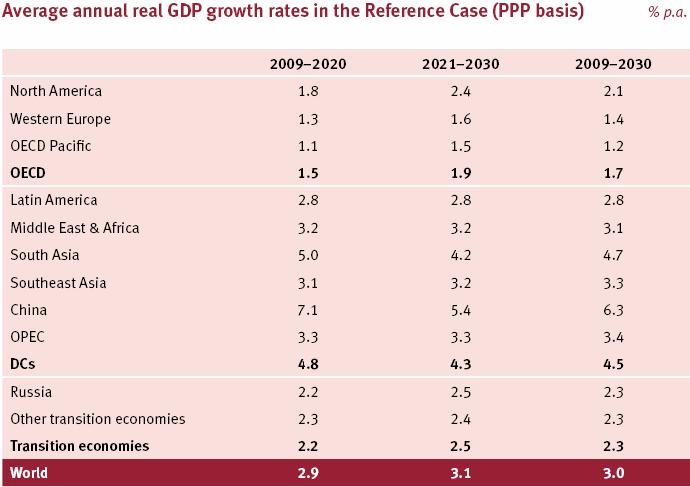
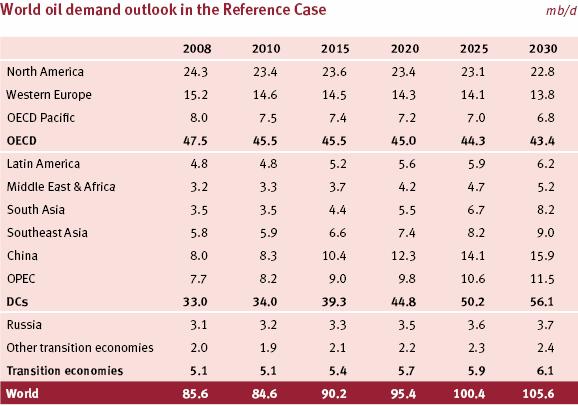
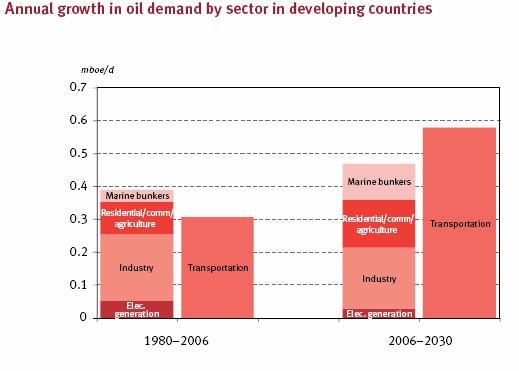
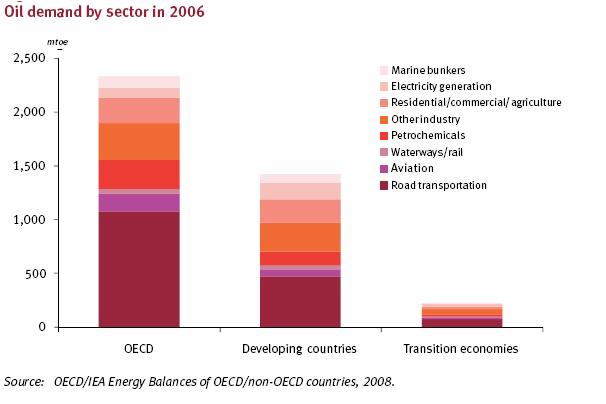
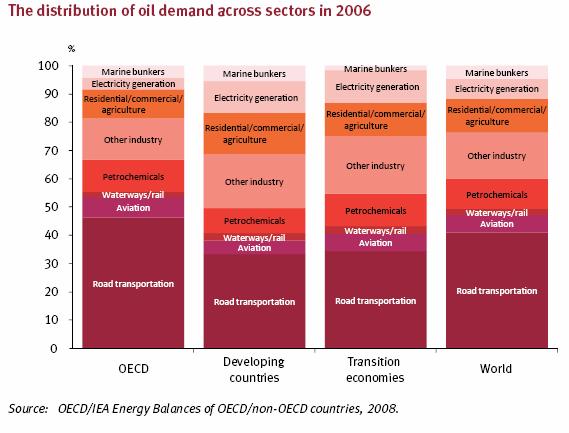
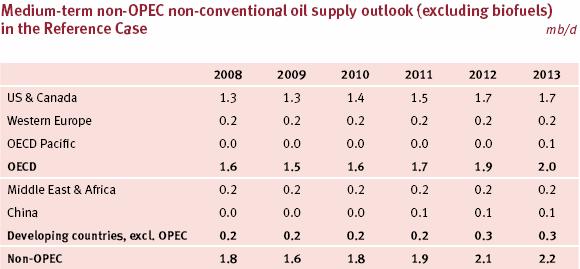
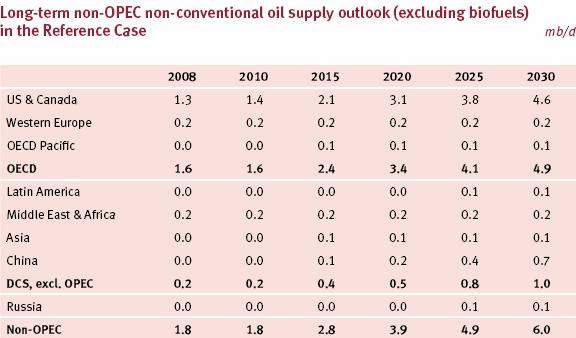
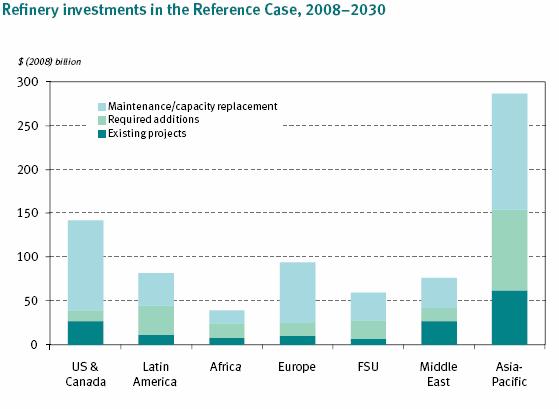
21 2009 World Oil Outlook
22
23 World Oil Outlook 2009

24 World Oil Outlook 2009

25 World Oil Outlook 2009
26
27
28
29
30
31
32
33
34
35
36
37 Threat of Entry(Low): Capital Intensive/ Regulations & Controls/OPEC power/government oversights Threats of Rivalry(Medium): Relatively low among OPEC members/ medium among publically traded or private companies Threats of Substitutes(Low Medium): In large scale currently no substitute in current energy portfolio but more diversification in energy in coming future Threats of Suppliers(Low): viewing suppliers as oil/petroleum equipment providers it is low to medium Threats of Buyers(Low): buyers hold not much power, it is traded in free market

38
39


40

41
42
43
44


45 EPS 200.0% 150.0% 100.0% 50.0% 0.0% 50.0% 100.0% 150.0% 200.0% 50.0% 25.0% 0.0% 25.0% 50.0% Revenue Mean 8.9% Median 11.5% Mean 3.2% Median 2.6% Note : Above mean calculated without outlier (950% on far left)
46
47


48 EPS 450.0% 350.0% 250.0% 150.0% 50.0% 50.0% 90.0% 80.0% 70.0% 60.0% 50.0% 40.0% 30.0% 20.0% 10.0% 0.0% 10.0% 20.0% Revenue Mean 48.4% Median 12.2% Mean 15.9% Median 12.7%


49 80.0% 70.0% 60.0% 50.0% 40.0% 30.0% 20.0% 10.0% 0.0% 10.0% Cons Discr. Cons Stap. Energy Financials Healthcare Industrials Info Tech Telecom Materials Utilities

50 Relative to S&P 500

51
52 Energy Sector Valuation Overvalued by >10% Inline with S&P Undervalued by >10% Absolute Basis High Low Median Current % overvalued / (undervalued) P/Trailing E % P/Forward E % P/B % P/S % P/CF % Relative to SP500 High Low Median Current % overvalued / (undervalued) P/Trailing E % P/Forward E % P/B % P/S % P/CF %
53 Industry Valuations Oil & Gas Equipment/Services Overvalued by >10% Inline with S&P Undervalued by >10% Absolute Basis High Low Median Current % overvalued / (undervalued) P/Trailing E % P/Forward E % P/B % P/S % P/CF % Relative to SP500 High Low Median Current % overvalued / (undervalued) P/Trailing E % P/Forward E % P/B % P/S % P/CF %
54 Industry Valuations Drilling Relative to SP500 High Low Median Current % overvalued / (undervalued) P/Trailing E % P/Forward E % P/B % Overvalued by >10% Inline with S&P Undervalued by >10% P/S % P/CF % Exploration/Production Relative to SP500 High Low Median Current % overvalued / (undervalued) P/Trailing E % P/Forward E % P/B % P/S % P/CF %
55 Industry Valuations Integrated Relative to SP500 High Low Median Current % overvalued / (undervalued) P/Trailing E P/Forward E P/B P/S P/CF % 4.1% 10.0% 16.7% 14.3% Overvalued by >10% Inline with S&P Undervalued by >10% Refining/Marketing Relative to SP500 High Low Median Current % overvalued / (undervalued) P/Trailing E P/Forward E P/B P/S P/CF % 20.0% 50.0% 140.0%
56 Industry Valuations Oil Storage Relative to SP500 High Low Median Current % overvalued / (undervalued) P/Trailing E P/Forward E P/B P/S P/CF Coal Relative to SP % High Low Median Current % overvalued / (undervalued) 9.1% 0.0% 77.8% 0.0% Overvalued by >10% Inline with S&P Undervalued by >10% P/Trailing E % P/Forward E % P/B % P/S % P/CF %
57 Currently underweight by 161 basis points Recommend increasing weight by 211 basis points to bring SIM overweight relative to S&P500 by 50 basis points Demand for energy will increase with economic recovery, further growth in emerging market, expected reduction of energy sector systematic risk, still relatively cheap
58
The construction or provision of oil rigs, drilling. equipment, including seismic data collection.
 The construction or provision of oil rigs, drilling equipment and other energy related service and equipment, including seismic data collection. Engaged in the exploration, production, marketing, refining
Overview. Largest Firms Size of Sector Industries Performance
 ENERGY SECTOR Overview Largest Firms Size of Sector Industries Performance Worldwide Largest Firms Depends on Market Capital Sector Weightings Third Largest Sector by weighting Sector Makeup Main Industries
STATISTICS Last update: 03/07/2017
 STATISTICS 2012-2016 Last update: 03/07/2017 BU NEWS BUSINESS [USD, BILLIONS] New business by year, vs. total world exports 3,000 2,500 2,000 1,500 1,000 500 12,131 1,138 40 127 971 14,023 1,323 53 143
Risks and Opportunities in Global Equities Today BCI Global Investment Conference Tom Mann, CFA Senior Portfolio Manager
 Risks and Opportunities in Global Equities Today BCI Global Investment Conference Tom Mann, CFA Senior Portfolio Manager June 2017 For professional investors only. Not suitable for retail clients 05/06/2017
World Consumer Income and Expenditure Patterns
 World Consumer Income and Expenditure Patterns 2011 www.euromonitor.com iii Summary of Contents Contents Summary of Contents Section 1 Introduction 1 Section 2 Socio-economic parameters 21 Section 3 Annual
EP UNEP/OzL.Pro.WG.1/39/INF/2
 UNITED NATIONS EP UNEP/OzL.Pro.WG.1/39/INF/2 Distr.: General 26 May English only United Nations Environment Programme Open-ended Working Group of the Parties to the Montreal Protocol on Substances that
Argentina Bahamas Barbados Bermuda Bolivia Brazil British Virgin Islands Canada Cayman Islands Chile
 Americas Argentina (Banking and finance; Capital markets: Debt; Capital markets: Equity; M&A; Project Bahamas (Financial and corporate) Barbados (Financial and corporate) Bermuda (Financial and corporate)
EQUITY REPORTING & WITHHOLDING. Updated May 2016
 EQUITY REPORTING & WITHHOLDING Updated May 2016 When you exercise stock options or have RSUs lapse, there may be tax implications in any country in which you worked for P&G during the period from the
Double Tax Treaties. Necessity of Declaration on Tax Beneficial Ownership In case of capital gains tax. DTA Country Withholding Tax Rates (%)
") Double Tax Treaties DTA Country Withholding Tax Rates (%) Albania 0 0 5/10 1 No No No Armenia 5/10 9 0 5/10 1 Yes 2 No Yes Australia 10 0 15 No No No Austria 0 0 10 No No No Azerbaijan 8 0 8 Yes No Yes
Double Tax Treaties DTA Country Withholding Tax Rates (%) Albania 0 0 5/10 1 No No No Armenia 5/10 9 0 5/10 1 Yes 2 No Yes Australia 10 0 15 No No No Austria 0 0 10 No No No Azerbaijan 8 0 8 Yes No Yes
26 MAY Boustead Singapore Limited FY2010 Financial Results Presentation
 26 MAY 2010 Boustead Singapore Limited FY2010 Financial Results Presentation Disclaimer This presentation contains certain statements that are not statements of historical fact such as forward-looking
COMCEC Trade OUTLOOK 2015
 COMCEC Trade OUTLOOK 2015 Trade Working Group 6 th Meeting September 17, 2015 Ankara, Turkey OUTLINE Recent Trends in Trade Between the OIC Member States and the World Recent Trends in Intra-OIC Trade
26 MAY Boustead Singapore Limited / Boustead Projects Limited Joint FY2015 Financial Results Presentation
 26 MAY 2015 Boustead Singapore Limited / Boustead Projects Limited Joint FY2015 Financial Results Presentation Disclaimer This presentation contains certain statements that are not statements of historical
Global Construction 2030 Expo EDIFICA 2017 Santiago Chile. 4-6 October 2017
 Global Construction 2030 Expo EDIFICA 2017 Santiago Chile 4-6 October 2017 Graham Robinson Global Construction Perspectives Global Construction 2030 is the fourth in a series of global studies of the construction
Gold demand statistics
 Gold demand statistics Table 2: Gold demand (tonnes) 2014 2015 Q2 14 Q3 14 Q4 14 Q2 15 Q3 15 Q4 15 Jewellery 2,482.0 2,397.5 589.5 591.5 686.0 596.9 513.7 623.7 663.2 481.9-19 Technology 348.5 333.8 86.6
Actuarial Supply & Demand. By i.e. muhanna. i.e. muhanna Page 1 of
 By i.e. muhanna i.e. muhanna Page 1 of 8 040506 Additional Perspectives Measuring actuarial supply and demand in terms of GDP is indeed a valid basis for setting the actuarial density of a country and
ENERGY SECTOR PRESENTATION
 NOVEMBER 16TH 2 0 10 S T U D E N T I N V E ST M E N T M A N A G E M E N T P R O G R A M T H E O H I O S T A T E U N I V E R S I T Y ENERGY SECTOR PRESENTATION David Clark- Joseph Felice Green Jiri Woschitz
Gross Selected industrial group, country income Percentage (less loss) of total
 of total") 15-Apr-10 U.S. Corporation Returns with a Foreign Tax Credit: Foreign Oil and Gas Extraction Income, by Selected Industy and Country, Tax Year 2001 All industries 30,946 100.0 coal products manufacturing...
15-Apr-10 U.S. Corporation Returns with a Foreign Tax Credit: Foreign Oil and Gas Extraction Income, by Selected Industy and Country, Tax Year 2001 All industries 30,946 100.0 coal products manufacturing...
M&G Emerging Markets Bond Fund Claudia Calich, Fund Manager. November 2015
 M&G Emerging Markets Bond Fund Claudia Calich, Fund Manager November 2015 Agenda Macro update & government bonds Emerging market corporate bonds Fund positioning Emerging markets risks today Risks Slowing
Chart Collection for Morning Briefing
 Chart Collection for Morning Briefing February 7, 1 Dr. Edward Yardeni 1-97-73 eyardeni@ Mali Quintana --1333 aquintana@ Please visit our sites at www. blog. thinking outside the box 3 3 Figure 1. S&P
ide: FRANCE Appendix A Countries with Double Taxation Agreement with France
 Fiscal operational guide: FRANCE ide: FRANCE Appendix A Countries with Double Taxation Agreement with France Albania Algeria Argentina Armenia 2006 2006 From 1 March 1981 2002 1 1 1 All persons 1 Legal
Dutch tax treaty overview Q3, 2012
 Dutch tax treaty overview Q3, 2012 Hendrik van Duijn DTS Duijn's Tax Solutions Zuidplein 36 (WTC Tower H) 1077 XV Amsterdam The Netherlands T +31 888 387 669 T +31 888 DTS NOW F +31 88 8 387 601 duijn@duijntax.com
COUNTRY COST INDEX JUNE 2013
 COUNTRY COST INDEX JUNE 2013 June 2013 Kissell Research Group, LLC 1010 Northern Blvd., Suite 208 Great Neck, NY 11021 www.kissellresearch.com Kissell Research Group Country Cost Index - June 2013 2 Executive
Marine. Global Programmes. cunninghamlindsey.com. A Cunningham Lindsey service
 Marine Global Programmes A Cunningham Lindsey service Marine global presence Marine Global Programmes Cunningham Lindsey approach Managing your needs With 160 marine surveyors and claims managers in 36
Emerging market equities
 November 22, 2010 Emerging market equities Jean-Pierre Talon, FSA, FICA Introduction Focus of this presentation is to set out the rationale for a strategic bias toward emerging market equities Consider
Methodology Calculating the insurance gap
 Methodology Calculating the insurance gap Insurance penetration Methodology 3 Insurance Insurance Penetration Rank Rank Rank penetration penetration difference 2018 2012 change 2018 report 2012 report
World s Best Investment Bank Awards 2018
 Global Finance will publish its selections for the 19th Annual World s Best Investment Banks in the April 2018 issue. Winners will be honored at an awards ceremony in New York City in March, and all award
San Francisco Retiree Health Care Trust Fund Education Materials on Public Equity
 M E K E T A I N V E S T M E N T G R O U P 5796 ARMADA DRIVE SUITE 110 CARLSBAD CA 92008 760 795 3450 fax 760 795 3445 www.meketagroup.com The Global Equity Opportunity Set MSCI All Country World 1 Index
Guide to Treatment of Withholding Tax Rates. January 2018
 Guide to Treatment of Withholding Tax Rates Contents 1. Introduction 1 1.1. Aims of the Guide 1 1.2. Withholding Tax Definition 1 1.3. Double Taxation Treaties 1 1.4. Information Sources 1 1.5. Guide Upkeep
Driehaus International Small Cap Growth Fund
 DRIEHAUS CAPITAL MANAGEMENT SECOND QUARTER 208 Growth Fund KEY FEATURES Developed and emerging markets small cap exposure mark aware, not benchmark constrained Opportunistic investment approach High active
ENERGY COMPANY PRESENTATION
 NOVEMBER 30TH 2 0 10 S T U D E N T I N V E ST M E N T M A N A G E M E N T P R O G R A M T H E O H I O S T A T E U N I V E R S I T Y ENERGY COMPANY PRESENTATION David Clark-Joseph Felice Green Jiri Woschitz
International Travel & Tourism Study (Published March 2005)
") International Travel & Tourism Study (Published March 2005) Roy Morgan International conducts surveys in the US,, Australia, New Zealand and Indonesia on a continuous basis. Respondents are asked about
International Travel & Tourism Study (Published March 2005) Roy Morgan International conducts surveys in the US,, Australia, New Zealand and Indonesia on a continuous basis. Respondents are asked about
Global Business Barometer April 2008
 Global Business Barometer April 2008 The Global Business Barometer is a quarterly business-confidence index, conducted for The Economist by the Economist Intelligence Unit What are your expectations of
PMITM. The world s leading economic indicator
 PMITM The world s leading economic indicator The Purchasing Managers IndexTM (PMITM) is based on monthly surveys of carefully selected companies representing major and developing economies worldwide. KEY
CREDIT INSURANCE. To ensure peace, you must be prepared for war. CREDIT INSURANCE FUNDAMENTAL SOLUTION IN CREDIT RISK MANAGEMENT
 FUNDAMENTAL SOLUTION IN CREDIT RISK MANAGEMENT I would like to extend my relations with that customer... I would like to enter a new market... We have high exposure for that customer... We have delayed
Total Imports by Volume (Gallons per Country)
") 7/6/2018 Imports by Volume (Gallons per Country) YTD YTD Country 05/2017 05/2018 % Change 2017 2018 % Change MEXICO 71,166,360 74,896,922 5.2 % 302,626,505 328,397,135 8.5 % NETHERLANDS 12,039,171 13,341,929
7/6/2018 Imports by Volume (Gallons per Country) YTD YTD Country 05/2017 05/2018 % Change 2017 2018 % Change MEXICO 71,166,360 74,896,922 5.2 % 302,626,505 328,397,135 8.5 % NETHERLANDS 12,039,171 13,341,929
Scale of Assessment of Members' Contributions for 2008
 General Conference GC(51)/21 Date: 28 August 2007 General Distribution Original: English Fifty-first regular session Item 13 of the provisional agenda (GC(51)/1) Scale of Assessment of s' Contributions
Online Free Services Available on the Portal
 Online Free Services Available on the Portal MFN/Preferential Tariff of over 50 Countries MFN/ Preferential Tariff and SPS-TBT of India Rules of Origin to get preferential access to targeted markets under
Comperative DTTs of Pakistan
 Comperative DTTs of Pakistan 1 2 3 4 5 6 7 8 9 10 11 12 13 14 15 S. No. COUNTRY CONTINENT Republic/Dem ocratic/kingdo m/sultanate P.E. BUSINESS PROFIT SHIPPING AIR TRANSPORT DIVIDEND INTEREST ROYALITIES
Total Imports by Volume (Gallons per Country)
") 6/6/2018 Imports by Volume (Gallons per Country) YTD YTD Country 04/2017 04/2018 % Change 2017 2018 % Change MEXICO 60,968,190 71,994,646 18.1 % 231,460,145 253,500,213 9.5 % NETHERLANDS 13,307,731 10,001,693
6/6/2018 Imports by Volume (Gallons per Country) YTD YTD Country 04/2017 04/2018 % Change 2017 2018 % Change MEXICO 60,968,190 71,994,646 18.1 % 231,460,145 253,500,213 9.5 % NETHERLANDS 13,307,731 10,001,693
DFA Global Equity Portfolio (Class F) Quarterly Performance Report Q2 2014
 Quarterly Performance Report Q2 2014") DFA Global Equity Portfolio (Class F) Quarterly Performance Report Q2 2014 This presentation has been prepared by Dimensional Fund Advisors Canada ULC ( DFA Canada ), manager of the Dimensional Funds.
DFA Global Equity Portfolio (Class F) Quarterly Performance Report Q2 2014 This presentation has been prepared by Dimensional Fund Advisors Canada ULC ( DFA Canada ), manager of the Dimensional Funds.
Quarterly Investment Update First Quarter 2017
 Quarterly Investment Update First Quarter 2017 Market Update: A Quarter in Review March 31, 2017 CANADIAN STOCKS INTERNATIONAL STOCKS Large Cap Small Cap Growth Value Large Cap Small Cap Growth Value Emerging
TRENDS AND MARKERS Signatories to the United Nations Convention against Transnational Organised Crime
 A F R I C A WA T C H TRENDS AND MARKERS Signatories to the United Nations Convention against Transnational Organised Crime Afghanistan Albania Algeria Andorra Angola Antigua and Barbuda Argentina Armenia
Total Imports by Volume (Gallons per Country)
") 11/2/2018 Imports by Volume (Gallons per Country) YTD YTD Country 09/2017 09/2018 % Change 2017 2018 % Change MEXICO 49,299,573 57,635,840 16.9 % 552,428,635 601,679,687 8.9 % NETHERLANDS 11,656,759 13,024,144
11/2/2018 Imports by Volume (Gallons per Country) YTD YTD Country 09/2017 09/2018 % Change 2017 2018 % Change MEXICO 49,299,573 57,635,840 16.9 % 552,428,635 601,679,687 8.9 % NETHERLANDS 11,656,759 13,024,144
EP UNEP/OzL.Pro.WG.1/36/INF/1
 UNITED NATIONS EP UNEP/OzL.Pro.WG.1/36/INF/1 Distr.: General 22 June 2015 English only K1501907 080715 United Nations Environment Programme Open-ended Working Group of the Parties to the Montreal Protocol
Total Imports by Volume (Gallons per Country)
") 10/5/2018 Imports by Volume (Gallons per Country) YTD YTD Country 08/2017 08/2018 % Change 2017 2018 % Change MEXICO 67,180,788 71,483,563 6.4 % 503,129,061 544,043,847 8.1 % NETHERLANDS 12,954,789 12,582,508
10/5/2018 Imports by Volume (Gallons per Country) YTD YTD Country 08/2017 08/2018 % Change 2017 2018 % Change MEXICO 67,180,788 71,483,563 6.4 % 503,129,061 544,043,847 8.1 % NETHERLANDS 12,954,789 12,582,508
ANNEX 2: Methodology and data of the Starting a Foreign Investment indicators
 ANNEX 2: Methodology and data of the Starting a Foreign Investment indicators Methodology The Starting a Foreign Investment indicators quantify several aspects of business establishment regimes important
Total Imports by Volume (Gallons per Country)
") 1/5/2018 Imports by Volume (Gallons per Country) YTD YTD Country 11/2016 11/2017 % Change 2016 2017 % Change MEXICO 50,994,409 48,959,909 (4.0)% 631,442,105 657,851,150 4.2 % NETHERLANDS 9,378,351 11,903,919
1/5/2018 Imports by Volume (Gallons per Country) YTD YTD Country 11/2016 11/2017 % Change 2016 2017 % Change MEXICO 50,994,409 48,959,909 (4.0)% 631,442,105 657,851,150 4.2 % NETHERLANDS 9,378,351 11,903,919
DFA Global Equity Portfolio (Class F) Performance Report Q2 2017
 Performance Report Q2 2017") DFA Global Equity Portfolio (Class F) Performance Report Q2 2017 This presentation has been prepared by Dimensional Fund Advisors Canada ULC ( DFA Canada ), manager of the Dimensional Funds. This presentation
DFA Global Equity Portfolio (Class F) Performance Report Q2 2017 This presentation has been prepared by Dimensional Fund Advisors Canada ULC ( DFA Canada ), manager of the Dimensional Funds. This presentation
DFA Global Equity Portfolio (Class F) Performance Report Q3 2018
 Performance Report Q3 2018") DFA Global Equity Portfolio (Class F) Performance Report Q3 2018 This presentation has been prepared by Dimensional Fund Advisors Canada ULC ( DFA Canada ), manager of the Dimensional Funds. This presentation
DFA Global Equity Portfolio (Class F) Performance Report Q3 2018 This presentation has been prepared by Dimensional Fund Advisors Canada ULC ( DFA Canada ), manager of the Dimensional Funds. This presentation
DFA Global Equity Portfolio (Class F) Performance Report Q4 2017
 Performance Report Q4 2017") DFA Global Equity Portfolio (Class F) Performance Report Q4 2017 This presentation has been prepared by Dimensional Fund Advisors Canada ULC ( DFA Canada ), manager of the Dimensional Funds. This presentation
DFA Global Equity Portfolio (Class F) Performance Report Q4 2017 This presentation has been prepared by Dimensional Fund Advisors Canada ULC ( DFA Canada ), manager of the Dimensional Funds. This presentation
Total Imports by Volume (Gallons per Country)
") 12/6/2018 Imports by Volume (Gallons per Country) YTD YTD Country 10/2017 10/2018 % Change 2017 2018 % Change MEXICO 56,462,606 60,951,402 8.0 % 608,891,240 662,631,088 8.8 % NETHERLANDS 11,381,432 10,220,226
12/6/2018 Imports by Volume (Gallons per Country) YTD YTD Country 10/2017 10/2018 % Change 2017 2018 % Change MEXICO 56,462,606 60,951,402 8.0 % 608,891,240 662,631,088 8.8 % NETHERLANDS 11,381,432 10,220,226
Quarterly Investment Update First Quarter 2018
 Quarterly Investment Update First Quarter 2018 Dimensional Fund Advisors Canada ULC ( DFA Canada ) is not affiliated with [insert name of Advisor]. DFA Canada is a separate and distinct company. Market
Bilateral agreements on investment promotion and protection
 Bilateral agreements on investment promotion and protection Country Date Signed Entry into force South Africa 26 April 2005 - Albania 30 October 1993 - Algeria 7 July 2006 - Germany 20 December 1963 6
DFA Global Equity Portfolio (Class F) Performance Report Q3 2015
 Performance Report Q3 2015") DFA Global Equity Portfolio (Class F) Performance Report Q3 2015 This presentation has been prepared by Dimensional Fund Advisors Canada ULC ( DFA Canada ), manager of the Dimensional Funds. This presentation
DFA Global Equity Portfolio (Class F) Performance Report Q3 2015 This presentation has been prepared by Dimensional Fund Advisors Canada ULC ( DFA Canada ), manager of the Dimensional Funds. This presentation
Total Imports by Volume (Gallons per Country)
") 2/6/2019 Imports by Volume (Gallons per Country) YTD YTD Country 11/2017 11/2018 % Change 2017 2018 % Change MEXICO 48,959,909 54,285,392 10.9 % 657,851,150 716,916,480 9.0 % NETHERLANDS 11,903,919 10,024,814
2/6/2019 Imports by Volume (Gallons per Country) YTD YTD Country 11/2017 11/2018 % Change 2017 2018 % Change MEXICO 48,959,909 54,285,392 10.9 % 657,851,150 716,916,480 9.0 % NETHERLANDS 11,903,919 10,024,814
Total Imports by Volume (Gallons per Country)
") 3/6/2019 Imports by Volume (Gallons per Country) YTD YTD Country 12/2017 12/2018 % Change 2017 2018 % Change MEXICO 54,169,734 56,505,154 4.3 % 712,020,884 773,421,634 8.6 % NETHERLANDS 11,037,475 8,403,018
3/6/2019 Imports by Volume (Gallons per Country) YTD YTD Country 12/2017 12/2018 % Change 2017 2018 % Change MEXICO 54,169,734 56,505,154 4.3 % 712,020,884 773,421,634 8.6 % NETHERLANDS 11,037,475 8,403,018
April 2015 Fiscal Monitor
 International Monetary Fund April 17, 2015 April 2015 Fiscal Monitor Now is the Time: Fiscal Policies for Sustainable Growth Xavier Debrun Deputy Chief, Fiscal Policy and Surveillance, Fiscal Affairs Department
INTERNATIONAL FRAMEWORK FOR NUCLEAR ENERGY COOPERATION (IFNEC)
") INTERNATIONAL FRAMEWORK FOR NUCLEAR ENERGY COOPERATION (IFNEC) Status of Reliable Nuclear Fuel Services Working Group Activities on Multinational Repository Concept Michelle Scott Senior Advisor U.S. Department
INTERNATIONAL FRAMEWORK FOR NUCLEAR ENERGY COOPERATION (IFNEC) Status of Reliable Nuclear Fuel Services Working Group Activities on Multinational Repository Concept Michelle Scott Senior Advisor U.S. Department
Planning Global Compensation Budgets for 2018 November 2017 Update
 Planning Global Compensation Budgets for 2018 November 2017 Update Planning Global Compensation Budgets for 2018 The year is rapidly coming to a close, and we are now in the midst of 2018 global compensation
Total Imports by Volume (Gallons per Country)
") 2/6/2018 Imports by Volume (Gallons per Country) YTD YTD Country 12/2016 12/2017 % Change 2016 2017 % Change MEXICO 50,839,282 54,169,734 6.6 % 682,281,387 712,020,884 4.4 % NETHERLANDS 10,630,799 11,037,475
2/6/2018 Imports by Volume (Gallons per Country) YTD YTD Country 12/2016 12/2017 % Change 2016 2017 % Change MEXICO 50,839,282 54,169,734 6.6 % 682,281,387 712,020,884 4.4 % NETHERLANDS 10,630,799 11,037,475
Global Economic Indictors: CRB Raw Industrials & Global Economy
 Global Economic Indictors: & Global Economy December 14, 2017 Dr. Edward Yardeni 516-972-7683 eyardeni@ Mali Quintana 480-664-1333 aquintana@ Please visit our sites at www. blog. thinking outside the box
Air Passenger Forecasts
 www.iata.org/pax-forecast Example report: numbers are for illustration purposes only Global report Page Table of Contents 1 Top Markets 2 Top Domestic Markets 3 Top International Country Pairs 4 Largest
All-Country Equity Allocator July 2018
 Leila Heckman, Ph.D. lheckman@dcmadvisors.com 917-386-6261 John Mullin, Ph.D. jmullin@dcmadvisors.com 917-386-6262 Allison Hay ahay@dcmadvisors.com 917-386-6264 All-Country Equity Allocator July 2018 A
Turkey Country Profile
 Turkey Country Profile EU Tax Centre June 2018 EU Tax Centre June 2018 Turkey Key tax factors for efficient cross-border business and investment involving Turkey EU Member State Double Tax Treaties No
YUM! Brands, Inc. Historical Financial Summary. Second Quarter, 2017
 YUM! Brands, Inc. Historical Financial Summary Second Quarter, 2017 YUM! Brands, Inc. Consolidated Statements of Income (in millions, except per share amounts) 2017 2016 2015 YTD Q3 Q4 FY FY Revenues Company
Another Technological Revolution in the O&G Industry: A new Future for Onshore E&P. Ivan Sandrea Advisor to Petra Energia
 Another Technological Revolution in the O&G Industry: A new Future for Onshore E&P Ivan Sandrea Advisor to Petra Energia Contents Another technological revolution in the O&G industry Key onshore stats
An FSE Listings Inc Article FSE Listings Inc- Frankfurt Stock Exchange Listings
 FSE Listings How To Prepare Yourself For Listing On The Frankfurt Stock Exchange Author: Mark Bragg An FSE Listings Inc Article FSE Listings Inc- Frankfurt Stock Exchange Listings List your firm fast with
H S B C H O L D I N G S P L C HSBC HOLDINGS PLC THE CAPITAL REQUIREMENTS. (Country-by-Country Reporting) REGULATION 2013
 REGULATION 2013") HSBC HOLDINGS PLC THE CAPITAL REQUIREMENTS (Country-by-Country Reporting) REGULATION 2013 31 December 2015 This report has been prepared for HSBC Holdings plc and its subsidiaries (the HSBC Group ) to
HSBC HOLDINGS PLC THE CAPITAL REQUIREMENTS (Country-by-Country Reporting) REGULATION 2013 31 December 2015 This report has been prepared for HSBC Holdings plc and its subsidiaries (the HSBC Group ) to
Total Imports by Volume (Gallons per Country)
") 5/4/2016 Imports by Volume (Gallons per Country) YTD YTD Country 03/2015 03/2016 % Change 2015 2016 % Change MEXICO 53,821,885 60,813,992 13.0 % 143,313,133 167,568,280 16.9 % NETHERLANDS 11,031,990 12,362,256
5/4/2016 Imports by Volume (Gallons per Country) YTD YTD Country 03/2015 03/2016 % Change 2015 2016 % Change MEXICO 53,821,885 60,813,992 13.0 % 143,313,133 167,568,280 16.9 % NETHERLANDS 11,031,990 12,362,256
MENA Benchmarking Report Arab-EU Business Facilitation Network
 MENA Benchmarking Report Arab-EU Business Facilitation Network www.ae-network.org September 2014 Agenda Objective of the Report Macroeconomic Analysis Business Environment Index MENA Rankings 2 Objective
Why Invest In Emerging Markets? Why Now?
 Why Invest In Emerging Markets? Why Now? 2017 Over the long term, Emerging Markets (EM) have been a winning alternative compared to traditional Developed Markets (DM)... 350 300 250 200 150 100 50 1997
Total Imports by Volume (Gallons per Country)
") 4/5/2018 Imports by Volume (Gallons per Country) YTD YTD Country 02/2017 02/2018 % Change 2017 2018 % Change MEXICO 53,961,589 55,268,981 2.4 % 108,197,008 114,206,836 5.6 % NETHERLANDS 12,804,152 11,235,029
4/5/2018 Imports by Volume (Gallons per Country) YTD YTD Country 02/2017 02/2018 % Change 2017 2018 % Change MEXICO 53,961,589 55,268,981 2.4 % 108,197,008 114,206,836 5.6 % NETHERLANDS 12,804,152 11,235,029
Foreign Investment Statistics
 2012-2013 Released Date: May 2015 Table of Contents Introduction....4 Key Points......5 Total Stock of Foreign Investment (FI) by Economic Activity....6 Foreign Direct Investment (FDI) by Economic Activity.......8
Total Imports by Volume (Gallons per Country)
") 10/5/2017 Imports by Volume (Gallons per Country) YTD YTD Country 08/2016 08/2017 % Change 2016 2017 % Change MEXICO 51,349,849 67,180,788 30.8 % 475,806,632 503,129,061 5.7 % NETHERLANDS 12,756,776 12,954,789
10/5/2017 Imports by Volume (Gallons per Country) YTD YTD Country 08/2016 08/2017 % Change 2016 2017 % Change MEXICO 51,349,849 67,180,788 30.8 % 475,806,632 503,129,061 5.7 % NETHERLANDS 12,756,776 12,954,789
Summary 715 SUMMARY. Minimum Legal Fee Schedule. Loser Pays Statute. Prohibition Against Legal Advertising / Soliciting of Pro bono
 Summary Country Fee Aid Angola No No No Argentina No, with No No No Armenia, with No No No No, however the foreign Attorneys need to be registered at the Chamber of Advocates to be able to practice attorney
Market Correlation: Emerging Markets MSCI
 Market Correlation: MSCI March 2, 218 Dr. Edward Yardeni 516-972-7683 eyardeni@ Joe Abbott 732-497-536 jabbott@ Mali Quintana 48-664-1333 aquintana@ Please visit our sites at www. blog. thinking outside
Turkey Country Profile
 Turkey Country Profile EU Tax Centre June 2017 Key tax factors for efficient cross-border business and investment involving Turkey EU Member State Double Tax Treaties With: Albania Algeria Australia Austria
EDHECinfra Broad Market Index Families
 EDHECinfra Broad Market Index Families Unlisted Infrastructure Equity Index Families Global Unlisted Infrastructure Equity Global Project Finance Equity Advanced Markets Unlisted Infrastructure Equity
Argus Butadiene Annual 2017
 Argus Butadiene Annual 2017 Market Reporting Petrochemicals Consulting Events Argus Butadiene Annual 2017 Summary Three major developments have shaped the global butadiene (BD) markets over the past decade.
Supplemental Table I. WTO impact by industry
 Supplemental Table I. WTO impact by industry This table presents the influence of WTO accessions on each three-digit NAICS code based industry for the manufacturing sector. The WTO impact is estimated
Congressional Budget Office FY 2011 Outlay Projection: $3.899 Trillion
 Federal retirement, unemployment insurance, veterans, other social/health $726 B - 18% (FY 2008: $324 B - 11 %) Congressional Budget Office FY 2011 Outlay Projection: $3.899 Trillion Mandatory Net Interest
Global solutions. Local expertise.
 Global solutions. Local expertise. Count on Sedgwick around the world Sedgwick is a leading global provider of technology-enabled risk, benefits and integrated business solutions. Our 21,000 colleagues,
Portfolio Strategist Update from BlackRock Active Opportunity ETF Portfolios
 Portfolio Strategist Update from BlackRock Active Opportunity ETF Portfolios As of Sept. 30, 2017 Ameriprise Financial Services, Inc., ("Ameriprise Financial") is the investment manager for Active Opportunity
Michigan s Economic Future and MEDC Initiatives
 Michigan s Economic Future and MEDC Initiatives Doug Smith, Senior Vice President, Governmental Affairs & Strategic Partnerships Michigan Economic Development Corporation Apartment Association of Michigan
A short history of debt
 A short history of debt In the words of the late Charles Kindleberger, debt/financial crises are a hardy perennial we have been here many times before. Over the past decade and a half the ratio of global
All-Country Equity Allocator February 2018
 Leila Heckman, Ph.D. lheckman@dcmadvisors.com 917-386-6261 John Mullin, Ph.D. jmullin@dcmadvisors.com 917-386-6262 Charles Waters cwaters@dcmadvisors.com 917-386-6264 All-Country Equity Allocator February
Withholding Tax Handbook BELGIUM. Version 1.2 Last Updated: June 20, New York Hong Kong London Madrid Milan Sydney
 Withholding Tax Handbook BELGIUM Version 1.2 Last Updated: June 20, 2014 Globe Tax Services Incorporated 90 Broad Street, New York, NY, USA 10004 Tel +1 212 747 9100 Fax +1 212 747 0029 Info@GlobeTax.com
Dutch tax treaty overview Q4, 2013
 Dutch tax treaty overview Q4, 2013 Hendrik van Duijn DTS Duijn's Tax Solutions Zuidplein 36 (WTC Tower H) 1077 XV Amsterdam The Netherlands T +31 888 387 669 T +31 888 DTS NOW F +31 88 8 387 601 duijn@duijntax.com
Financial wealth of private households worldwide
 Economic Research Financial wealth of private households worldwide Munich, October 217 Recovery in turbulent times Assets and liabilities of private households worldwide in EUR trillion and annualrate
The Capital Requirements (Country-by-Country Reporting) Regulations December 2017
 Regulations December 2017") HSBC Holdings plc The Capital Requirements (Country-by-Country Reporting) Regulations 2013 31 December 2017 This report has been prepared for HSBC Holdings plc and its subsidiaries (the HSBC Group ) to
HSBC Holdings plc The Capital Requirements (Country-by-Country Reporting) Regulations 2013 31 December 2017 This report has been prepared for HSBC Holdings plc and its subsidiaries (the HSBC Group ) to
Total Imports by Volume (Gallons per Country)
") 3/7/2018 Imports by Volume (Gallons per Country) YTD YTD Country 01/2017 01/2018 % Change 2017 2018 % Change MEXICO 54,235,419 58,937,856 8.7 % 54,235,419 58,937,856 8.7 % NETHERLANDS 12,265,935 10,356,183
3/7/2018 Imports by Volume (Gallons per Country) YTD YTD Country 01/2017 01/2018 % Change 2017 2018 % Change MEXICO 54,235,419 58,937,856 8.7 % 54,235,419 58,937,856 8.7 % NETHERLANDS 12,265,935 10,356,183
Best Treasury & Cash Management Providers 2017
 Page 1 of 5 In March 2017, Global Finance will publish its selections for the Seventeenth Annual World s Best Treasury & Cash Management Providers. Global Finance will select the best overall global cash
SINGAPORE - FINAL LIST OF MFN EXEMPTIONS (For the Second Package of Commitments) Countries to which the measure applies
 Countries to which the measure applies") All Sectors: Presence of: - unskilled and semi-skilled natural persons - skilled persons (include craftsmen skilled in a particular trade, but exclude specialists/professio nal personnel at management
All Sectors: Presence of: - unskilled and semi-skilled natural persons - skilled persons (include craftsmen skilled in a particular trade, but exclude specialists/professio nal personnel at management
Visa types and fees (US Dollars) Fees shown for regular service. Fees are doubled for all applications filed upon expedited service.
 Fees shown for regular service. Fees are doubled for all applications filed upon expedited service.") Visa fees (according to reciprocity principle and bilateral treaties) (Paragraph 26 of the Rules on Issuing Ukraine's Entry and Visas approved by the Decree of the Cabinet of Ministers of Ukraine no.118
Visa fees (according to reciprocity principle and bilateral treaties) (Paragraph 26 of the Rules on Issuing Ukraine's Entry and Visas approved by the Decree of the Cabinet of Ministers of Ukraine no.118
Note: G20 includes only the 19 member countries (excludes European Union).
.") Note: G20 includes only the 19 member countries (excludes European Union). (Per cent) Variable 2007 2008 2009 2010 2011 2012 2013 2014 2015* GDP 5.7 3.1 0.0 5.4 4.2 3.4 3.3 3.4 3.1 Trade 7.9 2.9-10.3 12.5
Note: G20 includes only the 19 member countries (excludes European Union). (Per cent) Variable 2007 2008 2009 2010 2011 2012 2013 2014 2015* GDP 5.7 3.1 0.0 5.4 4.2 3.4 3.3 3.4 3.1 Trade 7.9 2.9-10.3 12.5
Global Equity Strategy Report
 Global Investment Strategy Global Equity Strategy Report April 26, 2017 Stuart Freeman, CFA Co-Head of Global Equity Strategy Scott Wren Senior Global Equity Strategist Analysis and outlook for the equity
Oil Value Chain & Markets. Global Oil Markets
 Oil Value Chain & Markets Global Oil Markets World Oil Reserves WORLD OPEC Middle East Former Soviet Union Africa End 2006 End 2000 End 1990 End 1980 North America USA South & Central America Asia Pacific
2017 PhRMA Annual Membership Survey
 2017 PhRMA Annual Membership Survey DEFINITION OF TERMS as well as developmental activities carried on Research and Development (R&D) Expenditure Definitions or supported in the pharmaceutical, biological,
APA & MAP COUNTRY GUIDE 2018 UKRAINE. New paths ahead for international tax controversy
 APA & MAP COUNTRY GUIDE 2018 UKRAINE New paths ahead for international tax controversy UKRAINE APA PROGRAM KEY FEATURES Competent authority Relevant provisions Types of APAs available Acceptance criteria
FTSE All-World ex Coal Index Series
 FTSE Russell Factsheet FTSE All-World ex Coal Index Series Data as at: 29 March 2019 bmktitle1 Market participants are increasingly looking to manage carbon exposure in their investments, and reduce write-off