Risk and Return. Return. Risk. M. En C. Eduardo Bustos Farías
|
|
|
- Stuart Palmer
- 6 years ago
- Views:
Transcription
1 Risk and Return Return M. En C. Eduardo Bustos Farías Risk 1
2 Inflation, Rates of Return, and the Fisher Effect Interest Rates
3 Conceptually: Interest Rates Nominal risk-free Interest Rate krf = Real risk-free Interest Rate k* + Inflationrisk premium IRP Mathematically: (1 + krf) = (1 + k*) (1 + IRP) This is known as the Fisher Effect 3
4 Interest Rates Suppose the real rate is 3%, and the nominal rate is 8%. What is the inflation rate premium? (1 + krf) = (1 + k*) (1 + IRP) (1.08) = (1.03) (1 + IRP) (1 + IRP) = (1.0485), so IRP = 4.85% 4
5 yield to maturity Term Structure of Interest Rates The pattern of rates of return for debt securities that differ only in the length of time to maturity. time to maturity (years) 5
6 Term Structure of Interest Rates The yield curve may be downward sloping or inverted if rates are expected to fall. yield to maturity time to maturity (years) 6
7 For a Treasury security, what is the required rate of return? Required rate of return = Risk-free rate of return Since Treasuries are essentially free of default risk, the rate of return on a Treasury security is considered the risk-free rate of return. 7
8 For a corporate stock or bond, what is the required rate of return? Required rate of return Risk-free = rate of + return Risk premium 8
9 Returns Example Total dollar return The return on an investment measured in dollars that accounts for all cash flows and capital gains or losses. Total dollar return = Dividend + Capital gain on stock income (or loss) 9
10 Returns Total percent return The return on an investment measured as a % of the originally invested sum that accounts for all cash flows and capital gains or losses. It is the return for each dollar invested. Example Percent return = Dividend + Capital gains on stock yield yield or Total dollar return. Beginning stock price 10
11 Returns Example: Calculating Returns Suppose you invested $1,000 in a stock at $5 per share. After one year, the price increases to $35. For each share, you also received $ in dividends. Dividend yield = $ / $5 = 8% Capital gains yield = ($35 $5) / $5 = 40% Total percentage return = 8% + 40% = 48% Total dollar return = 48% of $1,000 = $480 At the end of the year, the value of your $1,000 investment is $1,
12 Probability distributions Probability is defined as the chance that an event will occur. Probability Distribution is a listing of all possible outcomes, or events, with a probability (chance of occurrence) assigned to each outcome. Outcome Probability Rain 0.4 = 40% No rain 0.6 = 60% 1
13 Probability distributions A listing of all possible outcomes, and the probability of each occurrence. Can be shown graphically. Firm X Firm Y Rate of Return (%) Expected Rate of Return 13
14 Probability Example Let s think about a Game. If you draw a dice, the dealer will pay you some cash according to the following table. ω X 1 $ 100 $ $ 00 4 $ 00 5 $ $ 300 Then, the cash flow, X, after you draw the dice, can be $100, 00, or $300 depending on the outcomes. Ω = {1,,3,4,5,6} ω = 1,,3,4,5, or6 X : Ω 100,00, or300 X X X X X X X ( ω ) = () 1 = 100 ( ) = 100 () 3 = 00 ( 4) = 00 () 5 = 300 ( 6) = ,00, or300 Sample Space Sample Point Pr Pr Pr X: Random Variable ( X = 100) Pr( {1,} ) ( X = 00) Pr( {3,4} ) ( X = 300) Pr( {5,6} ) = + = = + = = + = Pr(X=100) : Probability that your cash flow will be $100. Pr({1,}) : Probability that the outcome will be one or two. 14
15 Probability Expectation the sample space, a set, Ω, whose elements, ω, corresponds to the possible outcomes of an experiment; Sample point is an element in the sample space; a random variable (function) assigns a value to a sample point; or a random variable is one whose value is subject to uncertainty. Expectation n ( X ) X i pi = X1 p1 + X p + X n pn E = + i= 1 ω Y 1 $ 50 $ $ $ 00 5 $ $ 400 What is expected value of Y? 15
16 The Variance & Standard Deviation The variance and standard deviation describe the dispersion (spread) of the potential resultado outcomes around the expected value Greater dispersion generally means greater uncertainty and therefore higher risk Less Risky Riskier σ σ N = R t t t 1 R ( R R) = ρ = σ R
17 Probability Variance, Standard Deviation and CV Variance, n σ = i= 1 σ ( X i E( X )) pi = ( X1 E( X )) p1 + ( X E( X )) p + + ( X n E( X )) pn Standard Deviation, σ σ = σ = n ( X E( X )) i= 1 i p i Coefficient of Variation, CV CV = σ E( X ) 17
18 Comparing standard deviations Prob. T - bill USR HT Rate of Return (%) 18
19 Probability X and Y Expected Value : The weighted average of possible values, with weights being the probabilities of occurrence. Variance : The weighted average of square of possible deviations from its mean, with weights being the probabilities of occurrence. Standard Deviation : A measure of the variability of a distribution around its mean. It is the square root of the variance. Coefficient of Variation : The ratio of the standard deviation of a distribution to the mean of that distribution. It is a measure of relative variability of a distribution. Expectation $00 $00 Variance 6, , Standard Deviation Coefficient of Variation X 1. We can expect the same amount of cash flow from the both games. same expected value. If we play the game X, the average deviation of the cash flow from the mean ($00) will be $81.65, and if we play the game Y, the average deviation of the cash flow from the mean ($00) will be $ So, we may say that the game X and Y, will provide the same expected cash flows, the game Y is riskier. 4. When you are pricing the games, you should think about the variability of the cash flows as well as the expected cash flows!!! 19 Y
20 The Expected Value The expected value of a distribution is the most likely outcome For the normal dist., the expected value is the same as the arithmetic mean All other things being equal, we assume that people prefer higher expected returns ER ( ) = E(R) t N = ρ 1 t R t
21 The Expected Return: An Example Suppose that a particular investment has the following probability distribution: 5% chance of -5% return 50% chance of 5% return 5% chance of 15% return This investment has an expected return of 5% Probability 60% 40% 0% 0% -5% 5% 15% Rate of Return E( ) = 0.5( 0.05) (0.05) + 0.5(0.15) = R i 0.05
22 Calculating σ and σ : An Example Using the same example as for the expected return, we can calculate the variance and standard deviation: σ σ i i = = 0.5( ) 0.5( ) ( ) ( ) + 0.5( ) = ( ) = Note: In this example, we know the probabilities. However, often we have only historical data to work with and don t know the probabilities. In these cases, we assume that each outcome is equally likely so the probabilities for each possible outcome are 1/N or (more commonly) 1/(N-1).
23 Returns Expected Return - the return that an investor expects to earn on an asset, given its price, growth potential, etc. Required Return - the return that an investor requires on an asset given its risk and market interest rates. 3
24 Expected Return State of Probability Return Economy (P) Orl. Utility Orl. Tech Recession.0 4% -10% Normal.50 10% 14% Boom.30 14% 30% For each firm, the expected return on the stock is just a weighted average: k = P(k1)*k1 + P(k)*k P(kn)*kn 4
25 Expected Return State of Probability Return Economy (P) Orl. Utility Orl. Tech Recession.0 4% -10% Normal.50 10% 14% Boom.30 14% 30% k = P(k1)*k1 + P(k)*k P(kn)*kn k (OU) =. (4%) +.5 (10%) +.3 (14%) = 10% 5
26 Expected Return State of Probability Return Economy (P) Orl. Utility Orl. Tech Recession.0 4% -10% Normal.50 10% 14% Boom.30 14% 30% k = P(k1)*k1 + P(k)*k P(kn)*kn k (OT) =. (-10%)+.5 (14%) +.3 (30%) = 14% 6
27 The Scale Problem The variance and standard deviation suffer from a couple of problems The most tractable of these is the scale problem: Scale problem - The magnitude of the returns used to calculate the variance impacts the size of the variance possibly giving an incorrect impression of the riskiness of an investment
28 The Scale Problem: an Example Potential Returns Prob ABC XYZ 10% -1% -4% 15% -5% -10% 50% % 4% 15% 9% 18% 10% 16% 3% E(R).0% 4.0% Variance Std. Dev. 7.34% 14.68% C.V Is XYZ really twice as risky as ABC? No!
29 Probability Another game Z Example Let s think about another game which pays half of the X s cash flows and half of Y s cash flows. E or E ω X 1 $ ( Z ) ( Z ) = W E( X ) W E( Y ) X + Y Y $ X/ $ Y/ $ = = Z $ σ σ σ Z Z Z = = ( 75 00) + ( ) + ( ) + ( 00 00) + ( ) + ( ) σ Z 0.5σ = X + 0.5σ 1 6 Y = = =
30 Probability Covariance and Correlation Coefficient Covariance : A statistical measure of the degree to which two random variables move together. A positive value means that, on average, they move in the same direction. Correlation Coefficient : A standardized statistical measure of the linear relation between two variables. Its range is from 1.0 (perfect negative correlation), through 0 (no correlation), to +1.0 (perfect positive correlation) ω X 1 $ Y $ X/ $ Y/ $ Z $ COV ( X, Y ) = σ COV ( X, Y ) = σ r XY COV = σ σ XY ( X, Y ) X Y XY = n i= 1 ( X E( X ))( Y E( Y )) = σ σ r X i Y XY i p i COV(X,Y) : Covariance between X and Y r XY : Correlation Coefficient σ σ Z Z = W σ + W σ + W W σ σ r = X W X X X Y Y Y Y X X Y Y X X Y XY σ + W σ + W W σ σ r Y XY 30
31 31 Probability Summary ( ) n n n i i i p X p X p X p X X E = = = ( ) ( ) ( ) ( ) ( ) ( ) ( ) ( ) n n n i i i p X E X p X E X p X E X p X E X = = = σ ( ) ( ) = = = n i i p i X E X 1 σ σ ( ) X E CV σ = ( ) ( ) ( ) Y E W X E W Z E Y X + = ( ) ( ) ( ) ( ) = = = n i i i i XY p E Y Y X E X Y X COV 1 ), ( σ ( ) Y X XY Y X COV r σ σ, = XY Y X Y X Y Y X X Z XY Y X Y X Y Y X X Z r W W W W r W W W W σ σ σ σ σ σ σ σ σ σ + + = + + =
32 Have you considered RISK? 3
33 What is Risk? The possibility that an actual return will differ from our expected return. Uncertainty in the distribution of possible outcomes. 33
34 What is Risk? Uncertainty in the distribution of possible outcomes. Company A Company B return return 34
35 What is Risk? A risky situation is one which has some probability of loss The higher the probability of loss, the greater the risk The riskiness of an investment can be judged by describing the probability distribution of its possible returns
36 Sources of Risk Changing Economic Conditions Changing Conditions of the Security Issuer 36
37 Risk and Changing Economic Conditions Inflation Risk--Inflation Increases and the Return on Your Investment Does Not Keep Pace Business Cycle Risk--Your Investment s Return Fluctuates in Tandem with the Overall Business Cycle Interest-Rate Risk--Newly-Issued Bonds Offer Higher Rates than Your Bonds 37
38 Risk and Changing Conditions of the Security Issuer Management Risk--The Company in Which You Invested Has Poor Managers Business Risk--Risks Associated with a Company s Product/Service Lines Financial Risk--The Risk of Insolvency Because the Company Has Borrowed Too Much 38
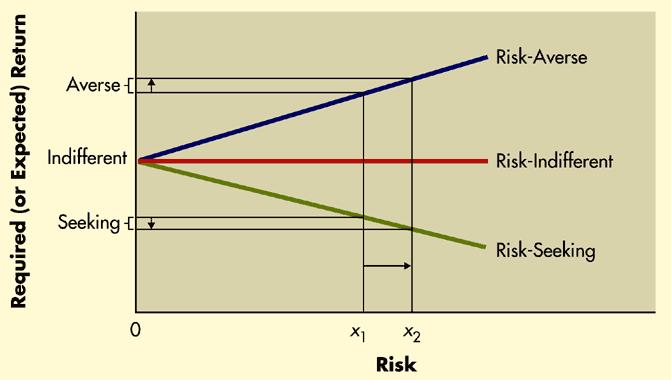
39 Risk Preferences 39
40 Risk and Return Return : Income received on an investment plus any change in market price, usually expressed as a percent of the beginning market price of the investment. For common stock, one-period return would be Example Dt + t R = P ( P P ) t 1 t 1 R : return for one period (from t-1 to t) D t : cash dividend at t P t : the stock s price at t P t-1 : the stock s price at t-1 P t P t-1 : capital gain You have 100 shares of XYZ common stock. You bought the stock for $100 per share one year ago. The stock is currently trading at $106 per share, and you just received $7 cash dividends per share. What return was earned for the past one year? Risk : The variability of returns from those that are expected. It can be measured by standard deviation of the returns or coefficient variation of the returns. 40
41 Risk and Return (Probability Distribution) The actual rate of return can be viewed as a random variable subject to a probability distribution. Then, as we did in previous section, we can analyze the future return in terms of expected return and standard deviation of the returns. Example ABC common stock has the following distribution of possible one-year returns; Probability of occurrence Possible Return What is the expected return and standard deviation of the return on this stock? Pi R i R P ( R i R ) Pi Sum 1.00 R i i σ R σ R or 13.15% E σ σ ( R) R R = = = R = n ( Ri R ) Pi = ( R1 R ) P1 + ( R R ) P + + ( Rn R ) i= 1 σ R n i= 1 R P = R P + R P + + R P i i 1 1 n n P n 41
42 Probability Distributions A probability distribution is simply a listing of the probabilities and their associated outcomes Probability distributions are often presented graphically as in these examples Potential Outcomes Potential Outcomes
43 The Normal Distribution For many reasons, we usually assume that the underlying distribution of returns is normal The normal distribution is a bellshaped curve with finite variance and mean
44 The Coefficient of Variation The coefficient of variation (CV)provides a scale-free measure of the riskiness of a security It removes the scaling by dividing the standard deviation my the expected return (risk per unit of return): R CV = σ ER ( ) In the previous example, the CV for XYZ and ABC are identical, indicating that they have exactly the same degree of riskiness
45 Risk and Return (Coefficient of Variation) Coefficient of Variation : The ratio of the standard deviation of a distribution to the mean of that distribution. It is a measure of relative risk. Example Consider two investment opportunities, A and B, whose probability distributions of one-year returns have the following characteristics: Investment A Investment B Expected Return Standard Deviation Coefficient of Variation 0.75 (0.06/0.08) 0.33 (=0.08/0.4) 1. If our measure of riskiness of the investment is only standard deviation, we should conclude that investment B is riskier than investment A because the standard deviation of B is larger than that of A.. However, relative to the size of expected return, investment A has greater variation. 3. The coefficient of variation is a measure of relative dispersion (risk) a measure of risk per unit of expected return. 4. The larger CV, the larger the relative risk of the investment. 5. Using the CV as our risk measure, investment A is viewed riskier than investment B. 45
46 Portfolios Combining several securities in a portfolio can actually reduce overall risk. How does this work? 46
47 Suppose we have stock A and stock B. The returns on these stocks do not tend to move together over time (they are not perfectly correlated). rate of return kb ka time 47
48 What has happened to the variability of returns for the portfolio? rate of return kb ka time 48
49 What has happened to the variability of returns for the portfolio? rate of return kb ka kp time 49
50 A Portfolio A Portfolio is Simply a Group of Assets Held at the Same Time Bills Stocks Bonds 50
51 Portfolio Portfolio : A combination of two or more securities or assets. Problem You are creating a portfolio of Stock D and Stock ABC (from earlier). You are investing $,000 in Stock ABC and $3,000 in Stock D. Remember that the expected return and standard deviation of Stock ABC is 9% and 13.15%, respectively. The expected return and standard deviation of Stock D is 8% and 10.65%, respectively. The correlation coefficient between returns of ABC and D is What is the expected return, standard deviation and coefficient of variation of the portfolio? ABC Weights 0.4 (=,000/5,000) 0.6 (=3,000/5,000) Expected Return 9% 8% Standard Deviation 13.15% 10.65% Coefficient of Variation Correlation coefficient 0.75 D Formula you need to know R σ P P P = W R + W R 1 1 σ 1 P 1 σ = W σ + W σ + WW σ = 1 1 = W σ + W σ + WW σ σ r R P W i R i r 1 σ 1 : Expected return on portfolio : Weight on asset i : Expected return on asset i : Correlation coefficient between returns of asset 1 and : Covariance between returns of asset 1 and 51
52 Portfolio ABC D Weights 0.4 (=,000/5,000) 0.6 (=3,000/5,000) Expected Return 9% 8% Standard Deviation 13.15% 10.65% Coefficient of Variation Correlation coefficient 0.75 Formula you need to know R P P P = W R + W R P 1 σ = W σ + W σ + WW σ σ = σ 1 1 = W σ + W σ + WW σ σ r R P W i R i r 1 σ 1 : Expected return on portfolio : Weight on asset i : Expected return on asset i : Correlation coefficient between returns of asset 1 and : Covariance between returns of asset 1 and R P σ P P = = σ = CV P = 5
53 Diversification Investing in more than one security to reduce risk. If two stocks are perfectly positively correlated, diversification has no effect on risk. If two stocks are perfectly negatively correlated, the portfolio is perfectly diversified. 53
54 If you owned a share of every stock traded on the NYSE and NASDAQ, would you be diversified? YES! Would you have eliminated all of your risk? NO! Common stock portfolios still have risk. 54
55 Some risk can be diversified away and some cannot. Market risk (systematic risk) is nondiversifiable. This type of risk cannot be diversified away. Company-unique risk (unsystematic risk) is diversifiable. This type of risk can be reduced through diversification. 55
56 Diversification Diversification Lowers Investment Risk It Accomplishes this Goal Because Asset Returns Are Poorly Correlated Diversification is Not Effective if Asset Returns Are Strongly, Positively Correlated The Return Correlations Among Stocks, Bonds, and Bills Are Low; Holding These Investments in a Portfolio is Effective 56
57 An Example of Negative Return Correlation As A s Return Changes A 10% B B s Return Changes in the Opposite Direction Holding Each Gives a 10% Constant Return 57
58 Diversification Guidelines Diversify Among Intangibles and Tangibles Remember: A House Is a Major Tangible Diversify Globally Invest in Foreign Securities Diversify within Asset Groups Own a Variety of Common Stocks 58
59 Portfolio Risk and the Number of Stocks Held Risk Random Risk: Lowered by Increasing the Number of Stocks in the Portfolio Market Risk: Remains Unchanged Number of Stocks in Portfolio 59
60 Portfolio and Diversification ABC D Portfolio Expected Return 9% 8% 8.4% Standard Deviation 13.15% 10.65% 10.91% Coefficient of Variation From stock ABC and D, we have made a portfolio whose expected return, standard deviation and coefficient of variation are 8.4%, 10.91% and 1.30 respectively. Notice that the portfolio s relative risk measured by coefficient of variation is lowest. This is the reason that we need diversification. ( Don t put all your eggs in one basket. ) Through creating portfolios (diversification), we can make more favorable expected return and risk profile. If we combine securities that are not perfectly, positively correlated, the risk of the portfolio decreases. Mathematically, σ = Since _ r σ P P σ 1 < 1 σ 1 σ < W σ + W σ P < W W + W σ + WW σ σ r W σ + WW σ σ = ( W σ + W σ )
61 Systematic and Unsystematic Risk Standard Deviation of Portfolio Return Systematic Risk : The variability of return on stocks or portfolios associated with changes in return on the market as whole. Unsystematic Risk : The variability of return on stocks or portfolios not explained by general market movements. It is avoidable through diversification. Total Risk Unsystematic Risk Systematic Risk 1. When we begin with a single stock, the risk of the portfolio is the standard deviation of that one stock.. As the number of randomly selected stocks held in portfolio is increase the total risk of the portfolio is reduced. 3. Such a reduction is at a decreasing rate. 4. Thus, a substantial proportion of the portfolio risk can be eliminated with a relatively moderate amount of diversification (15 to 0 randomly selected stocks). 5. Even if we hold all of the risky assets in the market, the portfolio still have some degree of riskiness due to risk factors that affect the overall market. unavoidable through diversification systematic risk 6. We can diversify away some risk factors, which is unique to a particular company or industry. avoidable through diversification unsystematic risk Number of Securities in Portfolio Total Risk Systematic Risk Unsystematic Risk = (nondiversifiable + (diversifiable or unavoidable) or avoidable) 61
62 Correlation and Portfolio If you invest half of your money in stock W and the remainder in stock M, then your weight on W and M is 0.5 for each stock. E( R ) = W E( R ) + W E( R ) = % % = In case that r WM = -1, Return Year Stock W Stock M Portfolio WM % -10.0% 15.0% % 40.0% 15.0% % -5.0% 15.0% % 35.0% 15.0% % 15.0% 15.0% Average Return 15.0% 15.0% 15.0% Standard Deviation.6%.6% 0.0% 50.0% 45.0% 40.0% 35.0% 30.0% 5.0% 0.0% 15.0 % 10.0 % 5.0% 0.0% % % -15.0% time 50.0% 45.0% 40.0% 35.0% 30.0% 5.0% 0.0% 15.0 % 10.0 % 5.0% σ P P = W W 0.0% % % -15.0% time W W W M M M M σ + W σ + W W 45.0% 40.0% 35.0% 30.0% 5.0% 0.0% 15.0 % 10.0 % 5.0% -10.0% -15.0% -0.0% W M r WM σ W σ M = 0.0% The two stocks would be quite risky if they were held in isolation. 0.0% -5.0% time % When they are combined to form Portfolio WM, they are not risk at all. The returns on stocks W and M are perfectly negatively correlated, with r WM = -1. It is theoretically possible to combine stocks that are individually quite risky and to form a portfolio which is completely riskless, with σ P = 0. In this case, diversification completely eliminate the risk. 50.0%
63 Correlation and Portfolio If you invest half of your money in stock M and the remainder in stock M, then your weight on M and M is 0.5 for each stock. In case that r MM = 1, Return Year Stock M Stock M' Portfolio MM' % -10.0% -10.0% % 40.0% 40.0% % -5.0% -5.0% % 35.0% 35.0% % 15.0% 15.0% Average Return 15.0% 15.0% 15.0% Standard Deviation.6%.6%.6% E σ ( R ) = W E( R ) + W E( R ) P P = W M M σ M M + W M ' σ M ' M ' M ' + W W M = % % = 15.0% r M ' MM ' M M ' =.6% The returns on stocks M and M are perfectly (positively) correlated, with r MM = 1. In this case, the riskiness is just weighted average of the riskiness of the individual assets in the portfolio. Diversification does nothing to reduce risk if the portfolio consists of perfectly positively correlated stocks. σ σ 50.0% 45.0% 40.0% 35.0% 30.0% 5.0% 0.0% 15.0 % 10.0 % 5.0% 0.0% % % -15.0% time 50.0% 45.0% 40.0% 35.0% 30.0% 5.0% 0.0% 15.0 % 10.0 % 5.0% 0.0% % % -15.0% time 50.0% 45.0% 40.0% 35.0% 30.0% 5.0% 0.0% 15.0 % 10.0 % 5.0% 0.0% -5.0% % -15.0% -0.0% time 63
64 Correlation and Portfolio If you invest half of your money in stock W and the remainder in stock Y, then your weight on W and Y is 0.5 for each stock. In case that r WY = 0.67 Return Year Stock W Stock Y Portfolio WY % 8.0% 34.0% % 0.0% 5.0% % 41.0% 38.0% % -17.0% -11.0% % 3.0% 9.0% Average Return 15.0% 15.0% 15.0% Standard Deviation.6%.6% 0.6% E σ ( R ) = W E( R ) + W E( R ) P P = W W W W W σ + W σ + W W r Y Y Y Y W = % % = 15.0% Y WY σ σ = 0.6% In reality, most stocks are positively correlated, but not perfectly so. Correlation coefficient is So, the portfolio s standard deviation is 0.6%, which is less than the standard deviation of either stock. Diversification reduces the portfolio s risk, but not eliminate it completely. W Y 50.0% 45.0% 40.0% 35.0% 30.0% 5.0% 0.0% 15.0 % 10.0 % 5.0% 0.0% % % -15.0% time 50.0% 45.0% 40.0% 35.0% 30.0% 5.0% 0.0% 15.0 % 10.0 % 5.0% 0.0% -5.0% % -15.0% -0.0% -5.0% time 50.0% 45.0% 40.0% 35.0% 30.0% 5.0% 0.0% 15.0 % 10.0 % 5.0% 0.0% -5.0% % -15.0% -0.0% time 64
65 Correlation and Portfolio What would happen if we included more than two stocks in the portfolio? As a rule, the riskiness of a portfolio will decline as the number of stocks in the portfolio increases. If we added enough partially correlated stocks, could we completely eliminate risk? In general, the answer is no, but the extent to which adding stocks to a portfolio reduces its risk depends on the degree of correlation among the stocks. The smaller the positive correlation coefficients, the lower the risk in a large portfolio. In the real world, where the correlations among the individual stocks are generally positive but less than +1.0, some, but not all, risk can be eliminated. Would you expect to find higher correlations between the returns on two companies in the same or in different industries? In general, the correlations between the returns on companies in same industry are higher. For example, Ford s and GM s returns have a correlation coefficient of about 0.9 with one another, but their correlation is only about 0.6 with that of AT&T. A two-stock portfolio consisting of Ford and GM would be less well diversified than a two-stock portfolio of Ford and AT&T. 65
66 Risk-free security : A security whose return over the holding period is known with certainty. Frequently, the rate on short- to intermediate-term Treasury securities is used as a proxy for the risk-free rate. 66
67 Market Risk Unexpected changes in interest rates. Unexpected changes in cash flows due to tax rate changes, foreign competition, and the overall business cycle. 67
68 Company-unique Risk A company s labor force goes on strike. A company s top management dies in a plane crash. A huge oil tank bursts and floods a company s production area. 68
69 As you add stocks to your portfolio, company-unique risk is reduced. portfolio risk companyunique risk Market risk number of stocks 69
70 Do some firms have more market risk than others? Yes. For example: Interest rate changes affect all firms, but which would be more affected: a) Retail food chain b) Commercial bank 70
71 Do some firms have more market risk than others? Yes. For example: Interest rate changes affect all firms, but which would be more affected: a) Retail food chain b) Commercial bank 71
72 Note As we know, the market compensates investors for accepting risk - but only for market risk. Companyunique risk can and should be diversified away. So - we need to be able to measure market risk. 7
73 This is why we have Beta. Beta: a measure of market risk. Specifically, beta is a measure of how an individual stock s returns vary with market returns. It s a measure of the sensitivity of an individual stock s returns to changes in the market. 73
74 Capital Asset Pricing Model (CAPM) If investors are mainly concerned with the risk of their portfolio rather than the risk of the individual securities in the portfolio, how should the risk of an individual stock be measured? In important tool is the CAPM. CAPM concludes that the relevant risk of an individual stock is its contribution to the risk of a well-diversified portfolio. CAPM specifies a linear relationship between risk and required return. The equation used for CAPM is as follows: K i = K rf + β i (K m -K rf ) Where: K i = the required return for the individual security K rf = the risk-free rate of return β i = the beta of the individual security K m = the expected return on the market portfolio (K m -K rf ) is called the market risk premium This equation can be used to find any of the variables listed above, given the rest of the variables are known. 74
75 CAPM (Capital Asset Pricing Model) Investors demand a higher expected return for bearing higher risk. (risk aversion) If investors are primarily concerned with the riskiness of their portfolios rather than the risk of the individual securities in the portfolio, how should the riskiness of an individual stock be measured? The relevant riskiness of an individual stock is its contribution to the riskiness of a well-diversified portfolio. In this context, the well-diversified portfolio means a portfolio that does not have unsystematic risk (diversifiable risk), in other words, the well-diversified portfolio has only systematic risk (nondiversifiable risk) Market portfolio Are all stocks equally risk in the sense that adding them to the market portfolio would have the same effect on the portfolio's riskiness? No. Different stocks will affect the portfolio differently, so different securities have different degree of relevant risk. How can the relevant risk of an individual stock be measured? All risk except that related to broad market movements can be diversified away. The risk that remains after diversifying is systematic risk, or the risk that is inherent in the market. It can be measured by the degree to which a given stock tends to move up or down with the market. 75
76 Beta Measures a stock s market risk, and shows a stock s volatility relative to the market. Indicates how risky a stock is if the stock is held in a well-diversified portfolio. 76
77 Calculating betas Run a regression of past returns of a security against past returns on the market. The slope of the regression line (sometimes called the security s characteristic line) is defined as the beta coefficient for the security. 77
78 The market s beta is 1 A firm that has a beta = 1 has average market risk. The stock is no more or less volatile than the market. A firm with a beta > 1 is more volatile than the market. (ex: technology firms) A firm with a beta < 1 is less volatile than the market. (ex: utilities) 78
79 Calculating Beta XYZ Co. returns Beta = slope = 1.0 S&P 500 returns
80 Sample Beta Values America Online 1.6 AT&T 0.7 Battle Mountain Gold 0.3 Gillette 0.9 Intel 1.3 Southwest Airlines 1.5 Texaco
")
81 Risk of a Portfolio Capital Asset Pricing Model (CAPM) 81
82 CAPM - Beta Beta Coefficient, β A measure of the extent to which the returns on a given stock move with the stock market. β = 1 means If the market moves up by 10 percent, the stock will also move up by 10 percent, while if the market falls by 10 percent, the stock will fall by 10 percent. It will be just as risky as the average (market). Beta of the market portfolio is 1. β = 0.5 means The stock is only half as risky as the the market. β = means The stock is twice as risky as the market. If a stock whose beta is greater than 1.0 is added to a β = 1 portfolio, then the portfolio s beta, and consequently its riskiness, will increase. If a stock whose beta is less than 1.0 is added to a β = 1 portfolio, then the portfolio s beta, and consequently its riskiness, will decrease. Since a stock s beta measures its contribution to the riskiness of a portfolio, beta is the theoretically correct measure of the stock s riskiness. 8
83 Illustrating the calculation of beta _ k i Regression line: ^ k i = k M Year k M k i 1 15% 18% ^ _ k M 83
84 CAPM - Beta Return on the stock 35% 30% Stock H, high risk: β = 5% 0% Stock A, average risk: β = 1 15% 10% Stock L, low risk: β = 0.5 5% 0% -15% -10% -5% 0% 5% 10% 15% 0% 5% -5% -10% Return on the market -15% -0% -5% -30% -35% Return Year Stock H Stock A Stock L market portfolio % 10% 10% 10% 00 30% 0% 15% 0% % -10% 0% -10% 84
85 CAPM Beta, Summary 1. A stock s risk consists of two components, systematic risk and unsystematic risk.. Unsystematic risk can be eliminated by diversification. We are left, then, with only systematic risk. Systematic risk is the only relevant risk to a investor. 3. Investors must be compensated for bearing risk. However, compensation is required only for risk which cannot be eliminated by diversification. 4. The systematic risk of a stock is measured by its beta coefficient, which is an index of the stock s relative volatility. 5. Since a stock s beta coefficient determines how the stock affects the riskiness of a diversified portfolio, beta is the most relevant measure of any stock s risk. 85
86 CAPM Example Find the required return on a stock given that the risk-free rate is 8%, the expected return on the market portfolio is 1%, and the beta of the stock is. K i = K rf + β i (K m -K rf ) K i = 8% + (1% - 8%) K i = 16% Note that you can then compare the required rate of return to the expected rate of return. You would only invest in stocks where the expected rate of return exceeded the required rate of return. 86
87 Another CAPM Example Find the beta on a stock given that its expected return is 1%, the risk-free rate is 4%, and the expected return on the market portfolio is 10%. 1% = 4% + β i (10% - 4%) β i = 1% - 4% 10% - 4% β i = 1.33 Note that beta measures the stock s volatility (or risk) relative to the market. 87
88 Average Returns: The First Lesson Average annual = Σ yearly returns return number of years 88

89 1-89 Average Returns: The First Lesson McGraw Hill / Irwin by the McGraw- Hill Companies Inc.All rights reserved.
90 Average Returns: The First Lesson Risk-free rate The rate of return on a riskless investment. Risk premium The extra return on a risky asset over the risk-free rate; the reward for bearing risk. 90

91 Average Returns: The First Lesson McGraw Hill / Irwin by the McGraw- Hill Companies Inc.All rights reserved.
92 Return Variability Variance A common measure of volatility. Standard deviation The square root of the variance. Normal distribution A symmetric, bell-shaped frequency distribution that is completely defined by its average and standard deviation. 9
93 Return Variability Variance of return Var ( R) = i= 1 σ = N ( R R ) i N 1 where N is the number of returns Standard deviation of return ( R) = σ Var( R) SD = 93
94 Return Variability 94

95 Return Variability McGraw Hill / Irwin by the McGraw- Hill Companies Inc.All rights reserved.
96 Return Variability The greater the potential reward, the greater the risk. 96
97 Return Variability Top 1 One-Day Percentage Changes in the Dow Jones Industrial Average October 19, % March 14, % October 8, October 6, October 9, July 1, November 6, October 18, December 18, February 1, August 1, October 7, Source: Dow Jones 97

98 Risk and Return 98
99 Risk and Return The risk-free rate represents compensation for just waiting. So, it is often called the time value of money. If we are willing to bear risk, then we can expect to earn a risk premium, at least on average. Further, the more risk we are willing to bear, the greater is that risk premium. 99
100 Summary: We know how to measure risk, using standard deviation for overall risk and beta for market risk. We know how to reduce overall risk to only market risk through diversification. We need to know how to price risk so we will know how much extra return we should require for accepting extra risk. 100
101 Determining the Required Return The required rate of return for a particular investment depends on several factors, each of which depends on several other factors (i.e., it is pretty complex!): The two main factors for any investment are: The perceived riskiness of the investment The required returns on alternative investments An alternative way to look at this is that the required return is the sum of the RFR and a risk premium: ( ) ER RFR Risk emium i = + Pr
102 The Risk-free Rate of Return The risk-free rate is the rate of interest that is earned for simply delaying consumption It is also referred to as the pure time value of money The risk-free rate is determined by: The time preferences of individuals for consumption Relative ease or tightness in money market (supply & demand) Expected inflation The long-run growth rate of the economy Long-run growth of labor force Long-run growth of hours worked Long-run growth of productivity
103 The Risk Premium The risk premium is the return required in excess of the risk-free rate Theoretically, a risk premium could be assigned to every risk factor, but in practice this is impossible Therefore, we can say that the risk premium is a function of several major sources of risk: Business risk Financial leverage Liquidity risk Exchange rate risk
104 The MPT View of Required Returns Modern portfolio theory assumes that the required return is a function of the RFR, the market risk premium, and an index of systematic risk: ( ) ( ) β ( ) ER = R + ER R i f i M f This model is known as the Capital Asset Pricing Model (CAPM). It is also the equation for the Security Market Line (SML)
105 Risk and Return Graphically The Market Line Rate of Return RFR Risk β or σ
106 Portfolio Risk and Return A portfolio is a collection of assets (stocks, bonds, cars, houses, diamonds, etc) It is often convenient to think of a person owning several portfolios, but in reality you have only one portfolio (the one that comprises everything you own)
107 Expected Return of a Portfolio The expected return of a portfolio is a weighted average of the expected returns of its components: ( ) ER N P = wr i i i= 1 Note: w i is the proportion of the portfolio that is invested in security I, and R i is the expected return for security I.
108 Portfolio Risk The standard deviation of a portfolio is not a weighted average of the standard deviations of the individual securities. The riskiness of a portfolio depends on both the riskiness of the securities, and the way that they move together over time (correlation) This is because the riskiness of one asset may tend to be canceled by that of another asset
109 The Correlation Coefficient The correlation coefficient can range from to and describes how the returns move together through time. Perfect Positive Correlation Perfect Negative Correlation (r = 1) (r = -1) Stock 1 Stock 3 Returns (%) Returns (%) Stock Stock 4 Time Time
110 The Portfolio Standard Deviation The portfolio standard deviation can be thought of as a weighted average of the individual standard deviations plus terms that account for the co-movement of returns For a two-security portfolio: σ = w σ + w σ + r σ σ w w P 1 1, 1 1 1
111 An Example: Perfect Pos. Correlation Potential Returns State of Economy Probability ABC XYZ 50/50 Portfolio Recession 5% % % % Moderate Growth 50% 8% 8% 8% Boom 5% 14% 14% 14% Expected Return 8% 8% 8% Standard Deviation 4.4% 4.4% 4.4% Correlation 1.00 ( ) ( ) ( )( )( )( )( ) σ P = =
112 An Example: Perfect Neg. Correlation Potential Returns State of Economy Probability ABC XYZ 50/50 Portfolio Recession 5% % 14% 8% Moderate Growth 50% 8% 8% 8% Boom 5% 14% % 8% Expected Return 8% 8% 8% Standard Deviation 4.4% 4.4% 0.00% Correlation ( ) ( ) ( )( )( )( )( ) σ P = = 0. 00
113 An Example: Zero Correlation Potential Returns State of Economy Probability ABC XYZ 50/50 Portfolio Recession 5% % % % Moderate Growth 50% 8% % 5% Boom 5% 14% % 8% Expected Return 8% % 5% Standard Deviation 4.4% 0.00%.1% Correlation 0.00 ( ) ( ) ( )( )( )( )( ) σ P = = 0. 01
114 Interpreting the Examples In the three previous examples, we calculated the portfolio standard deviation under three alternative correlations. Here s the moral: The lower the correlation, the more risk reduction (diversification) you will achieve. Correlation Risk Reduction None Major (to risk-free in this example) 0.00 Lots (cut risk in half in this example)
115 CAPM Required rate of return Required rate of return on market portfolio consists of risk-free rate and market risk premium. R = R + RP M Market risk premium: The additional return over the risk-free rate needed to compensate investors for assuming an systematic risk. RP = R R Required rate of return on individual stock, j, also consists of risk-free rate and risk premium of j. j M f f M M R = R + RP If we know the market risk premium, RP M, and beta for the individual stock, β j, then risk premium for stock j, RP = β j RP M Therefore, required rate of return on the individual stock, j, can be represented by j f j R j = R f + RP j = R f + RP M j f ( RM R f ) β j β = R + R j = R f + ( RM R f ) β j Equation for Security Market Line (SML) 115
116 Examples Assume: the historic market risk premium has been about 8.5%. The riskfree rate is currently 5%. GTX Corp. has β a beta of.85. What return should you expect from an investment in GTX? E(R i ) = R f + [E(R M ) - R f ] x i E(R GTX ) = 5% + 8.5% x.85 = 1.5% 116
117 The Security Market Line (SML): Calculating required rates of return SML: k i = k RF + (k M k RF ) β i Assume k RF = 8% and k M = 15%. The market (or equity) risk premium is RP M = k M k RF = 15% 8% = 7%. 117
118 CAPM - Beta Security Market Line (SML) A line that describes the linear relationship between required rates of return for individual securities (and portfolios) and systematic risk, as measured by beta. Required Rate of Return SML R M M Risk Premium R f Risk-free Return 1.0 Systematic Risk (beta) 118
119 What is the market risk premium? Additional return over the risk-free rate needed to compensate investors for assuming an average amount of risk. Its size depends on the perceived risk of the stock market and investors degree of risk aversion. Varies from year to year, but most estimates suggest that it ranges between 4% and 8% per year. 119
120 CAPM R M R f : Market Risk Premium In equilibrium, expected return is the same as the required rate of return, so E (R j ) = R f + (E(R M ) R f ) * β j E(R M ) R f : Market Risk Premium R f : Risk-free rate β j : Index of systematic risk for stock, j The rate on short- to intermediate-term Treasury securities is used as a proxy for the risk-free rate. Market Portfolio As a proxy for the market portfolio, most people use the Standard & Poor s 500 Stock Price Index (S&P 500 Index)*. E(R M ) R f : Expected Market Risk Premium β j R j = R f + (R M R f ) * β j Usually the historical average of risk premium of S&P 500 Index is used as the proxy for the expected market risk premium. The expected risk premium for the S&P 500 Index has generally ranged from 5 to 8 percent. : Index of systematic risk for stock, j R j : market required rate of return on stock j R M : required rate of return on market portfolio E (R j ) : Expected return or market required rate of return R f : Risk-free rate E(R M ) : Expected return on market portfolio Financial economists estimate the beta for each individual stock. The slope coefficient of historical relationship between returns on the market portfolio and an individual stock s returns. * S&P 500 Index : A market-value-weighted index of 500 large-capitalization common stocks selected from a broad cross section of industry group. It is used as a measure of overall market performance. 10
121 Calculating required rates of return k HT = 8.0% + (15.0% - 8.0%)(1.30) = 8.0% + (7.0%)(1.30) = 8.0% + 9.1% = 17.10% k M = 8.0% + (7.0%)(1.00) = 15.00% k USR = 8.0% + (7.0%)(0.89) = 14.3% k T-bill = 8.0% + (7.0%)(0.00) = 8.00% k Coll = 8.0% + (7.0%)(-0.87) = 1.91% 11
122 Expected vs. Required returns HT Market USR T - bills Coll. ^ k 17.4% k 17.1% Undervalued (k Fairly valued (k ^ Overvalued (k Fairly valued (k ^ Overvalued (k ^ ^ < ^ > k) = k) k) = k) < k) 1
123 Illustrating the Security Market Line SML: k i = 8% + (15% 8%) β i k i (%) k M = 15 HT... SML k RF = 8. Coll.. USR T-bills Risk, β i 13
124 An example: Equally-weighted two-stock portfolio Create a portfolio with 50% invested in HT and 50% invested in Collections. The beta of a portfolio is the weighted average of each of the stock s betas. β P = w HT β HT + w Coll β Coll β P = 0.5 (1.30) (-0.87) β P =
125 Calculating portfolio required returns The required return of a portfolio is the weighted average of each of the stock s required returns. k P = w HT k HT + w Coll k Coll k P = 0.5 (17.1%) (1.9%) k P = 9.5% Or, using the portfolio s beta, CAPM can be used to solve for expected return. k P = k RF + (k M k RF ) β P k P = 8.0% + (15.0% 8.0%) (0.15) k P = 9.5% 15
126 Factors that change the SML What if investors raise inflation expectations by 3%, what would happen to the SML? k i (%) I = 3% SML SML Risk, β i 16
127 Factors that change the SML What if investors risk aversion increased, causing the market risk premium to increase by 3%, what would happen to the SML? k i (%) SML RP M = 3% SML Risk, β i 17
128 Verifying the CAPM empirically The CAPM has not been verified completely. Statistical tests have problems that make verification almost impossible. Some argue that there are additional risk factors, other than the market risk premium, that must be considered. 18
129 More thoughts on the CAPM Investors seem to be concerned with both market risk and total risk. Therefore, the SML may not produce a correct estimate of k i. k i = k RF + (k M k RF ) β i +??? CAPM/SML concepts are based upon expectations, but betas are calculated using historical data. A company s historical data may not reflect investors expectations about future riskiness. 19
130 What is the Required Rate of Return? The return on an investment required by an investor given market interest rates and the investment s risk. 130
131 Required rate of return Risk-free = rate of + return Risk premium market risk companyunique risk 131
132 Required rate of return Risk-free = rate of + return Risk premium market risk companyunique risk can be diversified away 13
133 Required rate of return Let s try to graph this relationship! Beta 133
134 Required rate of return 1%. Risk-free rate of return (6%) 1 Beta 134
135 Required rate of return 1%. security market line (SML) Risk-free rate of return (6%) 1 Beta 135
136 This linear relationship between risk and required return is known as the Capital Asset Pricing Model (CAPM). 136
137 Required rate of return SML 1%. Risk-free rate of return (6%) 0 1 Beta 137
138 Required rate of return Is there a riskless (zero beta) security? SML 1%. Risk-free rate of return (6%) 0 1 Beta 138
139 Required rate of return Is there a riskless (zero beta) security? SML 1% Risk-free rate of return (6%). Treasury securities are as close to riskless as possible. 0 1 Beta 139
140 Required rate of return Where does the S&P 500 fall on the SML? SML 1%. Risk-free rate of return (6%) 0 1 Beta 140
141 Required rate of return Where does the S&P 500 fall on the SML? SML 1%. Risk-free rate of return (6%) The S&P 500 is a good approximation for the market 0 1 Beta 141
142 Required rate of return 1% Utility Stocks. SML Risk-free rate of return (6%) 0 1 Beta 14
143 Required rate of return High-tech stocks SML 1%. Risk-free rate of return (6%) 0 1 Beta 143
144 The CAPM equation: k j = k rf + j (k m -k rf ) where: kj = the required return on security j, krf = the risk-free rate of interest, β β j = the beta of security j, and km = the return on the market index. 144
145 Example: Suppose the Treasury bond rate is 6%, the average return on the S&P 500 index is 1%, and Walt Disney has a beta of 1.. According to the CAPM, what should be the required rate of return on Disney stock? 145
146 k = k + (k β -k ) j rf m rf k j = ( ) k j =.13 = 13.% According to the CAPM, Disney stock should be priced to give a 13.% return. 146
147 Required rate of return SML 1%. Risk-free rate of return (6%) 0 1 Beta 147
148 Required rate of return 1% Theoretically, every security should lie on the SML. SML Risk-free rate of return (6%) 0 1 Beta 148
149 Required rate of return Theoretically, every security should lie on the SML SML 1% Risk-free rate of return (6%). If every stock is on the SML, investors are being fully compensated for risk. 0 1 Beta 149
150 Required rate of return 1% If a security is above the SML, it is underpriced.. SML Risk-free rate of return (6%) 0 1 Beta 150
151 Required rate of return 1% If a security is above the SML, it is underpriced.. SML Risk-free rate of return (6%) If a security is below the SML, it is overpriced. 0 1 Beta 151
152 PROBLEMS 15
153 Problems on Portfolio Problem 1 The yield to maturity (YTM) on a Treasury Bond whose remaining maturity is one year is 5%. Jackie wants to invest her money for one year into the Treasury Bond or XYZ stock or into both of them. She believes that expected return and standard deviation of XYZ stock are 14% and 0%, respectively. Jackie doesn t like either asset because return on the Treasury Bond is too little and standard deviation of XYZ is too large. If her maximum tolerance towards risk (measured by standard deviation) is 15%. What is the best portfolio to her satisfying her risk tolerance? 153
154 Problems on Portfolio Problem Harry doesn t like them, either, because he wants higher expected return. Suppose that Harry wants at least 18% of expected return (return objective) and that he can borrow money at the risk-free rate. What is the best portfolio to him satisfying his return objective? 154
155 Problems on Portfolio Problem 3 Suppose that stock I and J are available to you and have the following statistical characteristics; I J Expected Return Variance Standard Deviation Covariance Correlation Coefficient Construct the minimum risk (minimum variance) portfolio. 155
156 Problems on Portfolio Problem 3 Using Excel Spreadsheet, WI WJ RP Sigma P % 10.00% % 9.50% % 9.1% % 8.87% % 8.76% % 8.80% % 8.99% % 9.31% % 9.76% % 10.31% % 10.95% % 11.67% % 1.46% % 13.9% % 14.17% % 15.08% % 16.0% % 16.99% % 17.98% % 18.98% % 0.00% Expected Return Expected Return vs. Standard Deviation 30.00% 5.00% 0.00% 15.00% 10.00% 5.00% 0.00% 0.00% 5.00% 10.00% 15.00% 0.00% 5.00% Standard Deviation 156
CHAPTER 8 Risk and Rates of Return
 CHAPTER 8 Risk and Rates of Return Stand-alone risk Portfolio risk Risk & return: CAPM The basic goal of the firm is to: maximize shareholder wealth! 1 Investment returns The rate of return on an investment
Archana Khetan 05/09/ MAFA (CA Final) - Portfolio Management
 - Portfolio Management") Archana Khetan 05/09/2010 +91-9930812722 Archana090@hotmail.com MAFA (CA Final) - Portfolio Management 1 Portfolio Management Portfolio is a collection of assets. By investing in a portfolio or combination
Archana Khetan 05/09/2010 +91-9930812722 Archana090@hotmail.com MAFA (CA Final) - Portfolio Management 1 Portfolio Management Portfolio is a collection of assets. By investing in a portfolio or combination
CHAPTER 2 RISK AND RETURN: Part I
 CHAPTER 2 RISK AND RETURN: Part I (Difficulty Levels: Easy, Easy/Medium, Medium, Medium/Hard, and Hard) Please see the preface for information on the AACSB letter indicators (F, M, etc.) on the subject
Risk and Return and Portfolio Theory
 Risk and Return and Portfolio Theory Intro: Last week we learned how to calculate cash flows, now we want to learn how to discount these cash flows. This will take the next several weeks. We know discount
Analysis INTRODUCTION OBJECTIVES
 Chapter5 Risk Analysis OBJECTIVES At the end of this chapter, you should be able to: 1. determine the meaning of risk and return; 2. explain the term and usage of statistics in determining risk and return;
CHAPTER 11 RETURN AND RISK: THE CAPITAL ASSET PRICING MODEL (CAPM)
") CHAPTER 11 RETURN AND RISK: THE CAPITAL ASSET PRICING MODEL (CAPM) Answers to Concept Questions 1. Some of the risk in holding any asset is unique to the asset in question. By investing in a variety of
CHAPTER 11 RETURN AND RISK: THE CAPITAL ASSET PRICING MODEL (CAPM) Answers to Concept Questions 1. Some of the risk in holding any asset is unique to the asset in question. By investing in a variety of
Ch. 8 Risk and Rates of Return. Return, Risk and Capital Market. Investment returns
 Ch. 8 Risk and Rates of Return Topics Measuring Return Measuring Risk Risk & Diversification CAPM Return, Risk and Capital Market Managers must estimate current and future opportunity rates of return for
Chapter 11. Return and Risk: The Capital Asset Pricing Model (CAPM) Copyright 2013 by The McGraw-Hill Companies, Inc. All rights reserved.
 Copyright 2013 by The McGraw-Hill Companies, Inc. All rights reserved.") Chapter 11 Return and Risk: The Capital Asset Pricing Model (CAPM) McGraw-Hill/Irwin Copyright 2013 by The McGraw-Hill Companies, Inc. All rights reserved. 11-0 Know how to calculate expected returns Know
Chapter 11 Return and Risk: The Capital Asset Pricing Model (CAPM) McGraw-Hill/Irwin Copyright 2013 by The McGraw-Hill Companies, Inc. All rights reserved. 11-0 Know how to calculate expected returns Know
Chapter 13 Return, Risk, and Security Market Line
 1 Chapter 13 Return, Risk, and Security Market Line Konan Chan Financial Management, Spring 2018 Topics Covered Expected Return and Variance Portfolio Risk and Return Risk & Diversification Systematic
CHAPTER 2 RISK AND RETURN: PART I
 1. The tighter the probability distribution of its expected future returns, the greater the risk of a given investment as measured by its standard deviation. False Difficulty: Easy LEARNING OBJECTIVES:
University 18 Lessons Financial Management. Unit 12: Return, Risk and Shareholder Value
 University 18 Lessons Financial Management Unit 12: Return, Risk and Shareholder Value Risk and Return Risk and Return Security analysis is built around the idea that investors are concerned with two principal
Portfolio Management
 Portfolio Management Risk & Return Return Income received on an investment (Dividend) plus any change in market price( Capital gain), usually expressed as a percent of the beginning market price of the
Chapter 5. Asset Allocation - 1. Modern Portfolio Concepts
 Asset Allocation - 1 Asset Allocation: Portfolio choice among broad investment classes. Chapter 5 Modern Portfolio Concepts Asset Allocation between risky and risk-free assets Asset Allocation with Two
Lecture 10-12: CAPM.
 Lecture 10-12: CAPM. I. Reading II. Market Portfolio. III. CAPM World: Assumptions. IV. Portfolio Choice in a CAPM World. V. Minimum Variance Mathematics. VI. Individual Assets in a CAPM World. VII. Intuition
Return, Risk, and the Security Market Line
 Chapter 13 Key Concepts and Skills Return, Risk, and the Security Market Line Know how to calculate expected returns Understand the impact of diversification Understand the systematic risk principle Understand
RETURN AND RISK: The Capital Asset Pricing Model
 RETURN AND RISK: The Capital Asset Pricing Model (BASED ON RWJJ CHAPTER 11) Return and Risk: The Capital Asset Pricing Model (CAPM) Know how to calculate expected returns Understand covariance, correlation,
Gatton College of Business and Economics Department of Finance & Quantitative Methods. Chapter 13. Finance 300 David Moore
 Gatton College of Business and Economics Department of Finance & Quantitative Methods Chapter 13 Finance 300 David Moore Weighted average reminder Your grade 30% for the midterm 50% for the final. Homework
Return and Risk: The Capital-Asset Pricing Model (CAPM)
") Return and Risk: The Capital-Asset Pricing Model (CAPM) Expected Returns (Single assets & Portfolios), Variance, Diversification, Efficient Set, Market Portfolio, and CAPM Expected Returns and Variances
Return and Risk: The Capital-Asset Pricing Model (CAPM) Expected Returns (Single assets & Portfolios), Variance, Diversification, Efficient Set, Market Portfolio, and CAPM Expected Returns and Variances
Title: Introduction to Risk, Return and the Opportunity Cost of Capital Speaker: Rebecca Stull Created by: Gene Lai. online.wsu.
 Title: Introduction to Risk, Return and the Opportunity Cost of Capital Speaker: Rebecca Stull Created by: Gene Lai online.wsu.edu MODULE 8 INTRODUCTION TO RISK AND RETURN, AND THE OPPORTUNITY COST OF
CHAPTER 1 AN OVERVIEW OF THE INVESTMENT PROCESS
 CHAPTER 1 AN OVERVIEW OF THE INVESTMENT PROCESS TRUE/FALSE 1. The rate of exchange between certain future dollars and certain current dollars is known as the pure rate of interest. ANS: T 2. An investment
Lecture 5. Return and Risk: The Capital Asset Pricing Model
 Lecture 5 Return and Risk: The Capital Asset Pricing Model Outline 1 Individual Securities 2 Expected Return, Variance, and Covariance 3 The Return and Risk for Portfolios 4 The Efficient Set for Two Assets
General Notation. Return and Risk: The Capital Asset Pricing Model
 Return and Risk: The Capital Asset Pricing Model (Text reference: Chapter 10) Topics general notation single security statistics covariance and correlation return and risk for a portfolio diversification
Answers to Concepts in Review
 Answers to Concepts in Review 1. A portfolio is simply a collection of investment vehicles assembled to meet a common investment goal. An efficient portfolio is a portfolio offering the highest expected
FIN 6160 Investment Theory. Lecture 7-10
 FIN 6160 Investment Theory Lecture 7-10 Optimal Asset Allocation Minimum Variance Portfolio is the portfolio with lowest possible variance. To find the optimal asset allocation for the efficient frontier
Risk and Return (Introduction) Professor: Burcu Esmer
 Professor: Burcu Esmer") Risk and Return (Introduction) Professor: Burcu Esmer 1 Overview Rates of Return: A Review A Century of Capital Market History Measuring Risk Risk & Diversification Thinking About Risk Measuring Market
Risk and Return (Introduction) Professor: Burcu Esmer 1 Overview Rates of Return: A Review A Century of Capital Market History Measuring Risk Risk & Diversification Thinking About Risk Measuring Market
Chapter. Return, Risk, and the Security Market Line. McGraw-Hill/Irwin. Copyright 2008 by The McGraw-Hill Companies, Inc. All rights reserved.
 Chapter Return, Risk, and the Security Market Line McGraw-Hill/Irwin Copyright 2008 by The McGraw-Hill Companies, Inc. All rights reserved. Return, Risk, and the Security Market Line Our goal in this chapter
CHAPTER 5: ANSWERS TO CONCEPTS IN REVIEW
 CHAPTER 5: ANSWERS TO CONCEPTS IN REVIEW 5.1 A portfolio is simply a collection of investment vehicles assembled to meet a common investment goal. An efficient portfolio is a portfolio offering the highest
Define risk, risk aversion, and riskreturn
 Risk and 1 Learning Objectives Define risk, risk aversion, and riskreturn tradeoff. Measure risk. Identify different types of risk. Explain methods of risk reduction. Describe how firms compensate for
Chapter 5: Answers to Concepts in Review
 Chapter 5: Answers to Concepts in Review 1. A portfolio is simply a collection of investment vehicles assembled to meet a common investment goal. An efficient portfolio is a portfolio offering the highest
Lecture 8 & 9 Risk & Rates of Return
 Lecture 8 & 9 Risk & Rates of Return We start from the basic premise that investors LIKE return and DISLIKE risk. Therefore, people will invest in risky assets only if they expect to receive higher returns.
Chapter 12 RISK & RETURN: PORTFOLIO APPROACH. Alex Tajirian
 Chapter 12 RISK & RETURN: PORTFOLIO APPROACH Alex Tajirian Risk & Return: Portfolio Approach 12-2 1. OBJECTIVE! What type of risk do investors care about? Is it "volatility"?...! What is the risk premium
An investment s return is your reward for investing. An investment s risk is the uncertainty of what will happen with your investment dollar.
 Chapter 7 An investment s return is your reward for investing. An investment s risk is the uncertainty of what will happen with your investment dollar. The relationship between risk and return is a tradeoff.
KEIR EDUCATIONAL RESOURCES
 INVESTMENT PLANNING 2017 Published by: KEIR EDUCATIONAL RESOURCES 4785 Emerald Way Middletown, OH 45044 1-800-795-5347 1-800-859-5347 FAX E-mail customerservice@keirsuccess.com www.keirsuccess.com TABLE
INTRODUCTION TO RISK AND RETURN IN CAPITAL BUDGETING Chapters 7-9
 INTRODUCTION TO RISK AND RETURN IN CAPITAL BUDGETING Chapters 7-9 WE ALL KNOW: THE GREATER THE RISK THE GREATER THE REQUIRED (OR EXPECTED) RETURN... Expected Return Risk-free rate Risk... BUT HOW DO WE
Foundations of Finance
 Lecture 5: CAPM. I. Reading II. Market Portfolio. III. CAPM World: Assumptions. IV. Portfolio Choice in a CAPM World. V. Individual Assets in a CAPM World. VI. Intuition for the SML (E[R p ] depending
Copyright 2009 Pearson Education Canada
 Operating Cash Flows: Sales $682,500 $771,750 $868,219 $972,405 $957,211 less expenses $477,750 $540,225 $607,753 $680,684 $670,048 Difference $204,750 $231,525 $260,466 $291,722 $287,163 After-tax (1
J B GUPTA CLASSES , Copyright: Dr JB Gupta. Chapter 4 RISK AND RETURN.
 J B GUPTA CLASSES 98184931932, drjaibhagwan@gmail.com, www.jbguptaclasses.com Copyright: Dr JB Gupta Chapter 4 RISK AND RETURN Chapter Index Systematic and Unsystematic Risk Capital Asset Pricing Model
CHAPTER 1 THE INVESTMENT SETTING
 CHAPTER 1 THE INVESTMENT SETTING TRUE/FALSE 1. The rate of exchange between certain future dollars and certain current dollars is known as the pure rate of interest. ANS: T PTS: 1 2. An investment is the
Risk and Return: From Securities to Portfolios
 FIN 614 Risk and Return 2: Portfolios Professor Robert B.H. Hauswald Kogod School of Business, AU Risk and Return: From Securities to Portfolios From securities individual risk and return characteristics
Chapter 13 Return, Risk, and the Security Market Line
 Chapter 13 Return, Risk, and the Security Market Line 1. You own a stock that you think will produce a return of 11 percent in a good economy and 3 percent in a poor economy. Given the probabilities of
OPTIMAL RISKY PORTFOLIOS- ASSET ALLOCATIONS. BKM Ch 7
 OPTIMAL RISKY PORTFOLIOS- ASSET ALLOCATIONS BKM Ch 7 ASSET ALLOCATION Idea from bank account to diversified portfolio Discussion principles are the same for any number of stocks A. bonds and stocks B.
Sample Midterm Questions Foundations of Financial Markets Prof. Lasse H. Pedersen
 Sample Midterm Questions Foundations of Financial Markets Prof. Lasse H. Pedersen 1. Security A has a higher equilibrium price volatility than security B. Assuming all else is equal, the equilibrium bid-ask
Chapter 8 Risk and Rates of Return
 Chapter 8 Risk and Rates of Return Answers to End-of-Chapter Questions 8-1 a. No, it is not riskless. The portfolio would be free of default risk and liquidity risk, but inflation could erode the portfolio
KEIR EDUCATIONAL RESOURCES
 INVESTMENT PLANNING 2015 Published by: KEIR EDUCATIONAL RESOURCES 4785 Emerald Way Middletown, OH 45044 1-800-795-5347 1-800-859-5347 FAX E-mail customerservice@keirsuccess.com www.keirsuccess.com 2015
Microéconomie de la finance
 Microéconomie de la finance 7 e édition Christophe Boucher christophe.boucher@univ-lorraine.fr 1 Chapitre 6 7 e édition Les modèles d évaluation d actifs 2 Introduction The Single-Index Model - Simplifying
Chapter 10. Chapter 10 Topics. What is Risk? The big picture. Introduction to Risk, Return, and the Opportunity Cost of Capital
 1 Chapter 10 Introduction to Risk, Return, and the Opportunity Cost of Capital Chapter 10 Topics Risk: The Big Picture Rates of Return Risk Premiums Expected Return Stand Alone Risk Portfolio Return and
Risk and Return - Capital Market Theory. Chapter 8
 1 Risk and Return - Capital Market Theory Chapter 8 Learning Objectives 2 1. Calculate the expected rate of return and volatility for a portfolio of investments and describe how diversification affects
When we model expected returns, we implicitly model expected prices
 Week 1: Risk and Return Securities: why do we buy them? To take advantage of future cash flows (in the form of dividends or selling a security for a higher price). How much should we pay for this, considering
Adjusting discount rate for Uncertainty
 Page 1 Adjusting discount rate for Uncertainty The Issue A simple approach: WACC Weighted average Cost of Capital A better approach: CAPM Capital Asset Pricing Model Massachusetts Institute of Technology
For each of the questions 1-6, check one of the response alternatives A, B, C, D, E with a cross in the table below:
 November 2016 Page 1 of (6) Multiple Choice Questions (3 points per question) For each of the questions 1-6, check one of the response alternatives A, B, C, D, E with a cross in the table below: Question
PowerPoint. to accompany. Chapter 11. Systematic Risk and the Equity Risk Premium
 PowerPoint to accompany Chapter 11 Systematic Risk and the Equity Risk Premium 11.1 The Expected Return of a Portfolio While for large portfolios investors should expect to experience higher returns for
CHAPTER III RISK MANAGEMENT
 CHAPTER III RISK MANAGEMENT Concept of Risk Risk is the quantified amount which arises due to the likelihood of the occurrence of a future outcome which one does not expect to happen. If one is participating
4. D Spread to treasuries. Spread to treasuries is a measure of a corporate bond s default risk.
 www.liontutors.com FIN 301 Final Exam Practice Exam Solutions 1. C Fixed rate par value bond. A bond is sold at par when the coupon rate is equal to the market rate. 2. C As beta decreases, CAPM will decrease
Risk and Return Fundamentals. Risk, Return, and Asset Pricing Model. Risk and Return Fundamentals: Risk and Return Defined
 Risk and Return Fundamentals Risk, Return, and Asset Pricing Model Financial Risk Management Nattawut Jenwittayaroje, PhD, CFA NIDA Business School National Institute of Development Administration In most
Models of Asset Pricing
 appendix1 to chapter 5 Models of Asset Pricing In Chapter 4, we saw that the return on an asset (such as a bond) measures how much we gain from holding that asset. When we make a decision to buy an asset,
Portfolio Theory and Diversification
 Topic 3 Portfolio Theoryand Diversification LEARNING OUTCOMES By the end of this topic, you should be able to: 1. Explain the concept of portfolio formation;. Discuss the idea of diversification; 3. Calculate
1 A Brief History of. Chapter. Risk and Return. Dollar Returns. PercentReturn. Learning Objectives. A Brief History of Risk and Return
 Chapter Learning Objectives To become a wise investor (maybe even one with too much money), you need to know: 1 A Brief History of Risk and Return How to calculate the return on an investment using different
BOND ANALYTICS. Aditya Vyas IDFC Ltd.
 BOND ANALYTICS Aditya Vyas IDFC Ltd. Bond Valuation-Basics The basic components of valuing any asset are: An estimate of the future cash flow stream from owning the asset The required rate of return for
Risk and Return - Capital Market Theory. Chapter 8
 Risk and Return - Capital Market Theory Chapter 8 Principles Applied in This Chapter Principle 2: There is a Risk-Return Tradeoff. Principle 4: Market Prices Reflect Information. Portfolio Returns and
Risk and Return. CA Final Paper 2 Strategic Financial Management Chapter 7. Dr. Amit Bagga Phd.,FCA,AICWA,Mcom.
 Risk and Return CA Final Paper 2 Strategic Financial Management Chapter 7 Dr. Amit Bagga Phd.,FCA,AICWA,Mcom. Learning Objectives Discuss the objectives of portfolio Management -Risk and Return Phases
CHAPTER 10 SOME LESSONS FROM CAPITAL MARKET HISTORY
 CHAPTER 10 SOME LESSONS FROM CAPITAL MARKET HISTORY Answers to Concepts Review and Critical Thinking Questions 3. No, stocks are riskier. Some investors are highly risk averse, and the extra possible return
15.414: COURSE REVIEW. Main Ideas of the Course. Approach: Discounted Cashflows (i.e. PV, NPV): CF 1 CF 2 P V = (1 + r 1 ) (1 + r 2 ) 2
: CF 1 CF 2 P V = (1 + r 1 ) (1 + r 2 ) 2") 15.414: COURSE REVIEW JIRO E. KONDO Valuation: Main Ideas of the Course. Approach: Discounted Cashflows (i.e. PV, NPV): and CF 1 CF 2 P V = + +... (1 + r 1 ) (1 + r 2 ) 2 CF 1 CF 2 NP V = CF 0 + + +...
15.414: COURSE REVIEW JIRO E. KONDO Valuation: Main Ideas of the Course. Approach: Discounted Cashflows (i.e. PV, NPV): and CF 1 CF 2 P V = + +... (1 + r 1 ) (1 + r 2 ) 2 CF 1 CF 2 NP V = CF 0 + + +...
Risk, return, and diversification
 Risk, return, and diversification A reading prepared by Pamela Peterson Drake O U T L I N E 1. Introduction 2. Diversification and risk 3. Modern portfolio theory 4. Asset pricing models 5. Summary 1.
Risks and Rate of Return
 Risks and Rate of Return Definition of Risk Risk is a chance of financial loss or the variability of returns associated with a given asset A $1000 holder government bond guarantees its holder $5 interest
10. Lessons From Capital Market History
 10. Lessons From Capital Market History Chapter Outline How to measure returns The lessons from the capital market history Return: Expected returns Risk: the variability of returns 1 1 Risk, Return and
CHAPTER 9: THE CAPITAL ASSET PRICING MODEL
 CHAPTER 9: THE CAPITAL ASSET PRICING MODEL 1. E(r P ) = r f + β P [E(r M ) r f ] 18 = 6 + β P(14 6) β P = 12/8 = 1.5 2. If the security s correlation coefficient with the market portfolio doubles (with
Final Exam Suggested Solutions
 University of Washington Fall 003 Department of Economics Eric Zivot Economics 483 Final Exam Suggested Solutions This is a closed book and closed note exam. However, you are allowed one page of handwritten
Financial Markets. Laurent Calvet. John Lewis Topic 13: Capital Asset Pricing Model (CAPM)
") Financial Markets Laurent Calvet calvet@hec.fr John Lewis john.lewis04@imperial.ac.uk Topic 13: Capital Asset Pricing Model (CAPM) HEC MBA Financial Markets Risk-Adjusted Discount Rate Method We need a
Financial Markets Laurent Calvet calvet@hec.fr John Lewis john.lewis04@imperial.ac.uk Topic 13: Capital Asset Pricing Model (CAPM) HEC MBA Financial Markets Risk-Adjusted Discount Rate Method We need a
Chapter 13 Return, Risk, and the Security Market Line
 T13.1 Chapter Outline Chapter Organization Chapter 13 Return, Risk, and the Security Market Line! 13.1 Expected Returns and Variances! 13.2 Portfolios! 13.3 Announcements, Surprises, and Expected Returns!
Financial Markets 11-1
 Financial Markets Laurent Calvet calvet@hec.fr John Lewis john.lewis04@imperial.ac.uk Topic 11: Measuring Financial Risk HEC MBA Financial Markets 11-1 Risk There are many types of risk in financial transactions
MBF2263 Portfolio Management. Lecture 8: Risk and Return in Capital Markets
 MBF2263 Portfolio Management Lecture 8: Risk and Return in Capital Markets 1. A First Look at Risk and Return We begin our look at risk and return by illustrating how the risk premium affects investor
Harvard Business School Diversification, the Capital Asset Pricing Model, and the Cost of Equity Capital
 Harvard Business School 9-276-183 Rev. November 10, 1993 Diversification, the Capital Asset Pricing Model, and the Cost of Equity Capital Risk as Variability in Return The rate of return an investor receives
FINC 430 TA Session 7 Risk and Return Solutions. Marco Sammon
 FINC 430 TA Session 7 Risk and Return Solutions Marco Sammon Formulas for return and risk The expected return of a portfolio of two risky assets, i and j, is Expected return of asset - the percentage of
CHAPTER 9: THE CAPITAL ASSET PRICING MODEL
 CHAPTER 9: THE CAPITAL ASSET PRICING MODEL 1. E(r P ) = r f + β P [E(r M ) r f ] 18 = 6 + β P(14 6) β P = 12/8 = 1.5 2. If the security s correlation coefficient with the market portfolio doubles (with
COMM 324 INVESTMENTS AND PORTFOLIO MANAGEMENT ASSIGNMENT 2 Due: October 20
 COMM 34 INVESTMENTS ND PORTFOLIO MNGEMENT SSIGNMENT Due: October 0 1. In 1998 the rate of return on short term government securities (perceived to be risk-free) was about 4.5%. Suppose the expected rate
Uniwersytet Ekonomiczny. George Matysiak. Presentation outline. Motivation for Performance Analysis
 Uniwersytet Ekonomiczny George Matysiak Performance measurement 30 th November, 2015 Presentation outline Risk adjusted performance measures Assessing investment performance Risk considerations and ranking
- P P THE RELATION BETWEEN RISK AND RETURN. Article by Dr. Ray Donnelly PhD, MSc., BComm, ACMA, CGMA Examiner in Strategic Corporate Finance
 THE RELATION BETWEEN RISK AND RETURN Article by Dr. Ray Donnelly PhD, MSc., BComm, ACMA, CGMA Examiner in Strategic Corporate Finance 1. Introduction and Preliminaries A fundamental issue in finance pertains
Finance Concepts I: Present Discounted Value, Risk/Return Tradeoff
 Finance Concepts I: Present Discounted Value, Risk/Return Tradeoff Federal Reserve Bank of New York Central Banking Seminar Preparatory Workshop in Financial Markets, Instruments and Institutions Anthony
Monetary Economics Risk and Return, Part 2. Gerald P. Dwyer Fall 2015
 Monetary Economics Risk and Return, Part 2 Gerald P. Dwyer Fall 2015 Reading Malkiel, Part 2, Part 3 Malkiel, Part 3 Outline Returns and risk Overall market risk reduced over longer periods Individual
 FINALTERM EXAMINATION Spring 2009 MGT201- Financial Management (Session - 2) Question No: 1 ( Marks: 1 ) - Please choose one What is the long-run objective of financial management? Maximize earnings per
Capital Asset Pricing Model - CAPM
 Capital Asset Pricing Model - CAPM The capital asset pricing model (CAPM) is a model that describes the relationship between systematic risk and expected return for assets, particularly stocks. CAPM is
UNCERTAINTY AND INFORMATION
 UNCERTAINTY AND INFORMATION M. En C. Eduardo Bustos Farías 1 Objectives After studying this chapter, you will be able to: Explain how people make decisions when they are uncertain about the consequences
Chapter. Diversification and Risky Asset Allocation. McGraw-Hill/Irwin. Copyright 2008 by The McGraw-Hill Companies, Inc. All rights reserved.
 Chapter Diversification and Risky Asset Allocation McGraw-Hill/Irwin Copyright 008 by The McGraw-Hill Companies, Inc. All rights reserved. Diversification Intuitively, we all know that if you hold many
Principles of Finance Risk and Return. Instructor: Xiaomeng Lu
 Principles of Finance Risk and Return Instructor: Xiaomeng Lu 1 Course Outline Course Introduction Time Value of Money DCF Valuation Security Analysis: Bond, Stock Capital Budgeting (Fundamentals) Portfolio
ECON FINANCIAL ECONOMICS
 ECON 337901 FINANCIAL ECONOMICS Peter Ireland Boston College Fall 2017 These lecture notes by Peter Ireland are licensed under a Creative Commons Attribution-NonCommerical-ShareAlike 4.0 International
ECON FINANCIAL ECONOMICS
 ECON 337901 FINANCIAL ECONOMICS Peter Ireland Boston College Spring 2018 These lecture notes by Peter Ireland are licensed under a Creative Commons Attribution-NonCommerical-ShareAlike 4.0 International
Kingdom of Saudi Arabia Capital Market Authority. Investment
 Kingdom of Saudi Arabia Capital Market Authority Investment The Definition of Investment Investment is defined as the commitment of current financial resources in order to achieve higher gains in the
OVERVIEW OF FINANCIAL RISK ASSESSMENT. A thesis submitted to the. Kent State University Honors College. in partial fulfillment of the requirements
 i OVERVIEW OF FINANCIAL RISK ASSESSMENT A thesis submitted to the Kent State University Honors College in partial fulfillment of the requirements for University Honors by Bo Zhao May, 2014 ii iii Thesis
FINALTERM EXAMINATION Fall 2009 MGT201- Financial Management (Session - 3)
") FINALTERM EXAMINATION Fall 2009 MGT201- Financial Management (Session - 3) Time: 120 min Marks: 87 Question No: 1 ( Marks: 1 ) - Please choose one ABC s and XYZ s debt-to-total assets ratio is 0.4. What
FINALTERM EXAMINATION Fall 2009 MGT201- Financial Management (Session - 3) Time: 120 min Marks: 87 Question No: 1 ( Marks: 1 ) - Please choose one ABC s and XYZ s debt-to-total assets ratio is 0.4. What
SDMR Finance (2) Olivier Brandouy. University of Paris 1, Panthéon-Sorbonne, IAE (Sorbonne Graduate Business School)
 Olivier Brandouy. University of Paris 1, Panthéon-Sorbonne, IAE (Sorbonne Graduate Business School)") SDMR Finance (2) Olivier Brandouy University of Paris 1, Panthéon-Sorbonne, IAE (Sorbonne Graduate Business School) Outline 1 Formal Approach to QAM : concepts and notations 2 3 Portfolio risk and return
SDMR Finance (2) Olivier Brandouy University of Paris 1, Panthéon-Sorbonne, IAE (Sorbonne Graduate Business School) Outline 1 Formal Approach to QAM : concepts and notations 2 3 Portfolio risk and return
Cost of Capital (represents risk)
") Cost of Capital (represents risk) Cost of Equity Capital - From the shareholders perspective, the expected return is the cost of equity capital E(R i ) is the return needed to make the investment = the
Cost of Capital (represents risk) Cost of Equity Capital - From the shareholders perspective, the expected return is the cost of equity capital E(R i ) is the return needed to make the investment = the
Economics 430 Handout on Rational Expectations: Part I. Review of Statistics: Notation and Definitions
 Economics 430 Chris Georges Handout on Rational Expectations: Part I Review of Statistics: Notation and Definitions Consider two random variables X and Y defined over m distinct possible events. Event
23.1. Assumptions of Capital Market Theory
 NPTEL Course Course Title: Security Analysis and Portfolio anagement Course Coordinator: Dr. Jitendra ahakud odule-12 Session-23 Capital arket Theory-I Capital market theory extends portfolio theory and
QR43, Introduction to Investments Class Notes, Fall 2003 IV. Portfolio Choice
 QR43, Introduction to Investments Class Notes, Fall 2003 IV. Portfolio Choice A. Mean-Variance Analysis 1. Thevarianceofaportfolio. Consider the choice between two risky assets with returns R 1 and R 2.
COMM 324 INVESTMENTS AND PORTFOLIO MANAGEMENT ASSIGNMENT 1 Due: October 3
 COMM 324 INVESTMENTS AND PORTFOLIO MANAGEMENT ASSIGNMENT 1 Due: October 3 1. The following information is provided for GAP, Incorporated, which is traded on NYSE: Fiscal Yr Ending January 31 Close Price
Hedge Portfolios, the No Arbitrage Condition & Arbitrage Pricing Theory
 Hedge Portfolios, the No Arbitrage Condition & Arbitrage Pricing Theory Hedge Portfolios A portfolio that has zero risk is said to be "perfectly hedged" or, in the jargon of Economics and Finance, is referred
Mean-Variance Portfolio Theory
 Mean-Variance Portfolio Theory Lakehead University Winter 2005 Outline Measures of Location Risk of a Single Asset Risk and Return of Financial Securities Risk of a Portfolio The Capital Asset Pricing
80 Solved MCQs of MGT201 Financial Management By
 80 Solved MCQs of MGT201 Financial Management By http://vustudents.ning.com Question No: 1 ( Marks: 1 ) - Please choose one What is the long-run objective of financial management? Maximize earnings per
Risk and Return. Nicole Höhling, Introduction. Definitions. Types of risk and beta
 Risk and Return Nicole Höhling, 2009-09-07 Introduction Every decision regarding investments is based on the relationship between risk and return. Generally the return on an investment should be as high
Mathematics of Time Value
 CHAPTER 8A Mathematics of Time Value The general expression for computing the present value of future cash flows is as follows: PV t C t (1 rt ) t (8.1A) This expression allows for variations in cash flows