Investment & Promising Trade Items
|
|
|
- Camron York
- 5 years ago
- Views:
Transcription


1
2 I Korea s Trade with Chile II Effects of Korea-Chile FTA III FTA Beneficiary i Items IV FTA Utilization V Investment & Promising Trade Items


3 01

 Source: KITA.")
4 6.000 (US$ million) (1.500) (3.000) Source: KITA.net (K-stat)
5 (US$ million, %) Product Export Amount Avg. annual grw rate ( 04-14) Ratio Product Import Amount Avg annual grw rate ( 04-14) Ratio Motor cars and other motor vehicles Copper ore 1, Motor vehicles for the transport of Goods Polymers of ethylene Telephone sets, including telephones for cellular networks Parts and accessories of the motor vehicles Petroleum oils and oils obtained fro m bituminous minerals New pneumatic tyres, of rubber Electric accumulators, including separators therefor Portland cement, aluminous cement, slag cement, supersulphate cement Refined copper and copper alloys, unwrought. Unrefined copper, copper anodes for electrolytic refining 1, Chemical wood pulp, soda, sulphate Molybdenum ore Grapes, fresh or dried Wood sawn or chipped lengthwise, sliced or peeled Waste and scrap of precious metal or of metals clad with precious metal * Meat of swine, fresh, chilled or frozen Polymers of propylene Zinc ore Total 2, Total 4, Source: KITA.net (K-stat) * With regards to the cement(hs code 2523), the average annual growth rate was calculated from 2005 to 2014 since there s no export record in 2004.

6
7 02
8 EFTA Canada EU USA China Turkey SIECA, KOR-CHN-JAP ASEAN India RCEP Australia Colombia Ecuador Peru Chile New Zealand El Salvador, Guatemala, Honduras, Nicaragua, Costa Rica, Panama
9 1,40 1,20 1,00 0,80 0,60 0, ,20-0,91 0,59 Korea-Chile FTA Import Market Share by Countries in Korea Brazil Chile Mexico Peru Colombia Argentina 0,98 0, ,86 0,87 1,23 0,87 0,24 0,26 0,19 0,19 0,18 0, ,14 0,11 0,13 0,10 0,04 0,05 0,05 0,07 1,17 0,78 1,01 1,16 0,95 0,96 1,11 0,99 1,21 1,17 (unit : % share) 1,08 0,93 0,93 0,90 0,90 0, ,62 0,50 0,44 0,45 0,36 0,37 0,38 0,28 0,28 0,27 0,24 0,20 0,21 0,21 0,24 0,19 0,20 0,23 0,03 0,03 0,04 0,10 0,07 0, Source : Global Trade Atlas 0,04 0,27 0,10
10 25,0 20,0 15,0 14,5 Korea-Chile US-Chile FTA 15,1 Import Market Share by Countries in Chile China-Chile FTA 15,8 16,0 17,0 19,4 18,7 17, Japan earthquake 21,0 15,7 16,11 22,0 17,7 (unit : % share) 20,8 20,4 13,3 10,0 11,4 12,0 10,0 8,3 8,5 5,0 7,3 7,2 64 6,4 5,6 5,6 4,7 3,0 3,1 3,6 3,9 3,5 3,6 3,3 0, Source : Global Trade Atlas 19,3 20,0
11 (%) 80 Import Market Share of Chilean Products in Korea 74, , ,9 52,1 54, , ,8 20,7 21,2 19,2 0 Copper ore Refined copper 0,0 Unrefined copper 8,3 Chemical wood pulp Molybdenum ore 4,3 5,7 3,4 0,1 Wood sawn Zinc ore Copper wire Source: KITA.net (K-stat)
12 (Unit) Number of Trade Items between Korea-Chile No. of export items No. of import items Source: KITA.net (K-stat)
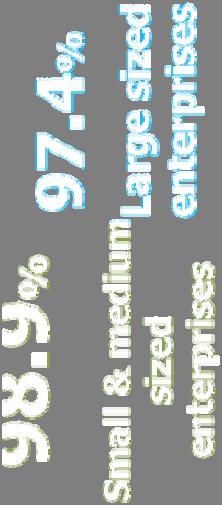
13 The No. of Korean Export Companies to Chile (Unit) 2200 No. of exporting companies No. of newly exporting companies The No. of Korean Export Companies to Chile by Size Source: KITA.net (K-stat)
14 03


, USA(Jan.")
 Market Share")
 16.1% 28.9% 29.")

15 Item : Passenger cars - HS 8703 Size : 3.2 bill dollar Average annual growth rate : 16.9% ( ) - Tariff Rate: 0%(Since Apr. 2004, Liberalization at entry into force) - FTA with other countries: EU(Feb. 2003), USA(Jan. 2004), Japan(Sep. 2007) Market Share (unit : %share) 16.1% 28.9% 29.5% 14.8% 28.9% 5.7% 11.4% 2.6% 9.0% 40,0 30,0 20,0 10,0 0,0 0,0 10,0 20,0 30,0 Source: Global Trade Atlas
16 Item : Cement clinkers - HS Size : mill dollar Average annual growth rate : 29.1% ( ) - Tariff Rate : 0%(since Apr. 2008) Chilean Cement Clinker Import Market (unit : mill USD) Market Share (unit : %share) 42,2 76,9 71,1 60,9 62,6 (Total) 57,9 (Chile) 92,5 4,9 12,1 21,4 17,7 28,9 32,1 37,1 Average annual growth rate: 47.6% 0 14,4 32, Source: Global Trade Atlas
17 Item : Wine HS 2204 Size : mill dollar Average annual growth rate : 14.8% ( ) - Tariff rate: 0% Chile jumped to the 2 nd importing source of Korea since Chile was 5 th importing source before Korea-Chile FTA. - Preemption effect is shown compared to EU countries and the US. Market Share (unit : %) Rank Country France Chile Italy US Spain Australia Source: KITA.net (K-stat)
 - Import from Chile started from 2012 FTA tariff reduction schedule(%) 2010 2011 2012 2013 2014 2015 Chile 0 0 0")
 147,3 (Total) 02 0,2 112,6 117,4 0,1 Market Share US Chile Others (unit : % share) 0,2 18,0 0,1 15,11 13,33 (Chile) 26,5")
18 Item : Shelled Walnut- HS Size : mill dollar Average annual growth rate : 33.7% ( ) - Import from Chile started from 2012 FTA tariff reduction schedule(%) Chile US MFN Korean Shelled walnut Import Market Size 0,2 (unit : mil. USD) 147,3 (Total) 02 0,2 112,6 117,4 0,1 Market Share US Chile Others (unit : % share) 0,2 18,0 0,1 15,11 13,33 (Chile) 26,5 97,0 81,8 0, Source: KITA.net (K-stat)


 Chile")
19 Item : Frozen Salmon(Atlantic salmon and Danube salmon) HS Size : 71.9 mil. dollar Chile started mass cultivation from 2003 and increased export. Tariff rate of Chilean frozen salmon is 0%. - Korea-Chile FTA & Korea-EFTA FTA took effect respectively since Apr & Sep Chile gained preemption effect. Korean Frozen Salmon Import from Chile Market Share in Korea 80 (unit : mill USD) Chile Norway (unit : % share) ,5 39,9 52,8 (Chile) 48,5 51,5 32,7 67,3 26,5 73, Source: KITA.net (K-stat)
20 04


21 Chile EFTA ASEAN India EU Peru US Turkey 100,0 80,0 60,0 80,5 95,0 85,3 76,2 72,7 56,3 97,6 89,2 72,6 68,7 67,4 65,764,2 40,0 31,3 41,0 20,0 76 7,6 0,0 Source: Korea Customs Service (Dec. 2014) Korea Chile Chile Korea


")


22 Source: Korea Customs Service (Dec. 2014)
23 05
24 Cumulated Korean Investment to Chile amounted $84.1 million by 2003 has shown five fold increase to $414.7 million by the end of Cumulated investment after Korea-Chile FTA is $330.6 mil. - Cumulated Investment in mining industry is the largest and its amount is $248.4 mil. (unit : mill. USD) 03 '04 '05 '06 '07 '08 '09 '10 '11 '12 '13 '14 Subtotal Total No. of Acceptance Accepted Amount Cumulated Chilean investment to Korea by the end of 2014 is $9.1 mil. - Cumulated Investment in distribution industry is the largest and its amounts is $7.5 mil. No. of Acceptance Accepted Amount (unit : mil.l USD) 03 '04 '05 '06 '07 '08 '09 '10 '11 '12 '13 '14 Subtotal Total Note: Subtotal(2004~2014), Total(~2014) Source: Ministry of Trade, Industry and Energy
25 Articles of iron or steel : 1,980 mill. USD (2014), 12.5% ( ) Other machines and apparatus : 1,813 mill. USD (2014), 10.5% ( ) Coniferous : 513 mill. USD (2014), 15.2% ( ) Medical instruments : 173 mill. USD (2014), 13.0% ( ) Structures and parts of iron or steel : 166 mill. USD (2014), 23.1% ( ) Flat-rolled ll products of iron: 131 mill. USD (2014), 18.2% ( ) Electric Lamps : 80 mill. USD (2014), 13.0% ( )
26
The business environment and opportunities provided by the TPP 11 as seen from Japan Naoyoshi Noguchi Executive Vice President
 The 31 st Japan-Chile Business Cooperation Committee 1 st plenary session: Prospects of the TPP 11 The business environment and opportunities provided by the TPP 11 as seen from Japan Naoyoshi Noguchi
The Global Summit of Women 2009 Santiago, Chile May 14-16
 The Global Summit of Women 2009 Santiago, Chile May 14-16 Presentation on Doing Business in Chile By Bruno Philippi, President, SOFOFA (Federacion Gremial de la Industria), Chile Global Summit of Women
Dossier on Preferential Trade Agreements
 Dossier on Preferential Trade Agreements July 2009 (Vol. III, No. 7) (For all previous issues of PTA Dossiers, please visit: http://www.cuts citee.org/ptadossier.htm) Table of Contents 1. EU and Papua
Report on Finnish Technology Industry Exports
 Report on Finnish Technology Industry Exports Last observation October 2018, 2.1.2019 Goods Export of Technology Industry from Finland Goods Export of Technology Industry from Finland by Branches Source:
Chile: Business Environment and Investment Opportunities
 Chile: Business Environment and Investment Opportunities Guest Speaker 14:00 15:00 GUEST SPEAKER Martin Pathan Investment Officer Foreign Investment Committee Chile: business environment and investment
Trade Policy in Brazil. What is the Agenda?
 Inter-American Development Bank Trade Policy in Brazil. What is the Agenda? Mauricio Mesquita Moreira, Senior Trade Economist Integration and Trade Sector Brazil and the United States: Trade Agendas and
Document prepared by the Chilean Embassy in South Korea Fourth Anniversary of the Korea-Chile FTA: An Assessment of the results
 Fourth Anniversary of the Korea-Chile FTA: An Assessment of the results Historic background The negotiations for a Free Trade Agreement (FTA) between Korea and Chile concluded on February 15, 2003 date
The Importance of CJK FTA for the Development of Trilateral Cooperation
 The Importance of CJK FTA for the Development of Trilateral Cooperation April 7, 2016 Chang Jae LEE Korea Institute for International Economic Policy Contents I. Brief history of CJK FTA II. Reasons why
Ref.: Plexh/Cir/ All Members/All Members of the COA. Dear Sir(s), Sub : Regarding review of India-LAC Trade for the period April-August,
, Sub : Regarding review of India-LAC Trade for the period April-August,") Ref.: Plexh/Cir/14 414 03.10.2018 All Members/All Members of the COA Dear Sir(s), Sub : Regarding review of India-LAC Trade for the period April-August, 2018 We are in receipt of communication from Departmentt
Ref.: Plexh/Cir/14 414 03.10.2018 All Members/All Members of the COA Dear Sir(s), Sub : Regarding review of India-LAC Trade for the period April-August, 2018 We are in receipt of communication from Departmentt
FREE TRADE AGREEMENT BETWEEN UKRAINE AND UZBEKISTAN. Annex Information on the regional trade agreement
 FREE TRADE AGREEMENT BETWEEN UKRAINE AND UZBEKISTAN Annex Information on the regional trade agreement FREE TRADE AGREEMENT between the Government of Ukraine and the Government of the Republic of Uzbekistan
Current and Potential Losses to the U.S. Pork Industry from Retaliatory Tariffs Focus on Mexico June 13, 2018 Background Tariff Details
 Current and Potential Losses to the U.S. Pork Industry from Retaliatory Tariffs Focus on Mexico June 13, 2018 Background The recent implementation of duties and threats of imposing duties on U.S. imports
Presentation by Economy Under Review - Chile
 2008/SOM3/013anx3 Agenda Item: IV Presentation by Economy Under Review - Chile Purpose: Consideration Submitted by: APEC Secretariat Third Senior Officials Meeting Lima, Peru 22-23 August 2008 CHILE IAP
Vietnam Looking Forward
 Looking Forward 1 in Regional Perspectives Compared to its regional peers, economy, although the smallest in size, is the most dynamic in terms of growth. GDP growth (%) USD 395 Bn 8.0 7.0 6.0 5.0 4.0
Charting Mexico s Economy
 Charting Mexico s Economy Designed to help executives catch up with the economy and incorporate macro impacts into company s planning. Annual subscription includes 2 semiannual issues published in June
Belgium has a small, open economy. Foreign trade is of major importance to the overall
 2016 PREFACE BELGIAN FOREIGN TRADE IN 2016 Belgium has a small, open economy. Foreign trade is of major importance to the overall business outlook of our country. A recovery is generally initiated by
Monthly Report on the Corporate Goods Price Index ( Preliminary Figures for August 2017 )
") Research and Statistics Department Bank of Japan Report on the Corporate Goods Price Index The Producer Price Index was und from the previous. The Export Price Index (contract currency ) rose 0.6 percent
Research and Statistics Department Bank of Japan Report on the Corporate Goods Price Index The Producer Price Index was und from the previous. The Export Price Index (contract currency ) rose 0.6 percent
Latin American Economic Outlook 2008
 Latin American Economic Outlook 28 China and India: Angel or Devils for Latin America? Based on Chapter 4 of the Report Javier Santiso Director, OECD Development Centre Rio de Janeiro, March 28 The OECD
Priorities for Productivity and Income (PPIs) Country Results
 Country Results") Priorities for Productivity and Income (PPIs) Country Results Bolivia Alejandro Izquierdo Jimena Llopis Umberto Muratori Jose Juan Ruiz 2015 Priorities for Productivity and Income (PPIs) Country Results
Priorities for Productivity and Income (PPIs) Country Results Bolivia Alejandro Izquierdo Jimena Llopis Umberto Muratori Jose Juan Ruiz 2015 Priorities for Productivity and Income (PPIs) Country Results
Overview of Economic Interaction between Korea and Northern Territory
 Overview of Economic Interaction between Korea and Northern Territory 6 July, 2017 KOTRA Sydney, Director General Gang Suk, Suh Contents 1. Current situation of Korean Economy - Korea s Economy - FDI in
Being centrally located in the European continent, Belgium s trade is the hallmark of
 2017 PREFACE BELGIAN FOREIGN TRADE IN 2017 Being centrally located in the European continent, Belgium s trade is the hallmark of all its activities. In addition to being considered an export champion,
Investment Climate of Korea
 Investment Climate of Korea Growth of Korea GDP (nominal) Nominal GDP between 2003 and 2012 (Unit: USD Billion) 2003 2004 2005 2006 2007 2008 2009 2010 2011 2012 644.00 722.00 845.00 951.00 1,049.00 931.00
2. Mining equipment exports
 Raw Materials Scoreboard Mining equipment exports 2. Mining equipment exports Key points: The EU-28, China, Japan and the United States were net exporters of mining equipment over the 2011-2015 period.
Total Imports by Volume (Gallons per Country)
") 3/7/2018 Imports by Volume (Gallons per Country) YTD YTD Country 01/2017 01/2018 % Change 2017 2018 % Change MEXICO 54,235,419 58,937,856 8.7 % 54,235,419 58,937,856 8.7 % NETHERLANDS 12,265,935 10,356,183
3/7/2018 Imports by Volume (Gallons per Country) YTD YTD Country 01/2017 01/2018 % Change 2017 2018 % Change MEXICO 54,235,419 58,937,856 8.7 % 54,235,419 58,937,856 8.7 % NETHERLANDS 12,265,935 10,356,183
Snapshot of the Chilean Economy
 Snapshot of the Chilean Economy Economy GDP 2012 GDP per capita (PPP, 2012) Actual interest rate (Monetary Policy, Jan 2013) US$ 268 billion (IMF) US$ 18.354 (IMF) 5.0% Unemployment rate (Avg. 2012) 6.5%
Free Trade, Fair Trade & Tariffs
 Free Trade, Fair Trade & Tariffs Texas Public Funds Investment Conference November 8-9, 2018 William T. Chittenden, Ph.D. Associate Dean for Graduate Programs McCoy College of Business Administration Texas
Public Procurement networks in Latin America and the Caribbean
 Session #7: Cross regional Learning: Cases in Caribbean and Latin American Countries Public Procurement networks in Latin America and the Caribbean Asia Pacific Public Electronic Procurement Network 2nd
Robert Holzmann World Bank & University of Vienna
 The Role of MDC Approach in Improving Pension Coverage Workshop on the Potential for Matching Defined Contribution (MDC) Schemes Washington, DC, June 6-7, 2011 Robert Holzmann World Bank & University of
FOREIGN INVESTMENT IN COLOMBIA
 FOREIGN INVESTMENT IN COLOMBIA Overview, principles, types of foreign investment, international instruments for the protection of foreign investment, and Pacific Alliance. Bogotá is the first city with
Latin American Economic Outlook 2008
 Latin American Economic Outlook 28 Javier Santiso Director & Chief Development Economist OECD Development Centre Brasilia, 4th March 28 Banco Central do Brasil The OECD and Latin America: An emerging commitment
Monthly Rolling Economic Electronic Presentation August 2017
 CHILE AT A GLANCE Monthly Rolling Economic Electronic Presentation August 2017 CURRENT ECONOMIC PERFORMANCE GDP GROWTH (% over same quarter previous year) 3 2,5 2 1,5 1 0,5 0 QIV 2014 QI 2015 QII 2015
Peru s Fundamentals and Economic Outlook
 Peru s Fundamentals and Economic Outlook Julio Velarde Governor Central Bank of Peru October 2016 Content 1. Slow Global Recovery 5. Gradual withdrawal of monetary stimulus 2. Reversal in Peru s external
Total Imports by Volume (Gallons per Country)
") 5/4/2016 Imports by Volume (Gallons per Country) YTD YTD Country 03/2015 03/2016 % Change 2015 2016 % Change MEXICO 53,821,885 60,813,992 13.0 % 143,313,133 167,568,280 16.9 % NETHERLANDS 11,031,990 12,362,256
5/4/2016 Imports by Volume (Gallons per Country) YTD YTD Country 03/2015 03/2016 % Change 2015 2016 % Change MEXICO 53,821,885 60,813,992 13.0 % 143,313,133 167,568,280 16.9 % NETHERLANDS 11,031,990 12,362,256
FedEx International Priority. FedEx International Economy 3
 SERVICES AND RATES FedEx International Solutions for your business Whether you are shipping documents to meet a deadline, saving money on a regular shipment or moving freight, FedEx offers a suite of transportation
Regional and Bilateral Initiatives
 Page 1 of 9 Français Contact Us Help Search Canada Site Home Media Room Subscribe What's New Department Regional and Bilateral Initiatives Canada - Chile Free Trade Agreement Four Years Into the Free Trade
Macroprudential policy over the business cycle
 Macroprudential policy over the business cycle Pablo Federico (University of Maryland) Carlos Vegh (University of Maryland and NBER) Guillermo Vuletin (Colby College) Meeting of Monetary Policy Advisors
St. Martin 2013 SERVICES AND RATES
 SERVICES AND RATES FedEx International Solutions for your business Whether you are shipping documents to meet a deadline, saving money on a regular shipment or moving freight, FedEx offers a suite of transportation
Latin American Economic Outlook 2008
 Latin American Economic Outlook 28 Javier Santiso Acting Director Chief Development Economist OECD Development Centre Brussels, 13 th December 27 The OECD and Latin America: An emerging commitment Latin
EU Trade Policy and CETA
 EU Trade Policy and CETA http://www.youtube.com/watch?v=iioc5xg2i5y The EU a major trading power European Commission, 2013 The EU a major trading power % of global exports, goods, 2012 % of global exports,
Monetary Policy: A Key Driver for Long Term Macroeconomic Stability
 Monetary Policy: A Key Driver for Long Term Macroeconomic Stability Julio Velarde Governor Central Bank of Peru March 2016 Agenda 1. Peru s growth is based on strong fundamentals 2. Recent economic developments
The Political Economy of Reform in Resource Rich Countries
 The Political Economy of Reform in Resource Rich Countries Professor Ragnar Torvik Department of Economics Norwegian University of Science and Technology High-level seminar on Natural resources, finance,
Total Imports by Volume (Gallons per Country)
") 4/5/2018 Imports by Volume (Gallons per Country) YTD YTD Country 02/2017 02/2018 % Change 2017 2018 % Change MEXICO 53,961,589 55,268,981 2.4 % 108,197,008 114,206,836 5.6 % NETHERLANDS 12,804,152 11,235,029
4/5/2018 Imports by Volume (Gallons per Country) YTD YTD Country 02/2017 02/2018 % Change 2017 2018 % Change MEXICO 53,961,589 55,268,981 2.4 % 108,197,008 114,206,836 5.6 % NETHERLANDS 12,804,152 11,235,029
ASEAN-Australia-New Zealand Free Trade Area (AANZFTA) Ms Foo May Yan Manager (FTA Division) Trade Services and Policy Group 9 July 2010
 Ms Foo May Yan Manager (FTA Division) Trade Services and Policy Group 9 July 2010") ASEAN-Australia-New Zealand Free Trade Area (AANZFTA) Ms Foo May Yan Manager (FTA Division) Trade Services and Policy Group 9 July 2010 THE SINGAPORE PUBLIC SERVICE: INTEGRITY SERVICE EXCELLENCE 1 Outline
ASEAN-Australia-New Zealand Free Trade Area (AANZFTA) Ms Foo May Yan Manager (FTA Division) Trade Services and Policy Group 9 July 2010 THE SINGAPORE PUBLIC SERVICE: INTEGRITY SERVICE EXCELLENCE 1 Outline
GBTA BTI Outlook: Brasil
 GBTA BTI Outlook: Brasil 2 nd Half - 2016 Agenda GBTA BTI Outlook Brazil: Overview Methodology GBTA BTI : Global Context Brazil Business Travel Spending Details 2 Overview In 2017, completed 8 th Global
Trade trends and trade policy developments. Ian Ascough Head of Bilateral Trade Negotiations BIS/DfID Trade Policy Unit
 Trade trends and trade policy developments Ian Ascough Head of Bilateral Trade Negotiations BIS/DfID Trade Policy Unit The big picture UK earnings from exports of goods exceeded earnings from exports of
Lessons and Experiences of Mexico in Dealing with Issues Emerging from RTAs/FTAs Participation
 006/SOM/CTI/FTA-RTA/0 Lessons and Experiences of Mexico in Dealing with Issues Emerging from RTAs/FTAs Participation Submitted by: Mexico APEC Workshop on Best Practices in Trade Policy for RTAs/FTAs:
TRADE IN GOODS OF BULGARIA WITH EU IN THE PERIOD JANUARY - JUNE 2018 (PRELIMINARY DATA)
") TRADE IN GOODS OF BULGARIA WITH EU IN THE PERIOD JANUARY - JUNE 2018 (PRELIMINARY DATA) In the period January - June 2018 the exports of goods from Bulgaria to the EU increased by 10.7% 2017 and amounted
TRADE IN GOODS OF BULGARIA WITH EU IN THE PERIOD JANUARY - JUNE 2018 (PRELIMINARY DATA) In the period January - June 2018 the exports of goods from Bulgaria to the EU increased by 10.7% 2017 and amounted
Twenty-First Century Trade Policy: Pushing the Limits of International Cooperation
 International Cooperation and Global Public Goods Twenty-First Century Trade Policy: Pushing the Limits of International Cooperation Chad P. Bown Development Research Group The World Bank April 22, 2014
Supplemental Table I. WTO impact by industry
 Supplemental Table I. WTO impact by industry This table presents the influence of WTO accessions on each three-digit NAICS code based industry for the manufacturing sector. The WTO impact is estimated
Roslyn Kunin & Associates, Inc. Presents. Economic Impact of International Students in BC
 Roslyn Kunin & Associates, Inc. Presents Economic Impact of International Students in BC What do BC s International Education Services Offer? June 2013 Roslyn Kunin & Associates, Inc. 2 Meeting needs of
Globalisation, development financing and Chindia in Latin America
 Globalisation, development financing and Chindia in Latin America Latin American Economic Outlook 28 Javier Santiso Director & Chief Development Economist OECD Development Centre Bern, 11th March 28 Swiss
Best Practices on FTA Promotion Policies
 1 Best Practices on FTA Promotion Policies The Case of Thailand Mr. Pitak Udomwichaiwat Director, Bureau of Trade Preference Ministry of Commerce APEC Workshop on Increasing FTA Utilization by SMEs 7 August
Institutions, Capital Flight and the Resource Curse. Ragnar Torvik Department of Economics Norwegian University of Science and Technology
 Institutions, Capital Flight and the Resource Curse Ragnar Torvik Department of Economics Norwegian University of Science and Technology The resource curse Wave 1: Case studies, Gelb (1988) The resource
Highlights of Chile
 Highlights of Chile 2012-2013 2012-2013 Synopsis The economy had a positive growth of 5.6%. At the end of 2012, the copper price reached an average of US$ 361 cents per pound, lower than the 2011 average
Michigan s Economic Future and MEDC Initiatives
 Michigan s Economic Future and MEDC Initiatives Doug Smith, Senior Vice President, Governmental Affairs & Strategic Partnerships Michigan Economic Development Corporation Apartment Association of Michigan
Corrigendum. OECD Pensions Outlook 2012 DOI: ISBN (print) ISBN (PDF) OECD 2012
 ISBN (PDF) OECD 2012") OECD Pensions Outlook 2012 DOI: http://dx.doi.org/9789264169401-en ISBN 978-92-64-16939-5 (print) ISBN 978-92-64-16940-1 (PDF) OECD 2012 Corrigendum Page 21: Figure 1.1. Average annual real net investment
OECD Pensions Outlook 2012 DOI: http://dx.doi.org/9789264169401-en ISBN 978-92-64-16939-5 (print) ISBN 978-92-64-16940-1 (PDF) OECD 2012 Corrigendum Page 21: Figure 1.1. Average annual real net investment
Chart Collection for Morning Briefing
 Chart Collection for Morning Briefing November 14, 217 Dr. Edward Yardeni 516-972-7683 eyardeni@ Mali Quintana 48-664-1333 aquintana@ Please visit our sites at www. blog. thinking outside the box 16 Figure
SELA Antenna in the United States
 SELA Antenna in the United States SELA Permanent Secretary No. 74 4 th Quarter 2004 1 SUMMARY: U.S. FREE TRADE AGREEMENTS WITH SELA MEMBER STATES The Coverage of FTAs The Importance of MFN Tariff Reductions
China s role in Latin America: Participation & Consequences
 China s role in Latin America: Participation & Consequences November 2017 Le Xia Asia Chief Economist, BBVA Research Index 01 Evolution of bilateral trade and investment 02 LatAm s export dependency on
Canada Jumps on the Bilateral Bandwagon
 Canada Jumps on the Bilateral Bandwagon John W. Boscariol and Orlando E. Silva* Following in the footsteps of the United States and other major trading partners, the Canadian government has been actively
Summary 715 SUMMARY. Minimum Legal Fee Schedule. Loser Pays Statute. Prohibition Against Legal Advertising / Soliciting of Pro bono
 Summary Country Fee Aid Angola No No No Argentina No, with No No No Armenia, with No No No No, however the foreign Attorneys need to be registered at the Chamber of Advocates to be able to practice attorney
Report Special Committee Q184
 A I P P I ASSOCIATION INTERNATIONALE POUR LA PROTECTION DE LA PROPRIETE INTELLECTUELLE INTERNATIONAL ASSOCIATION FOR THE PROTECTION OF INTELLECTUAL PROPERTY INTERNATIONALE VEREINIGUNG FÜR DEN SCHUTZ DES
Role of international trade rules in the current economic crisis
 Role of international trade rules in the current economic crisis E-Leader Conference Tallinn, 8 10 June, 2009 Ludmila Sterbova University of Economics Prague, Czech Republic Consequences of the crisis
Total Imports by Volume (Gallons per Country)
") 6/6/2018 Imports by Volume (Gallons per Country) YTD YTD Country 04/2017 04/2018 % Change 2017 2018 % Change MEXICO 60,968,190 71,994,646 18.1 % 231,460,145 253,500,213 9.5 % NETHERLANDS 13,307,731 10,001,693
6/6/2018 Imports by Volume (Gallons per Country) YTD YTD Country 04/2017 04/2018 % Change 2017 2018 % Change MEXICO 60,968,190 71,994,646 18.1 % 231,460,145 253,500,213 9.5 % NETHERLANDS 13,307,731 10,001,693
Yukon s Merchandise Trade with the World
 Yukon s Merchandise Trade with the World Publication No. 2014-39-E 23 June 2014 Alexandre Gauthier Economics, Resources and International Affairs Division Parliamentary Information and Research Service
Belize FedEx International Priority. FedEx International Economy 3
 SERVICES AND RATES FedEx International Solutions for your business Whether you are shipping documents to meet a deadline, saving money on a regular shipment or moving freight, FedEx offers a suite of transportation
Belize FedEx International Priority. FedEx International Economy 3
 SERVICES AND RATES FedEx International Solutions for your business Whether you are shipping documents to meet a deadline, saving money on a regular shipment or moving freight, FedEx offers a suite of transportation
Overview of FSC-certified forests January January Maps of extend of FSC-certified forest globally and country specific
 Overview of FSCcertified forests January 2009 Maps of extend of FSCcertified forest globally and country specific Global certified forest area: 120.052.350 ha ( = 4,3%) + 11% Hectare FSCcertified forest
Presented by Brian Ledgerwood Senior International Trade Specialist Office of Materials Industries U.S. Department of Commerce
 ADVANCING U.S. EXPORTS-BUILDING MATERIALS & WOOD TO GLOBAL MARKETS International Wood Products Association April 7, 217 Hotel Nikko San Francisco, California Presented by Brian Ledgerwood Senior International
WORLD HEALTH ORGANISATION MONDIALE. NINTH WORLD HEALTH ASSEMBLY Jg? \ A9/P&B/19 ^! fr t 15 May 1956 Agenda item 6.5 îj. L,, л
 WORLD HEALTH ORGANISATION MONDIALE ORGANIZATION DE LA SANTÉ NINTH WORLD HEALTH ASSEMBLY Jg? \ A9/P&B/19 ^! fr t 15 May 1956 Agenda item 6.5 îj. L,, л Q-u L. * ORIGINAL: ENÓLISH REVIEW AND APPROVAL OF THE
BETTER POLICIES FOR A SUCCESSFUL TRANSITION TO A LOW-CARBON ECONOMY
 BETTER POLICIES FOR A SUCCESSFUL TRANSITION TO A LOW-CARBON ECONOMY Rintaro Tamaki Deputy Secretary-General, OECD International Forum for Sustainable Asia and the Pacific (ISAP)1 Yokohama, July 1 Four
Appendix. Table S1: Construct Validity Tests for StateHist
 Appendix Table S1: Construct Validity Tests for StateHist (5) (6) Roads Water Hospitals Doctors Mort5 LifeExp GDP/cap 60 4.24 6.72** 0.53* 0.67** 24.37** 6.97** (2.73) (1.59) (0.22) (0.09) (4.72) (0.85)
Juan Pablo Jiménez Economic Commission for Latin America and the Caribbean
 Juan Pablo Jiménez Economic Commission for Latin America and the Caribbean ITC-Workshop How to Operationalize the International Tax and Development Agenda 12-14 September 2011 Bonn, Germany I. Diagnosis
GS Emerging Markets Debt Blend Portfolio
 Factsheet as at : November 12, 2018 GS Emerging Markets Debt Blend Portfolio Fund objective The Portfolio seeks to provide income and capital growth over the longer term. The Portfolio will mostly invest
Economic Stimulus Packages and Steel: A Summary
 Economic Stimulus Packages and Steel: A Summary Steel Committee Meeting 8-9 June 2009 Sources of information on stimulus packages Questionnaire to Steel Committee members, full participants and observers
Total Imports by Volume (Gallons per Country)
") 7/6/2018 Imports by Volume (Gallons per Country) YTD YTD Country 05/2017 05/2018 % Change 2017 2018 % Change MEXICO 71,166,360 74,896,922 5.2 % 302,626,505 328,397,135 8.5 % NETHERLANDS 12,039,171 13,341,929
7/6/2018 Imports by Volume (Gallons per Country) YTD YTD Country 05/2017 05/2018 % Change 2017 2018 % Change MEXICO 71,166,360 74,896,922 5.2 % 302,626,505 328,397,135 8.5 % NETHERLANDS 12,039,171 13,341,929
Today's CPI data: what you need to know
 Trend Macrolytics, LLC Donald Luskin, Chief Investment Officer Thomas Demas, Managing Director Michael Warren, Energy Strategist Data Insights: Consumer Price Index, Producer Price Index Friday, October
Is Export Promotion Effective in Latin America and the Caribbean?*
 Is Export Promotion Effective in Latin America and the Caribbean?* Christian Volpe Martincus Inter-American Development Bank 7 th World Conference of Trade Promotion Organizations The Hague October 13,
Today's CPI data: what you need to know
 Trend Macrolytics, LLC Donald Luskin, Chief Investment Officer Thomas Demas, Managing Director Michael Warren, Energy Strategist Data Insights: Consumer Price Index, Producer Price Index Thursday, October
Chile Hong Kong, China Free Trade Agreement
 2015/SOM2/CTI/TPD/004 Session 1 Chile Hong Kong, China Free Trade Agreement Submitted by: Chile; Hong Kong, China Trade Policy Dialogue on WTO-Plus Aspects of Recently Concluded Regional Trade Agreements
Economic Outlook January, 2012
 Economic Outlook January, 2012 Summary Global economy Low global growth scenario, tail risks have become smaller. Risks (Debt Ceiling, elections in Italy, growth in Europe). Brazil Activity shows signs
Market Correlation: Emerging Markets MSCI
 Market Correlation: MSCI March 2, 218 Dr. Edward Yardeni 516-972-7683 eyardeni@ Joe Abbott 732-497-536 jabbott@ Mali Quintana 48-664-1333 aquintana@ Please visit our sites at www. blog. thinking outside
China s role in Latin America: Participation & Consequences
 China s role in Latin America: Participation & Consequences Le Xia Asia Chief Economist, BBVA Research November 2017 Summary Evolution of bilateral trade and investment Inflation LatAm s export dependency
Low-carbon Development and Carbon Finance at the IDB Maria Netto Sustainable Energy and Climate Change Unit (ECC)
") Low-carbon Development and Carbon Finance at the IDB Maria Netto Sustainable Energy and Climate Change Unit (ECC) 11th Annual Workshop on Greenhouse Gas Emission Trading Oct 3 rd, 2011 Context for IDB
Low-carbon Development and Carbon Finance at the IDB Maria Netto Sustainable Energy and Climate Change Unit (ECC) 11th Annual Workshop on Greenhouse Gas Emission Trading Oct 3 rd, 2011 Context for IDB
APPENDIX 1 IMPORT TARIFF-RATE QUOTAS OF THE REPUBLICS OF THE CA PARTY
 APPENDIX 1 IMPORT TARIFF-RATE QUOTAS OF THE REPUBLICS OF THE CA PARTY 1. This Appendix includes import tariff-rate quotas for originating goods of the EU Party under staging category "Q" in the Schedule
Swiss Global Finance. Facts and Figures
 Swiss Global Finance Facts and Figures Latin America Bilateral Economic Relations Switzerland s Main Trading Partners in Latin America Share of Total Goods Exports (in % of total Swiss exports to Latin
U.S. Sugar Monthly Import and Re-Exports
 U.S. Sugar Monthly Import and Re-Exports Fiscal Year (FY) 2018 Report February 2018 The February WASDE report shows FY 2018 WTO raw sugar tariff-rate quota (TRQ) shortfall projected at 99,208 short tons
Plurilateralism: A New Way of Trade Liberalism?
 Plurilateralism: A New Way of Trade Liberalism? E-Leader Vienna 6 8 June, 2016 Ludmila Sterbova University of Economics, Prague Historical Background of Trade Liberalism/1 20 th Century 1929-30 Great Depression
Total Imports by Volume (Gallons per Country)
") 10/5/2017 Imports by Volume (Gallons per Country) YTD YTD Country 08/2016 08/2017 % Change 2016 2017 % Change MEXICO 51,349,849 67,180,788 30.8 % 475,806,632 503,129,061 5.7 % NETHERLANDS 12,756,776 12,954,789
10/5/2017 Imports by Volume (Gallons per Country) YTD YTD Country 08/2016 08/2017 % Change 2016 2017 % Change MEXICO 51,349,849 67,180,788 30.8 % 475,806,632 503,129,061 5.7 % NETHERLANDS 12,756,776 12,954,789
MARKET STRATEGIES FOR LATIN AMERICAN REGION
 MARKET STRATEGIES FOR LATIN AMERICAN REGION PREPARED BY: MARKET DEVELOPMENT DIVISION SRI LANKA EXPORT DEVELOPMENT BOARD JUNE, 2017 CONTENTS 1. INTRODUCTION 1 PAGE 2. MAJOR TRADING PARTNERS 4 3. TRADE OPPORTUNITIES
Sugar Monthly Import and Re-Exports
 Sugar Monthly Import and Re-Exports Fiscal Year (FY) 2017 Report December 2016 The December WASDE report shows FY 2017 WTO raw sugar tariff-rate quota (TRQ) shortfall projected at 99,208 short tons raw
EAST BALT BAKERIES July 2017 ACQUISITION
 EAST BALT BAKERIES July 2017 ACQUISITION E AST BA LT AT A G L A N C E Leading foodservice-focused company that supplies baked goods to Quick Service Restaurants ( QSR ) across the world Operates 21 bakeries
Dossier on Preferential Trade Agreements
 Dossier on Preferential Trade Agreements April-June 2012 (Vol. VI, No. 2) (For all previous issues of PTA Dossiers, please visit: http://www.cuts-citee.org/ptadossier.htm) Table of Contents 1. Korea, Colombia
B2. International trade and emerging markets
 B2. International trade and emerging markets Introduction and definitions The key origins and destinations of Dutch trade remain other European Union countries and the United States. However, other trading
Sugar Monthly Import and Re-Exports
 Sugar Monthly Import and Re-Exports Fiscal Year (FY) 2016 Report November 2015 The November WASDE report shows FY 2016 WTO raw sugar tariff-rate quota (TRQ) shortfall projected at 99,208 short tons raw
International social security
 The essential guide 27 30 October 2013 Disclaimer EY refers to the global organization, and may refer to one or more, of the member firms of Ernst & Young Global Limited, each of which is a separate legal
Today's CPI data: what you need to know
 Trend Macrolytics, LLC Donald Luskin, Chief Investment Officer Thomas Demas, Managing Director Michael Warren, Energy Strategist Data Insights: Consumer Price Index, Producer Price Index Friday, July 14,
Developing Housing Finance Systems
 Developing Housing Finance Systems Veronica Cacdac Warnock IIMB-IMF Conference on Housing Markets, Financial Stability and Growth December 11, 2014 Based on Warnock V and Warnock F (2012). Developing Housing
MONGOLIA is OPEN. for BUSINESS. Invest Mongolia Agency
 MONGOLIA is OPEN for BUSINESS Invest Mongolia Agency WHY INVEST IN MONGOLIA 1. Large mineral resource base that can be leveraged for value added processing 2. Situated between two giant economies, China
Global Construction 2030 Expo EDIFICA 2017 Santiago Chile. 4-6 October 2017
 Global Construction 2030 Expo EDIFICA 2017 Santiago Chile 4-6 October 2017 Graham Robinson Global Construction Perspectives Global Construction 2030 is the fourth in a series of global studies of the construction
Total Imports by Volume (Gallons per Country)
") 1/5/2018 Imports by Volume (Gallons per Country) YTD YTD Country 11/2016 11/2017 % Change 2016 2017 % Change MEXICO 50,994,409 48,959,909 (4.0)% 631,442,105 657,851,150 4.2 % NETHERLANDS 9,378,351 11,903,919
1/5/2018 Imports by Volume (Gallons per Country) YTD YTD Country 11/2016 11/2017 % Change 2016 2017 % Change MEXICO 50,994,409 48,959,909 (4.0)% 631,442,105 657,851,150 4.2 % NETHERLANDS 9,378,351 11,903,919