Now What? Navigating Fearlessly Through a Turbulent Environment February 2, 2016
|
|
|
- Rolf Neal
- 5 years ago
- Views:
Transcription

1 Risk Management Strategy & Solutions Now What? Navigating Fearlessly Through a Turbulent Environment February 2, 2016 Frank L. Farone, Managing Director ffarone@darlingconsulting.com Darling Consulting Group, Inc. 260 Merrimac Street Newburyport, MA Tel: DarlingConsulting.com Page 1


2 2015 Darling Consulting Group, Inc. 260 Merrimac Street Newburyport, MA Tel: DarlingConsulting.com Page 2
3 Low Rate Impact: Margins Under Siege and getting WORSE Darling Consulting Group, Inc. 260 Merrimac Street Newburyport, MA Tel: DarlingConsulting.com Page 3
4 Low Rates = Credit Union Industry Headwinds Darling Consulting Group, Inc. 260 Merrimac Street Newburyport, MA Tel: DarlingConsulting.com Page 4
5 CUs not alone, Bankers feeling same pain! Volume game! Darling Consulting Group, Inc. 260 Merrimac Street Newburyport, MA Tel: DarlingConsulting.com Page 5


6 Interest Rates A Top of Mind Issue Focus = Rising Rates (When? How Much? How Fast?) Darling Consulting Group, Inc. 260 Merrimac Street Newburyport, MA Tel: DarlingConsulting.com Page 6
7 The Fed vs. The Market Rate Outlook? Fed Dot Plot December 16, 2015 Current Median 12/14 (median) 6/15 (median) 9/15 (median) FFF Fed Funds Futures (1/15/16) Spot = 35bp 12/16 = 0.64% 12/17 = 0.96% FFF FFF Darling Consulting Group, Inc. 260 Merrimac Street Newburyport, MA Tel: DarlingConsulting.com Page 7
8 December FOMC Dot Plot : 1.00% Increase in 2016 FF Futures Market (1/12/16): 0.50%-0.75% Darling Consulting Group, Inc. 260 Merrimac Street Newburyport, MA Tel: DarlingConsulting.com Page 8
9 How Much Priced into Rest of Yield Curve? Darling Consulting Group, Inc. 260 Merrimac Street Newburyport, MA Tel: DarlingConsulting.com Page 9

10 Industry Dynamics ARE Changing Fewer, Larger CUs Mergers of Small CUs Lower Returns/Profits.50% ROA the New 1% Many Will Seek More Fee Related Income Use of Wholesale l Funding Will Be Needed d to Control COF, Increase Earnings and Manage IRR and dcapital But.NII B NIIWill Remain Driver for most Darling Consulting Group, Inc. 260 Merrimac Street Newburyport, MA Tel: DarlingConsulting.com Page 10


11 Implication: NEED to Think Differently.About Deposit Strategy.About Loan Strategy.About Capital Management.About Liquidity.About Wholesale funding.about Earnings at Risk.About SURVIVAL of Fittest! Darling Consulting Group, Inc. 260 Merrimac Street Newburyport, MA Tel: DarlingConsulting.com Page 11
12 Regulatory Issues & Concerns Concerned about RISING Rates However, earnings are now an issue, despite other metrics Questioning deposit stability Core vs. non-core Credit Union-specific assumptions Need to be defended Aggressive growth in long-term assets (LT Asset/Assets); NEV Stress testing a Must IRR, Liquidity Capital idit it and Credit? Liquidity back at the forefront of discussions Darling Consulting Group, Inc. 260 Merrimac Street Newburyport, MA Tel: DarlingConsulting.com Page 12
13 Practical Viewpoint i of Interest Rate Risk Darling Consulting Group, Inc. 260 Merrimac Street Newburyport, MA Tel: DarlingConsulting.com Page 13
14 Strategic ALCO or Analysis Paralysis? Earnings at Risk Ramps Static vs. Growth Model Parallel & Non-Parallel Shifts 1 Year vs. 5 Year Earnings at Risk Shocks Earnings at Risk Net Income (KEY) Value at Risk NEV Stress Testing NII, NEV Upwards of f25-30 scenarios each quarter! YIKES which ones to focus on? Gap Reporting (1 year? Use as data base, look to >5 year ) Core Funding Utilization poor man s surrogate for NEV, but powerful! What are the core scenarios to focus on when Developing Strategies? Darling Consulting Group, Inc. 260 Merrimac Street Newburyport, MA Tel: DarlingConsulting.com Page 14
15 Rate Ramps or Rate Shocks?... Earnings Simulations - Methodologies 10 Avg. Annual Change in Fed Funds ( ) = +/-180bps Jan-70 Jan-72 Jan-74 Jan-76 Jan-78 Jan-80 Jan-82 Jan-84 Jan-86 Jan-88 Jan-90 Jan-92 Jan-94 Jan-96 Jan-98 Jan-00 Jan-02 Jan-04 Jan-06 Jan-08 Jan Darling Consulting Group, Inc. 260 Merrimac Street Newburyport, MA Tel: DarlingConsulting.com Page 15
16 Flatter yield curve = continued pressure on margins for most Darling Consulting Group, Inc. 260 Merrimac Street Newburyport, MA Tel: DarlingConsulting.com Page 16
17 How Will The Long-End Behave As Fed Tightens? 34,350 Net Interest Income ($000) BASE SIMULATION -ALTERNATIVE SCENARIOS 30,575 Parallel Curve Shifts 26,800 Slope Matters 23,025 Yield Curve Flattening 19,250 15,475 Q1 Q2 Q3 Q4 Q1 Q2 Q3 Q4 Q1 Q2 Q3 Q4 Q1 Q2 Q3 Q4 Q1 Q2 Q3 Q4 Base Down 100BP Up 200BP Flat Up 200BP Up 400BP 24M NII SUMMARY Down 100BP Base Up 200BP Flat Up 200BP Up 400BP 24M Year-1 NII 90,562 91,191 91,103 89,894 91,230 Year-2 NII 85,655 90,642 92,121 87,221 92,442 Year-3 NII 80,054 88,855 97,455 89, ,541 Year-4 4NII 77,194 88, ,806 91, ,585 Year-5 NII 75,368 89, ,016 93, , Darling Consulting Group, Inc. 260 Merrimac Street Newburyport, MA Tel: DarlingConsulting.com Page 17
18 Flatter yield curve = continued pressure on margins for most Key variable: Pace of Fed Tightening Darling Consulting Group, Inc. 260 Merrimac Street Newburyport, MA Tel: DarlingConsulting.com Page 18
19 How Fast Will The Fed Tighten? 14,150 Net Interest Income ($000) p p 13,075 Pace Matters 12,000 More Aggressive Fed (+200bp 1 Year) More Gradual Fed (+200bp 2 Years) 10,925 9,850 8,775 Q1 Q2 Q3 Q4 Q1 Q2 Q3 Q4 Q1 Q2 Q3 Q4 Q1 Q2 Q3 Q4 Q1 Q2 Q3 Q4 Base Up 200BP 12M Up 200BP 24M Flat Up 200BP 12M Flat Up 200BP 24M NII SUMMARY Base Up 200BP 12M Up 200BP 24M Flat Up 200BP 12M Flat Up 200BP 24M Year-1 NII Year-2 NII Year-3 NII Year-4 NII 43,992 41,984 43,615 41,085 43,175 43,999 42,537 43,583 39,194 41,310 44,504 46,317 46,244 40,568 41,309 45,017 49,547 49,391 41,670 42,291 Year-5 NII 45,242 52,243 52,290 42,514 43, Darling Consulting Group, Inc. 260 Merrimac Street Newburyport, MA Tel: DarlingConsulting.com Page 19
20 How Asset Sensitive & When? 25,274 Net Interest Income ($000) 23,499 21,724 19,949 18,174 16,399 Q1 Q2 Q3 Q4 Q1 Q2 Q3 Q4 Q1 Q2 Q3 Q4 Q1 Q2 Q3 Q4 Q1 Q2 Q3 Q4 Base Up 200BP Up 400BP 24M Shock Up 300BP Shocks Can Be Misleading; WhyRampsAre Also Important Darling Consulting Group, Inc. 260 Merrimac Street Newburyport, MA Tel: DarlingConsulting.com Page 20
21 How Liability Sensitive (Shock vs. Ramps)? 11,643 Net Interest Income ($000) ALTERNATIVE SCENARIOS - SHOCK UP ,493 9,343 8,193 7,043 5,893 Q1 Q2 Q3 Q4 Q1 Q2 Q3 Q4 Q1 Q2 Q3 Q4 Q1 Q2 Q3 Q4 Q1 Q2 Q3 Q4 Base Up 200BP Up 400BP 24M Shock Up 300BP NII SUMMARY Base Up 200BP Up 400BP 24M Shock Up 300BP Year-1 NII 31,526 30,162 30,451 28,133 Year-2 NII 31,195 29,582 28,960 31,320 Year-3 NII 31,231 31,942 31,929 35,025 Year-4 NII 31,121 34,342 36,948 38,825 Year-5 NII 30,996 36,272 41,489 41, Darling Consulting Group, Inc. 260 Merrimac Street Newburyport, MA Tel: DarlingConsulting.com Page 21
22 Alternative Pace of Rising Rates Base Simulation as of 11/30/ Month Rate Movements Prolonged Rate Movements - 24 Months 13,150 Net Interest Income ($000) 13,150 Net Interest Income ($000) 12,525 12,525 11,900 11,900 11,275 11,275 10,650 10,650 10,025 Q1 Q2 Q3 Q4 Q1 Q2 Q3 Q4 Q1 Q2 Q3 Q4 Q1 Q2 Q3 Q4 Q1 Q2 Q3 Q4 10,025 Q1 Q2 Q3 Q4 Q1 Q2 Q3 Q4 Q1 Q2 Q3 Q4 Q1 Q2 Q3 Q4 Q1 Q2 Q3 Q4 Base Up 200BP Flat Up 200BP Base Up 200BP Flat Up 200BP NII SUMMARY NII SUMMARY Base Up 200BP Flat Up 200BP Base Up 200BP Flat Up 200BP Year-1 NII Year-2 NII Year-3 NII Year-4 NII Year-5 NII 45,923 44,782 44,462 Year-1 NII 45,923 45,362 45,174 45,605 43,746 42,553 Year-2 NII 45,605 44,108 43,279 45,567 45,210 42,760 Year-3 NII 45,567 44,730 42,689 45,823 47,950 43,551 Year-4 NII 45,823 47,260 43,312 46,319 50,066 44,109 Year-5 NII 46,319 49,330 43,872 CHANGE / DIFFERENCE IN RESULTS Base Up 200BP Flat Up 200BP Year-1 NII Year-2 NII Year-3 NII Year-4 NII Year-5 NII Pace closer to Forward Curve Darling Consulting Group, Inc. 260 Merrimac Street Newburyport, MA Tel: DarlingConsulting.com Page 22
23 Forward Curve Rates 13,275 Net Interest Income ($000) Forward Curve 12,575 11,875 11,175 10,475 9,775 Forward Curve 9,075 Q1 Q2 Q3 Q4 Q1 Q2 Q3 Q4 Q1 Q2 Q3 Q4 Q1 Q2 Q3 Q4 Q1 Q2 Q3 Q4 Base Down 100BP Up 200BP Flat Up 200BP Up 400BP 24M Forward Curve NII SUMMARY Down 100BP Base Up 200BP Flat Up 200BP Up 400BP 24M Forward Curve Year-1 NII 45,240 45,923 44,782 44,462 44,793 45,439 Year-2 NII 42,873 45,605 43,746 42,553 41,734 44,096 Year-3 NII 41,299 45,567 45,210 42,760 41,247 43,283 Year-4 NII 39,926 45,823 47,950 43,551 45,215 43,404 Year-5 NII 39,461 46,319 50,066 44,109 48,738 43,536 NOTE: Forward Curve as of 12/31/2015 and can be found on the next page Darling Consulting Group, Inc. 260 Merrimac Street Newburyport, MA Tel: DarlingConsulting.com Page 23
24 Parallel Rate Shocks (Instantaneous) 13,850 Net Interest Income ($000) Shock Analysis 12,850 11,850 10,850 9,850 8,850 Q1 Q2 Q3 Q4 Q1 Q2 Q3 Q4 Q1 Q2 Q3 Q4 Q1 Q2 Q3 Q4 Q1 Q2 Q3 Q4 Base Shock Down 100BP Shock Up 100BP Shock Up 200BP Shock Up 300BP Shock Up 400BP NII SUMMARY Shock Down 100BP Base Shock Up 100BP Shock Up 200BP Shock Up 300BP Shock Up 400BP Year-1 NII 44,331 45,923 44,837 43,656 41,952 40,242 Year-2 NII 41,957 45,605 45,172 44,250 42,245 40,231 Year-3 NII 40,583 45,567 46,037 45,848 44,458 43,058 Year-4 NII 39,354 45,823 47,610 48,538 48,215 47,870 Year-5 NII 38,989 46,319 48, ,618 51,004 51, Darling Consulting Group, Inc. 260 Merrimac Street Newburyport, MA Tel: DarlingConsulting.com Page 24
25 Net Economic Value (NEV) Fact and Fiction Darling Consulting Group, Inc. 260 Merrimac Street Newburyport, MA Tel: DarlingConsulting.com Page 25


26 Non-Maturity Deposit Assumption is KEY SAME CREDIT UNION DIFFERENT RESULTS NMDs = 5yr Avg. Life NMDs = 2.5yr 25 Avg. Life NMDs = 0yr Avg. Life Darling Consulting Group, Inc. 260 Merrimac Street Newburyport, MA Tel: DarlingConsulting.com Page 26
27 Net Economic Value of Equity RATE SHOCK SCENARIOS ASSETS Investments Loans Other Assets TOTAL ASSETS (EVA) % Chg from 0 Shock Book Value -100BP 0 Shock +100BP +200BP +300BP +400BP 350, , , , , , , , , , , , , ,608 10,526 10,526 10,526 10,526 10,526 10,526 10, , , , , , , , % 1.29% -2.29% -4.54% -6.68% -8.74% LIABILITIES Non Maturity Deposits Time Deposits Borrowings Other Liabilities TOTAL LIABILITIES (EVL) % Chg from 0 Shock 502, , , , , , , , , , , , , , ,642 4,642 4,642 4,642 4,642 4,642 4, , , , , , , , % 5.91% -3.66% -6.98% % % NET ECONOMIC VALUE (NEV) 77, , , , , , ,384 % Chg from 0 Shock Policy Limits -19.3% 3.8% 6.3% 8.1% 9.2% -10.0% -10.0% -20.0% -30.0% -40.0% NEV Ratio (NEV/EVA) BP Chg from 0 Shock Strong 11.19% 14.63% 18.35% 19.49% 20.44% 21.26% 21.96% Risk Summary Grid* Post Shock NEV/EVA Ratio Over 10% 6.00% to 10.00% 4.00% to 6.00% Below 4.00% 0 to 100bp 100 to 200bp 200 to 400bp Over 400bp Min. Risk -1 Min. Risk -1 MIN. RISK (1) Mod. Risk -2 Min. Risk -1 Min. Risk -1 Mod. Risk -2 Sig. Risk -3 Min. Risk -1 Mod. Risk -2 Sig. Risk -3 High Risk -4 Mod. Risk -2 Sig. Risk -3 High Risk -4 High Risk -4 *Included for discussion purposes only. Grid evaluates +200/-100 scenarios for risk assessment. *Current risk assessment for Risk Summary Grid is based on -100 scenario. Average lives of non-maturity deposits are based upon DCG deposit study. The aggregate average life based upon the current deposit mix is 8.03 years. Please refer to Deposit Study Tear Sheet for additional documentation Darling Consulting Group, Inc. 260 Merrimac Street Newburyport, MA Tel: DarlingConsulting.com Page 27 27
28 Core Funding Utilization Improving INTEREST RATE SCENARIOS Base Down 100BP Up 200BP Up 400BP 24M Assets ( > 60 Months) 109,444 82, , ,147 Cumulative Cumulative Cumulative Cumulative Core Liabilities ( > 60 Months) Volume Excess Volume Excess Volume Excess Volume Excess Equity 77,550 77,550 77,550 77,550 Other Liabilities 4,642 4,642 4,642 4,642 DDA 67,702 40,450 67,702 67,357 67,702 23,981 67,702 19,747 Shares 187, , , , , , , , , , , ,779 % Utilization 32.4% 24.4% 37.3% 38.5% HISTORICAL ASSESSMENT June 30, % 20.5% 32.1% 33.5% March 31, % 14.8% 25.3% 26.2% December 31, % 11.4% 21.5% 22.1% September 30, % 11.0% 21.1% 21.6% NOTE #1: Core funding utilization measures the long term structural position of the balance sheet (i.e. NEV simulation) and quantifies the degree to which the Credit Union utilizes long-term (i.e. >5-years) funding sources to support long-term assets. The cumulative excess may be used as an indicator of the Credit Union's capacity to add additional long-term assets Darling Consulting Group, Inc. 260 Merrimac Street Newburyport, MA Tel: DarlingConsulting.com Page 28
29 CORE Funding LOW, Stable INTEREST RATE SCENARIOS Base Down 100BP Up 200BP Up 400BP 24M Assets ( > 60 Months) 609, , , ,202 Cumulative Cumulative Cumulative Cumulative Core Liabilities ( > 60 Months) Volume Excess Volume Excess Volume Excess Volume Excess Equity 645,817 36, ,817 82, , ,817 Other Liabilities DDA 72, ,288 72, ,662 72,692 70,014 72, , , , , , , ,776 55, ,083 NOW 729,242 1,420, ,242 1,466, ,242 1,381, ,242 1,366,325 Savings 343,686 1,763, ,686 1,810, ,686 1,724, ,686 1,710,011 Other Deposits 3,879 1,767,871 3,879 1,814,245 3,879 1,728,597 3,879 1,713,890 Borrowings 7,617 1,775,488 7,617 1,821,862 7,617 1,736,214 7,617 1,721,507 2,384,709 2,384,709 2,384,709 2,384,709 % Utilization 25.5% 23.6% 27.2% 27.8% HISTORICAL ASSESSMENT September 30, % 22.6% 26.8% 27.5% June 30, % 23.7% 27.4% 28.0% March 31, % 21.9% 26.2% 26.9% December 31, % 23.6% 27.9% 28.6% NOTE #1: Core funding utilization measures the long term structural position of the balance sheet (i.e. EVE simulation) and quantifies the degree to which the Bank utilizes long-term (i.e. >5-years) funding sources to support long-term assets. The cumulative excess may be used as an indicator of the Bank's capacity to add additional long-term assets Darling Consulting Group, Inc. 260 Merrimac Street Newburyport, MA Tel: DarlingConsulting.com Page 29
30 Flatter yield curve = continued pressure on margins for most Key variable: Pace of Fed Tightening Important Q: Depositor Behavior as Fed Raises Rates? Darling Consulting Group, Inc. 260 Merrimac Street Newburyport, MA Tel: DarlingConsulting.com Page 30
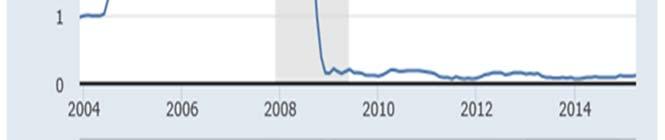
31 Deposit Composition/Historical Behavior (Sample) Deposit Mix 20 25% Current Industry NMD Balances > Trend Line Growth 1, ? ns Millio Call Report Data Sourced from SNL Financial 0 NIB NMD IB NMD Time Deposits 3M LIBOR Cost of IB Deposits (%) Darling Consulting Group, Inc. 260 Merrimac Street Newburyport, MA Tel: DarlingConsulting.com Page 31
32 Deposit Strategy: An Important First Point Deposit Pricing Discipline & Strategy Is A Key Business Issue Darling Consulting Group, Inc. 260 Merrimac Street Newburyport, MA Tel: DarlingConsulting.com Page 32


33 An Invaluable Decision Support Tool COST OF FUNDS MANAGEMENT The Importance of Marginal Cost Analysis Darling Consulting Group, Inc. 260 Merrimac Street Newburyport, MA Tel: DarlingConsulting.com Page 33
34 Marginal Cost of Funds Example MMDA BALANCE: $50,000 CURRENT RATE: 0.35% RUNOFF PROTECTED RATE INCREASE 0.25% 0.50% 1.00% 10.00% 2.85% 5.35% 10.35% 20.00% 00% 1.60% 2.85% 5.35% 30.00% 1.18% 2.02% 3.68% Annualized NII Impact (000s) ($125) ($250) ($500) Liquidity a factor in deposit initiatives Darling Consulting Group, Inc. 260 Merrimac Street Newburyport, MA Tel: DarlingConsulting.com Page 34
35 Marginal Cost of Funds Example Following represents marginal cost of conversion of current deposits for a promotional product and required growth to offset Balance Rate Ann. Int. Expense Cost of Conversion Required Growth Offset Existing Savings/MM DA base: 50, % 175 Spread Assumed on Growth Promotional / Defensive 7 Month CD Rate: 1.250% 2% 3% 4% % Converted Cost of Conversion: 10% 0.440% ,250 1,500 1,125 20% 0.530% ,500 3,000 2, % 0.620% ,750 4,500 3,375 40% 0.710% ,000 6,000 4,500 50% 0.800% ,250 7,500 5, Darling Consulting Group, Inc. 260 Merrimac Street Newburyport, MA Tel: DarlingConsulting.com Page 35


36 Deposit Strategy: An Important Second Point HOW CORE ARE MY DEPOSITS? & What Should I Do To Better Understand Potential Ramifications? Darling Consulting Group, Inc. 260 Merrimac Street Newburyport, MA Tel: DarlingConsulting.com Page 36
37 Liability Pricing: Mirror, Mirror on the Wall* Consider Dividend est. 4.10% (x 1/20th of spread between advance rate and dividend rate). (4.10%-.60%=3.50%) X (1/20 th stock req.)=18bps! No NCUA Insurance premium No operational costs or cannibalization Least expensive source of funds at the margin SO, WHAT GETS IN THE WAY? (a rhetorical question I ve heard it all) *article written for FHLBNY on effective use of wholesale funding.read it and share it with Board! 2015 Darling Consulting Group, Inc. 260 Merrimac Street Newburyport, MA Tel: DarlingConsulting.com Page 37 37


38 If Asset Sensitive Consider: Understand capacity to extend assets Extend cash Mismatched leverage Hold fixed rate mortgages Flexibility with commercial/business deals and structures Darling Consulting Group, Inc. 260 Merrimac Street Newburyport, MA Tel: DarlingConsulting.com Page 38
39 If Liability Sensitive Consider: Understand magnitude of exposure More fearful of rising or falling rates? If extending: how much insurance and how far out on the curve? Deposit pricing game plan Shorten assets? Darling Consulting Group, Inc. 260 Merrimac Street Newburyport, MA Tel: DarlingConsulting.com Page 39
40 Strategies For All Shapes and Sizes NO One Size Fits All Strategy Darling Consulting Group, Inc. 260 Merrimac Street Newburyport, MA Tel: DarlingConsulting.com Page 40
41 Investment Strategy (not getting easier) Danger, Danger Will Robinson! Opportunity or Trap? Avoid cash build up AVOID CALLABLE BONDS BEWARE PREMIUMS CMO s? Better Do homework!!! Compare to Loans (incl. 30 yr FR) Pre-Invest 2016 CF if cant absorb b into loans!? Extension Risk Concerns?: Can we support? Key Q: If not loan demand, how to offset Margin Compression? Earnings? Consider Impact on IRR, NEV and NII Darling Consulting Group, Inc. 260 Merrimac Street Newburyport, MA Tel: DarlingConsulting.com Page 41
42 Pre-investment Cash Flows to Base Simulation as of 9/30/2013 $35MM Pre-Investment Strategy Net Interest Income ($000) Net Interest Income ($000) 6,225 6,225 5,575 5,575 4,925 4,925 4,275 4,275 3,625 3, ,975 Q1 Q2 Q3 Q4 Q1 Q2 Q3 Q4 Q1 Q2 Q3 Q4 Q1 Q2 Q3 Q4 Q1 Q2 Q3 Q4 2,975 Q1 Q2 Q3 Q4 Q1 Q2 Q3 Q4 Q1 Q2 Q3 Q4 Q1 Q2 Q3 Q4 Q1 Q2 Q3 Q4 Base Down 100BP Up 200BP Up 400BP 24M Yield Curve Twist Base Down 100BP Up 200BP Up 400BP 24M Yield Curve Twist NII SUMMARY NII SUMMARY Down 100BP Base Up 200BP Up 400BP 24M Yield Curve Twist Down 100BP Base Up 200BP Up 400BP 24M Yield Curve Twist Year-1 NII Year-2 NII Year-3 NII 15,897 15,730 14,911 14,911 15,956 Year-1 NII 16,326 16,101 15,200 15,200 16,265 15,300 15,861 15,472 14,748 16,787 Year-2 NII 15,687 16,065 15,494 14,671 16,936 14,756 16,161 17,284 17,062 16,098 Year-3 NII 15,133 16,364 17,223 16,863 16,434 Year-4 NII 14,431 16,383 18,689 19,741 16,313 Year-4 NII 14,766 16,586 18,714 19,723 16,671 Year-5 NII 14,237 16,577 19,826 21,958 17,489 Year-5 NII 14,533 16,780 19,927 22,099 17,970 CHANGE / DIFFERENCE IN RESULTS Down 100BP Base Up 200BP Up 400BP 24M Yield Curve Twist Year-1 NII Year-2 NII Year-3 NII Year-4 NII Year-5 NII Pre-invest $35MM into a 15 Yr MBS at 2.32% and funded with overnight borrowings. The overnight borrowings are paid down with investment cash flow Darling Consulting Group, Inc. 260 Merrimac Street Newburyport, MA Tel: DarlingConsulting.com Page 42
43 Example 1: Loan Growth Critical Darling Consulting Group, Inc. 260 Merrimac Street Newburyport, MA Tel: DarlingConsulting.com Page 43


44 Loan Growth Funded with Investments & FHLB $20MM Loan Growth (combination of ARMs & Long Term Loans) Funded $10MM Bond CF, $5MM ST FHLB, $5MM 3Yr FHLB Question: Do we need term borrowings? NO, but tfeels better for some Darling Consulting Group, Inc. 260 Merrimac Street Newburyport, MA Tel: DarlingConsulting.com Page 44
45 Loan Growth Impact on Liquidity Darling Consulting Group, Inc. 260 Merrimac Street Newburyport, MA Tel: DarlingConsulting.com Page 45
46 Example 2: Loan Growth for Liability Sensitive Position Darling Consulting Group, Inc. 260 Merrimac Street Newburyport, MA Tel: DarlingConsulting.com Page 46
47 1 Year Growth Model: $232 Million Base Simulation as of 11/30/2015 Growth Model 16,175 Net Interest Income ($000) 16,175 Net Interest Income ($000) 14,475 14,475 12,775 12,775 11,075 11,075 9,375 9,375 7,675 Q1 Q2 Q3 Q4 Q1 Q2 Q3 Q4 Q1 Q2 Q3 Q4 Q1 Q2 Q3 Q4 Q1 Q2 Q3 Q4 7,675 Q1 Q2 Q3 Q4 Q1 Q2 Q3 Q4 Q1 Q2 Q3 Q4 Q1 Q2 Q3 Q4 Q1 Q2 Q3 Q4 Base Down 100BP Up 200BP Up 400BP 24M Forward Curve Base Down 100BP Up 200BP Up 400BP 24M Forward Curve NII SUMMARY NII SUMMARY Down 100BP Base Up 200BP Up 400BP 24M Forward Curve Down 100BP Base Up 200BP Up 400BP 24M Forward Curve Year-1 NII Year-2 NII Year-3 NII 45,240 45,923 44,782 44,793 45,439 Year-1 NII 48,841 49,870 49,218 49,230 49,442 42,873 45,605 43,746 41,734 44,096 Year-2 NII 49,792 53,477 52,750 50,734 52,059 41,299 45,567 45,210 41,247 43,283 Year-3 NII 48,190 53,439 53,919 48,774 50,997 Year-4 NII 39,926 45,823 47,950 45,215 43,404 Year-4 NII 46,699 53,695 56,742 52,353 50,997 Year-5 NII 39,461 46,319 50,066 48,738 43,536 Year-5 NII 46,161 54,217 59,037 56,419 51,254 CHANGE / DIFFERENCE IN RESULTS Down 100BP Base Up 200BP Up 400BP 24M Forward Curve Year-1 NII Year-2 NII 3,602 3,947 6,920 7,872 4,437 4,437 4,003 9,004 9,000 7,963 Year-3 NII Year-4 NII Year-5 NII 6,890 7,872 8,708 7,527 7,714 6,773 7,872 8,793 7,139 7,593 6,700 7,897 8,971 7,681 7,718 Assumes $232 million of asset growth over the next 12 months: CRE: $140MM, C&I: $75MM, CRE Construction: $9MM, and Agencies: $64MM. Growth funded by the following: DDA: $20MM, MMDA: $88MM, TD: $151MM, and FRB Cash: $52MM (assumes $44MM of NOW and Savings outflows). Note: $52MM of Agency purchases with cash is captured as subsequent activity in the base simulation Darling Consulting Group, Inc. 260 Merrimac Street Newburyport, MA Tel: DarlingConsulting.com Page 47
48 Example 3: Getting CASH OUT! Darling Consulting Group, Inc. 260 Merrimac Street Newburyport, MA Tel: DarlingConsulting.com Page 48
49 $20MM Loan Growth & Investments Funded by CASH Base Simulation as of 10/31/2015 Redeployment of Cash Investments 11,125 Net Interest Income ($000) 11,125 Net Interest Income ($000) 10,075 10,075 9,025 9,025 7,975 7,975 6,925 6,925 5,875 Q1 Q2 Q3 Q4 Q1 Q2 Q3 Q4 Q1 Q2 Q3 Q4 Q1 Q2 Q3 Q4 Q1 Q2 Q3 Q4 5,875 Q1 Q2 Q3 Q4 Q1 Q2 Q3 Q4 Q1 Q2 Q3 Q4 Q1 Q2 Q3 Q4 Q1 Q2 Q3 Q4 Base Down 100BP Up 200BP Flat Up 200BP Up 400BP 24M Base Down 100BP Up 200BP Flat Up 200BP Up 400BP 24M NII SUMMARY NII SUMMARY Down 100BP Base Up 200BP Flat Up 200BP Up 400BP 24M Down 100BP Base Up 200BP Flat Up 200BP Up 400BP 24M Year-1 NII Year-2NII Year-3 NII 32,242 32,755 33,616 33,167 33,856 Year-1 NII 32,813 33,318 33,996 33,527 34,236 30,258 32,289 32,491 30,905 34,038 Year-2NII 30,862 32,876 32,735 31,117 34,068 28,988 32,162 33,675 31,052 34,105 Year-3 NII 29,569 32,749 33,970 31,291 34,054 Year-4 NII 28,075 32,094 35,074 31,706 36,932 Year-4 NII 28,619 32,681 35,444 31,981 37,041 Year-5 NII 27,325 32,154 36,519 32,333 39,735 Year-5 NII 27,854 32,741 36,916 32,620 39,901 CHANGE / DIFFERENCE IN RESULTS Down 100BP Base Up 200BP Flat Up 200BP Up 400BP 24M Year-1 NII Year-2 NII Year-3 NII Year-4 NII Year-5 NII Assume $20MM of cash investments are redeployed. Cash redeploys into $14MM 30yr 4.00%, $1.5MM 2yr 0.95%, $3MM 3yr 1.25%, and $1.5MM 5yr 1.75% Darling Consulting Group, Inc. 260 Merrimac Street Newburyport, MA Tel: DarlingConsulting.com Page 49
50 Example 4: Earnings Enhance/Capital Management Strategy (a.k.a. LEVERAGE) Darling Consulting Group, Inc. 260 Merrimac Street Newburyport, MA Tel: DarlingConsulting.com Page 50
51 MBS Purchase Funded w/ Short-Term FHLB Base Simulation as of 1/31/2014 $40MM 10Y 2.5% Coupon MBS Purchase Funded Short 10,750 Net Interest Income ($000) 10,750 Net Interest Income ($000) 9,875 9,875 9,000 9,000 8,125 8,125 7,250 7,250 6,375 Q1 Q2 Q3 Q4 Q1 Q2 Q3 Q4 Q1 Q2 Q3 Q4 Q1 Q2 Q3 Q4 Q1 Q2 Q3 Q4 6,375 Q1 Q2 Q3 Q4 Q1 Q2 Q3 Q4 Q1 Q2 Q3 Q4 Q1 Q2 Q3 Q4 Q1 Q2 Q3 Q4 Base Down 100BP Up 200BP Up 400BP 24M Yield Curve Twist Base Down 100BP Up 200BP Up 400BP 24M Yield Curve Twist NII SUMMARY NII SUMMARY Down 100BP Base Up 200BP Up 400BP 24M Yield Curve Twist Down 100BP Base Up 200BP Up 400BP 24M Yield Curve Twist Year-1 NII Year-2 NII Year-3 NII 30,708 31,196 32,391 32,513 31,397 Year-1 NII 31,198 31,719 32,656 32,778 31,959 30,235 31,694 32,662 34,197 32,297 Year-2 NII 30,699 32,241 32,614 33,835 32,855 29,665 31,800 33,691 34,990 32,212 Year-3 NII 30,068 32,346 33,758 34,430 31,959 Year-4 NII 29,217 31,898 34,886 37,335 34,544 Year-4 NII 29,570 32,444 35,056 37,002 33,924 Year-5 NII 28,998 32,053 35,789 39,181 36,080 Year-5 NII 29,310 32,599 36,042 39,041 35,617 CHANGE / DIFFERENCE IN RESULTS Down 100BP Base Up 200BP Up 400BP 24M Yield Curve Twist Year-1 NII Year-2 NII Year-3 NII Year-4 NII Year-5 NII A $40MM purchase of 10Y 2.50% MBS securities (1.67%) is funded via 3M FHLB advances (0.30%) Darling Consulting Group, Inc. 260 Merrimac Street Newburyport, MA Tel: DarlingConsulting.com Page 51
52 Example 5: Funding Extension Darling Consulting Group, Inc. 260 Merrimac Street Newburyport, MA Tel: DarlingConsulting.com Page 52
53 Funding Extension? Earnings Impact? Darling Consulting Group, Inc. 260 Merrimac Street Newburyport, MA Tel: DarlingConsulting.com Page 53
54 Funding Extension with Growth Impact of adding growth to funding extension Darling Consulting Group, Inc. 260 Merrimac Street Newburyport, MA Tel: DarlingConsulting.com Page 54
55 Market with Strong Loan Demand Darling Consulting Group, Inc. 260 Merrimac Street Newburyport, MA Tel: DarlingConsulting.com Page 55
56 Reinvest Investment Cash Flow into Loans Base Simulation as of 9/30/2013 Alt Investment Cash Flow Assumption - Loans Net Interest Income ($000) Net Interest Income ($000) 8,150 8,150 6,900 6,900 5,650 5,650 4,400 4,400 3,150 3, ,900 Q1 Q2 Q3 Q4 Q1 Q2 Q3 Q4 Q1 Q2 Q3 Q4 Q1 Q2 Q3 Q4 Q1 Q2 Q3 Q4 1,900 Q1 Q2 Q3 Q4 Q1 Q2 Q3 Q4 Q1 Q2 Q3 Q4 Q1 Q2 Q3 Q4 Q1 Q2 Q3 Q4 Base Down 100BP Up 200BP Flat Up 500BP Yield Curve Twist Base Down 100BP Up 200BP Flat Up 500BP Yield Curve Twist NII SUMMARY NII SUMMARY Down 100BP Base Up 200BP Flat Up 500BP Yield Curve Twist Down 100BP Base Up 200BP Flat Up 500BP Yield Curve Twist Year-1 NII Year-2 NII Year-3 NII 19,254 19,478 18,679 18,330 19,775 Year-1 NII 19,934 20,079 19,270 18,869 20,359 16,686 18,461 17,968 15,871 19,486 Year-2 NII 19,292 20,547 19,963 17,529 21,363 14,544 17,766 18,969 16,774 17,540 Year-3 NII 18,697 21,286 22,238 19,011 20,327 Year-4 NII 13,295 17,574 20,226 19,596 17,815 Year-4 NII 18,753 22,620 24,887 22,550 21,461 Year-5 NII 12,205 17,184 21,659 23,230 20,332 Year-5 NII 18,956 23,812 27,785 26,741 24,411 CHANGE / DIFFERENCE IN RESULTS Down 100BP Base Up 200BP Flat Up 500BP Yield Curve Twist Year-1 NII Year-2 NII ,606 2, ,995 1,658 1,877 Year-3 NII Year-4 NII Year-5 5NII 4,152 3,521 3,268 2,237 2,787 5,458 5,046 4,661 2,954 3, ,752 6, ,126 3,511 4,079 NOTE: In the base simulation, all investment cash flow is assumed to roll into a blend of 2-5 year Agencies and Investment CDs. This alternative simulation assumes that all investment cash flow will fund 30 Yr Residential 4.25% Darling Consulting Group, Inc. 260 Merrimac Street Newburyport, MA Tel: DarlingConsulting.com Page 56
57 Portfolio Mortgages & Adjust Deposit Pricing Base Model as of 12/31/2014 Combined Alt. Bond Cashflow/Deposit Pricing 6,975 Net Interest Income ($000) 6,975 Net Interest Income ($000) 5,825 5,825 4,675 4,675 3,525 3,525 2,375 2, ,225 Q1 Q2 Q3 Q4 Q1 Q2 Q3 Q4 Q1 Q2 Q3 Q4 Q1 Q2 Q3 Q4 Q1 Q2 Q3 Q4 1,225 Q1 Q2 Q3 Q4 Q1 Q2 Q3 Q4 Q1 Q2 Q3 Q4 Q1 Q2 Q3 Q4 Q1 Q2 Q3 Q4 Base Up 200BP Up 400BP 24M Flat Up 500BP Base Up 200BP Up 400BP 24M Flat Up 500BP NII SUMMARY NII SUMMARY Base Up 200BP Up 400BP 24M Flat Up 500BP Base Up 200BP Up 400BP 24M Flat Up 500BP Year-1 NII 19,237 17,971 18,040 17,430 Year-1 NII 19,390 18,763 18,769 18,461 Year-2 NII 18, ,916 14, ,466 Year-2 NII 18,599 17, ,845 15,763 Year-3 NII 19,624 16,838 12,970 9,497 Year-3 NII 20,392 18,980 16,492 14,086 Year-4 NII 22,719 19,127 14,007 9,665 Year-4 NII 23,767 21,559 17,930 14,601 Year-5 NII 22,500 19,688 15,473 11,121 Year-5 NII 23,802 22,377 19,687 16,327 CHANGE / DIFFERENCE IN RESULTS Base Up 200BP Up 400BP 24M Flat Up 500BP Year-1 NII Year-2 NII Year-3 NII Year-4 NII Year-5NII , ,801 2,412 3, ,141 3,521 4,589 1,048 2,432 3,923 4,936 1,303 2,688 4,214 5,206 Assumes all bond cashflow reinvests into 30 YR fixed 3.90% (rather than a 20 YR 2.00% in the base case simulation).assumes all bond cashflow reinvests into 30 YR fixed 3.90% (rather than a 20 YR 2.00% in the Assumes deposit betas are based-off those from the 6/30/14 review. Aggregate betas of NMD's & CD's in strategy are approximately 50% & 90% respectively. Aggregate betas of NMD's & CD's in base case simulation are approximately 75% & 100% respectively Darling Consulting Group, Inc. 260 Merrimac Street Newburyport, MA Tel: DarlingConsulting.com Page 57
58 Market with Weak Loan Demand Darling Consulting Group, Inc. 260 Merrimac Street Newburyport, MA Tel: DarlingConsulting.com Page 58
59 $10 Million Loan Purchase Funded Short Base Model as of 4/30/2014 $10M Purchased Loans Net Interest Income ($000) Net Interest Income ($000) 4,125 4,125 3,575 3,575 3,025 3,025 2,475 2,475 1,925 1,925 1,375 Q1 Q2 Q3 Q4 Q1 Q2 Q3 Q4 Q1 Q2 Q3 Q4 Q1 Q2 Q3 Q4 Q1 Q2 Q3 Q4 1,375 Q1 Q2 Q3 Q4 Q1 Q2 Q3 Q4 Q1 Q2 Q3 Q4 Q1 Q2 Q3 Q4 Q1 Q2 Q3 Q4 Base Down 100BP Up 200BP Up 400BP 24M Yield Curve Twist Base Down 100BP Up 200BP Up 400BP 24M Yield Curve Twist NII SUMMARY NII SUMMARY Down 100BP Base Up 200BP Up 400BP 24M Yield Curve Twist Down 100BP Base Up 200BP Up 400BP 24M Yield Curve Twist Year-1 NII Year-2 NII Year-3 NII 10,214 10,355 10,608 10,688 10,471 Year-1 NII 10,497 10,629 10,787 10,867 10,747 9, ,992 11,056 10,956 10,517 Year-2 NII 9,463 10,271 11, ,963 10,778 8,480 9,863 11,626 11,990 10,515 Year-3 NII 8,758 10,146 11,753 11,941 10,583 Year-4 NII 8,230 9,953 12,185 13,167 11,063 Year-4 NII 8,501 10,239 12,334 13,160 11,031 Year-5 NII 7,645 9,715 12,652 14,532 11,852 Year-5 NII 7,910 10,005 12,820 14,563 11,842 CHANGE / DIFFERENCE IN RESULTS Down 100BP Base Up 200BP Up 400BP 24M Yield Curve Twist Year-1 NII Year-2 NII Year-3 NII Year-4 NII Year-5 NII This model assumes $5M of Resi 5/1 ARM (@ 2.50%), $2.5M of Resi 7/1 ARM (@ 3%) and $2.5M of 30 Yr Jumbo (@ 3.875%) funded with short term funding (@ 25 bps) Darling Consulting Group, Inc. 260 Merrimac Street Newburyport, MA Tel: DarlingConsulting.com Page 59
60 Extension of Overnight Cash to 15 Year MBS Darling Consulting Group, Inc. 260 Merrimac Street Newburyport, MA Tel: DarlingConsulting.com Page 60
61 Strategy Revisited Cash Deployment into MBS (discuss why avoided so long) Darling Consulting Group, Inc. 260 Merrimac Street Newburyport, MA Tel: DarlingConsulting.com Page 61 61
62 $75 Million Cash Extension into MBS Base Simulation as of 3/31/2014 $75 Million MBS Purchase 7,525 Net Interest Income ($000) 7,525 Net Interest Income ($000) 6,400 6,400 5,275 5,275 4,150 4,150 3,025 3,025 1,900 Q1 Q2 Q3 Q4 Q1 Q2 Q3 Q4 Q1 Q2 Q3 Q4 Q1 Q2 Q3 Q4 Q1 Q2 Q3 Q4 1,900 Q1 Q2 Q3 Q4 Q1 Q2 Q3 Q4 Q1 Q2 Q3 Q4 Q1 Q2 Q3 Q4 Q1 Q2 Q3 Q4 Base Down 100BP Up 200BP Up 400BP 24M Yield Curve Twist Base Down 100BP Up 200BP Up 400BP 24M Yield Curve Twist NII SUMMARY NII SUMMARY Down 100BP Base Up 200BP Up 400BP 24M Yield Curve Twist Down 100BP Base Up 200BP Up 400BP 24M Yield Curve Twist Year-1 NII Year-2 NII Year-3 NII 15,263 15,795 16,713 16,709 15,975 Year-1 NII 17,447 17,948 18,178 18,174 18,178 13,465 16,229 18,251 19,368 17,557 Year-2 NII 15,781 18,483 19,221 19,543 19,637 12,447 16,387 19,191 21,503 21,324 Year-3 NII 14,684 18,642 20,325 21,310 21,690 Year-4 NII 11,934 16,301 20,564 23,202 23,931 Year-4 NII 14,090 18,556 21,858 23,359 23,795 Year-5 NII 11,579 16,023 21,817 25,034 25,057 Year-5 NII 13,665 18,277 23,250 25,494 25,115 CHANGE / DIFFERENCE IN RESULTS Down 100BP Base Up 200BP Up 400BP 24M Yield Curve Twist Year-1 NII Year-2 NII 2,185 2,153 2,317 2,254 1,465 1,465 2, ,080 Year-3 NII Year-4 NII Year-5 NII 2,237 2,255 1, ,156 2,255 1, ,086 2,255 1, Assumes $75 million of cash equivalents is invested evenly in month one into a 15 year MBS at 2.77% and a 30 year discounted jumbo MBS at 3.75% Darling Consulting Group, Inc. 260 Merrimac Street Newburyport, MA Tel: DarlingConsulting.com Page 62


63 Purchase Discounted 30 Year MBS Funded with Laddered FHLBNY Advances Base Simulation as of 9/30/13 MBS Purchases Net Interest Income ($000) Net Interest Income ($000) 3,925 3,925 3,575 3,575 3,225 3,225 2,875 2,875 2,525 2,525 2,175 Q1 Q2 Q3 Q4 Q1 Q2 Q3 Q4 Q1 Q2 Q3 Q4 Q1 Q2 Q3 Q4 Q1 Q2 Q3 Q4 2,175 Q1 Q2 Q3 Q4 Q1 Q2 Q3 Q4 Q1 Q2 Q3 Q4 Q1 Q2 Q3 Q4 Q1 Q2 Q3 Q4 Base Down 100BP Up 200BP Up 400BP 24M Flat Up 500BP Base Down 100BP Up 200BP Up 400BP 24M Flat Up 500BP NII SUMMARY NII SUMMARY Down 100BP Base Up 200BP Up 400BP 24M Flat Up 500BP Down 100BP Base Up 200BP Up 400BP 24M Flat Up 500BP Year-1 NII Year-2 NII Year-3 NII 11,710 11,727 11,548 11,557 11,497 Year-1 NII 12,010 12,034 11,855 11,864 11,799 11,115 11,272 11,542 11,518 11,347 Year-2 NII 11,427 11,599 11,811 11,750 11,538 10,646 10,943 11,808 12,162 11,862 Year-3 NII 10,956 11,279 12,052 12,290 11,897 Year-4 NII 10,237 10,710 12,094 13,081 12,958 Year-4 NII 10,556 11,066 12,323 13,158 12,904 Year-5 NII 10,011 10,592 12,453 14,081 14,198 Year-5 NII 10,321 10,948 12,700 14,197 14,181 CHANGE / DIFFERENCE IN RESULTS Down 100BP Base Up 200BP Up 400BP 24M Flat Up 500BP Year-1 NII Year-2 NII Year-3 NII Year-4 NII Year-5 NII $10MM of 30Y Jumbo 3.74% is funded with $4MM of 1Y FHLB, $3MM 2Y FHLB, and $3MM 3Y FHLB Darling Consulting Group, Inc. 260 Merrimac Street Newburyport, MA Tel: DarlingConsulting.com Page 63
64 Key Takeaways Margins Under Pressure.expect more of the same 2016 Rising Rates HELPS! Flatter Curve will require GROWTH and/or shift in mix Member Behavior a Wildcard in 2016 (COF mgm t KEY) OPPORTUNITIES EXIST NOW! Take Action that fits your CU and not what others are doing or based on Regulator fears Wholesale Funds are a CU s best friend, use them to your Strategic Advantage! Darling Consulting Group, Inc. 260 Merrimac Street Newburyport, MA Tel: DarlingConsulting.com Page 64


65 BUT What s On Your Mind? Interest Rate Risk (Asset vs. Liability Sensitive) Role of Derivatives (Swaps/Caps/Floors) Capital Management/NEV Investment Portfolio Mgmt. Particular Regulatory Concerns/Issues Other Darling Consulting Group, Inc. 260 Merrimac Street Newburyport, MA Tel: DarlingConsulting.com Page 65
66 Darling Consulting Group, Inc. 260 Merrimac Street Newburyport, MA Tel: DarlingConsulting.com Page 66
RISING Rates Are Here Again Time to Celebrate or Danger Ahead?
 Risk Management Strategy & Solutions RISING Rates Are Here Again Time to Celebrate or Danger Ahead? November 9, 2017 Frank Farone, Managing Director ffarone@darlingconsulting.com 2017 Darling Consulting
FHLB Des Moines Regional Member Meetings Profiting from a Rising Rate Environment
 Risk Management Strategy & Solutions FHLB Des Moines Regional Member Meetings Profiting from a Rising Rate Environment Joseph Kennerson, Managing Director jkennerson@darlingconsulting.com Mark A. Haberland,
Credit Union Survival in a Challenging
 Credit Union Survival in a Challenging Environment How to Make Balance Sheet Strategy Decisions with Confidence January 24, 2013 C O M P L E T E ALM SOLUTIONS Frank L. Farone Managing Director Darling
Elevate Your Credit Union s Performance Now is NOT the Time for Business as Usual!
 Risk Management Strategy & Solutions Elevate Your Credit Union s Performance Now is NOT the Time for Business as Usual! 2017 Darling Consulting Group, Inc. 260 Merrimac Street Newburyport, MA 01950 Tel:
How to Improve Liquidity
 How to Improve Liquidity As Economic Conditions Change June 26, 2017 9:15 am Presented by: Joe Kennerson Managing Director Darling Consulting Group 260 Merrimac Street Newburyport, MA 01950 P: 978-463-0400
Key ALM Assumptions for Rising Rates. Current Landscape Interest Rates CU Balance Sheet & Financial Performance Trends
 CONNECT WITH US Key ALM Assumptions for Rising Rates Lisa Boylen Senior ALM Analyst February 21, 2018 Objectives Current Landscape Interest Rates CU Balance Sheet & Financial Performance Trends Planning
MANAGING INTEREST RATE RISK: SETTING THE STAGE FOR TOMORROW MIKE DELISLE, ALM ADVISORS GROUP
 MANAGING INTEREST RATE RISK: SETTING THE STAGE FOR TOMORROW MIKE DELISLE, ALM ADVISORS GROUP WVBA Convention July 29, 2014 Agenda Evaluating and Anticipating the Rate Environment Understanding Your Current
Asset/Liability Management
 Asset/Liability Management FHLB System Sales and Marketing Meeting Scottsdale, AZ February 27 th, 2016 Ryan W. Hayhurst Managing Director Financial Strategies Group ryan@gobaker.com 800-962-9468 The Baker
ASSET/LIABILITY MANAGEMENT - YEAR 2
 ASSET/LIABILITY MANAGEMENT - YEAR 2 Interest Rate Risk Measurement & Management Raleigh A. Trovillion Executive Vice President UMB Bank Investment Division St. Louis, MO raleigh.trovillion@umb.com 314-612-8039
Advanced Asset/Liability Management
 Advanced Asset/Liability Management WBA BOLT Summer Leadership Summit June 14, 2018 Presented by: Marc Gall, Vice President mgall@bokf.com 1 Agenda Asset/Liability Management Summary Developing Assumptions
Interest Rate Risk Basics Measuring & Managing Earnings & Value at Risk
 Interest Rate Risk Basics Measuring & Managing Earnings & Value at Risk Presented By: David W. Koch Chief Operating Officer FARIN & Associates, Inc.. dkoch@farin.com 1 Session Overview Session 1 Define
Interest Rate Risk Basics Measuring & Managing Earnings & Value at Risk
 Interest Rate Risk Basics Measuring & Managing Earnings & Value at Risk Urum Urumoglu Senior Consultant FARIN & Associates, Inc.. Urum@farin.com 1 Session Overview Session 1 Define Interest Rate Risk IRR
What is a Dynamic ALCO
 Managing a Dynamic ALCO Managing Earnings, Value and Liquidity Risks in your Decision Making Process Presented By: David Koch President & CEO dkoch@farin.com (608) 661-4217 1 What is a Dynamic ALCO Dynamic
The Regulatory Focus on Interest Rate Risk: What to Expect and How to Comply
 The Regulatory Focus on Interest Rate Risk: What to Expect and How to Comply Conference Call will begin at 10:00am CT, lines open at 10:50am CT Audio: 855-749-4750 Access Code: 920 722 897 # You can also
Leading Practices. Non-Maturity Deposit Modeling: June 26, :45 AM 12:45 PM. Presented by:
 Non-Maturity Deposit Modeling: Leading Practices June 26, 2017 11:45 AM 12:45 PM Presented by: Thomas E Bowers, CFA Managing Director ZM Financial Systems, Inc. 1020 Southhill Drive, Ste. 200 Cary, North
Balance Sheet Strategies For Changing Rate Environments
 Balance Sheet Strategies For Changing Rate Environments Moss Adams 2017 Credit Union Conference Portland, OR June 22 nd, 2017 Ryan W. Hayhurst Managing Director ryan@gobaker.com 800 962 9468 Credit Union
Lecture Materials ASSET/LIABILITY MANAGEMENT YEAR 2
 Lecture Materials ASSET/LIABILITY MANAGEMENT YEAR 2 Raleigh A. Andy Trovillion Executive Vice President UMB Bank St. Louis, Missouri raleigh.trovillion@umb.com 800-433-5962 August 1, 2017 INTEREST RATE
ALM Strategy in the Current Rate Environment. Current Landscape Interest Rates CU Balance Sheet & Financial Performance Trends
 ALM Strategy in the Current Rate Environment Lisa Boylen Senior ALM Analyst December 12, 2018 1 Objectives Current Landscape Interest Rates CU Balance Sheet & Financial Performance Trends Lessons Learned
Core Deposit Analytics Session 2: Beyond Basics - Applying Results
 Core Deposit Analytics Session 2: Beyond Basics - Applying Results David Koch President/CEO dkoch@farin.com 800-236-3724 ext. 4217 1 Impact of Right Assumptions on ALCO Decision Making CORE DEPOSIT ASSUMPTIONS
Rates Up: Fast & Furious
 Chicago September 24, 2015 Rates Up: Fast & Furious Brian Leibfried, CFA Vice President Tony DePalo, CFA Director 2015 Performance Trust. All Rights Reserved. Rates Up: Fast & Furious 2 Should we be concerned
PNC Bank, NA. Board Report. June 30, Pittsburgh, PA. A/L BENCHMARKS Standards for Asset/Liability Management
 A/L BENCHMARKS Standards for Asset/Liability Management Board Report PNC Bank, NA June 30, 2006 Olson Research Associates, Inc. 10290 Old Columbia Road, Columbia, MD 21046 Phone: 888-657-6680 Web: http://www.olsonresearch.com
Danger Ahead! Margins Decline while Interest Rate Risk is on the Rise!
 Danger Ahead! Margins Decline while Interest Rate Risk is on the Rise! by: Frank L. Farone, Managing Director As the old saying goes, The best time to plant a tree was long ago, and the second best time
ALCO: The Fundamentals
 ALCO: The Fundamentals Presented by: David Koch Chief Operating Officer dkoch@farin.com 800-236-3724 ext. 4217 1 What Is Asset/Liability Management? Asset/Liability Management (ALM) is the process of planning,
Georgia Banking School
 GEORGIA BANKERS ASSOCIATION Georgia Banking School Asset/Liability Management I 2016 Georgia Banking School May 5, 2016 Rachel Woods, CFA Associate, ALM SunTrust Robinson Humphrey Important Disclosure
BEST PRACTICES IN ASSET/LIABILITY MANAGEMENT. AMIfs Institute July 18, 2016 Monday Afternoon Session
 BEST PRACTICES IN ASSET/LIABILITY MANAGEMENT AMIfs Institute July 18, 2016 Monday Afternoon Session 1 Agenda - Introduction to ALM Monday, July 18 Afternoon Best Practices in ALM Structuring the ALCO Process
Interest Rate Risk Measurement
 Interest Rate Risk Measurement August 10, 2018 Ricky Brillard, CPA Senior Vice President Strategic Solutions Group 901-762-6415 rbrillard@viningsparks.com 1 Outline Trends Impacting Bank Balance Sheets
Investment Strategies for 1 st Quarter 2015
 Investment Strategies for 1 st Quarter 2015 Conference Call will begin at 11:00am CT, lines open at 10:50am CT Audio: 855-749-4750 Access Code: 929 460 526 You can also listen to the conference call audio
Core Deposit Analytics Session 1
 Core Deposit Analytics Session 1 Thomas A. Farin tfarin@farin.com David Koch dkoch@farin.com 1 Agenda Session 1 - Deposit Analytics Contractual vs. Actual Behavior Pricing Betas Decay Rates Surge Balances
ALCO: The Fundamentals
 ALCO: The Fundamentals Presented by: Urum Urumoglu Senior Consultant Urum@farin.com 800-236-3724 ext. 4210 1 What Is Asset/Liability Management? Asset/Liability Management (ALM) is the process of planning,
Fifth Third Bancorp 3Q18 Earnings Presentation
 Fifth Third Bancorp 3Q8 Earnings Presentation October 23, 208 Refer to earnings release dated October 23, 208 for further information. FORWARD-LOOKING STATEMENTS This communication contains forward-looking
Measuring Your IRR Profile Against Peers & Regulatory Targets. February 26, 2015 Webinar
 Measuring Your IRR Profile Against Peers & Regulatory Targets February 26, 2015 Webinar. PRESENTERS Tom Hauck joined Austin Associates in 1991. He works with financial institutions around the country in
Asset/Liability Management (ALM) NCUA s Revised Interest Rate Risk Supervision (Letter to Credit Unions 16-CU-08)
 NCUA s Revised Interest Rate Risk Supervision (Letter to Credit Unions 16-CU-08)") Asset/Liability Management (ALM) NCUA s Revised Interest Rate Risk Supervision (Letter to Credit Unions 16-CU-08) Dan Frilot Senior Vice President Balance Sheet Solutions, LLC Background Balance Sheet
Asset/Liability Management (ALM) NCUA s Revised Interest Rate Risk Supervision (Letter to Credit Unions 16-CU-08) Dan Frilot Senior Vice President Balance Sheet Solutions, LLC Background Balance Sheet
INTEREST RATE RISK MAKING YOUR MODEL UNDERSTANDABLE AND RELEVANT
 INTEREST RATE RISK MAKING YOUR MODEL UNDERSTANDABLE AND RELEVANT Scott J. Hopf, CPA Senior Manager BKD, LLP 375 North Shore Drive, Suite 501 Pittsburgh, PA 15212 shopf@bkd.com 412.364.9395 AGENDA The Basics
Objectives. NCUA Interest Rate Risk Supervision
 NCUA Interest Rate Supervision Lisa Boylen Senior ALM Analyst March 21, 2017 Objectives Understand NCUA s Revised Exam Procedures For Interest Rate Understand Exam Scope and Ratings Help You Prepare For
Jerry Boebel, CFA Business Consultant ProfitStars Omaha Office
 Liquidity Analysis and Reporting Jerry Boebel, CFA Business Consultant ProfitStars Omaha Office jboebel@profitstars.com Objectives Current trends Recent regulatory releases Consider a new approach Better
Federal Home Loan Bank of Des Moines. A Case for Diversifying the Right-Hand Side of the Balance Sheet
 Federal Home Loan Bank of Des Moines A Case for Diversifying the Right-Hand Side of the Balance Sheet 1 Agenda 1. YIELD CURVE FUNDING STRATEGIES 2. BUILDING A CASE FOR FUNDING DIVERSIFICATION 3. BLENDED
Fifth Third Bancorp 1Q18 Earnings Presentation
 Fifth Third Bancorp Q8 Earnings Presentation April 24, 208 Refer to earnings release dated April 24, 208 for further information. Fifth Third Bancorp All Rights Reserved Cautionary statement This presentation
Deposit Pricing in Rising Rates Session 2
 Deposit Pricing in Rising Rates Session 2 Thomas Farin Chairman of the Board tfarin@farin.com 1 Three Part Series Session 1 The Deposit Toolkit Are we already in a rising rate environment? Effective Process
Developing Deposit Strategies for Rising Rates Session 1. Agenda
 Developing Deposit Strategies for Rising Rates Session 1 Thomas A. Farin President tfarin@farin.com 1 Agenda Session 1 - Deposit Analytics Are We In a Rising Rate Environment? Establishing Cash Flows Contractual
Southeast Bankers Outreach Forum
 Southeast Bankers Outreach Forum IRR in a Protracted Low Rate Environment Date: September 30, 2014 Presented by: Trent Cowsert Director of Capital Markets The opinions expressed are those of the presenter
ASSET/LIABILITY MANAGEMENT - YEAR 2
 ASSET/LIABILITY MANAGEMENT - YEAR 2 Tying It All Together: Implementation of a Risk/Return Framework David W. Koch President & CEO FARIN Financial Risk Management Fitchburg, WI dkoch@farin.com 608-661-4217
ALM Strategies In the Current Economic Environment Presented by: Frank Santucci Managing Director ALM Services (October 2015)
") 1 ALM Strategies In the Current Economic Environment Presented by: Frank Santucci Managing Director ALM Services (October 2015) 1 Asset Liability Management is the process of Measuring, Monitoring and
1 ALM Strategies In the Current Economic Environment Presented by: Frank Santucci Managing Director ALM Services (October 2015) 1 Asset Liability Management is the process of Measuring, Monitoring and
Deposit Pricing in Rising Rates Session 1. Three Part Series
 Deposit Pricing in Rising Rates Session 1 Thomas Farin Chairman of the Board tfarin@farin.com 1 Three Part Series Session 1 The Deposit Toolkit Are we already in a rising rate environment? Effective Process
Farin & Associates, Inc. Farin Foresight Software Certification as of November 30, 2017
 Farin & Associates, Inc. Farin Foresight Software Certification as of November 30, 2017 by Alpha-Numeric Consulting, LLC December 20, 2017 Introduction Financial institutions recognize the need for accurate
Interagency Advisory on Interest Rate Risk Management
 Interagency Management As part of our continued efforts to help our clients navigate through these volatile times, we recently sent out the attached checklist that briefly describes how c. myers helps
Asset and Net Worth Growth Loan Allocation Trends 2
 Growth, Capital, and Concentration Risk Management Jonathan Jackson, CFA Advisor Catalyst Strategic Solutions Asset and Net Worth Growth 1 Asset and Net Worth Growth Loan Allocation Trends 2 Loan Allocations
FINANCIAL STATEMENT ANALYSIS & RATIO ANALYSIS
 FINANCIAL STATEMENT ANALYSIS & RATIO ANALYSIS June 13, 2013 Presented By Mike Ensweiler Director of Business Development Agenda General duties of directors What questions should directors be able to answer
FRESH Ideas to Reinvent and Reimagine the Future of Credit Unions
 Understanding Interest Rate Movements Bridget C. Balesky, VP Brick & Associates, Inc. www.brickinc.com bridget@brickinc.com (00) -1 Friday, June, 01 1:0 :00 p.m. FRESH Ideas to Reinvent and Reimagine the
Core Deposit Analytics Session 1: Determining Core The Basics
 Core Deposit Analytics Session 1: Determining Core The Basics Thomas A. Farin Chairman of the Board tfarin@farin.com 1 Building Blocks for Deposit Analysis Pricing Betas Decay Rates Surge Balance Identification
Revised Interest Rate Risk Supervision Effective January 1, 2017
 Revised Interest Rate Risk Supervision Effective January 1, 2017 Key Changes to NCUA s interest rate risk supervision: 1. Development of Interest Rate Risk Review Procedures Workbook 2. Updated IRR tolerance
Balance Sheet Strategies For Changing Rate Environments Asset/Liability Management Seminar
 Balance Sheet Strategies For Changing Rate Environments Asset/Liability Management Seminar Pasadena & Concord, CA April 25-26, 2017 Ryan W. Hayhurst - Managing Director ryan@gobaker.com 800-962-9468 Market
Asset Liability Management for CU Boards The Basics of ALM Presented by: Frank Santucci - Managing Director ALM Services
 Asset Liability Management for CU Boards The Basics of ALM Presented by: Frank Santucci - Managing Director ALM Services www.firstempire.com Frank Santucci - Managing Director ALM Services First Empire
Goldman Sachs U.S. Financial Services Conference
 Goldman Sachs U.S. Financial Services Conference Greg D. Carmichael Chairman, President & Chief Executive Officer December 4, 208 FORWARD-LOOKING STATEMENTS This communication contains forward-looking
Balance Sheet Strategies for 2018: A Roadmap to Outperform Your Peers Jim Reber, President August 13, 2018
 51 st ANNUAL CONVENTION Balance Sheet Strategies for 2018: A Roadmap to Outperform Your Peers Jim Reber, President August 13, 2018 Yield Curve August 6 2 What is Normal? 25yr Avg 25yr Average 10yr Average
Introduction to Asset/Liability Management
 Introduction to Asset/Liability Management WBA BOLT Summer Leadership Summit June 14, 2018 Presented by: Marc Gall, Vice President mgall@bokf.com 1 Agenda Asset/Liability Management and ALCO Meetings Defining
Asset/Liability Management Series Session 1 Presenter: Sasha Khandoker ALM Analyst
 Asset/Liability Management Series Session 1 Presenter: Sasha Khandoker ALM Analyst 1 2 1 What is ALM? Why are we asked to perform ALM? What is the goal of ALM? How can we use it? 3 Creating and managing
The challenge of preserving net interest margins with a flattening yield curve
 Striking a balance: The challenge of preserving net interest margins with a flattening yield curve With four Federal Open Market Committee (FOMC) rate increases totaling 100 basis points (1.00%) implemented
Developing a Funding Strategy for Rising Rates. Agenda
 Developing a Funding Strategy for Rising Rates Thomas Farin Chairman tfarin@farin.com 1 Agenda Session 1: Lay out a best practices funding and pricing process? Identify internal issues impacting risk profile
Lecture Materials ASSET/LIABILITY MANAGEMENT YEAR 2
 Lecture Materials ASSET/LIABILITY MANAGEMENT YEAR 2 David Koch President & CEO FARIN Financial Risk Management Madison, Wisconsin dkoch@farin.com 608-661-4217 August 3, 2017 TYING IT ALL TOGETHER: IMPLEMENTATION
Lecture Materials FUNDING
 Lecture Materials FUNDING Thomas A. Farin Chairman of the Board FARIN Financial Risk Management Fitchburg, Wisconsin tfarin@farin.com 608-661-4219 & Darryl Mataya SVP & Chief Development Officer FARIN
Lecture Materials FUNDING. Thomas A. Farin Chairman of the Board FARIN Financial Risk Management Fitchburg, Wisconsin
 Lecture Materials FUNDING Thomas A. Farin Chairman of the Board FARIN Financial Risk Management Fitchburg, Wisconsin tfarin@farin.com 608-661-4219 August 7 & 8, 2017 Funding - Developing Funding Strategies
ASSET/LIABILITY MANAGEMENT - YEAR 2
 ASSET/LIABILITY MANAGEMENT - YEAR 2 ALM Process, Positioning & Profitability Darren Herrmann Executive Vice President & Treasurer UMB Financial Corporation & UMB Bank Corporate Treasury Kansas City, MO
Understanding Interest Rate Risk is Not a Static Issue By c. myers corporation
 c.notes www.cmyers.com Understanding Interest Rate Risk is Not a Static Issue By c. myers corporation It is clear that effective interest rate risk management (IRR) is at the top of NCUA s priority list.
Strategic And Tactical ALM In A Commercial Bank. Suresh Sankaran
 Strategic And Tactical ALM In A Commercial Bank Suresh Sankaran Back To Basics Risks And Economics In a strict sense, there wasn t any risk if the world had behaved as it did in the past - Merton miller,
NOVEMBER 16, As Required by the Dodd-Frank Wall Street Reform and Consumer Protection Act
 Federal Home Loan Bank of New York 2017 Annual Stress Test Disclosure Results of the Federal Housing Finance Agency Supervisory Severely Adverse Scenario NOVEMBER 16, 2017 As Required by the Dodd-Frank
Investment Strategies For 1 st Quarter 2016
 Investment Strategies For 1 st Quarter 2016 Conference Call will begin at 11:00am CT, lines open at 10:50am CT Audio: 855 749 4750 Access Code: 928 643 950# You can also listen to the conference call audio
Second Quarter 2018 Earnings Conference Call July 19, 2018
 Second Quarter 2018 Earnings Conference Call July 19, 2018 WBS 2Q18 Earnings Highlights ($ in millions, except EPS data) Significant progress on our key strategic initiatives: 35 consecutive quarters of
Weathering the Storm: Rates, Recession, and Risk
 Weathering the Storm: Rates, Recession, and Risk Presenters: Charles McQueen Ed Lis Greg Gibson President VP of Finance & Compliance Chief Financial Officer McQueen Financial Adv. First Choice Financial
Balance Sheet Strategies in Today's Economic Environment May 2018
 Balance Sheet Strategies in Today's Economic Environment May 2018 Scott Hildenbrand Principal/Chief Balance Sheet Strategist (212) 466-7865 shildenbrand@sandleroneill.com Current Balance Sheet Management
Doing More with Your Balance Sheet
 Doing More with Your Balance Sheet John P. Biestman, CFA - VP/Senior Relationship Manager Brett L.A. Manning, CFA - VP/Director, Member Strategies October 27, 2015 Who is FHLB Des Moines? Current Balance
MAKING LIQUIDITY YOUR NEW BEST FRIEND
 FHLB INDIANAPOLIS MAKING LIQUIDITY YOUR NEW BEST FRIEND David Koch President\CEO FARIN & Associates, Inc. dkoch@farin.com 608-661-4217 1 Friends vs. Best Friends 2 3 Types of Friendship 1. Friendship of
U. S. Economic Projections. GDP Core PCE Price Index Unemployment Rate (YE)
") The Federal Reserve will likely hold short-term interest rates steady until late 2015. U. S. Economic Projections 2014 2015 2014 2015 2014 2015 Stifel FI Strategy Group Forecast 2.5% 3.1% 1.4% 1.7% 6.4%
The Federal Reserve will likely hold short-term interest rates steady until late 2015. U. S. Economic Projections 2014 2015 2014 2015 2014 2015 Stifel FI Strategy Group Forecast 2.5% 3.1% 1.4% 1.7% 6.4%
Developing Deposit Strategies for Rising Rates Session 2. Agenda
 Developing Deposit Strategies for Rising Rates Session 2 Thomas A. Farin President tfarin@farin.com 1 Agenda Session 1 - Deposit Analytics Are We In a Rising Rate Environment? Establishing Cash Flows Contractual
TODAY S LOANS ARE TOMORROWS ASSETS OVERVIEW. Financial Management Seminar October 6, Credit union asset and loan trends
 Steven Houle, CFA Director, Advisory Service TODAY S LOANS ARE TOMORROWS ASSETS Catalyst Strategic Solutions Financial Management Seminar Creating Tomorrow OVERVIEW Credit union asset and loan trends Yield
U.S. Interest Rates Chartbook January 2018
 U.S. Interest Rates Chartbook January 2018 Takeaways In line with expectations, the FOMC left Fed funds rate unchanged. The changes to the January statement highlighted stronger growth and confidence that
Market and Liquidity Risk Assessment Overview. Federal Reserve System
 Market and Liquidity Risk Assessment Overview Federal Reserve System Overview Inherent Risk Risk Management Composite Risk Trend 2 Market and Liquidity Risk: Inherent Risk Definition Identification Quantification
Asset/Liability Management Series Session 1 Presenter: Sasha Khandoker ALM Analyst
 Asset/Liability Management Series Session 1 Presenter: Sasha Khandoker ALM Analyst 1 2 1 What is ALM? Why are we asked to perform ALM? What is the goal of ALM? How can we use it? 3 *The process of evaluating
Liquidity Basics Measuring and Managing Liquidity. Course Agenda
 Liquidity Basics Measuring and Managing Liquidity David Koch Chief Operating Officer dkoch@farin.com 800-236-3724 x4217 1 Course Agenda Understanding Nature of Liquidity Definition of Liquidity Traditional
Liquidity Basics Measuring and Managing Liquidity
 Liquidity Basics Measuring and Managing Liquidity Urum Urumoglu Senior Consultant Urum@farin.com 800-236-3724 x4210 1 Course Agenda Understanding Nature of Liquidity Definition of Liquidity Traditional
Lecture Materials LOAN PORTFOLIO MANAGEMENT YEAR 1
 Lecture Materials LOAN PORTFOLIO MANAGEMENT YEAR 1 Thomas A. Farin Chairman of the Board FARIN Financial Risk Management Fitchburg, Wisconsin tfarin@farin.com 608-661-4219 August 10, 2016 GSB Credit Track
U.S. Interest Rates Chartbook September 2017
 U.S. Interest Rates Chartbook September 2017 Takeaways The FOMC announced the start of the balance sheet normalization process to begin in October while maintained the Fed funds rate target range at 1%-1.25%
Deposit Pricing in Rising Rates Session 1. Three Part Series
 Deposit Pricing in Rising Rates Session 1 Thomas Farin Chairman of the Board tfarin@farin.com 1 Three Part Series Session 1 The Deposit Toolkit Effective Process Deposit Analysis Tools Betas Decay Rates
Back Testing ALM Models April 17, Back Testing ALM Models: Concepts, Practice, and Compliant Business Solutions
 Back Testing ALM Models: Concepts, Practice, and Compliant Business Solutions Presented by: William J. McGuire Chairman Emeritus McGuire Performance Solutions, Inc. 16435 N. Scottsdale Rd, Ste 290 Scottsdale,
2016 Annual Stress Test Disclosure FHLB Des Moines
 2016 Annual Stress Test Disclosure FHLB Des Moines Results of the Federal Housing Finance Agency Supervisory Severely Adverse Scenario As Required by the Dodd-Frank Wall Street Reform and Consumer Protection
Third Quarter 2018 Earnings Conference Call October 18, 2018
 Third Quarter 2018 Earnings Conference Call October 18, 2018 WBS 3Q18 Earnings Highlights ($ in millions, except EPS data) Continued progress on our key strategic initiatives: 36 consecutive quarters of
Louisiana Bankers Association CFO Conference. M ay 21, 2 015
 Louisiana Bankers Association CFO Conference M ay 21, 2 015 Agenda Economic Value of Equity challenges Earnings at Risk issues Vendor contracts Bond portfolio monitoring Tax allocation agreements FHLB
INVESTOR PRESENTATION
 INVESTOR PRESENTATION JUNE 2017 DISCLAIMER Forward-Looking Statements This presentation contains forward-looking statements within the meaning of the Private Securities Litigation Reform Act of 1995. These
Lecture Materials Topic 3 Yield Curves and Interest Forecasts ECONOMICS, MONEY MARKETS AND BANKING
 Lecture Materials Topic 3 Yield Curves and Interest Forecasts ECONOMICS, MONEY MARKETS AND BANKING Todd Patrick Senior Vice President - Capital Markets CenterState Bank Atlanta, Georgia tpatrick@centerstatebank.com
DCG Bulletin. Is Your Balance Sheet Ready for a Flatter Yield Curve? April From the Editor Keith Reagan
 Is Your Balance Sheet Ready for a Flatter Yield Curve? Written by Vincent A. Clevenger, Managing Director Certain things, they should stay the way they are. J.D. Salinger, The Catcher in the Rye Fortunately
Deposit Growth Strategies and Balance Sheet Management
 Deposit Growth Strategies and Balance Sheet Management Presented by: Frank Santucci Managing Director ALM Services www.firstempire.com Frank Santucci - Managing Director ALM Services First Empire Securities,
Liquidity Risk Basics Measuring and Managing Liquidity. Dad, What is Liquidity & Where Does it Come From?
 Liquidity Risk Basics Measuring and Managing Liquidity David Koch Chief Operating Officer FARIN & Associates, Inc. dkoch@farin.com 608-661-4217 1 Dad, What is Liquidity & Where Does it Come From? 2 1 Our
ALM and Interest Rate Risk
 ALM and Interest Rate Risk By Tim Harrington, CPA TIM Touch Inspire Motivate About Tim Harrington, CPA 28 years credit union experience 36 years business/consulting experience Consulted on nearly 1,000
BASICS OF LIQUIDITY WHAT IS IT? WHAT RISKS DOES IT CONTRIBUTE TO YOUR CAPITAL PLAN & FUNDING NEEDS? David Koch. President\CEO FARIN & Associates, Inc.
 BASICS OF LIQUIDITY WHAT IS IT? WHAT RISKS DOES IT CONTRIBUTE TO YOUR CAPITAL PLAN & FUNDING NEEDS? David Koch President\CEO FARIN & Associates, Inc. dkoch@farin.com Agenda Describe a functional definition
Liquidity Basics Measuring and Managing Liquidity. Course Agenda
 Liquidity Basics Measuring and Managing Liquidity Urum Urumoglu Senior Consultant Urum@farin.com 800-236-3724 x4210 1 Course Agenda Understanding Nature of Liquidity Definition of Liquidity Traditional
Georgia Banking School
 GEORGIA BANKERS ASSOCIATION Georgia Banking School Asset/Liability Management II 2017 Georgia Banking School May 10, 2017 Joel Updegraff Managing Director, ALM SunTrust Robinson Humphrey Important Disclosure
2
 1 2 3 4 5 6 7 8 The Changing Deposit / Funding Landscape 2018 Promontory Interfinancial Network, LLC The Market Is Changing Funding pressures knocking at community bank doors S&P Global Market Intelligence,
U.S. Interest Rates Chartbook March 2018
 U.S. Interest Rates Chartbook March 2018 Takeaways At the March meeting, the FOMC voted unanimously to raise the Fed funds rate to 1.5%-1.75%. The newly appointed Chairman is committed to maintaining continuity
Commercial Banking Performance 3rd Quarter 2017
 Commercial Banking Performance 3rd Quarter 2017 Commercial Banking performance has become more varied, raising the question are you different? TRENDS Performance Becoming More Varied Across Banks: Since
Third Quarter 2018 Earnings Presentation. October 31, 2018
 Third Quarter 2018 Earnings Presentation October 31, 2018 Safe Harbor Statement NOTE: This presentation contains certain statements that are not historical facts and that constitute forward-looking statements
Bank of America Fourth Quarter 2006 Results
 Bank of America Fourth Quarter 2006 Results Ken Lewis Chairman, CEO and President Joe Price Chief Financial Officer January 23, 2007 Forward Looking Statements This presentation contains forward-looking