BASICS OF LIQUIDITY WHAT IS IT? WHAT RISKS DOES IT CONTRIBUTE TO YOUR CAPITAL PLAN & FUNDING NEEDS? David Koch. President\CEO FARIN & Associates, Inc.
|
|
|
- Madeleine Jefferson
- 5 years ago
- Views:
Transcription


1 BASICS OF LIQUIDITY WHAT IS IT? WHAT RISKS DOES IT CONTRIBUTE TO YOUR CAPITAL PLAN & FUNDING NEEDS? David Koch President\CEO FARIN & Associates, Inc. Agenda Describe a functional definition of liquidity Discuss the difference between asset based & total liquidity Identify causes of liquidity risk in their institutions Review common regulatory measurements for liquidity Assess institutional risk using Define stress tests based on 1


2 Liquidity Defined FDIC/OCC/Federal Reserve Liquidity Definition: Liquidity Defined Common Liquidity Definition: Liquidity Risk is: ALM Process measures risks taken versus returns derived. 2


3 Liquidity Sources Pools or Reservoirs Flows Contingent Sources Differentiating Liquidity & Funding Liquidity Management Pools first then flows Funding Management Flows first, then pools 3

4 Liquidity Risk It s About to Get Real! Loans\Earning Assets by Asset Size 4
5 Liquidity Risk It s About to Get Real! 5

6 Liquidity Risk It s About to Get Real! Liquidity Risk It s About to Get Real! 6
7 Basic Liquidity Trap General rule: Regulatory pressure Impact Recent Regulatory Initiatives interagency policy statement funding and liquidity risk management Liquidity requirements More asset based liquidity (cash & securities) Less reliance on wholesale funding for core growth 7
8 Impact of 2010 Liquidity Guidance Liquidity requirements Cash flow based liquidity measurement Stress tests A view from the other side HOW DO REGULATOR S VIEW LIQUIDITY 8
9 Historical Measures of Liquidity Measurements based on balance sheet levels Examples: Historical Ratio Analysis CAMELS or CANARY ratings review past performance But, no weighting for institutional risk appetite and strategy A very basic litmus test 9


10 Regulatory Risk Assessments OCC Canary Ratios Canary Ratios 10


11 Canary Ratios Low Risk < 8 Liquidity Trigger Ratios - Canary Using the OCC Canary Ratios as a Guide helps pinpoint potential concern or deeper review The following ratios and trigger limits are regulatory guidelines Use historical trends to show past liquidity management process 11
12 UBPR/FPR Liquidity Ratios Bank UBPR ratios Net non-core funding ratio Loans/assets Projection of net cash flows Credit union FPR ratios Net long-term assets/total assets Total loans / total shares Cash & ST investments / total assets Total shares, deposits & borrowings / earning assets Regular shares & share drafts / total shares & borrowings Borrowings / total shares & net worth Regulatory Ratio Definitions Net non-core funding ratio: measures the extent to which the bank if funding longer term assets (> 1 yr.) With volatile funds. Loan/assets: measures the extent to which the bank is likely to have liquidity 12
13 Regulatory Ratio Definitions Long term assets / Total Assets: Measures the level of long term assets that are less liquid Loan/Share Measures extent to which the CU is relying on capital or borrowings to make loans which are less liquid Cash & ST Investments /Total Assets: Measures available short-term liquidity levels Regulatory Ratio Definitions Total Shares, Deposits & Borrowings / Earning Assets: This really measures the efficiency of use of funding to generate earnings Regular Shares & Share Drafts / Total Shares & Borrowings: Measures the level of core type funding that is considered less volatile 13
14 Regulatory Ratio Definitions Borrowings / Total Shares & Net Worth: Measures the reliance on non-member funding. Liquidity Examination Checklist Exam Considerations: So, we now have the scope of the examination process, what do we need to do to get an A? 14
15 Liquidity Definitions Asset Based or Core Liquidity: Cash and other financial assets that can be easily converted to cash for operational needs Total (Cash Flow Based) Liquidity : Does your projection maintain sufficient sources to meet financial obligations: withdrawals, loan demands and other commitments. A Practical Approach to Liquidity MEASURING ASSET BASED LIQUIDITY 15
16 Asset Based Liquidity Considered most reliable source of liquidity But, how much is enough? Requires: Calculating Asset Based Liquidity Sources of asset based liquidity Uses that you have to cover 16
17 Asset Based Measurement Options Regulatory Initiatives Liquidity Coverage Ratio (LCR) Institution Options Basic surplus ratio Net Stable Funding Ratio (NSFR) Basic Liquidity Ratio (BLR A FARIN ratio concept) Asset Based Liquidity: LCR Ratio Basel liquidity coverage ratio (LCR) 17
18 Deposit Definitions Stable/Less Stable Basel says stable is Less stable Bank regulators (likely) NCUA Liquidity Coverage Ratio Numerator (Basel Approach) High Quality Liquid Assets Cash Amount Available % Available $ Cash & Due Froms 2,168, % 1,301,311 Total Cash 2,168,852 1,301,311 Market Net Of Market Value Market Value < 1 Yr > 1 Yr Hair Cut Hair Cut Investments Value Pledged < 1 Yr > 1 Yr Net Of PledgedNet Of Pledged < 1 Yr % > 1 Yr % Available $ Other CDs 4,163,361 4,163,361 80,468 4,082,894 80,468 4,082, % % 0 FHLB Daily Time Savings % 0.00% 500 FHLB Demand 613, , , , % 0.00% 613,684 FHLB ACH Account % 0.00% 353 Midwest Independent Bank 5,169,870 5,169,870 5,169, ,169, % 0.00% 5,169,870 Great Southern Bank 331, , , , % 0.00% 331,747 MBS - 30 Yr Fixed 10,701,244 10,701, ,421 9,925, ,421 9,925, % 15.00% 9,096,058 MBS - 30 Yr Adj % 15.00% 0 CMOs - AFS 33,182,771 33,182,771 5,470,720 27,712,051 5,470,720 27,712, % 15.00% 28,205,356 Callable Agency - 10 Yr Fixed 5,275, ,135 5,150, % 15.00% 0 Agency - 5 Yr Fixed 2,000,911 2,000,911 42,473 1,958,438 42,473 1,958, % 15.00% 1,700,775 Municipal - AFS 563, ,397 15, ,087 15, , % 20.00% 450,718 FHLB Stock 716, , , , % % 0 Investment in Subsidiary 676, , , , % % 0 Total Investments 63,395,199 58,120,039 12,625,681 50,769,518 45,569,059 Total High Quality Liquid Assets 46,870,371 18
19 LCR Concept - Numerator Level 1 assets (0% haircut) Level 2 Assets (15% haircut) Non-Qualifying Liquidity Coverage Ratio Stable Funding Outflows Denominator Uses RunOff Stable Deposits Amount Net Amount Rate Used Use Corporate Checking 2,519,884 2,519, % 125,994 Business Checking 5,809,313 5,809, % 290,466 new bus % 0 Traditional Checking 6,363,569 6,363, % 318,178 Official Checks 611, , % 30,575 Business Plus Checking 2,525,413 2,525, % 126, Checking 24,665,269 24,665, % 1,233,263 VIP Checking % 0 1st Rate Checking 14,159,464 14,159, % 707,973 Money Market Checking - >$50K 7,107,308 7,107, % 355,365 Money Market Checking - $25-50K 1,608,882 1,608, % 80,444 Money Market Checking - <$25K 1,615,865 1,615, % 80,793 MM Savings - <$10K 363, , % 18,178 MM Savings - $10-25K 1,957,904 1,957, % 97,895 MM Savings - $25-50K 2,868,229 2,868, % 143,411 MM Savings - $50-100K 5,807,026 5,807, % 290,351 MM Savings - >$100k 20,919,607 20,919, % 1,045,980 1st Rate Savings 13,689,189 13,689, % 684,459 Total Stable Deposits 112,591, ,591,981 5,629,599 19
20 Liquidity Coverage Ratio Less Stable Outflows Denominator RunOff Less Stable Deposits Amount Net Amount Rate Used Use CD Day 268, , % 26,890 CD - 6 Mo 5,119,489 5,119, % 511,949 CD - 18 Mo 691, , % 69,193 CD - 1 Yr 12,102,304 12,102, % 1,210,230 CD - 2 Yr 10,929,535 10,929, % 1,092,953 CD - 3 Yr 4,723,614 4,723, % 472,361 CD - 4 Yr 3,951,069 3,951, % 395,107 CD - 5 Yr 6,469,779 6,469, % 646,978 IRA CD - 6 Mo 981, , % 98,191 IRA CD - 1 Yr 1,971,991 1,971, % 197,199 IRA CD - 18 Mo 209, , % 20,913 IRA CD - 2 Yr 2,055,010 2,055, % 205,501 IRA CD - 3 Yr 1,037,099 1,037, % 103,710 IRA CD - 4 Yr 5,642,349 5,642, % 564,235 IRA CD - 5 Yr 4,105,473 4,105, % 410,547 Total Less Stable Deposits 60,259,586 60,259,586 6,025,959 Liquidity Coverage Ratio Wholesale Funding Outflows Denominator Net Maturing RunOff Non Financial Wholesale Amount Amount Rate Used Use Total Non Financial Wholesale Fun Net Maturing RunOff Wholesale Fed Funds Purchased Amount Amount Rate Used Use Fed Funds Purchased % 0 Total Wholesale Fed Funds Purchased Net Maturing RunOff Wholesale With Relationships Amount Amount Rate Used Use Fixed Rate Advances 10,000, % 0 Overnight Advance 2,000,000 2,000, % 500,000 2 Yr. Advance - Fixed % 0 3 Yr Advance - Fixed % 0 10 Yr Amortizing Advance % 0 Total Wholesale With Relationships 12,000,000 2,000, ,000 Net Maturing RunOff Wholesale Funding w\out Relationships Amount Amount Rate Used Use Total Wholesale w\out Relationshi
21 Liquidity Coverage Ratio Off balance sheet commitments Conversion Unused Lines of Credit Amount Rate Used Use Unused Lines Of Credit 7,100, % 710,000 Total Unused Lines of Credit 7,100, ,000 Conversion Letters Of Credit Amount Rate Used Use Letters of Credit % 0 Total Letters Of Credit 0 0 Conversion Firm Commitments To Originate Amount Rate Used Use Firm Commitments to Originate 3,300, % 3,300,000 Total Firm Commitments To Origin 3,300,000 3,300,000 Conversion Other Unused Commitments Amount Rate Used Use Other Unused Commitments % 0 Total Other Unused Commitments 0 0 Total Uses 195,251, ,851,567 16,165,558 Liquidity Coverage Ratio Incoming loan cash flows Proj. RunOff Loans Contractual Projected Rate Used Source 1-4 Fam - Fixed 606,981 69, % 550, Fam - Variable 314, , % 520,697 HELOC 47,197 12, % 46,321 Land Loan - Fixed 193,202 4, % 166,325 OTHER LOANS HIDDEN FOR VIEW Mobile Home - Variable % 738 Unsecured 7, % 6,108 Overdraft Loans 19, % 16,989 Auto - Fixed 31,999 4, % 29,473 Auto Special - 5yr Fixed % 0 Total Loans 5,113,300 1,168,255 4,930,432 Total Sources 4,930,432 21
22 Liquidity Coverage Ratio Summary High Quality Liquid Assets 46,870,371 Uses 16,165,558 Sources 4,930,432 Excess Sources Subject to 75% Ca 0 Net Sources 4,930,432 Net Uses 11,235,125 Liquidity Coverage Ratio % Target Liquidity Coverage Ratio % HQLA / Uses % LCR Ratio: % HQLA\Assets: 23.05% Good coverage from both on balance sheet assets (investments) $46.8 million AND loan cash flows - $4.9 million HQLA / Total Assets 23.05% Total Assets 203,313,171 Basic Surplus or Basic Liquidity Ratio (BLR) FINDING BETTER SELECTIONS FOR MEASUREMENT AND MANAGEMENT 22
23 Basic Surplus vs. Basic Liquidity Ratio Basic Surplus Ratio: Long-time ratio measure of the cash a financial institution can cost-effectively raise within a thirtyday timeframe, without principal loss, adjusted for the estimated volatility of liabilities. Most community FI s largest source of liquidity at no principal loss is incoming cash flows from loan repayments! BLR extends the Basic Surplus framework to include this critical source for community FIs. Building the Basic Liquidity Ratio (BLR) Step 1: What is our stock of available liquid assets? Traditional sources PLUS: 30 day projected loan cash flows Step 2: What are our short-term volatile liabilities? $ 203,313, Short term investment (maturing in 30 days or less) + cash $ 2,168, % 1-2 Sum of market value of available securities $ 45,569, % 1-3 Other Liquid assets (MMDA, interest bearing deposits, etc) $ % 1-4 Projected 30 day cash flows from securities (not included in 1 or 2) $ % 1-5 $ 4,930, % 2-1 Wholesale funds maturing in 30 days or less (100% runoff) $ 2,000, % 2-2 Deposit runoff assumptions (30 days) $ 11,655, % 2-3 Brokered CD Maturities $ % 2-4 $ 3,300, % 2-5 $ 710, % 23
24 Building the Basic Liquidity Ratio (BLR) Step 3: Add contingent liability sources to the basic measure from step 2 Create a section for each source Limit source availability by: 3-1 Maximum FHLB Line of Credit $ 15,000, % 3-2a Qualifying collateral $ 75,000, % 3-2b Outstanding borowings $ 10,000, $ 65,000, % 3-5 $ 50,828,293 Building the Basic Liquidity Ratio (BLR) 4-1 Maximum Brokered Deposit Policy Limit $ 10,165, Current Balance Brokered Deposits $ % 5-1 Maximum Internet\Rate Board Deposit Policy Limit $ 10,165, Current Balance Internet & Rate Board Deposits $ % 6-1 Total Correspondent Lines $ % 6-2 Current Balance Correspondant Banks $ % 7-1 Maximum Internet\Rate Board Deposit Policy Limit $ 30,496, Current Balance Federral Reserve $ % 24


25 Basic Liquidity Ratio Summary Advantages Easy measure of real sources Provides a look at all sources and uses to date by type Provides a measure consistent with policy control limits Disadvantages Usually used on historical balance sheet Ignores primary source of most community FI liquidity Ignores Off Balance Sheet Risks A Practical Approach to Liquidity MEASURING CASH FLOW BASED LIQUIDITY 25
26 Liquidity Gap Report Pro forma cash flow analysis: Liquidity Gap Report Liquidity gap report 26


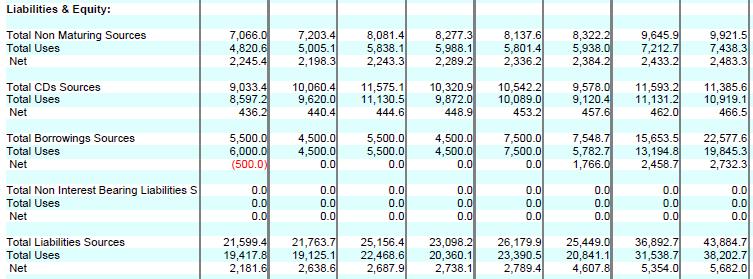
27 Asset Sources/Uses Liability Sources/Uses 27

28 Cash Flow Gap Sec 1 Sec 2 Sec 3 Total Liquidity Gap


29 Total Liquidity Gap Using Liquidity Gap Advantages Recommendation 29


30 Liquidity Liquidity Stress Testing Designing Liquidity Stress Tests 2 approaches to stress testing liquidity Each approach brings merit and value 30

 Avg Monthly (% of Assets) 1999 $ 179,798")

 $ 131,376 $ (4,475) $ (4,813) $ (401) -2.")
 $ (123) -0.")


31 Historical Liquidity Trends Steps for designing liquidity scenario tests Step 1: Review macro cash flow performance Step 2: Review major funding source trends Step 3: Pick worse case historical performance & build a scenario Step 4: Run catastrophic capital failure sensitivity test Historical Cash Flow Year Total Deposits Loans Net Liquidity Net Liquidity Ending Assets Ending Balance Net Change Ending Balance Net Change Excess (Needed) Avg Monthly (% of Assets) 1999 $ 179,798 $ 149,334 $ 121, $ 189,270 $ 143,405 $ (5,929) $ 131,361 $ 9,649 $ (15,578) $ (1,298) -8.23% 2001 $ 205,630 $ 162,377 $ 18,972 $ 138,617 $ 7,256 $ 11,716 $ % 2002 $ 211,635 $ 171,817 $ 9,440 $ 135,851 $ (2,766) $ 12,206 $ 1, % 2003 $ 205,503 $ 162,529 $ (9,288) $ 131,376 $ (4,475) $ (4,813) $ (401) -2.34% 2004 $ 210,898 $ 165,480 $ 2,951 $ 140,105 $ 8,729 $ (5,778) $ (482) -2.74% 2005 $ 213,904 $ 171,784 $ 6,304 $ 147,887 $ 7,782 $ (1,478) $ (123) -0.69% 2006 $ 221,442 $ 180,114 $ 8,330 $ 153,568 $ 5,681 $ 2,649 $ % 2007 $ 238,368 $ 189,043 $ 8,929 $ 157,404 $ 3,836 $ 5,093 $ % 2008 $ 249,720 $ 191,321 $ 2,278 $ 169,604 $ 12,200 $ (9,922) $ (827) -3.97% 2009 $ 406,046 $ 320,370 $ 129,049 $ 272,871 $ 103,267 $ 25,782 $ 2, % 2010 $ 426,625 $ 341,958 $ 21,588 $ 280,729 $ 7,858 $ 13,730 $ 1, % 2011 $ 430,723 $ 342,823 $ 865 $ 264,882 $ (15,847) $ 16,712 $ 1, % 2012 $ 457,434 $ 364,368 $ 21,545 $ 263,121 $ (1,761) $ 23,306 $ 1, % 2013 $ 456,597 $ 359,714 $ (4,654) $ 282,703 $ 19,582 $ (24,236) $ (2,020) -5.31% 2014 $ 456,330 $ 372,612 $ 12,898 $ 308,441 $ 25,738 $ (12,840) $ (1,070) -2.81% Avg $ 297,495 Total/Avg $ 236,816 Total/Avg $ 193,765 $ 36,549 $ 3, % 31
 $ 14,457 $ 5,976 $ 45,256 $ 162,377 $ 18,972 13.23% 2001 $ 162,377 $ (36,029) $ (2,040) $ 18,228 $ 29,281 $ 171,817 $ 9,440 5.")
 $ 2,634 $ 867 $ 3,791 $ 171,784 $ 6,304 3.81% 2005 $ 171,784 $ 2,492 $ 804 $ (386) $ 5,420 $ 180,114 $ 8,330 4.")
32 Deposit Trends Beginning Total Deposits Ending Net Growth Annual Year Ending Balance Q1 Q2 Q3 Q4 Balance Growth % 1999 $ 149,334 $ (46,774) $ 2,886 $ (7,449) $ 45,408 $ 143,405 $ (5,929) -3.97% 2000 $ 143,405 $ (46,717) $ 14,457 $ 5,976 $ 45,256 $ 162,377 $ 18, % 2001 $ 162,377 $ (36,029) $ (2,040) $ 18,228 $ 29,281 $ 171,817 $ 9, % 2002 $ 171,817 $ 5,504 $ (4,553) $ (8,541) $ (1,698) $ 162,529 $ (9,288) -5.41% 2003 $ 162,529 $ 1,029 $ 5,999 $ (9,969) $ 5,892 $ 165,480 $ 2, % 2004 $ 165,480 $ (988) $ 2,634 $ 867 $ 3,791 $ 171,784 $ 6, % 2005 $ 171,784 $ 2,492 $ 804 $ (386) $ 5,420 $ 180,114 $ 8, % 2006 $ 180,114 $ (1,149) $ 4,643 $ (2,254) $ 7,689 $ 189,043 $ 8, % 2007 $ 189,043 $ (2,902) $ 789 $ (4,493) $ 8,884 $ 191,321 $ 2, % 2008 $ 191,321 $ (662) $ 3,219 $ 3,532 $ 122,960 $ 320,370 $ 129, % 2009 $ 320,370 $ 9,252 $ 5,766 $ 2,676 $ 3,894 $ 341,958 $ 21, % 2010 $ 341,958 $ 716 $ 24 $ (6,491) $ 6,616 $ 342,823 $ % 2011 $ 342,823 $ 8,018 $ (5,464) $ 7,765 $ 11,226 $ 364,368 $ 21, % 2012 $ 364,368 $ 6,195 $ (8,778) $ 2,001 $ (4,072) $ 359,714 $ (4,654) -1.28% 2013 $ 359,714 $ 12,700 $ (1,295) $ (12,569) $ 14,062 $ 372,612 $ 12, % Total\Avg $ (89,315) $ 19,091 $ (11,107) $ 304, , % % Total Growth % 8.55% -4.97% % Avg of Negative -3.55% Time Deposit Trends Annual Beginning Time Deposits Ending Net Growth Growth % Year Ending Balance Q1 Q2 Q3 Q4 Balance 1999 $ 78,191 $ 371 $ 2,138 $ (7,302) $ 94 $ 73,492 $ (4,699) -6.01% 2000 $ 73,492 $ 2,891 $ 8,711 $ 5,445 $ (4,151) $ 86,388 $ 12, % 2001 $ 86,388 $ 12,283 $ (1,645) $ 1,885 $ (4,497) $ 94,414 $ 8, % 2002 $ 94,414 $ (369) $ (1,708) $ (1,622) $ (3,368) $ 87,347 $ (7,067) -7.49% 2003 $ 87,347 $ 197 $ 440 $ (2,962) $ 731 $ 85,753 $ (1,594) -1.82% 2004 $ 85,753 $ 1,104 $ (497) $ (5,445) $ 1,322 $ 82,237 $ (3,516) -4.10% 2005 $ 82,237 $ 7,748 $ 1,494 $ 3,124 $ 245 $ 94,848 $ 12, % 2006 $ 94,848 $ 426 $ 5,416 $ 2,469 $ 437 $ 103,596 $ 8, % 2007 $ 103,596 $ (2,932) $ (6,538) $ (8,719) $ (380) $ 85,027 $ (18,569) % 2008 $ 85,027 $ 5,531 $ 307 $ 588 $ 40,900 $ 132,353 $ 47, % 2009 $ 132,353 $ 12,271 $ (3,270) $ (7,436) $ (7,793) $ 126,125 $ (6,228) -4.71% 2010 $ 126,125 $ (5,101) $ (937) $ (3,870) $ (1,619) $ 114,598 $ (11,527) -9.14% 2011 $ 114,598 $ (6,412) $ (2,758) $ (1,049) $ (2,612) $ 101,767 $ (12,831) % 2012 $ 101,767 $ (4,479) $ (561) $ 902 $ 476 $ 98,105 $ (3,662) -3.60% 2013 $ 98,105 $ 2,507 $ 1,414 $ 1,845 $ 2,855 $ 106,726 $ 8, % Avg $ 26,036 $ 2,006 $ (22,147) $ 22,640 28, % % Total Growth 91.24% 7.03% % 79.34% Avg of Negative -7.33% 32
 $ 3,437 $ 3,437 0.00% 2001 $ 3,437 $ (1,644) $ (1,294) $ - $ - $ 499 $ (2,938) -85.48% 2002 $ 499 $ - $ 95 $ (399) $ 299 $ 494 $ (5) -1.")
 $ 2,480 $ 1,246 $ 1,043 $ 10,274 $ 3,651 55.13% 2007 $ 10,274 $ (1,048) $ 606 $ (7,505) $ (964) $ 1,363 $ (8,911) -86.")
33 Brokered CD Trends Beginning Time Deposits: Brokered Ending Annual Net Growth Year Ending Balance Q1 Q2 Q3 Q4 Balance Growth % 1999 $ - $ - $ - $ - $ - $ - $ % 2000 $ - $ - $ - $ 4,305 $ (868) $ 3,437 $ 3, % 2001 $ 3,437 $ (1,644) $ (1,294) $ - $ - $ 499 $ (2,938) % 2002 $ 499 $ - $ 95 $ (399) $ 299 $ 494 $ (5) -1.00% 2003 $ 494 $ 400 $ (94) $ (299) $ (100) $ 401 $ (93) % 2004 $ 401 $ 196 $ 99 $ (197) $ 1,002 $ 1,501 $ 1, % 2005 $ 1,501 $ 93 $ 408 $ 6,121 $ (1,500) $ 6,623 $ 5, % 2006 $ 6,623 $ (1,118) $ 2,480 $ 1,246 $ 1,043 $ 10,274 $ 3, % 2007 $ 10,274 $ (1,048) $ 606 $ (7,505) $ (964) $ 1,363 $ (8,911) % 2008 $ 1,363 $ 834 $ - $ (1,248) $ 502 $ 1,451 $ % 2009 $ 1,451 $ (300) $ 2,385 $ (997) $ 2 $ 2,541 $ 1, % 2010 $ 2,541 $ (553) $ (248) $ (248) $ - $ 1,492 $ (1,049) % 2011 $ 1,492 $ (896) $ (348) $ - $ - $ 248 $ (1,244) % 2012 $ 248 $ (248) $ - $ - $ - $ - $ (248) % 2013 $ - $ - $ 2,009 $ 618 $ 216 $ 2,843 $ 2, % Avg $ (4,284) $ 6,098 $ 1,397 $ (368) 2, % % Total Growth % % 49.14% % Avg of Negative % Deposit Sector Trends Beginning Non-Maturity Deposits Ending Annual Net Growth Year Ending Balance Q1 Q2 Q3 Q4 Balance Growth % 1999 $ 71,143 $ (47,145) $ 748 $ (147) $ 45,314 $ 69,913 $ (1,230) -1.73% 2000 $ 69,913 $ (49,608) $ 5,746 $ 531 $ 49,407 $ 75,989 $ 6, % 2001 $ 75,989 $ (48,312) $ (395) $ 16,343 $ 33,778 $ 77,403 $ 1, % 2002 $ 77,403 $ 5,873 $ (2,845) $ (6,919) $ 1,670 $ 75,182 $ (2,221) -2.87% 2003 $ 75,182 $ 832 $ 5,559 $ (7,007) $ 5,161 $ 79,727 $ 4, % 2004 $ 79,727 $ (2,092) $ 3,131 $ 6,312 $ 2,469 $ 89,547 $ 9, % 2005 $ 89,547 $ (5,256) $ (690) $ (3,510) $ 5,175 $ 85,266 $ (4,281) -4.78% 2006 $ 85,266 $ (1,575) $ (773) $ (4,723) $ 7,252 $ 85,447 $ % 2007 $ 85,447 $ 30 $ 7,327 $ 4,226 $ 9,264 $ 106,294 $ 20, % 2008 $ 106,294 $ (6,193) $ 2,912 $ 2,944 $ 82,060 $ 188,017 $ 81, % 2009 $ 188,017 $ (3,019) $ 9,036 $ 10,112 $ 11,687 $ 215,833 $ 27, % 2010 $ 215,833 $ 5,817 $ 961 $ (2,621) $ 8,235 $ 228,225 $ 12, % 2011 $ 228,225 $ 14,430 $ (2,706) $ 8,814 $ 13,838 $ 262,601 $ 34, % 2012 $ 262,601 $ 10,674 $ (8,217) $ 1,099 $ (4,548) $ 261,609 $ (992) -0.38% 2013 $ 261,609 $ 10,193 $ (2,709) $ (14,414) $ 11,207 $ 265,886 $ 4, % Total\Avg $ (115,351) $ 17,085 $ 11,040 $ 281, , % % Total Growth % 8.77% 5.67% % Avg of Negative -2.44% 33
34 SITUATIONAL STRESS TESTS 5 Principles of Stress Tests 1. Should include activities and exercises tailored to institution and capture exposures, activities and risks 2. Employ multiple, conceptually sound activities and approaches 3. Is forward looking and flexible 4. Provide clear, actionable, well supported, data to inform decision making 5. Provide strong governance and effective internal controls What s that means for you 34


35 Stress Scenario Design Components Stress Testing Focus Regular assessment of high likelihood, high impact scenarios Periodic testing (annually) of low likelihood, high impact scenarios Ignore low impact, low severity scenarios 35
36 High Impact, Low Probability Scenario Define catastrophic event resulting in reduction in capital levels to below well capitalized status Examples of catastrophic events What do we do with this test if we fail? More Realistic Stress Tests Scenario Analysis Types of Stress Tests Developing Functional Stress Tests Developing Catastrophic Stress Tests 36
37 Liquidity Issues to Address Today! Economic recovery erodes cash flow What is ALCOs funding plan to raise deposits or, manage asset growth? What other risks are raised with this potential scenario? Stress Test and Borrowing Capacity Institutions total capacity to borrow offers 3 uses: Major question: how much capacity do we need to keep available in case of a liquidity need? 37
38 Determining Funding Needs Base Cash Flow Gap 1 Yr.: -1.1 Million + Unencumber Liquid Assets 1 Yr Million Stress Test Results: -50% Loan Repayments -50 Million -20% Deposit Runoff -35 Million -20% Increase in Line Draws - 6 Million Total Change in Stress Test -91 Million Net Position B4 Management Action -66 Million Determining Long Term Funding Needs Net position before management action -66 million Management actions: 25% decrease in loan origination +38 million Net need for long term liquidity - 28 million Total borrowing capacity $125 million Reserve between $28 & $66 mil for liquidity risks 22% 53% 38
39 Elements of an Effective Program 1. Solid measurement for Asset Based Liquidity Position and needs 2. Solid forecast of cash flows in your business plan 3. Effective Policy Limits 4. Defined Stress scenarios 5. Contingency Funding Plans FARIN Financial Risk Management Advisory Services Capital Planning Asset/Liability Management Core Deposit Analysis Credit Services Loan & Deposit Pricing Data Warehousing 39
Liquidity Basics Measuring and Managing Liquidity
 Liquidity Basics Measuring and Managing Liquidity Urum Urumoglu Senior Consultant Urum@farin.com 800-236-3724 x4210 1 Course Agenda Understanding Nature of Liquidity Definition of Liquidity Traditional
Liquidity Basics Measuring and Managing Liquidity. Course Agenda
 Liquidity Basics Measuring and Managing Liquidity David Koch Chief Operating Officer dkoch@farin.com 800-236-3724 x4217 1 Course Agenda Understanding Nature of Liquidity Definition of Liquidity Traditional
Liquidity Basics Measuring and Managing Liquidity. Course Agenda
 Liquidity Basics Measuring and Managing Liquidity Urum Urumoglu Senior Consultant Urum@farin.com 800-236-3724 x4210 1 Course Agenda Understanding Nature of Liquidity Definition of Liquidity Traditional
Liquidity Risk Basics Measuring and Managing Liquidity. Dad, What is Liquidity & Where Does it Come From?
 Liquidity Risk Basics Measuring and Managing Liquidity David Koch Chief Operating Officer FARIN & Associates, Inc. dkoch@farin.com 608-661-4217 1 Dad, What is Liquidity & Where Does it Come From? 2 1 Our
Liquidity Risk Managing an Effective Program Session #2. Course Agenda
 Liquidity Risk Managing an Effective Program Session #2 David Koch Chief Operating Officer dkoch@farin.com 800-236-3724 x4217 1 Course Agenda Understanding Nature of Liquidity Asset based vs. Total Liquidity
MAKING LIQUIDITY YOUR NEW BEST FRIEND
 FHLB INDIANAPOLIS MAKING LIQUIDITY YOUR NEW BEST FRIEND David Koch President\CEO FARIN & Associates, Inc. dkoch@farin.com 608-661-4217 1 Friends vs. Best Friends 2 3 Types of Friendship 1. Friendship of
ALCO: The Fundamentals
 ALCO: The Fundamentals Presented by: Urum Urumoglu Senior Consultant Urum@farin.com 800-236-3724 ext. 4210 1 What Is Asset/Liability Management? Asset/Liability Management (ALM) is the process of planning,
ALCO: The Fundamentals
 ALCO: The Fundamentals Presented by: David Koch Chief Operating Officer dkoch@farin.com 800-236-3724 ext. 4217 1 What Is Asset/Liability Management? Asset/Liability Management (ALM) is the process of planning,
How to Improve Liquidity
 How to Improve Liquidity As Economic Conditions Change June 26, 2017 9:15 am Presented by: Joe Kennerson Managing Director Darling Consulting Group 260 Merrimac Street Newburyport, MA 01950 P: 978-463-0400
Farin & Associates, Inc. Farin Foresight Software Certification as of November 30, 2017
 Farin & Associates, Inc. Farin Foresight Software Certification as of November 30, 2017 by Alpha-Numeric Consulting, LLC December 20, 2017 Introduction Financial institutions recognize the need for accurate
Core Deposit Analytics Session 2: Beyond Basics - Applying Results
 Core Deposit Analytics Session 2: Beyond Basics - Applying Results David Koch President/CEO dkoch@farin.com 800-236-3724 ext. 4217 1 Impact of Right Assumptions on ALCO Decision Making CORE DEPOSIT ASSUMPTIONS
Enterprise Risk Management and the ALCO Process
 Enterprise Risk Management and the ALCO Process Session 1: Gathering the Parts David Koch Chief Operating Officer dkoch@farin.com 800-236-3724 ext 4217 Agenda Session 1 Overview of ERM Evolution of ERM
CREDIT UNION LIQUIDITY MANAGEMENT
 Economic Forum October 3 5, CREDIT UNION LIQUIDITY MANAGEMENT Jeff Vorhees, Sr. ALM Analyst Topics of discussion Liquidity Risk Explained Liquidity Sources Liquidity Risk Management 1 Economic Forum October
Lecture Materials BANK PERFORMANCE ANALYSIS AND CAPITAL PLANNING
 Lecture Materials BANK PERFORMANCE ANALYSIS AND CAPITAL PLANNING David Koch President & CEO FARIN Financial Risk Management Madison, Wisconsin dkoch@farin.com 608-661-4217 August 11, 2017 BANK PERFORMANCE
Advanced Asset/Liability Management
 Advanced Asset/Liability Management WBA BOLT Summer Leadership Summit June 14, 2018 Presented by: Marc Gall, Vice President mgall@bokf.com 1 Agenda Asset/Liability Management Summary Developing Assumptions
Jerry Boebel, CFA Business Consultant ProfitStars Omaha Office
 Liquidity Analysis and Reporting Jerry Boebel, CFA Business Consultant ProfitStars Omaha Office jboebel@profitstars.com Objectives Current trends Recent regulatory releases Consider a new approach Better
Interest Rate Risk Basics Measuring & Managing Earnings & Value at Risk
 Interest Rate Risk Basics Measuring & Managing Earnings & Value at Risk Presented By: David W. Koch Chief Operating Officer FARIN & Associates, Inc.. dkoch@farin.com 1 Session Overview Session 1 Define
FHLB Des Moines Regional Member Meetings Profiting from a Rising Rate Environment
 Risk Management Strategy & Solutions FHLB Des Moines Regional Member Meetings Profiting from a Rising Rate Environment Joseph Kennerson, Managing Director jkennerson@darlingconsulting.com Mark A. Haberland,
Liquidity Management. 158 Route 206 Gladstone, NJ P: (908) Home FinPro, Inc.
 Home FinPro, Inc.") Liquidity Management 158 Route 206 Gladstone, NJ 07934 P: (908) 234-9398 finpro@finpro.us www.finpro.us 0 Liquidity: you always have too much until you need it!! 1 Banks must take a holistic view of its
Liquidity Management 158 Route 206 Gladstone, NJ 07934 P: (908) 234-9398 finpro@finpro.us www.finpro.us 0 Liquidity: you always have too much until you need it!! 1 Banks must take a holistic view of its
Capital Speedboat Session 2. Charting your way through troubling waters FARIN & Associates Inc. Agenda
 Capital Speedboat 2013 - Session 2 Charting your way through troubling waters 1 Agenda Session 2 Defining Stress Tests Stress vs. Scenario Testing Sensitivity Testing Scenarios Silos Scenario Testing Building
Regions Financial Corporation. Liquidity Coverage Ratio Disclosure
 Regions Financial Corporation Liquidity Coverage Ratio Disclosure As of and for the quarter ended December 31, 2018 Table of Contents Introduction 3 Main Drivers of LCR 3 High Quality Liquid Assets 4 Net
Demystifying the New Liquidity Requirements
 Your State Association Presents Demystifying the New Liquidity Requirements Program Materials Use this document to follow along with the live webinar presentation. Please test your system before the broadcast.
Liquidity Coverage Ratio ( LCR ) For the quarter ended 31 Mar 2017
 For the quarter ended 31 Mar 2017") Liquidity Coverage Ratio ( LCR ) For the quarter ended 31 Mar 017 DBS Group Holdings Ltd Incorporated in the Republic of Singapore Company Registration Number: 19990115M The following disclosures for the
Liquidity Coverage Ratio ( LCR ) For the quarter ended 31 Mar 017 DBS Group Holdings Ltd Incorporated in the Republic of Singapore Company Registration Number: 19990115M The following disclosures for the
Liquidity Coverage Ratio Disclosure. Bank AlBilad Liquidity Coverage Ratio Disclosure Dec 31, 2015
 Bank AlBilad Liquidity Coverage Ratio Disclosure Dec 31, 2015 1 I. LIQUIDITY COVERAGE RATIO (LCR): QUANTITATIVE DISCLOSURE Date: 31 Dec 2015 LCR Common Disclosure Template (In SR 000`s) Total UNWEIGHTED
Deposit Growth Strategies and Balance Sheet Management
 Deposit Growth Strategies and Balance Sheet Management Presented by: Frank Santucci Managing Director ALM Services www.firstempire.com Frank Santucci - Managing Director ALM Services First Empire Securities,
Realize Tomorrow. Liquidity Coverage Ratio (LCR) Disclosure Report
 Disclosure Report") Realize Tomorrow Liquidity Coverage Ratio (LCR) Disclosure Report March 2017 Content Introduction:... 2 I. Liquidity Governance... 2 II. Funding Strategy... 2 III. Liquidity Framework & Liquidity Risk
Realize Tomorrow Liquidity Coverage Ratio (LCR) Disclosure Report March 2017 Content Introduction:... 2 I. Liquidity Governance... 2 II. Funding Strategy... 2 III. Liquidity Framework & Liquidity Risk
Pillar 3 Disclosures. Liquidity Coverage Ratio ( LCR ) For the quarter ended 31 March 2016
 For the quarter ended 31 March 2016") Pillar 3 Disclosures Liquidity Coverage Ratio ( LCR ) For the quarter ended 31 March 016 DBS Group Holdings Ltd Incorporated in the Republic of Singapore Company Registration Number: 19990115M The following
Pillar 3 Disclosures Liquidity Coverage Ratio ( LCR ) For the quarter ended 31 March 016 DBS Group Holdings Ltd Incorporated in the Republic of Singapore Company Registration Number: 19990115M The following
Balance Sheet Strategies For Changing Rate Environments
 Balance Sheet Strategies For Changing Rate Environments Moss Adams 2017 Credit Union Conference Portland, OR June 22 nd, 2017 Ryan W. Hayhurst Managing Director ryan@gobaker.com 800 962 9468 Credit Union
LIQUIDITY COVERAGE RATIO DISCLOSURE
 LIQUIDITY COVERAGE RATIO DISCLOSURE For the quarterly period ended September 30, 2018 Table of Contents Liquidity Coverage Ratio 1 High Quality Liquid Assets and other liquidity sources 3 Net Cash Outflows
LIQUIDITY COVERAGE RATIO DISCLOSURE
 LIQUIDITY COVERAGE RATIO DISCLOSURE For the quarterly period ended December 31, 2018 Table of Contents Liquidity Coverage Ratio 1 High Quality Liquid Assets and other liquidity sources 3 Net Cash Outflows
Wells Fargo & Company. Liquidity Coverage Ratio Disclosure
 Wells Fargo & Company Liquidity Coverage Ratio Disclosure For the quarter ended September 30, 2017 1 Table of Contents Introduction... 3 Executive Summary... 3 Company Overview... 4 LCR Rule Overview...
Liquidity Coverage Ratio Disclosure. For the quarter ended September 2018
 Liquidity Coverage Ratio Disclosure For the quarter ended September 2018 Liquidity Coverage Ratio ("LCR") and the Disclosure Template The Monetary Authority of Singapore ( MAS ) had designated Citibank
Excess liquidity can restrict NorthPark s profitability and have an adverse effect on its capital position.
 Purpose Liquidity Risk is defined as the current and prospective risk to NorthPark Community Credit Union s (NorthPark) earnings and capital position. Potential risk develops when NorthPark s experiences
Learn the Fundamentals of Managing Liquidity Under U.S. Basel III
 Learn the Fundamentals of Managing Liquidity Under U.S. Basel III Originally presented as a part of a Moody s Analytics recorded webinar on May 1, 2014 Agenda» Key Aspects of the Planned U.S. Basel III
The PNC Financial Services Group, Inc. Liquidity Coverage Ratio Disclosure June 30, 2018
 The PNC Financial Services Group, Inc. Liquidity Coverage Ratio Disclosure Table of Contents Section Page Introduction 1 Liquidity Coverage Ratio 2 High Quality Liquid Assets 4 Funding Sources 4 Net Cash
Wells Fargo & Company. Liquidity Coverage Ratio Disclosure
 Wells Fargo & Company Liquidity Coverage Ratio Disclosure For the quarter ended September 30, 2018 1 Table of Contents Introduction... 3 Executive Summary... 3 Company Overview... 4 LCR Rule Overview...
Asset/Liability Management
 Asset/Liability Management FHLB System Sales and Marketing Meeting Scottsdale, AZ February 27 th, 2016 Ryan W. Hayhurst Managing Director Financial Strategies Group ryan@gobaker.com 800-962-9468 The Baker
Core Deposit Analytics Session 1
 Core Deposit Analytics Session 1 Thomas A. Farin tfarin@farin.com David Koch dkoch@farin.com 1 Agenda Session 1 - Deposit Analytics Contractual vs. Actual Behavior Pricing Betas Decay Rates Surge Balances
Credit Union Survival in a Challenging
 Credit Union Survival in a Challenging Environment How to Make Balance Sheet Strategy Decisions with Confidence January 24, 2013 C O M P L E T E ALM SOLUTIONS Frank L. Farone Managing Director Darling
ALM Strategy in the Current Rate Environment. Current Landscape Interest Rates CU Balance Sheet & Financial Performance Trends
 ALM Strategy in the Current Rate Environment Lisa Boylen Senior ALM Analyst December 12, 2018 1 Objectives Current Landscape Interest Rates CU Balance Sheet & Financial Performance Trends Lessons Learned
Regulatory Practice Letter December 2013 RPL 13-20
 Regulatory Practice Letter December 2013 RPL 13-20 Basel III Liquidity Coverage Ratio Proposal of U.S. Bank Regulators Executive Summary The Federal Reserve Board (Federal Reserve), the Office of the Comptroller
LIQUIDITY COVERAGE RATIO DISCLOSURE
 LIQUIDITY COVERAGE RATIO DISCLOSURE For the quarterly period ended September 30, 2017 Table of Contents Liquidity Coverage Ratio 1 High Quality Liquid Assets and other liquidity sources 3 Net Cash Outflows
LIQUIDITY & FUNDING STABILITY DURING UNCERTAIN TIMES
 LIQUIDITY & FUNDING STABILITY DURING UNCERTAIN TIMES Kevin Hamilton Regional Director Promontory Interfinancial Network, LLC Email: khamilton@promnetwork.com Tel: (703) 292-3329 Web: www.promnetwork.com
LIQUIDITY COVERAGE RATIO DISCLOSURE
 LIQUIDITY COVERAGE RATIO DISCLOSURE For the quarterly period ended June 30, 2018 Table of Contents Liquidity Coverage Ratio 1 High Quality Liquid Assets and other liquidity sources 3 Net Cash Outflows
Elevate Your Credit Union s Performance Now is NOT the Time for Business as Usual!
 Risk Management Strategy & Solutions Elevate Your Credit Union s Performance Now is NOT the Time for Business as Usual! 2017 Darling Consulting Group, Inc. 260 Merrimac Street Newburyport, MA 01950 Tel:
ALM Strategies In the Current Economic Environment Presented by: Frank Santucci Managing Director ALM Services (October 2015)
") 1 ALM Strategies In the Current Economic Environment Presented by: Frank Santucci Managing Director ALM Services (October 2015) 1 Asset Liability Management is the process of Measuring, Monitoring and
1 ALM Strategies In the Current Economic Environment Presented by: Frank Santucci Managing Director ALM Services (October 2015) 1 Asset Liability Management is the process of Measuring, Monitoring and
DBS BANK (HONG KONG) LIMITED
 LIMITED") 星展銀行 ( 香港 ) 有限公司 DBS BANK (HONG KONG) LIMITED (Incorporated in Hong Kong with limited liability) REGULATORY DISCLOSURE STATEMENTS For the quarter ended CONTENTS Pages 1 INTRODUCTION... 1 2 KEY PRUDENTIAL
星展銀行 ( 香港 ) 有限公司 DBS BANK (HONG KONG) LIMITED (Incorporated in Hong Kong with limited liability) REGULATORY DISCLOSURE STATEMENTS For the quarter ended CONTENTS Pages 1 INTRODUCTION... 1 2 KEY PRUDENTIAL
What is a Dynamic ALCO
 Managing a Dynamic ALCO Managing Earnings, Value and Liquidity Risks in your Decision Making Process Presented By: David Koch President & CEO dkoch@farin.com (608) 661-4217 1 What is a Dynamic ALCO Dynamic
Liquidity Coverage Ratio Disclosure. For the quarter ended June 2018
 Liquidity Coverage Ratio Disclosure For the quarter ended June 2018 Liquidity Coverage Ratio ("LCR") and the Disclosure Template The Monetary Authority of Singapore ( MAS ) had designated Citibank Singapore
Liquidity and Contingency Funding Strategies for Today s Market
 Liquidity and Contingency Funding Strategies for Today s Market Presented by www.firstempire.com Today s Presenter Frank Santucci, Managing Director ALM Services, BSMS Frank has been working with banks
Using Loan Participations as part of Liquidity Management
 Jeff Hamilton Vice President, Member Credit The Liquidity Landscape Review of Loan Participations Using Loan Participations as part of Liquidity Management 2 1 Hi,. I m from the government and I m here
Lecture Materials ASSET/LIABILITY MANAGEMENT YEAR 2
 Lecture Materials ASSET/LIABILITY MANAGEMENT YEAR 2 David Koch President & CEO FARIN Financial Risk Management Madison, Wisconsin dkoch@farin.com 608-661-4217 August 3, 2017 TYING IT ALL TOGETHER: IMPLEMENTATION
MANAGING INTEREST RATE RISK: SETTING THE STAGE FOR TOMORROW MIKE DELISLE, ALM ADVISORS GROUP
 MANAGING INTEREST RATE RISK: SETTING THE STAGE FOR TOMORROW MIKE DELISLE, ALM ADVISORS GROUP WVBA Convention July 29, 2014 Agenda Evaluating and Anticipating the Rate Environment Understanding Your Current
LIQUIDITY AND FUNDS MANAGEMENT
 LIQUIDITY AND FUNDS MANAGEMENT STRATEGIC TOPIC INTERSESSION PROJECT by: Brian Heim LIQUIDITY AND FUNDS MANAGEMENT TABLE OF CONTENTS INTRODUCTION 1 PART I: LIQUIDITY GUIDANCE AND TRENDS 2 PART II: FUNDS
Pillar 3 U.S. Liquidity Coverage Ratio (LCR) Disclosures. For the quarter ended September 30, 2017
 Disclosures. For the quarter ended September 30, 2017") Pillar 3 U.S. Liquidity Coverage Ratio (LCR) Disclosures For the quarter ended September 30, 2017 Bank of America Pillar 3 U.S. Liquidity Coverage Ratio Disclosures TABLE OF CONTENTS DISCLOSURE MAP...
Pillar 3 U.S. Liquidity Coverage Ratio (LCR) Disclosures For the quarter ended September 30, 2017 Bank of America Pillar 3 U.S. Liquidity Coverage Ratio Disclosures TABLE OF CONTENTS DISCLOSURE MAP...
Table 1: LCR Three Months Ended Average Weighted Amount (millions)
") Executive Summary The Board of Governors of the Federal Reserve System (the Federal Reserve ) requires public disclosure of the liquidity coverage ratio (the LCR ) by depository institution holding companies
Executive Summary The Board of Governors of the Federal Reserve System (the Federal Reserve ) requires public disclosure of the liquidity coverage ratio (the LCR ) by depository institution holding companies
Lecture Materials ASSET/LIABILITY MANAGEMENT YEAR 1
 Lecture Materials ASSET/LIABILITY MANAGEMENT YEAR 1 Dwight R. Larsen National Bank Examiner Office of the Comptroller of the Currency Minneapolis, Minnesota dwightrlarsen@hotmail.com 202-597-1329 August
Guidance Note: Stress Testing Credit Unions with Assets Greater than $500 million. May Ce document est également disponible en français.
 Guidance Note: Stress Testing Credit Unions with Assets Greater than $500 million May 2017 Ce document est également disponible en français. Applicability This Guidance Note is for use by all credit unions
Interest Rate Risk Basics Measuring & Managing Earnings & Value at Risk
 Interest Rate Risk Basics Measuring & Managing Earnings & Value at Risk Urum Urumoglu Senior Consultant FARIN & Associates, Inc.. Urum@farin.com 1 Session Overview Session 1 Define Interest Rate Risk IRR
Appendix B: HQLA Guide Consultation Paper No Basel III: Liquidity Management
 Appendix B: HQLA Guide Consultation Paper No.3 2017 Basel III: Liquidity Management [Draft] Guide on the calculation and reporting of HQLA Issued: 26 April 2017 Contents Contents Overview... 3 Consultation...
Basel III: The Liquidity Coverage Ratio and Liquidity Risk Monitoring Tools
 P2.T7. Operational & Integrated Risk Management Basel III: The Liquidity Coverage Ratio and Liquidity Risk Monitoring Tools Bionic Turtle FRM Study Notes By David Harper, CFA FRM CIPM www.bionicturtle.com
DWS USA Corporation. U.S. Liquidity Coverage Ratio Disclosures. For the quarter ended December 31, 2018
 DWS USA Corporation U.S. Liquidity Coverage Ratio Disclosures For the quarter ended December 31, 2018 1 Table of Contents The Liquidity Coverage Ratio (LCR) 3 U.S. Disclosure Requirements 4 U.S. Qualitative
The Use of IFRS for Prudential and Regulatory Purposes
 REPARIS A REGIONAL PROGRAM The Use of IFRS for Prudential and Regulatory Purposes Liquidity Risk Management THE ROAD TO EUROPE: PROGRAM OF ACCOUNTING REFORM AND INSTITUTIONAL STRENGTHENING (REPARIS) !
Asset Liability Management for CU Boards The Basics of ALM Presented by: Frank Santucci - Managing Director ALM Services
 Asset Liability Management for CU Boards The Basics of ALM Presented by: Frank Santucci - Managing Director ALM Services www.firstempire.com Frank Santucci - Managing Director ALM Services First Empire
Introduction to Asset/Liability Management
 Introduction to Asset/Liability Management WBA BOLT Summer Leadership Summit June 14, 2018 Presented by: Marc Gall, Vice President mgall@bokf.com 1 Agenda Asset/Liability Management and ALCO Meetings Defining
2
 1 2 3 4 5 6 7 8 The Changing Deposit / Funding Landscape 2018 Promontory Interfinancial Network, LLC The Market Is Changing Funding pressures knocking at community bank doors S&P Global Market Intelligence,
SEPTEMBER 2016 BC Credit Unions
 Net Cumulative Cash Flow Reporting Guide SEPTEMBER 2016 BC Credit Unions www.fic.gov.bc.ca Table of Contents 1 INTRODUCTION... 1 1.1 Background... 1 1.2 Objectives... 2 2 NCCF REPORTING... 2 3 ASSUMPTIONS...
Morgan Stanley Fixed Income Investor Conference Call
 Morgan Stanley Fixed Income Investor Conference Call August 3, 2012 Notice The information provided herein may include certain non-gaap financial measures. The reconciliation of such measures to the comparable
2017 Seminar for Senior Bank Supervisors from Emerging Economies. Implementation of Basel III Liquidity Requirements in Emerging Markets
 2017 Seminar for Senior Bank Supervisors from Emerging Economies Implementation of Basel III Liquidity Requirements in Emerging Markets Christopher Wilson Monetary and Capital Markets Department International
Liquidity Coverage Ratio Disclosure For the Quarterly Period Ended September 30, 2017
 Liquidity Coverage Ratio Disclosure For the Quarterly Period Ended September 30, 2017 THE BANK OF NEW YORK MELLON CORPORATION Table of Contents Introduction... 2... 3 Quarterly Variance in the LCR... 3
Standard Chartered Bank (Singapore) Limited Registration Number: C. LCR Public Disclosure Year ended 31 December 2017
 Limited Registration Number: C. LCR Public Disclosure Year ended 31 December 2017") Standard Chartered Bank (Singapore) Limited Registration Number: 201224747C LCR Public Disclosure Year ended 31 December 2017 Liquidity Coverage Ratio The purpose of this disclosure is to provide the information
Standard Chartered Bank (Singapore) Limited Registration Number: 201224747C LCR Public Disclosure Year ended 31 December 2017 Liquidity Coverage Ratio The purpose of this disclosure is to provide the information
Liquidity Risk Supervision of Large Banking Organizations
 Liquidity Risk Supervision of Large Banking Organizations October 28, 2014 Any opinions expressed are the authors alone and do not necessarily reflect the views of the Federal Reserve Bank of Chicago or
Completion Guide: Net Cumulative Cash Flow. May Ce document est également disponible en français.
 Completion Guide: Net Cumulative Cash Flow May 2018 Ce document est également disponible en français. Table of Contents 1. INTRODUCTION... 3 2. ASSUMPTIONS... 3 3. INFLOWS... 3 4. OUTFLOWS... 6 5. MEMO
FINANCIAL STATEMENT ANALYSIS & RATIO ANALYSIS
 FINANCIAL STATEMENT ANALYSIS & RATIO ANALYSIS June 13, 2013 Presented By Mike Ensweiler Director of Business Development Agenda General duties of directors What questions should directors be able to answer
Liquidity Coverage Ratio Disclosure For the Quarterly Period Ended March 31, 2018 THE BANK OF NEW YORK MELLON CORPORATION
 Liquidity Coverage Ratio Disclosure For the Quarterly Period Ended March 31, 2018 THE BANK OF NEW YORK MELLON CORPORATION Table of Contents Introduction... 2... 3 Quarterly Variance in the LCR... 3 Drivers
Developing a Funding Strategy for Rising Rates. Agenda
 Developing a Funding Strategy for Rising Rates Thomas Farin Chairman tfarin@farin.com 1 Agenda Session 1: Lay out a best practices funding and pricing process? Identify internal issues impacting risk profile
Completion Guide: Net Stable Funding Ratio. July Ce document est également disponible en français.
 Completion Guide: Net Stable Funding Ratio July 2016 Ce document est également disponible en français. Table of Contents 1. INTRODUCTION... 3 2. ASSUMPTIONS... 3 3. AVAILABLE STABLE FUNDING... 4 4. REQUIRED
Liquidity Coverage Ratio Public Disclosure
 Liquidity Coverage Ratio Public Disclosure For the Quarter Ended December 31, 2018 Table of Contents INTRODUCTION 1 LIQUIDITY COVERAGE RATIO 1 PRIMARY DRIVERS OF THE LCR 1 U.S. LCR QUANTITATIVE DISCLOSURE
The Regulatory Focus on Interest Rate Risk: What to Expect and How to Comply
 The Regulatory Focus on Interest Rate Risk: What to Expect and How to Comply Conference Call will begin at 10:00am CT, lines open at 10:50am CT Audio: 855-749-4750 Access Code: 920 722 897 # You can also
2016 Seminar for Senior Bank Supervisors from Emerging Economies. Implementation of Basel III Liquidity Requirements in Emerging Markets
 2016 Seminar for Senior Bank Supervisors from Emerging Economies Implementation of Basel III Liquidity Requirements in Emerging Markets Christopher Wilson Monetary and Capital Markets Department International
NCUA Regulatory Update on ALM
 Peter Jensen, Regional Capital Markets Specialist NCUA, Region 4, Division of Special Actions NCUA Regulatory Update on ALM University for Credit Unions September 23, 2014 Agenda Introduction Interest
Liquidity Coverage Ratio Disclosure For the Quarter Ended December 31, 2018
 Liquidity Coverage Ratio Disclosure For the Quarter Ended December 31, 2018 Table of Contents Page Company Overview 1 Liquidity Coverage Ratio Rule Overview 1 Liquidity Risk Management Framework 2 Summary
Guidance on Liquidity Risk Management
 2017 CONTENTS 1. Introduction... 3 2. Minimum Liquidity and Reporting Requirements... 5 3. Additional Liquidity Monitoring... 7 4. Liquidity Management Policy ( LMP )... 8 5. Fundamental principles for
Morgan Stanley 3Q15 Fixed Income Investor Call. November 3, 2015
 Morgan Stanley 3Q15 Fixed Income Investor Call November 3, 2015 Notice The information provided herein may include certain non-gaap financial measures. The reconciliation of such measures to the comparable
Liquidity Coverage Ratio Disclosure. For the quarter ended December 2018
 Liquidity Coverage Ratio Disclosure For the quarter ended December 2018 Liquidity Coverage Ratio ("LCR") and the Disclosure Template The Monetary Authority of Singapore ( MAS ) had designated Citibank
Pillar 3 Capital Adequacy and Risk Disclosures
 Pillar 3 Capital Adequacy and Risk Disclosures Quarterly Update as at 30 September 2018 Introduction Rabobank Australia Limited ( the Bank ) is an Authorised Deposit-taking Institution ( ADI ) subject
Developing Deposit Strategies for Rising Rates Session 1. Agenda
 Developing Deposit Strategies for Rising Rates Session 1 Thomas A. Farin President tfarin@farin.com 1 Agenda Session 1 - Deposit Analytics Are We In a Rising Rate Environment? Establishing Cash Flows Contractual
Net Stable Funding Ratio (NSFR) Update. Presented to: IBFed Prudential Supervision Working Group October 10, 2014
 Update. Presented to: IBFed Prudential Supervision Working Group October 10, 2014") Net Stable Funding Ratio (NSFR) Update Presented to: IBFed Prudential Supervision Working Group October 10, 2014 NSFR Background The NSFR was first introduced in 2009 in the Basel Committee s proposed
Net Stable Funding Ratio (NSFR) Update Presented to: IBFed Prudential Supervision Working Group October 10, 2014 NSFR Background The NSFR was first introduced in 2009 in the Basel Committee s proposed
Guideline. Liquidity Adequacy Requirements (LAR) Chapter 1 Overview Date: February 2018
 Chapter 1 Overview Date: February 2018") Guideline Subject: Liquidity Adequacy Requirements (LAR) Chapter 1 Date: February 2018 Subsection 485(1) and 949(1) of the Bank Act (BA), subsection 473(1) of the Trust and Loan Companies Act (TLCA) and
Guideline Subject: Liquidity Adequacy Requirements (LAR) Chapter 1 Date: February 2018 Subsection 485(1) and 949(1) of the Bank Act (BA), subsection 473(1) of the Trust and Loan Companies Act (TLCA) and
Pillar 3 Capital Adequacy and Risk Disclosures
 Pillar 3 Capital Adequacy and Risk Disclosures Quarterly Update as at 30 June 2018 Introduction Rabobank Australia Limited ( the Bank ) is an Authorised Deposit-taking Institution ( ADI ) subject to regulation
TABLE 2: CAPITAL STRUCTURE - December 31, 2015
 Frequency : Quarterly Location : Quarterly Financial Statement TABLE 2: CAPITAL STRUCTURE - December 31, 2015 Balance sheet - Step 1 (Table 2(b)) All figures are in SAR '000 Assets Balance sheet in Published
Liquidity Coverage Ratio Disclosures Report. For the Quarterly Period Ended September 30, 2017
 Liquidity Coverage Ratio Disclosures Report For the Quarterly Period Ended September 30, 2017 U.S. LCR DISCLOSURES REPORT For the quarterly period ended September 30, 2017 Table of Contents Page 1 Morgan
Georgia Banking School
 GEORGIA BANKERS ASSOCIATION Georgia Banking School Asset/Liability Management I 2016 Georgia Banking School May 5, 2016 Rachel Woods, CFA Associate, ALM SunTrust Robinson Humphrey Important Disclosure
Liquidity Management. Regulatory Burden vs. Business Opportunity. Kevin C. Parks VP/Key Account Manager Federal Home Loan Bank of Topeka
 Liquidity Management Regulatory Burden vs. Business Opportunity Kevin C. Parks VP/Key Account Manager Federal Home Loan Bank of Topeka PERSPECTIVES ON LIQUIDITY & RISK The Liquidity Question? What do we
Liquidity Risk Management. Thomas Schmale, Solution Management Analytical Banking, SAP AG, 29 th May 2014
 Liquidity Risk Management Thomas Schmale, Solution Management Analytical Banking, SAP AG, 29 th May 2014 Agenda Introduction Regulatory challenges in Liquidity Risk Management Further derived challenges
Goldman Sachs U.S. Financial Services Conference
 Goldman Sachs U.S. Financial Services Conference Greg D. Carmichael Chairman, President & Chief Executive Officer December 4, 208 FORWARD-LOOKING STATEMENTS This communication contains forward-looking
Liquidity: Community Banks and the Liquidity Coverage Ratio
 Liquidity: Community Banks and the Liquidity Coverage Ratio Community banks already have begun to feel the trickle-down effect of regulations designed to address systemic risk. The proposal for a liquidity
BEST PRACTICES IN ASSET/LIABILITY MANAGEMENT. AMIfs Institute July 18, 2016 Monday Afternoon Session
 BEST PRACTICES IN ASSET/LIABILITY MANAGEMENT AMIfs Institute July 18, 2016 Monday Afternoon Session 1 Agenda - Introduction to ALM Monday, July 18 Afternoon Best Practices in ALM Structuring the ALCO Process
Basel III Liquidity Options
 Basel III Liquidity Options FRDP 2011-02 May 28, 2011 In this ACFS Discussion Paper, Professor Kevin Davis examines the new Basel Liquidity Requirements announced at the end of 2010, focusing primarily
PNC Bank, NA. Board Report. June 30, Pittsburgh, PA. A/L BENCHMARKS Standards for Asset/Liability Management
 A/L BENCHMARKS Standards for Asset/Liability Management Board Report PNC Bank, NA June 30, 2006 Olson Research Associates, Inc. 10290 Old Columbia Road, Columbia, MD 21046 Phone: 888-657-6680 Web: http://www.olsonresearch.com