Jan-Mar Tel:
|
|
|
- Pamela Weaver
- 5 years ago
- Views:
Transcription


1 Jan-Mar ir@ferrovial.es Tel:
2 Disclaimer This document may contain statements that constitute forward looking statements about the Company. These statements are based on financial projections and estimates and their underlying assumptions, statements regarding plans, objectives and expectations, which refer to estimates regarding, among others, future growth in the different business lines and the global business, market share, financial results and other aspects of the activity and situation relating to the Company. Such forward looking statements, by its nature, are not guarantees of future performance and involve risks and uncertainties, and other important factors that could cause actual developments or results to differ from those expressed in these forward looking statements. Analysts and investors, and any other person or entity that may need to take decisions, or prepare or release opinions about the securities issued by the Company, are cautioned not to place undue reliance on those forward looking statements which speak only as of the date of this communication. They are all encouraged to consult the Company s communications and periodic filings made with the relevant securities markets regulators and, in particular, with the Spanish Securities Markets Regulator. Note on accounting changes: On 26 October 2011 Ferrovial sold 5.88% of FGP Topco, the holding company of the HAH group. This resulted in HAH being consolidated by the equity method from November 2011 onwards. Under NIIF 5, 2011 results from HAH are reported under the headline of Net income from discontinued operations for 10 months while 2 months are accounted under the Equity-accounted affiliates HAH results are accounted under Equity-accounted affiliates.
3 Agenda B u s i n e s s U n i t s F i n a n c i a l R e s u l t s C a s h F l o w D r i v e r s L o o k i n g A h e a d 3 ir@ferrovial.es Tel:


4 Vision A leading company in sustainable infrastructures and services with focus on operational excellence, innovation and cash generation Pillars Low level corporate debt Asset rotation to support growth Efficient asset allocation Operational Value generation 4 ir@ferrovial.es Tel:

5 Presence in all the Infrastructure value chain Synergies from combined capabilities Risk mitigation Solutions for complex projects ir@ferrovial.es Tel:
6 Ferrovial Business Overview Ex Infrastructure Projects Infrastructure Projects Services Construction Toll Roads Airports Leading provider of infrastructure services Infrastructure management and maintenance Urban services and waste management 3.0 bn Revenues bn EBITDA 2012 One of the main construction groups in Europe Civil engineering, industrial construction and water treatment 4.3 bn Revenues bn EBITDA 2012 Leading sponsor of toll roads infrastructure development worldwide Key developer of 407 ETR Design, build, finance and operation Leading European private airport operator Ownership and operational management of key UK airports, including Heathrow Dividends received from projects in bn Dividends received from Toll roads 0.14 bn Dividends received from Airports Infrastructure projects financed on non recourse basis 6 ir@ferrovial.es Tel:
7 Highlights (2013 year to March) First corporate bond ( 500mn, 5 year, coupon 3.375%) FINANCIAL Higher dividends at HAH (+6%) and ETR (+14%) S&P upgrades FER corporate rating to BBB from BBB- BUILDING THE FUTURE Acquisition on Enterprise (UK) & Steel Ingenieria (Chile) Completion of Stansted disposal New concession award in Texas (NTE 3A-3B, US$ 1.4bn) OPERATIONAL GROWTH 21bn backlog (Services & Construction) Record passenger numbers & passenger satisfaction at Heathrow NET CASH POSITION Ex-infra project Net cash position 1bn / Ample liquidity 3.3bn (cash + undrawn facilities) No meaningful maturities till ir@ferrovial.es Tel:
8 Main figures (2013 year to March) million % Change* R e v e n u e E B I T D A N e t I n c o m e 1, % -6.2% e x i n f r a p r o j e c t s N e t c a s h p o s i t i on 1,047 C o n s t r u c t i o n b a c k l o g S e r v i c e s b a c k l o g 8,538 12, % -1.9% * Excluding forex impact & perimeter changes. 8 ir@ferrovial.es Tel:

9 2013 Update - First bond issuance Size 500 mn Maturity 2018 Spread +240 bps Diversification from bank debt to capital markets 9 ir@ferrovial.es Tel:


10 2013 Update Enterprise acquisition (i) Enterprise: one of the UK's leading providers of services to utilities and the public sector Efficient Execution Entry into Utilities services Cost synergies Service enhancement through Amey s asset management skills Firm value GBP 385 mn Balanced portfolio of activities Scale and geographic coverage in UK Synergies Cost reduction 28m p.a. Asset Management contribution 11m p.a. Market Growth Utilities 5-7% Local Government 3-5% Value Creation IRR c.15% Capabilities to be exported to other countries 10 ir@ferrovial.es Tel:


11 2013 Update Enterprise acquisition (ii) FM 20% Environm. 1% Consulting 19% Roads & Rail 60% Roads 12% FM 17% Environm. 23% Utilities 48% Consult. 10% Environm. 11% FM 18% Utilities 22% Roads & Rail 39% 2012 data Major Player in the UK 1.2bn 13.7% 95.9m 7.9% 5.9bn Revenues CAGR EBITDA EBITDA Margin Order Book 1.1bn 4.6% 59.9m 5.4% 2.3bn 2.3bn 9.1% 155.8m 6.7% 8.5m Capex 18.6m 27.1m 8.2bn Note: EnterpriseMouchel JV not included. Defence JVs consolidated proportionally. Breakdown of Enterprise activities: FM includes Defence and Social Housing 11 Tel:
12 Agenda O v e r v i e w F i n a n c i a l R e s u l t s C a s h F l o w D r i v e r s L o o k i n g A h e a d 12 ir@ferrovial.es Tel:

13 Toll roads million Revenues 97 10% EBITDA 59-26% EBITDA % 61.0% 1Q13 % L-f-L Traffic recovery in US, weak in Europe 407ETR EBITDA + 7% Dividends + 14% 1Q13 % L-f-L Traffic EBITDA Lower traffic due to leap year effect and Easter Holidays Autema 1-13% -51% Chicago Skyway +2.9% +18% Ausol -19% -26% New concession award NTE 3A-3B, US$ 1,4bn, 48 years after construction (2018) ETR (VKT) -1.5% +7% Indiana Toll Road % -1.7% 1 Financial asset 2 Equity method 13 ir@ferrovial.es Tel:
 and RoW 51% Spain 48% RoW 58% Spain 42% Steel Ingenieria (Chile) 14 E-mail: ir@ferrovial.")
14 Services million 1Q 13 % L-f-L UK Spain Revenues 710-2% EBITDA 71 +3% EBITDA % 10% +50 bps Backlog 12, % -3% -4% - 1% Revenues EBITDA BACKLOG L-f-L -3% +6% 0% Geographical breakdown Resilient performance in a difficult Revenues Backlog economic context Acquisition on Enterprise (UK) and RoW 51% Spain 48% RoW 58% Spain 42% Steel Ingenieria (Chile) 14 ir@ferrovial.es Tel:
15 Construction million 1Q13 % L-f-L Budimex Webber Spain &RoW Revenues 820-6% EBIT % EBIT % 5.9% +50 bps Backlog 8,538-3% Revenues -22% +36% -8% EBIT -48% +47% +26% Backlog -3% 0% -3% Geographical breakdown Domestic Backlog Residential 2% Work breakdown Industrial & other 19% Growth in Texas partially offset declines in Poland and Spain International backlog 70% International 79% NTE3A-3B (US$1,4bn) not yet in backlog Civil works 15 ir@ferrovial.es Tel:
16 HAH (Equity method, FERROVIAL stake 33.65%) 100% GBP million 1Q13 % L-f-L Revenues % EBITDA % Second consecutive year of record Heathrow traffic for Q1 EBITDA % 43.6% +136 bps NET DEBT 11,963 Traffic (PAX Mn) 1Q13 % Heathrow % Terminal 5 voted world s best terminal Dividends up by 6.7% from HAH Double digit EBITDA growth Debt reduced due to Stansted disposal Shareholders 33.65% 20.00% 13.29% 11.88% 10.0% 11.18% Ferrovial Qatar Brittania GIC CIC Alinda 16 ir@ferrovial.es Tel:


17 HEATHROW Operating improvement Departures punctuality 80% Missed bags per 1,000 passengers 40 63% % passengers rating Heathrow Excellent or Very good Overall satisfaction with Heathrow ASQ trend Q % 48% Heathrow EU average Top EU Quartile 17 ir@ferrovial.es Tel:
18 Agenda O v e r v i e w B u s i n e s s U n i t s C a s h F l o w D r i v e r s L o o k i n g A h e a d 18 ir@ferrovial.es Tel:
 130 20 (15) 13 148 (35) (12) VAR.")
 Included in EBIT at the statutory accounts 19 E-mail: ir@ferrovial.")
19 Profit & Loss ( mn) Net Revenue EBITDA Depreciations EBIT Disposals & impairments (2) Net Financial Result Equity accounted EBT Taxes Minorities TOTAL 1, (51) (15) (35) (12) VAR. L-f-L (1) -2% -6% -10% NET PROFIT (1): Like-for-Like: Excluding forex impact, perimeter variations and fair value adjustments (2) Included in EBIT at the statutory accounts 19 ir@ferrovial.es Tel:
 2006 2007 2008 2009 2010 2011 2012 1Q13 P R O J E C T S Debt allocated at project level")

20 Debt reduction and simplification E X I N F R A P R O J E C T S Net debt evolution ex-infra projects NET CASH 1,047mn ,172 1,547 1,987 3,064 Net debt ( mn) Q13 P R O J E C T S Debt allocated at project level NET DEBT 6,802mn Projects under development not generating EBITDA mn Net debt NTE 463 LBJ 704 TOLL ROADS* Debt 6,238mn TOTAL 1,177 17% Of Toll roads net debt * 1.110mn related to R4 & OLR, both filed for creditor protection 20 ir@ferrovial.es Tel:
 Maturity Jan 2018 501 59 14 18 11 5 2013 2014")

21 Financial position (ex-infra projects) million maturities mn bond issuance (Jan 13) Maturity Jan >2018 Liquidity position 975 2,348 3,323 Total cash Undrawn lines Total liquidity 21 ir@ferrovial.es Tel:


22 Shareholder remuneration Dividend 2012 (Euros/share) Interim 1.00 Complementary 0.25 TOTAL Tel:


23 Agenda O v e r v i e w B u s i n e s s U n i t s F i n a n c i a l R e s u l t s L o o k i n g A h e a d 23 ir@ferrovial.es Tel:
 EBITDA (CAD million) 353 608 CAD3.0 bn CAD 3.")
24 High Quality Infrastructure Assets Resilience through the Crisis Capital markets access Dividends EBITDA (GBP mn) 529 1,103 GBP7.0 bn issued since (GBP M) EBITDA (CAD million) CAD3.0 bn CAD 3.0 billion issued issued since since (CAD M) 24 Tel:

 56% 44%")

25 Strong Backlog (Construction & Services) Backlog at Record levels Highest ever International Contribution % Construction 70% 30% 14.7 Domestic Services International ( bn) 56% 44% International 38% 62% Domestic International Strong backlog of 21.5 bn as of 2012 (35 months of activity) 25 ir@ferrovial.es Tel:
 Construction Services Strong cash flow generation from")
26 Solid Cash Flow Generation Ex - Infrastructure Projects (operating cash flow) Infrastructure Projects (dividends) Swissport (sold in 2011) Construction Services Strong cash flow generation from construction and services activities Cash flow upstream from infrastructure projects Resilient performance through the crisis 26 ir@ferrovial.es Tel:

27 Agenda O v e r v i e w B u s i n e s s U n i t s F i n a n c i a l R e s u l t s C a s h F l o w D r i v e r s 27 ir@ferrovial.es Tel:


28 Looking ahead C O N S T R U C T I O N T O L L R O A D S S E R V I C E S A I R P O R T S Margin vs. growth Strong backlog Selective growth in existing & new markets Higher dividends from 407 & HAH Attractive pipeline of projects Co-investment with financial partners Strong financial discipline 28 ir@ferrovial.es Tel:

29 29 Tel: Appendix
30 Appendix 1 Q R e s u l t s I n t r o d u c t i o n t o E T R T o l l r o a d M a n a g e d L a n e s T o l l r o a d s E n t e r p r i s e a c q u i s i t i o n F u l l y e a r r e s u l t s 30 ir@ferrovial.es Tel:
31 1Q 2013 results EUR MN MAR 13 MAR 12 Var% L-f-L% MAR 13 MAR 12 VAR.% L-f-L% Revenues EBITDA EBITDA margin 1, % 1, % -3.8% -5.9% -1.8% -6.2% Construction Toll Roads Services Others Total , , n.s Period depreciation EBIT EBIT margin Disposals & Impairments Financial results % % % -9.5% Construction Toll Roads Services Others Total MAR MAR VAR.% n.s L-f-L% Equity-accounted affiliates EBT MAR 13 DIC 12 VAR% Corporate income tax Construction backlog Services backlog 8,538 12,542 8,699 12, CONSOLIDATED NET INCOME Discontinued operations Minorities NET INCOME ATTRIBUTED Traffic evolution ETR-407 (VKT) Chicago Skyway (ADT) Indiana Toll Road (ADT) Autema (ADT) Ausol I (ADT) Ausol II (ADT) Heathrow (million passengers) MAR ,920 34,298 22,629 14,603 9,207 11, MAR ,432 35,320 22,066 16,723 11,456 13, VAR% ir@ferrovial.es Tel:
32 Appendix 1 Q R e s u l t s I n t r o d u c t i o n t o E T R T o l l r o a d M a n a g e d L a n e s T o l l r o a d s E n t e r p r i s e a c q u i s i t i o n F u l l y e a r r e s u l t s 32 ir@ferrovial.es Tel:


33 407 ETR Would you buy this company? Figures in $CAN million S h a r e h o l d e r ' s f u n d N e t d e b t , : 27x Debt/Ebitda ,262 5,219 Accounting losses High debt 33 ir@ferrovial.es Tel:
 407 ETR V a l u a t i o n ( 1 0 0 % ) Initial equity investment")


34 407 ETR Ferrovial bought this company Figures in million C a s h g e n e r a t i o n ( ) 407 ETR V a l u a t i o n ( % ) Initial equity investment (62%) (326mn) 100% pay-back 7,575 Dividends (00-12) 834mn 10% disposal 640mn first 10 years 14x NET CASH IN 1,474mn Valuation x * M a t u r i t y years to maturity Strong dividend flow Equity valuation sharp increase * December 12 analysts consensus 34 ir@ferrovial.es Tel:


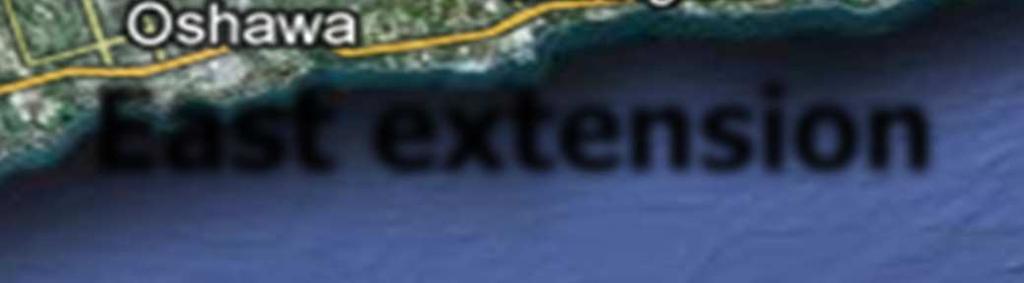


35 407 ETR Location Area of expansion 407 East extension High density population area Ring road of Toronto 108 km Tel:
36 407 ETR All Electronic Roadside Tolling System 36 Tel:
 TRAFFIC Alternatives routes are highly congested TOLL RATE HIGH FLEXIBILITY Including segment, direction, time of the day NON-STOP TOLL FACILITY Fully")
37 Fast Safe Reliable 407 ETR LOCATION Greater Toronto Area 23% of Canada population HIGH HOUSEHOLD INCOME 46% higher than Canada average SPEED Alternatives routes 40kph vs 100kph at 407 NO REGULATORY REVIEWS During concession life (99 years) TRAFFIC Alternatives routes are highly congested TOLL RATE HIGH FLEXIBILITY Including segment, direction, time of the day NON-STOP TOLL FACILITY Fully electronic with interchanges every 3km FAST Reliable travel times 37 Tel:
38 407 ETR Financial overview ($CAD million) Revenues Capital Expenditure CAGR: 8.3% years to maturity OPEX Dividends 104 CAGR: 2.8% % pay-back in first 10 years EBITDA CAGR: 9.8% EBITDA % 608 Free-tariff revision 27 Net Debt / EBITDA X % 77% 79% 76% 80% 82% 8% CAGR 02-12* * Tariff increase for light Vehicles in Peak hours regular zone (%) ir@ferrovial.es Tel:
39 407 ETR Recurrent presence in the bond market Extending maturities at historically low cost CAD 2,950mn issued since ,49% 3,58% Maturity 40 years ,58% 1,70% Spread 1,56% 1,60% Yearly average maturity: Only 3% of total debt ir@ferrovial.es Tel:
40 Appendix 1 Q R e s u l t s I n t r o d u c t i o n t o E T R T o l l r o a d M a n a g e d L a n e s T o l l r o a d s E n t e r p r i s e a c q u i s i t i o n F u l l y e a r r e s u l t s 40 ir@ferrovial.es Tel:
41 Managed Lanes New assets landmark Express Tollway within an Existing Highway Free Lanes Tolled Lanes Speed >50mph Free Lanes A solution to congestion on existing urban corridors by means of Active management of newly added capacity through tolling 41 ir@ferrovial.es Tel:
42 Managed Lanes Level of demand NTE (untolled) 407ETR (tolled) Peak period Time of the day Westbound Eastbound Time of the day 42 Tel:
43 Managed Lanes Travel time reliability (NTE) Based on NTE data ML will provide users a reliable and certain travel time 7 miles Travel Time (Minutes) min Distance (miles) (*) Peak period observations For a 7 mile trip, a user can save up to 30-40min in rush hour if using the ML (NTE Eastbound lanes) 43 ir@ferrovial.es Tel:
 with a dynamic tolling regime (every 5 minutes) to maintain at all times a minimum speed of 50 mph Heavy congested")
44 Managed Lanes Lyndon B Johnson KEY CHARACTERISTICS DESCRIPTION: IH 635 (Dallas County), the most populous county in Texas 108Km Electronic toll LENGTH: CONCESSION PERIOD: 13 mile section of the IH 635 and IH 35E 52 years TARIFF POLICY: Open Road Tolling System (no toll booths) with a dynamic tolling regime (every 5 minutes) to maintain at all times a minimum speed of 50 mph Heavy congested area, almost cars per day No toll-booths, fully electronic free flow tolling system Tollway within a freeway: Motorists will be provided with a choice of driving in non-tolled GP lanes or paying a toll to bypass such GP lanes Tolls setting to ensure minimum speed on new lanes 51% 42% 7% CINTRA SHAREHOLDERS STRUCTURE MERIDIAM FINANCIAL STRUCTURE DALLAS FIRE&POLICE PENSION SCHEME As demand grows and capacity becomes scarce, 25% 54% 20% pricing power increases EQUITY DEBT PUBLIC FUNDS Physically separated from the GP lanes with controlled access 44 ir@ferrovial.es Tel:
 CONCESSION PERIOD: 52 years TARIFF POLICY: Open Road Tolling System (no toll booths) with a dynamic tolling regime (every 5 minutes) to maintain at all times a minimum speed of 50 mph")
45 Managed Lanes North Tarrant Express KEY CHARACTERISTICS DESCRIPTION: Dallas-Fort Worth Metroplex, Major thoroughfares between Fort Worth and DFW Airport LENGTH: 13 mile section (IH 820 & SH 183 in Tarrant County) CONCESSION PERIOD: 52 years TARIFF POLICY: Open Road Tolling System (no toll booths) with a dynamic tolling regime (every 5 minutes) to maintain at all times a minimum speed of 50 mph Heavy congested area, almost cars per day No toll-booths, fully electronic free flow tolling system Tollway within a freeway: Motorists will be provided with a choice of driving in non-tolled GP lanes or paying a toll to bypass such GP lanes Tolls setting to ensure minimum speed on new lanes 57% 33% 10% CINTRA SHAREHOLDERS STRUCTURE MERIDIAM FINANCIAL STRUCTURE DALLAS FIRE&POLICE PENSION SCHEME As demand grows and capacity becomes scarce, 21% 52% 27% pricing power increases EQUITY DEBT PUBLIC FUNDS Physically separated from the GP lanes with controlled access 45 ir@ferrovial.es Tel:
 Meridiam: 282 m (42%) DPFPS: 44 m (7%) 54% Total Debt: 1.")

46 Managed Lanes Financial Overview Financial details Financial details Total Investment: 2.05 bn Private Equity: 427 m Cintra: 243 m (57%) Meridiam: 141 m (33%) DPFPS: 43 m (10%) Total Debt: 1.05 bn PABs: TIFIA: 21% 52% 27% 400 m 650 m Public Funds: 537 m Total Investment: 2.7 bn 25% Private Equity: 665 m Cintra: 339 m (51%) Meridiam: 282 m (42%) DPFPS: 44 m (7%) 54% Total Debt: 1.47 bn PABs: 615 m TIFIA: 850 m 20% Public Funds: 496 m First combination of TIFIA and tax exempt PABs. First un-wrapped bond issuance for a toll road. First time TIFIA allowed additional debt to be raised beyond its approved federal subsidy cap. First time that a U.S.-based pension fund made a direct investment in a highway concession. First privately-financed road development project of its kind to reach financial close in Texas third big recent road project to reach financial close since Figures in US Dollars 46 ir@ferrovial.es Tel:
47 Appendix 1 Q R e s u l t s I n t r o d u c t i o n t o E T R T o l l r o a d M a n a g e d L a n e s T o l l r o a d s E n t e r p r i s e a c q u i s i t i o n F u l l y e a r r e s u l t s 47 ir@ferrovial.es Tel:
48 Enterprise acquisition Scope Acquisition 100% of Enterprise 1) Revenue: 1.1 billion; EBITDA: 60 million; employees: 9,600 (2012) 1) Acquirer Ferrovial Services Integration of Enterprise into Amey, Ferrovial Services subsidiary in the UK Price Firm value: 385 million Financing Use of Ferrovial Services existing cash balance Other Completion subject to European Commission clearance Note: EnterpriseMouchel JV not included. Defence JVs consolidated proportionally 48 Tel:


49 Amey+Enterprise Solid Foundations for Profitable Growth 2012 data Amey + Enterprise Revenue Growth Revenues CAGR Order Book 1.2bn 13.7% 5.9bn 1.1bn 4.6% 2.3bn 2.3bn 9.1% 8.2bn Pipeline 8bn 12bn 19.5bn Operational Efficiency EBITDA EBITDA Margin 95.9m 7.9% 59.9m 5.4% 155.8m 6.7% Capex 8.5m 18.6m 27.1m Note: EnterpriseMouchel JV not included. Defence JVs consolidated proportionally 49 ir@ferrovial.es Tel:
50 Enterprise - Major UK Services Provider 2012 Revenues: 1.1 billion Wide geographical coverage Water 224 Utilities & Defence Power Gas Defence 111 Environment 251 Government Services Local Roads Social Housing & FM c.20 utilities c.50 councils Note: Enterprise Mouchel JV not included. Defence JVs consolidated proportionally 50 ir@ferrovial.es Tel:
51 Strategic Rationale 1 Entry into Utilities services Cost synergies Service enhancement through Amey s asset management skills Balanced portfolio of activities Leading UK services provider with broad capabilities, diverse markets and comprehensive geographical coverage 5 Scale and geographic coverage in UK 51 ir@ferrovial.es Tel:


52 Diverse and Balanced Portfolio Revenue 1.2bn Revenue 1.1bn Major Player in the UK Revenue 2.3bn 2012 data Consulting 19% FM 20% Environm. 1% Roads & Rail 60% Roads 12% FM 17% Environm. 23% Utilities 48% Consult. 10% Environm. 11% FM 18% Utilities 22% Roads & Rail 39% Note: EnterpriseMouchel JV not included. Defence JVs consolidated proportionally. Breakdown of Enterprise activities: FM includes Defence and Social Housing 52 Tel:


53 High Potential of Value Creation Synergies Cost reduction 28m pa Asset Management contribution 11m pa Market Growth Utilities 5-7% Local Government 3-5% Value Creation IRR c.15% Efficient Execution Rigorous and systematic approach Ferrovial Services proven track record Capabilities to be exported to other countries 53 Tel:
54 Platform for Growth in Attractive UK Markets Market size CAGR E Growth drivers Enterprise customer base (examples) Entry to Utilities market 19bn 5-7% Focus on maintenance spend in new regulatory cycles Asset management approach Outsourcing Severn Trent United Utilities Western Power Smart infrastructure Acceleration of growth in Local Government 14bn 3-5% 1) Outsourcing Service Integration Development of new treatment capacity Kent Staffordshire Liverpool 1) Includes Environmental Services and Local Roads Source: UK Department for Communities and Local Government, UK Department for Transport, market reports, companies, Ofwat, Ferrovial Services analysis 54 Tel:


55 40m Recurring Synergies from 2015 c. 40m recurring synergies in 2015 Systematic approach to integration 39 Focus on key cost and revenue drivers 31 Additional revenue 11 Procurement and direct costs Central and divisional overheads Integrated sale of asset management and consulting services 14 Cost reduction 28 Integration Plan implemented by a Project Office with dedicated resources Assessment and retaining of Enterprise s talent and best operational practices Estimated one-off investment c. 40m ir@ferrovial.es Tel:
56 Appendix 1 Q R e s u l t s I n t r o d u c t i o n t o E T R T o l l r o a d M a n a g e d L a n e s T o l l r o a d s E n t e r p r i s e a c q u i s i t i o n F u l l y e a r r e s u l t s 56 ir@ferrovial.es Tel:
57 FY 2012 results EUR MN Revenues EBITDA DEC 12 7, DEC 11 7, Var% +3.2% +13.4% L-f-L% +0.9% +11.2% Construction Toll Roads Services Others Total DEC 12 DEC 11 VAR.-% L-f-L% 4, , , , , , n.s EBITDA margin 12.1% 11.0% Period depreciation EBIT EBIT margin Disposals & Impairments % % % +10.6% Construction Toll Roads Services Others Total DEC DEC VAR.% n.s L-f-L% Financial results % Equity-accounted affiliates EBT Corporate income tax Construction backlog Services backlog DEC 12 8,699 12,784 DEC 11 9,997 12,425 VAR% CONSOLIDATED NET INCOME Discontinued operations Minorities NET INCOME ATTRIBUTED ,242.5 Traffic evolution ETR-407 (VKT) Chicago Skyway (ADT) Indiana Toll Road (ADT) Autema (ADT) Ausol I (ADT) Ausol II (ADT) Heathrow (million passengers) DEC 12 2,340,004 42,228 27,459 15,056 12,537 14, DEC 11 2,325,517 42,066 27,142 19,114 14,254 15, VAR% ir@ferrovial.es Tel:
 1,671Mn 29% 19% Services 37% 34% Toll Roads Construction Airports 33% 19% 29% 64% Spain 16% UK 12% US 8% RoW 34% Spain")
58 Diversified portfolio Ex Infrastructure Projects Infrastructure Projects Services Construction Toll Roads Airports Non Capital Intensive PROFIT GENERATION CASH GENERATION Capital Intensive LONG DURATION LONG TERM VALUE Fully consolidated Method 927Mn EBITDA Proportional (1) 1,671Mn 29% 19% Services 37% 34% Toll Roads Construction Airports 33% 19% 29% 64% Spain 16% UK 12% US 8% RoW 34% Spain 42% UK 21% US 2% RoW (1) Proportional: All EBITDA figures are aggregated in a proportional basis to the Ferrovial equity stake in each company or project ir@ferrovial.es Tel:

59 What have we done in 2012? Operational Growth (Tariffs) Heathrow +12.7% 407ETR +8% New Contracts 407ETR extension Sheffield maintenance US 406 Virginia Assets rotation 16.34% HAH Stansted airport Edinburgh airport X16.0 EV/EBITDA X16.7 EV/EBITDA Balance Sheet BAA Initial dividend 407ETR dividend LT bond issuance 59 Tel:
60 Toll roads million Revenues 381-3% EBITDA 272-5% EBITDA % 71.2% 2012 % L-f-L 220mn dividends from projects (2011, 159mn) Traffic recovery in US, weak in Europe New projects awards ETR East Extension (Canada) CAD1,100 mn % 2012 Traffic EBITDA L-f-L Autema 1-21% +35% Chicago Skyway +0.4% +5% Ausol -11% -9% A66 (Spain) 192 mn Pipeline Focus on the US ETR % +10% Indiana Toll Road % +4% New office in Australia & Colombia Selective monitoring of emerging markets 1 Financial asset 2 Equity method 60 ir@ferrovial.es Tel:
 Traffic (+0.")
61 407ETR (Equity method, FERROVIAL stake: 43%) CAD million Revenues 2012 % L-f-L % EBITDA % EBITDA % 82.9% +90bps Net debt 5,219 +8% Resilient performance Sharp increase in dividend EBITDA growth (+10%) Traffic (+0.6%) Opex optimization (+3,8%) Dividend (CAD million) EBITDA (CAD million) Tariff growth Long term bond issuances 30 years / CAD400mn / 4.19% 40 years / CAD200mn / 3.98% No relevant maturities until ir@ferrovial.es Tel:
62 Services million 2012 % L-f-L UK Spain Revenues 2,951 +1% EBITDA 314-2% EBITDA % 10.6% -50 bps Backlog 12, % +8% -3% +12% Revenues EBITDA BACKLOG L-f-L -5% -1% -10% Geographical breakdown Strong cash flow generation 491mn Revenues Backlog (2011, 164mn) Resilient performance in a difficult UK 51% Spain 49% UK 56% Spain 44% economic context Record backlog at year end 62 ir@ferrovial.es Tel:

63 Construction million 2012 % L-f-L Budimex ex_pni* Webber Spain &RoW Revenues 4,326 0% EBIT % EBIT % 6.9% +190 bps Backlog 8,699-14% Revenues +4% +28% -9% EBIT +8% +41% +63% Backlog -27% -21% -3% Geographical breakdown Domestic Backlog Residential 3% Work breakdown Industrial & other 18% Cash flow generation ( 100mn) despite declining Spanish sales International growth offsets Spanish performance International 79% Civil works International backlog 70% of total *PNI was excluded from Budimex s consolidation perimeter in November 2012, after filling for creditor protection. PNI impact: EBIT - 35mn 63 ir@ferrovial.es Tel:
 Second consecutive year of record Heathrow traffic and passenger satisfaction Double digit EBITDA")
64 HAH (Equity method, FERROVIAL stake 33.65%) 100% GBP million 2012 Revenues 2,646 +8% EBITDA 1, % EBITDA % 51.2% +125 bps NET DEBT 12,931 % L-f-L 143mn dividends from HAH HAH 100% 2012 dividend (GBP 240mn) Second consecutive year of record Heathrow traffic and passenger satisfaction Double digit EBITDA growth Traffic (PAX Mn) 2012 % Capital structure strengthened GBP3.0bn issued in 2012 Heathrow % Scotland % UK airports % Extending maturities, markets & currencies Successful divestments above expectations 100% HAH implied equity value GBP4,500mn Shareholders 33.65% 20.00% 13.29% 11.88% 10.0% 11.18% Stansted Edinburgh GBP1.5bn (x16.0 EV/EBITDA) GBP807mn (x16.7 EV/EBITDA) Ferrovial Qatar Brittania GIC CIC Alinda 64 ir@ferrovial.es Tel:
65 HEATHROW Financial improvement Financing transformed Resilient performance * Dec 2011 Dec 2012 EBITDA (GBP million) 1,103 Average life of debt 9.8 years 10.1 years 529 Debt due within 3 years 3.7 billion 1.8 billion * Heathrow airport, excluding Heathrow express Bond proportion of total debt 77% 94% Over 3 billion in bond issuance in billion undrawn revolving credit facilities Liquidity horizon *Including impact of Stansted disposal proceeds 20 months 30 months* HAH can meet capital investment, debt maturities, interest and distributions till mid ir@ferrovial.es Tel:

 Tlf:")


66 INVESTOR RELATIONS DEPARTMENT C/ Príncipe de Vergara, MADRID (Spain) Tlf: Fax: website: Tel:
Jan-Jun Tel:
 Jan-Jun 13 1 E-mail: ir@ferrovial.es Tel: +34 91 586 27 30 Disclaimer This document may contain statements that constitute forward looking statements about the Company. These statements are based on financial
Global Infrastructure
 Global Infrastructure Disclaimer This document may contain statements that constitute forward looking statements about the Company. These statements are based on financial projections and estimates and
ferrovial 2013 Full year results Investing for growth 1 Tel:
 ferrovial 2013 Full year results Investing for growth 1 E-mail: ir@ferrovial.es Tel: +34 91 586 27 30 Disclaimer This document may contain statements that constitute forward looking statements about the
Ferrovial 1Q 2015 Investing for Growth
 Ferrovial Investing for Growth 1 1Q 2015 Human Resources Environment FY2014 figures 70% MALE 69,088 Workforce 30% FEMALE 43.3 AVERAGE AGE 43.8 8.9 YEARS OF SENIORITY 9.5 77% PERMANENT CONTRACT 81% 85%
Ferrovial 1H 2015 Investing for Growth
 Ferrovial Investing for Growth 1H 2015 1 Human Resources Environment FY2014 figures 70% MALE 69,088 Workforce 30% FEMALE 43.3 AVERAGE AGE 43.8 8.9 YEARS OF SENIORITY 9.5 77% PERMANENT CONTRACT 81% 85%
-39 Reduction of greenhouse gas emissions Of electricity consumed by ferrovial came from renewable sources 100 in the case of Amey
 Ferrovial Investing for Growth 1 Human Resources Environment FY2014 figures 70% MALE 69,088 Workforce 30% FEMALE 43.3 AVERAGE AGE 43.8 8.9 YEARS OF SENIORITY 9.5 77% PERMANENT CONTRACT 81% 85% MANAGEMENT
ferrovial Investing for Growth FY 2015 Results
 ferrovial Investing for Growth FY 2015 Results Disclaimer This document may contain statements that constitute forward looking statements about the Company. These statements are based on financial projections
Ferrovial 9M 2015 Investing for Growth
 Ferrovial Investing for Growth 9M 2015 1 Human Resources Environment FY2014 figures 70% MALE 69,088 Workforce 30% FEMALE 43.3 AVERAGE AGE 43.8 8.9 YEARS OF SENIORITY 9.5 77% PERMANENT CONTRACT 81% 85%
ferrovial FY 2017 Results 28 February 2018
 ferrovial FY 2017 Results 28 February 2018 Disclaimer This document may contain statements that constitute forward looking statements about the Company. These statements are based on financial projections
ferrovial FY2018 Results 28 February 2019
 ferrovial FY2018 Results 28 February 2019 Disclaimer This document may contain statements that constitute forward looking statements about the Company. These statements are based on financial projections
full year results
 2010 - full year results 2 0 1 0 H i g h l i g h t s B u s i n e s s U n i t s F i n a n c i a l R e s u l t s L o o k i n g a h e a d F i n a l r e m a r k s 2 2010 - Highlights Strong Cash flow generation
G r o u p o p e r a t i o n s. C u r r e n t m a r k e t s c e n a r i o
 G r o u p o p e r a t i o n s C u r r e n t m a r k e t s c e n a r i o An international INFRASTRUCTURE operator 25 Toll roads 2,900 kilometres operated 19 billion investment Present in 7 countries 90%
Madrid, 30 March 2012
 Madrid, 30 March 2012 Rafael del Pino Chairman Madrid, 30 March 2012 Santiago Ortiz Vaamonde Secretary of the Board of Directors Madrid, 30 March 2012 Agenda Agenda Approval of the 2011 financial statements
ferrovial Growing Infrastructure
 ferrovial Growing Infrastructure FY 2017 ferrovial App 1 Table of Contents Ferrovial overview 1. Overview 2. What are investors worried about? 3. Looking ahead 4. What makes Ferrovial different? Ferrovial
GENERAL OVERVIEW. RESULTS JANUARY DECEMBER 2016 Ferrovial, S.A. & Subsidiaries. 27 February 2017
 1 GENERAL OVERVIEW The company s results in 2016 were marked by the generation of ex-infrastructure operating cash flow totalling EUR995mn (before tax), the result of balanced contributions with higher
ALTERNATIVE PERFORMANCE MEASURES (APM) DECEMBER 2017
 DECEMBER 2017") APPENDIX A 1 ALTERNATIVE PERFORMANCE MEASURES (APM) DECEMBER 2017 T The company presents its results in accordance with generally accepted accounting standards (IFRS). Management also provides other financial
APPENDIX A 1 ALTERNATIVE PERFORMANCE MEASURES (APM) DECEMBER 2017 T The company presents its results in accordance with generally accepted accounting standards (IFRS). Management also provides other financial
ferrovial GENERAL OVERVIEW RESULTS Ferrovial, S.A. & Subsidiaries JANUARY - SEPTEMBER October 2017
 RESULTS JANUARY - SEPTEMBER 2017 Ferrovial, S.A. & Subsidiaries 26 October 2017 GENERAL OVERVIEW In the results for the first nine months of 2017, the same trend as in previous quarters has prevailed:
ferrovial June 2017 Interim Management Report & Consolidated Financial Statements Ferrovial, S.A. & Subsidiaries
 INTERIM MANAGEMENT REPORT JUNE 2017. FERROVIAL, S.A. AND SUBSIDIARIES 1 June 2017 Interim Management Report & Consolidated Financial Statements ferrovial Ferrovial, S.A. & Subsidiaries Board of Directors
EBITDA = GROSS OPERATING PROFIT COMPARISON ("LIKE FOR LIKE GROWTH") FAIR VALUE ADJUSTMENTS FERROVIAL - RESULTS JANUARY SEPTEMBER
 FAIR VALUE ADJUSTMENTS FERROVIAL - RESULTS JANUARY SEPTEMBER") FERROVIAL - RESULTS JANUARY SEPTEMBER 2018 1 The company presents its results in accordance with generally accepted accounting practices (IFRS). In addition, Management provides in the Financial Report
FERROVIAL - RESULTS JANUARY SEPTEMBER 2018 1 The company presents its results in accordance with generally accepted accounting practices (IFRS). In addition, Management provides in the Financial Report
Public Hearing Tarrant County. April 14, 2009
 Public Hearing Tarrant County April 14, 2009 Public Hearing Agenda Welcome and Project Overview Ms. Maribel P. Chavez, P.E. District Engineer Texas Department of Transportation Fort Worth District 2 Public
OVERVIEW PRESENTATION. June 2016
 OVERVIEW PRESENTATION June 2016 Our Strategy Value Creation Who are we? Our story Abertis is the leading international group of toll-road operators. We manage thousands of kilometers of high quality, high
management report Management Report Ferrovial se consolida como el mayor gestor privado de infraestructuras de transporte del mundo.
 ferrovial management report management report Ferrovial se consolida como el mayor gestor privado de infraestructuras de transporte del mundo. Management Report 64 Businesses in 2010 96 Likely outlook
FRANCISCO REYNÉS Vice-Chairman & CEO
 FRANCISCO REYNÉS Vice-Chairman & CEO Vision of Abertis Today 2015 results Strategic Plan 2015-17: Follow-up Conclusions 2015 ADT +6.1% EBITDA ( Mn) 913 Comparable +8% Capex ( Mn) 87 ACHIEVEMENTS Improved
RESULTS PRESENTATION FY17 7 February 2018
 RESULTS PRESENTATION FY17 7 February 2018 Index 1 Strategic Plan 2015-2017 2 3 FY17 Results 4 Wrap-up Annexes 1 Strategic Plan 2015-2017 Basic Pillars Strategic Plan 2015-2017 (announced on 30/10/14) Our
Consolidated financial statements at 31 December 2012 Ferrovial S.A. and Subsidiaries
 Translation of consolidated financial statements originally issued in Spanish and prepared in accordance with the regulatory financial reporting framework applicable to the Group (see Notes 2 and 38).
2013 Results. February 2014
 2013 Results February 2014 Table of Contents Discussion Topics Page Section 1 2013 Highlights (CEO) 3 Section 2 2013 Results (CFO) 10 Section 3 2014 Outlook (CEO) 21 Section 4 2014 Guidance (CFO) 27 Section
OVERVIEW PRESENTATION DECEMBER 2016
 OVERVIEW PRESENTATION DECEMBER 2016 Our Strategy Value Creation Who are we? Our story Abertis is the leading international group of toll-road operators. We manage thousands of kilometers of high quality,
2014 Results. 18 February 2015 Madrid
 2014 Results 18 February 2015 Madrid Disclaimer/Notice to Recipients This presentation contains forward-looking statements and information relating to Abertis Infraestructuras, S.A. ( Abertis ) and its
Strategic Review Financial Highlights. Business opportunities. Results by business
 March 2004 Strategic Review 2003 Financial Highlights Business opportunities Results by business Conclusions A Construction & Services Market Reference # 1 in Spanish Construction # 1 in Industrial Services
OVERVIEW PRESENTATION OCTOBER 2016
 OVERVIEW PRESENTATION OCTOBER 2016 Our Strategy Value Creation Who are we? Our story Abertis is the leading international group of toll-road operators. We manage thousands of kilometers of high quality,
Ferrovial, S.A. and Subsidiaries consolidated financial statements. Board of Directors 23 February 2012
 Consolidated financial statements for 2011 and 2010 2011 consolidated financial statements Ferrovial, S.A. and Subsidiaries Board of Directors 23 February 2012 Ferrovial, S.A. Consolidated financial statements
Presentation to Investors. December 2013
 Presentation to Investors December 2013 Who we are Engineering contractor and greenfield developer Revenues 2012 > 38 bn Current Backlog 67 bn Civil Engineering Industrial Engineering Construction Environment
OVERVIEW PRESENTATION FY17 31 December
 OVERVIEW PRESENTATION FY17 31 December Index 01 Who are Who are Our story Abertis is the leading international group of toll-road operators. We manage thousands of kilometers of high quality, high capacity
PUBLIC PRIVATE PARTNERSHIPS Rationale and Motivation. November 2015 Nicolas Rubio US President, Cintra
 PUBLIC PRIVATE PARTNERSHIPS Rationale and Motivation November 2015 Nicolas Rubio US President, Cintra nrubio@cintra.us Agenda 1. The transportation infrastructure problem 2. Understanding the Private Sector
OVERVIEW PRESENTATION. September 9M RESULTS
 OVERVIEW PRESENTATION September 9M 2017 2016 RESULTS Index 01 Who are Who are Our story Abertis is the leading international group of toll-road operators. We manage thousands of kilometers of high quality,
The world s leading infrastructure developer. April 2012
 The world s leading infrastructure developer Investors Presentation Company profile, strategy and key financials April 2012 Grupo ACS The world s leading infrastructure developer Engineering contractor
Ferrovial, S.A. and Subsidiaries. Consolidated Financial Statements Board of Directors 22 February 2011
 Consolidated Financial Statements 2010 Ferrovial, S.A. and Subsidiaries Board of Directors 22 February 2011 Free translation of the Consolidated Financial Statements for 2010 and 2009 and explanatory notes
EARNINGS RELEASE FY April 2018
 EARNINGS RELEASE FY2017 6 April 2018 2 Key highlights BACK TO GROWTH Turnover up 18% YoY to 2,597 Mn, supported by all regions on a comparable basis EBITDA up 19% YoY to 403 Mn with margin increasing 100
Capital Markets Day. Strategic Plan Francesco Starace CEO & General Manager
 Capital Markets Day Strategic Plan 2019-21 Francesco Starace CEO & General Manager Agenda Francesco Starace (CEO & General Manager) Enel Today 2015-2018 Our Delivery 2019-2021 Our Vision & Positioning
Presentation of the Group
 The world s leading infrastructure developer Presentation of the Group Key figures & Global Strategy July 2012 Grupo ACS The world s leading infrastructure & concessions developer Engineering contractor
April 2015 A LEADING TECH COMPANY
 April 2015 A LEADING TECH COMPANY This presentation has been produced by Indra for the sole purpose expressed therein. Therefore, neither this presentation nor any of the information contained herein constitutes
Results Presentation 3Q November 14 th 2017
 Results Presentation 3Q 2017 November 14 th 2017 Executive Summary SUSTAINED TOP LINE GROWTH with improved operating efficiency +26% (AUD) top line growth in CIMIC Stable global operating margins Strong
PPP s Misconceptions NICOLAS RUBIO US PRESIDENT, CINTRA
 PPP s Misconceptions NICOLAS RUBIO US PRESIDENT, CINTRA 1. PPPs involve the "sale" of roads to private interests 10 Myths and Facts on The Reason Transportation Foundation, May 31, 2011 - By Leonard PPPs
Public Private Partnerships 101
 Public Private Partnerships 101 Tony Elkins, Commercial Director October 6, 2016 Cintra s LBJ Managed Lanes P3, Dallas, Texas The Ferrovial Group Development Over The Entire Infrastructure Lifecycle INFRASTRUCTURE
FY 2008 Results Presentation 27 th February 2009
 27 th February 2009 Disclaimer This document has been prepared by Acciona, S.A. ( Acciona or the Company ) exclusively for use during the presentation of financial results of the 2008 fiscal year. Therefore
2018 half-year results presentation. 15 August 2018
 2018 half-year results presentation 15 August 2018 Forward-looking statements This presentation may include certain forward-looking statements, beliefs or opinions, including statements with respect to
3Q Results Presentation November 15, 2016
 3Q 2016 Results Presentation November 15 th, 2016 Results Highlights 1 2 Solid results based on: Improved operating efficiency EBIT 1,119mn Reduction of financial expenses L-f-L (+50 bp) Net fin. expenses
Naturgy: Much More London, 28 th June 2018
 Naturgy: Much More 2018-2022 London, 28 th June 2018 Index and Content 1. Industry trends and our industrial model 2. Value creation pillars 3. Business units goals 4. Financing strategy 5. Commitment
Heathrow Airport. Bank of America Merrill Lynch High Yield and Loan Conference
 Airport Bank of America Merrill Lynch High Yield and Loan Conference June 2013 critical infrastructure for the global aviation industry is London s and the UK s only hub airport World s third busiest airport
1Q 2015 Results. May 8, 2015
 1Q 2015 Results May 8, 2015 Highlights of the period Good operating results: recurring EBITDA +4% Latam: confirmed positive trends, EBITDA +33% yoy and reorganization kicked -off Renewables: +0.2 GW capacity
FY 2015 consolidated results. March 23, 2016
 FY 2015 consolidated results March 23, 2016 Agenda Delivery on strategic plan Financial results Business analysis Closing remarks 1 Delivery on strategic plan Opening remarks Operational efficiency delivering
Agenda. 1. Highlights FY 2012 Results. 2. Operational Performance Priorities for Financials. 5. Conclusion
 1MARCH 2013 Legal Disclaimer Information in this presentation may involve guidance, expectations, beliefs, plans, intentions or strategies regarding the future. These forward-looking statements involve
Creating a Uniquely Global and Integrated Infrastructure Group. October 2017
 Creating a Uniquely Global and Integrated Infrastructure Group 1 October 2017 Agenda 1. Transaction Overview 2. Rationale for the Combination 3. Profile of the New HOCHTIEF 4. Key takeaways for ACS 2 Strategic
FY 2016 RESULTS. March 2 nd, 2017
 FY 2016 RESULTS March 2 nd, 2017 AGENDA Key messages & strategy execution Financial update 2017 outlook & conclusion FY2016 RESULTS 2 KEY MESSAGES & STRATEGY EXECUTION KEY MESSAGES 2016 results in line
COMISIÓN NACIONAL DEL MERCADO DE VALORES Paseo de la Castellana, Madrid. Madrid, 13 de mayo de Muy Sres. nuestros:
 COMISIÓN NACIONAL DEL MERCADO DE VALORES Paseo de la Castellana, 19 28046 Madrid Madrid, 13 de mayo de 2013 Muy Sres. nuestros: ACCIONA adjunta presentación en ingles que se seguirá en la multiconferencia
Fitter for the Future Strategic Update
 Fitter for the Future Strategic Update 2017-21 Chairman s remarks Global strategic overview Significant market opportunity Basarab Overpass in Bucharest, Romania Naples underground (Toledo Station), Italy
Investor Day April 2010 INVESTMENT STRATEGY. Mr. DAVID DIAZ Corporate Development Director
 Investor Day April 2010 INVESTMENT STRATEGY Mr. DAVID DIAZ Corporate Development Director abertis: Investment strategy 1. An overview of the infrastructure market 2. abertis strategy 3. A robust methodology
First Quarter 2018 Results (1Q18) April 26, 2018
 April 26, 2018") First Quarter 2018 Results () April 26, 2018 Agenda 1. Highlights and consolidated results 2. results by activity 3. Conclusions Appendices 1 1. Highlights and consolidated results Transformation pillars
First Quarter 2018 Results () April 26, 2018 Agenda 1. Highlights and consolidated results 2. results by activity 3. Conclusions Appendices 1 1. Highlights and consolidated results Transformation pillars
Results Presentation 1Q May 12 th 2017
 Results Presentation 1Q 2017 May 12 th 2017 Executive Summary OPERATING OUTPERFORMANCE 11% Sales & EBIT recovery in CIMIC & margins stability NET PROFIT GROWTH in the HIGH END TARGET 12.6% like-for-like*
GEK TERNA GROUP. Group presentation
 GEK TERNA GROUP Group presentation GEK TERNA Group: Business Divisions Business Divisions Energy Concessions Construction Real Estate Supplementary activities (Industrial Products, Quarries) 2 GEK TERNA
Texas' LBJ Freeway Managed Lanes P3
 Texas' LBJ Freeway Managed Lanes P3 28/07/2010 The I-635/LBJ Managed Lanes project in Texas marks a major milestone in the development of private sector investment in infrastructure, standing as the largest
2017 FY Consolidated Results
 2017 FY Consolidated Results March 12, 2018 2017 FY Consolidated Results / 1 2017: Strong performance delivery Results Ahead of Targets Succesful M&A activities Solid and Efficient Financial & Debt Structure
1H18 Key figures SALES 17,777 +2,2% +10,1% EBITDA 1, % +8.7% EBIT % +11.9% NET PROFIT % +13.3%
 Key figures Figures in million YoY Var. Like for Like Var. 1 SALES 17,777 +2,2% +10,1% EBITDA 1,248 +2.0% +8.7% EBIT 946 +5.1% +11.9% NET PROFIT 447 +7.4% +13.3% LTM Net Operating Cash Flow 1,605 +24.1%
Q Supplemental Information Quarter ended September 30
 Q3 2015 Supplemental Information Quarter ended NYSE: BIP TSX: BIP.UN CAUTIONARY STATEMENT REGARDING FORWARD-LOOKING STATEMENTS 1 This Supplemental Information contains forward-looking information within
Earnings Release 1H August 2015
 Earnings Release 1H2015 31 August 2015 Results overview Regional segments Final remarks PAG. 2 PAG. 12 PAG. 19 Angola SADC West East 1 Key highlights Turnover reached 379 Mn, with the SADC region accounting
THE OFFICE OF TRANSPORTATION PUBLIC PRIVATE PARTNERSHIPS ( OTP3 )
") THE OFFICE OF TRANSPORTATION PUBLIC PRIVATE PARTNERSHIPS ( OTP3 ) VIRGINIA DEPARTMENT OF TRANSPORTATION ( VDOT ) VIRGINIA DEPARTMENT OF RAIL AND PUBLIC TRANSPORTATION ( DRPT ) RESPONSE TO REQUEST FOR INFORMATION
THE OFFICE OF TRANSPORTATION PUBLIC PRIVATE PARTNERSHIPS ( OTP3 ) VIRGINIA DEPARTMENT OF TRANSPORTATION ( VDOT ) VIRGINIA DEPARTMENT OF RAIL AND PUBLIC TRANSPORTATION ( DRPT ) RESPONSE TO REQUEST FOR INFORMATION
Earnings Release First Half 2017
 Earnings Release First Half 2017 30 August 2017 Results overview Regional segments Final remarks PAGE 3 PAGE 16 PAGE 27 Europe Africa Latin America 2 Key highlights BACK TO GROWTH Turnover up 15% YoY to
1H / 2005 Results Data Conference. September 1 st, 2005
 1H / 2005 Results Data Conference September 1 st, 2005 1 Índex Executive Summary 1H/2005 Results Balance sheet at June 30 th, 2005 Business lines Conclussions 2 Executive Summary Good operating and financial
Capital Markets Day. Strategic Plan Alberto De Paoli CFO
 Capital Markets Day Strategic Plan 2019-21 Alberto De Paoli CFO Agenda Alberto De Paoli (CFO) Capital allocation 2019-21 Our Plan Business line highlights Financial management Risk management Earnings
2015 Investor day Strategic Plan New foundations for growth
 2015 Investor day 2015-19 Strategic Plan New foundations for growth March 19, 2015 2015 Investor day Agenda 2014 main developments Francesco Starace CEO FY 2014 results Alberto De Paoli CFO 2015-2019 strategic
2012 Results Outlook th February 2013
 2012 Results Outlook 2013-2015 www.enagas.es 20 th February 2013 Summary 1.- 2012 Results 2.- Strategic View 3.- Outlook 2013-2015 4.- 2013 Targets 5.- Conclusions 2 Key figures ( mill) Jan-Dic 2011 Jan-Dic
3. ANALYSIS BY SEGMENT
 3. ANALYSIS BY SEGMENT SOLUTIONS & Book-to-bill & 1,894 +9% 2,070 1.22x +5% 1.29x 1,811 +4% 1,881 1.05x +5% 1.10x have grown 4% versus the previous year, showing a strong growth in Transport & Traffic,
Enel Green Power 9M 2015 consolidated results
 Enel Green Power Rome November 13, 2015 Agenda Overview of recent events Analysis of results Closing remarks 1 Active portfolio management Exit from El Salvador Cash-in: 224 m Capital gain: 123 m Entry
Q Results. Organic growth accelerates further. May 2, 2017
 Q1 2017 Results Organic growth accelerates further May 2, 2017 Legal Disclaimer Information in this presentation may involve guidance, expectations, beliefs, plans, intentions or strategies regarding the
FOURTH QUARTER 2015 FINANCIAL RESULTS. Element Financial Corporation Q Earnings Call
 FOURTH QUARTER FINANCIAL RESULTS Certain information in this presentation is forward- looking and related to anticipated financial performance, events and strategies. When used in this context, words such
Part 1 Executing our strategy
 Entwurf 19.09.018 15h00 Part 1 Executing our strategy Klaus Rosenfeld Chief Executive Officer Capital Markets Day 018 Berlin Disclaimer This presentation contains forward-looking statements. The words
Agenda. Our Business Rock Solid. Performance in last 5 Years. Delivering Returns in CRH. CRH plc, AGM
 Agenda Our Business Rock Solid Performance in last 5 Years Delivering Returns in CRH CRH plc, AGM 2018 1 Why invest in Building Materials? Natural demand for construction products driven by: Population
FY16 Results Presentation
 Muskrat Falls Hydro Plant, Canada FY16 Results Presentation March 14, 2017 Agenda Warsaw subway Line 2, Poland 2016 Highlights Q4 & FY16 results Appendix 2 Fit for the Future our Strategy Plan Sustainable
Half Year Results. For six months ended 30 June 2014
 Half Year Results For six months ended 30 June 2014 30 July 2014 Cautionary statement This Review is intended to focus on matters which are relevant to the interests of shareholders in the Company. The
163,28,22 230,203,96 191,191,191 0,51,153 26,173, ,219, ,64, ,160,98
 1 Legal Disclaimer Information in this presentation may involve guidance, expectations, beliefs, plans, intentions or strategies regarding the future. These forward-looking statements involve risks and
A Global Building Materials Group
 A Global Building Materials Group 27.6bn Revenue 3.3bn EBITDA #2 Worldwide 32 Countries 85,000 People Fortune 500 Company Euro Stoxx 50 Company FTSE 100 Company CRH plc, May 2018 1 Why Invest in Building
Investor s day - October 4 th, Mr. Ángel García Altozano
 Investor s day - October 4 th, 2005 Mr. Ángel García Altozano Grupo ACS Index Introduction Summary of the UNF 22% Transaction An strategic investment aiming the value creation Grupo ACS Services Area A
FINANCIAL INFORMATION AS OF MARCH 31, 2017
 FINANCIAL INFORMATION AS OF MARCH 31, 2017 KEY MESSAGES & OPERATIONAL UPDATE KEY MESSAGES & OPERATIONAL UPDATE KEY MESSAGES Q1 in line with expectations Sound performance of growth engines Solid operational
Vattenfall Capital Markets Day 2009
 Vattenfall Capital Markets Day 2009 Presentation by: Dag Andresen First Senior Executive Vice President Group CFO Amsterdam, 23 September 2009 Contents Financial targets and outcome Nuon acquisition Actions
Sixth Investor Conference
 Sixth Investor Conference ASCENDING & DESCENDING Santiago Fernández Valbuena London, October 11 th 2007 2 Disclaimer This presentation contains statements that constitute forward looking statements in
Results Presentation th of February, 2014
 Results Presentation 2013 28 th of February, 2014 Executive Summary Consolidation of Global Leadership Good Operating Results Net Profit > 700 Financial structure reinforced HOCHTIEF Restructuring 2 ACS
COMPANY OVERVIEW. US$812mn. Largest Energy Generator in Chile 5,063MW 531 MW 100% 11 Years. US$2.2bn. BBB-/Baa3 66.7% of installed capacity
 INVESTOR DAY 2018 COMPANY OVERVIEW 5,063MW of installed capacity 531 MW Of fully funded capacity under construction US$812mn EBITDA LTM 1Q-2018 Largest Energy Generator in Chile 100% Of efficient generation
FY RESULTS. July 28, 2017
 FY 206-7 RESULTS July 28, 207 Agenda Highlights 2 Operational performance 3 Financial performance 4 Outlook 2 Delivering or over-delivering on all objectives REVENUES Financial outlook Actual performance
E.ON Debt Investor Update Call. Cleaner & better energy. Dr. Marcus Schenck, CFO May 21, 2012
 E.ON Debt Investor Update Call Cleaner & better energy Dr. Marcus Schenck, CFO May 21, 2012 Agenda Update on strategy Financial update 1 Key drivers of E.ON s transformation Five key drivers 1 Divest non-core
TRANSCRIPT January December 2018 Financial Results Conference Call
 Madrid, February 28th, 2019 17:00 Edited Transcript of the Ferrovial January-December 2018 Financial Results Conference Call. CORPORATE PARTICIPANTS Ricardo Jiménez Rafael del Pino Íñigo Meirás Ernesto
1Q18 Key figures SALES 8,671 +3,7% +14,7% EBIT % +16.9% NET PROFIT % +13.4% NET DEBT % BACKLOG 66,677-2,1% +10.
 Key figures Figures in million YoY Var. Like for Like Var. 1 SALES 8,671 +3,7% +14,7% EBIT 473 +7.9% +16.9% NET PROFIT 250 +7.4% +13.4% NET OPERATING CASH FLOW (2) LTM 1,603 +40.9% NET DEBT 359-78.8% BACKLOG
Financial Targets through 2022: Focus on Value Creation
 Financial Targets through 2022: Focus on Value Creation /////////// Capital Markets Day London, December 5, 208 Wolfgang Nickl CFO Bayer AG Disclaimer Cautionary Statements Regarding Forward-Looking Information
HY 2017 Results. Strong growth and cash generation. July 31, 2017
 HY 2017 Results Strong growth and cash generation July 31, 2017 Legal Disclaimer Information in this presentation may involve guidance, expectations, beliefs, plans, intentions or strategies regarding
Presented by: David Little Chairman, President & CEO. Kent Yee Senior Vice President & CFO NASDAQ: DXPE AUGUST 2017
 Presented by: David Little Chairman, President & CEO Kent Yee Senior Vice President & CFO Mac McConnell Senior Vice President & CAO NASDAQ: DXPE AUGUST 2017 FORWARD LOOKING STATEMENTS This presentation
SEPTEMBER 2018 DULLES CORRIDOR ENTERPRISE REPORT OF THE FINANCIAL ADVISORS
 SEPTEMBER 2018 DULLES CORRIDOR ENTERPRISE REPORT OF THE FINANCIAL ADVISORS The Airports Authority established the Dulles Corridor Enterprise (DCE) Fund to segregate the financial activity associated with
2 March Results
 2 March 2018 2017 Results Table of Contents 1. 2017 Financial Update 2. Getlink Transaction 3. Closing Remarks Appendix 2 Key 2017 Financial Figures m vs 2016 (2) EBITDA 3,762 (1) +6.1% GROUP NET INCOME
January December 2017 Financial Results Conference Call
 Madrid, February 28th, 2018 18:00 Edited Transcript of the Ferrovial January-December 2017 Financial Results Conference Call. CORPORATE PARTICIPANTS Rafael del Pino Ferrovial S.A. Chairman Iñigo Meirás
Business Update. USPP Conference Miami. Luis Damasceno Group CFO Michael Williams Group Finance Director & Treasurer January 2019
 Business Update USPP Conference Miami Luis Damasceno Group CFO Michael Williams Group Finance Director & Treasurer 23-25 January 2019 www.alsglobal.com IMPORTANT NOTICE AND DISCLAIMER This presentation
Schaeffler Group Mobility for tomorrow Klaus Rosenfeld Chief Executive Officer
 Schaeffler Group Mobility for tomorrow Klaus Rosenfeld Chief Executive Officer Capital Markets Day July 20 th, 2016 London Agenda 1 Overview 2 Our Strategy 3 Our Action Plan 4 Our Financial Ambitions 5
Investor Presentation. December 2017
 Investor Presentation December 2017 DISCLOSURE REGARDING FORWARD-LOOKING STATEMENTS This presentation contains, and the officers and directors of the Company may from time to time make, statements that