FY 2008 Results Presentation 27 th February 2009
|
|
|
- Alexander Clarke
- 5 years ago
- Views:
Transcription

1 27 th February 2009
2 Disclaimer This document has been prepared by Acciona, S.A. ( Acciona or the Company ) exclusively for use during the presentation of financial results of the 2008 fiscal year. Therefore it cannot be disclosed or made public by any person or entity with an aim other than the one expressed above, without the prior written consent of the Company. The Company does not assume any liability for the content of this document if used for different purposes thereof. The information and any opinions or statements made in this document have not been verified by independent third parties, nor audited; therefore no express or implied warranty is made as to the impartiality, accuracy, completeness or correctness of the information or the opinions or statements expressed herein. Neither the Company, its subsidiaries or any entity within Acciona Group or subsidiaries, any of its advisors or representatives assume liability of any kind, whether for negligence or any other reason, for any damage or loss arising from any use of this document or its contents. The information contained in this document on the price at which securities issued by Acciona have been bought or sold, or on the performance of those securities, cannot be used to predict the future performance of securities issued by Acciona. Neither this document nor any part of it constitutes a contract, nor may it be used for incorporation into or construction of any contract or agreement. IMPORTANT INFORMATION This document does not constitute an offer or invitation to purchase or subscribe shares, in accordance with the provisions of the Spanish Securities Market Law (Law 24/1988, of July 28, as amended and restated from time to time), Royal Decree-Law 5/2005, of March 11, and/or Royal Decree 1310/2005, of November 4, and its implementing regulations. In addition, this document does not constitute an offer of purchase, sale or exchange, nor a request for an offer of purchase, sale or exchange of securities, nor a request for any vote or approval in any other jurisdiction. Particularly, this document does not constitute an offer to purchase, sell or exchange or the solicitation of an offer to purchase, sell or exchange any securities. FORWARD-LOOKING STATEMENTS This document contains forward-looking information and statements about Acciona, including financial projections and estimates and their underlying assumptions, statements regarding plans, objectives and expectations with respect to future operations, capital expenditures, synergies, products and services, and statements regarding future performance. Forward-looking statements are statements that are not historical facts and are generally identified by the words expects, anticipates, believes, intends, estimates and similar expressions. Although Acciona believes that the expectations reflected in such forward-looking statements are reasonable, investors and holders of Acciona shares are cautioned that forward-looking information and statements are subject to various risks and uncertainties, many of which are difficult to predict and generally beyond the control of Acciona, that could cause actual results and developments to differ materially from those expressed in, or implied or projected by, the forward-looking information and statements. These risks and uncertainties include those discussed or identified in the documents sent by Acciona to the Comisión Nacional del Mercado de Valores, which are accessible to the public. Forward-looking statements are not guarantees of future performance. They have not been reviewed by the auditors of Acciona. You are cautioned not to place undue reliance on the forward-looking statements, which speak only as of the date they were made. All subsequent oral or written forward-looking statements attributable to Acciona or any of its members, directors, officers, employees or any persons acting on its behalf are expressly qualified in their entirety by the cautionary statement above. All forward-looking statements included herein are based on information available to Acciona, on the date hereof. Except as required by applicable law, Acciona does not undertake any obligation to publicly update or revise any forward-looking statements, whether as a result of new information, future events or otherwise.
3 Table of Contents Performance Summary Operating Performance Financial Information by Division Post Closing Events Conclusions
4 Changes in the Perimeter/Consolidation Consolidation Changes Change in consolidation method: During 2007 Endesa was consolidated under the dividend accounting method until September 2007, and proportionally during the 4Q. In 2008 Endesa was proportionally consolidated throughout the year Divisional Reclassification: Since 4Q 2007, hospital concessions are included in ACCIONA Infrastructure and the parking activity consolidates as part of ACCIONA Real Estate. Previously both activities were consolidated as part of ACCIONA Urban and Environmental Services Perimeter Changes Endesa Disposal/Asset Acquisition: On the 20 th of February 2009 ACCIONA and Enel signed an agreement in relation to the transmission of the Endesa stake to Enel and the integration of renewable assets. The agreement is subject to a number of conditions precedent and 2008 figures have not been modified to reflect the agreement Disposals: During 2008, ACCIONA sold Mémora and some minority interests in certain road concessions, which only contributed during the first 9 moths of 2008, whereas during 2007 both businesses contributed the whole year 2007 vs 2008* Not Comparable Comparable 2007 vs 2008* Comparable Not Comparable Note *: Comparable = 2007 figures have been adjusted to make them comparable to those of 2008
5 Table of Contents Performance Summary Operating Performance Financial Information by Division Post Closing Events Conclusions
6 Performance Summary Growth & Profitability Strategy Our solid business model resulted in very positive results for the year 2008 in the current challenging environment Group Revenues up 59.3% to 12,665m Group Revenues excluding Endesa increased 6.8% to 7,208m Strong increase in EBITDA to 2,827m (100.9% y-o-y growth) EBITDA excluding Endesa rose by 9.3% amounting to 1,069m Operating results boosted by the consolidation of Endesa which contributed with 5,458m revenue and ACCIONA Energy which increased it s turnover by 63.2% The energy business contributed 82.8% to EBITDA (62.0% Endesa and 20.8% ACCIONA Energy) ACCIONA s strategy is based on three pillars: Energy, Infrastructure and Water ACCIONA s investment drivers are strategic rationale, value creation and IRR. ACCIONA keeps flexibility in a changing environment. During 2008 ACCIONA invested 3,152m, mainly in the Energy and Infrastructure divisions Agreement with Enel reinforces strategy in core business Consolidation of the three pillar business model as the driving force for growth and profitability
7 Table of Contents Performance Summary Operating Performance Financial Information by Division Post Closing Events Conclusions
8 P&L Main Figures ( m) Jan-Dec 07 Jan-Dec 08 Chg. (%) Revenue 7,953 12, Revenue Ex Endesa 6,749 7, EBITDA 1,407 2, EBITDA Ex Edesa 978 1, EBIT 889 1, EBIT Ex Endesa
9 EBITDA Contribution 2008 EBITDA 2008 EBITDA ex Endesa 20.8% 62.0% 8.6% 3.0% 1.4% 2.5% 1.7% ACCIONA Energy Endesa Infrastructures Real Estate Logistic & Transport Services Urban & Enviromental Services Other Business and Financial 54.8% % 7.9% 3.6% 6.5% 4.6% 2,827m 1,069m Defensive Business Mix
10 Capex by Division Our Investments are aligned with the strategy ( m) Investments % 2008 o/ Total Infrastructures % Real Estate % Energy 1, % Logistic & Transport Services % Urban & Enviromental Services % ACCIONA ex Endesa 2, % Endesa % Total Capex 3, % ACCIONA Divestments (concessions portfolio and Mémora) Endesa Divestments (assets sold to E.On) -2,295 - Total Net Capex of IRR driven growth, focused on Renewable Energy and Infrastructures
11 Debt & Liquidity Analysis (i) Net Debt Breakdown by Division ( m) Infrastructures -41 Real Estate 1,186 Energy 3,662 Logistic & Transport Services 423 Urban & Environmental Services 55 Other Businesses -282 ACCIONA Net debt 5,004 Endesa Acquisition 9,277 Endesa Consolidation 3,616 Net Debt as of 31 Dec ,897 Endesa's receivables¹ -1,285 million Debt Amortization Schedule (ex. Endesa) ( m) E 2010E 2011E 2012E 2013E Real Estate Infrastructures Logistic & Urban Serv. Energy Note: Excludes Endesa related debt, bilateral credit policies, project bridge financing (mostly energy) and real Estate development loans Net debt ex receivables 16,612 ¹ Regulatory receivables pending collection As of 31 st December 2008 undrawn corporate credit lines amounted to 1,305m
12 Debt & Liquidity Analysis (ii) 2008 FY Debt Breakdown ( m) Post Endesa Disposal (pro forma) (ACCIONA/Enel agreement / 20 th February 2009) 9,277 3,616 17,897 Debt Free assets 6,313m net debt ex Endesa consolidation does not include any financial debt associated to the assets to be acquired nor the potential leverage capacity of the assets to be acquired 250 3,616 5,004 11,107 2,890 6,313 1,733 ACCIONA Acq. Endesa Consol. Endesa Total Cash - PUT 4 Option Acq. Assets Estimated Tax/Financial Costs Desconsol. Endesa Total ex Endesa NET DEBT/EBITDA 09E 1 6.2x 4.4x ADJUSTED 2 NET DEBT/EBITDA 09E 1 5.6x 3.2x LOAN TO EV 3 78% 56% 1 EBITDA E2009: Analyst consensus 2 Adjusted by net debt related to assets that do not generate EBITDA as of December 2008 ( 1,733m) 3 Debt / (Debt + Market Capitalisation as of 26 th February 2009) 4 This amount will be adjusted upwards with the interest agreed (Euribor 3M + 85bps during first four months, 0.5*Euribor 3M + 85bps in the fifth month and no additional interest adjustment onwards) and revised downwards with the dividends that ACCIONA will receive until the effective execution of the 20 th February 2009 agreement
13 Table of Contents Performance Summary Operating Performance Financial Information by Division Post Closing Events Conclusions


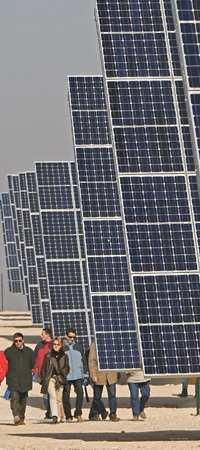
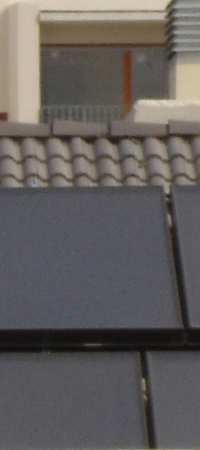
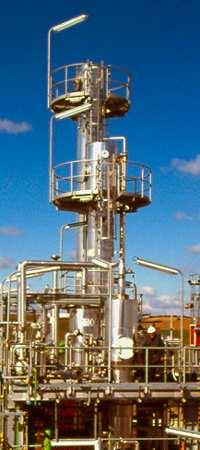
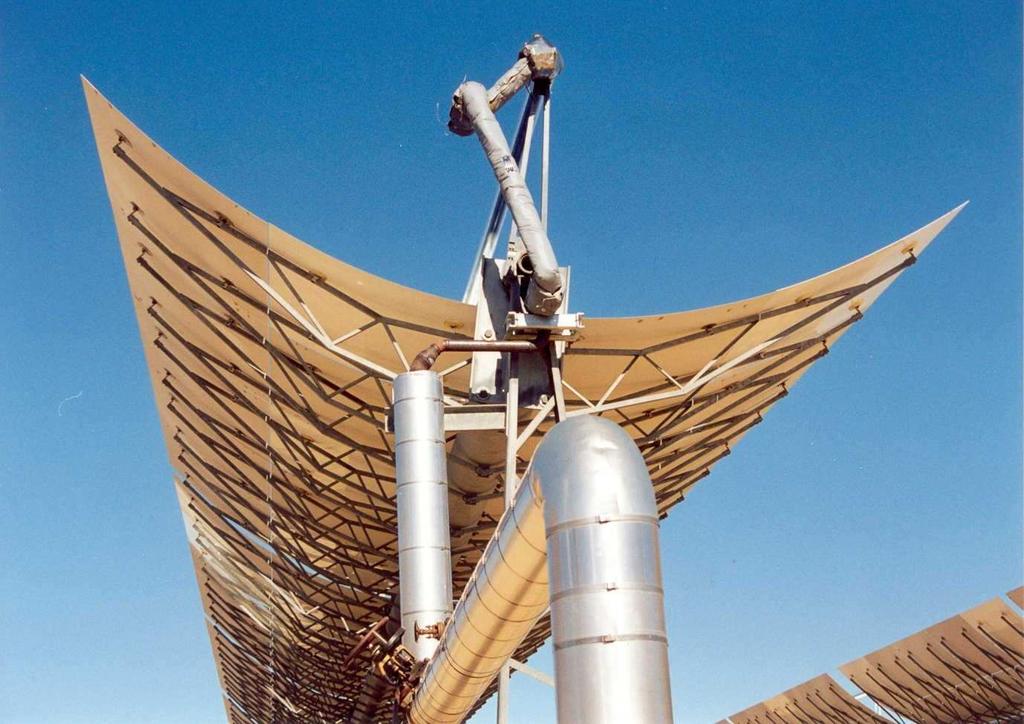
14 Energy Wind Energy Mini Hydro Biomass Concentrated Solar Power Photovoltaic Solar Thermal Solar Biodiesel Acciona Windpwer
15 Energy: Key Figures Revenues ( m) EBITDA ( m) 1, % 1,093 54% 46% Generation Reven. Industrial & Other EBITDA margin 35.9% 33.0% 50.3% % 18% 87% 54% 46% 82% Wind Load Factor (%) Prices Spain ( /MWh) National International Total Jan Dec % 31.5% 26.4% 106,4 104,4 88,8 76,3 98,1 71,0 111,9 95,7 96,3 98,2 83,7 75,8 75,6 76,2 74,1 74,3 104,8 85,8 98,5 81,6 101,9 102,6 88,5 79,3 Jan. Feb. March April May June July Aug. Sept. Oct. Nov. Dec. Final price 2008 Final price 2007 Average 2008 Average 2007

16 Energy: Capacity MW Dec 08 MW under Dec 08 MW (Total) Spain International Total MW (Total) Spain International Total Wind 3,274 1,292 4,566 Mini Hydro Biomass Solar PV Solar Thermoelectric Cogeneration TOTAL 3,515 1,356 4,871 82% Attributable Wind Mini Hydro Biomass Solar PV Solar Thermoelectric Cogeneration TOTAL % Attributable 2008 New Installed Capacity (MW) MW 19.1% 42 4,871 Geograph. Breakdown (Inst. MW) 4, Germany 24MW USA 219MW Australia 171MW India 17MW Mexico 38MW Korea 47MW Italy 13MW Greece 8MW Portugal 18MW Spain (72%) US (11%) Canada (3%) ROTW (15%) 2007 MW Wind National Wind International Solar PV Cogeneration 2008 MW


17 Infrastructure Construction Concessions Real Estate
18 Infrastructure: Key Figures Revenues ( m) EBITDA ( m) 3,695 1% -2.8% % 7.5% 6.8% % 243 6% 12% 99% 98% Const. & Eng. Concessions EBITDA margin 94% 88% Main infrastructure works awarded in 2008: SPAIN: Platform for high speed train Madrid- Zaragoza-Barcelona- French border A-33 Motorway Cieza - La Font de la Figuera, crossing the provinces of Albacete, Alicante and Valencia INTERNATIONAL: A-30 toll road in Canada Rodovía Do Aço (Rio de Janeiro State) toll road Toll road in Chile between Coronel and Tres Pinos
19 Infrastructure: Construction Constr. Backlog - Business Breakdown Constr. Backlog - Geograph. Breakdown Construction Backlog ( m) Dec-07 Dec-08 % Var. Weight (%) Civil works (Spain) 3,398 4,144 22% 56% Civil works (International) 458 1, % 18% Total Civil Works 3,855 5,497 43% 75% International 24% Residential (Spain) % 1% Residential (International) % 0% Total Residential % 1% Non Residential (Spain) 1, % 13% Non Residential (International) % 4% Non Residential 1,173 1,240 6% 17% ANA Development (National) % 1% ANA Development (International) % 1% Total ANA Development % 2% Spain 76% Other % 5% TOTAL 5,755 7,341 28% 100% Note: Other includes Construction Auxiliary, Engineering and Other 7,341m Constr. Backlog - Client Breakdown International Constr. Backlog Central Administration (54%) Regional Governments (22%) Municipalities (4%) Private (10%) Group Companies (10%) Poland (49%) Canada (28%) Chile (7%) Brazil (7%) ROTW (8%) 7,341m 1,768m
 Young portfolio of concessions: Average life: 3.")


20 Infrastructure: Concessions Book value of concessions as of December 2008: 669m (equity and debt) Young portfolio of concessions: Average life: 3.7 years Average remaining life: 24 years Main 2008 s new concessions awarded: A-30 toll road in Canada, which will become a main axis linking Quebec and Montreal. Capex: $1.5bn. 35-year concession Concession contract for the Rodovía Do Aço (Rio de Janeiro State) toll road. Capex: 300m in the next five years. 35-year concession Double Digit project IRR Toll road in Chile between Coronel and Tres Pinos. Capex: $200m
21 Infrastructure: Real Estate Revenues ( m) EBITDA ( m) 445 5% -28.1% 28.1% 26.6% 19% 76% 320 7% 15% 78% Parkings Rental Assets Development EBITDA margin 125 9% 34% 56% -31.8% 85 14% 34% 52% Presales dropped from 182m in 2007 to 42.9m in 2008 Acquisition of land 131m¹: Spain: 51m ( VPO ) International: 79m (Mexico 50%- Parque Reforma & Brazil) Provision for value deterioration of assets: 112m (1) Includes the acquisition of land for development (considered inventory)
22 Real Estate: Independent Asset Appraisal Gross Capital Gross Capital ( million) GAV GAV Gain Gain Development 1, Domestic 1, International Rental 1, , Domestic 1, , International Total 2, , Independent asset appraisal by: CB Richard Ellis Aguirre Newman Gross Asset Value ( m) 2008 GAV Breakdown 2, , Development 23% 2,014 2,056 Rental 77% Book Value Gross Capital Gain 2008 GAV: 2,388m


")
23 Services and Other Businesses Services Other Businesses Logistic & Transport Urban & Environmental Asset Management Media (GPD) Winery
24 Logistic & Transport Services: Key Figures Revenues ( m) EBITDA ( m) % -1.1% % Other 7.5% 4.3% % 10% 66% 64% Trasmediterránea Handling EBITDA margin 60% 39 32% 14% 16% 17% 30% 53% The division has suffered a severe margin contraction during the year, affecting Trasmediterránea, mainly due to the deterioration of market conditions and the rising fuel prices Average cost per mile up 33% Increase in oil cost + 19m
25 Logistic & Transport Services: Trasmediterránea ACCIONA is undertaking a strategic review of Trasmediterránea Conclusions indicate that the reorganization of certain areas will be implemented in the current environment 2009 Restructuring Plan Main Measures Comments Line & Fleet Restructuring Discontinuation of 8 ships out of a 27 ship fleet (7 owned up for sale - and 1 leased) OPEX Reduction External services Fuel and other Personnel Taxes Corporate structure and other Other Reduction of miles sailed (-11%) EGM: Approved capital increase of 110m
26 Urban & Environmental Services: Key Figures Revenues ( m) EBITDA ( m) % 772 Agua 7.8% 9.1% % 55 43% 61% 52% Other EBITDA margin 60% 57% 39% 48% 40% ACCIONA Agua s revenues up 34.2% and EBITDA up 80.1% to 370m and 40m respectively Water business increases its weight on EBITDA of the division to 56.6% (vs 40.2% in 07) Water backlog as of 31 st December was 3.6bn In Q3 Acciona reached an agreement to dispose its 75% stake in Mémora (Funeral Services). Transaction closing after clearing precedent conditions, was effective on the 13 th November 2008
27 Other Businesses: Key Figures Revenues ( m) EBITDA ( m) 43.8% 35.7% % 140 EBITDA margin % Includes: Bestinver Bodegas Hijos de Antonio Barceló winery business Media (GPD) Bestinver had 2,386m under management as of December 2008
28 Endesa 25% Stake in Endesa
29 Endesa: Contribution ( m) Jan-Dec 07 Jan-Dec 08 Chg. (x) Revenue 1,203 5, x EBITDA 429 1, x Net Profit x Significant increase of net financial expenses (+ 896 million) mainly explained by the change in the consolidation criteria of Endesa, recognizing in 2007 the dividends paid out by Endesa as financial income Figures of 2008 recognize the amortization of the value allocation to assets derived from the completion of the assets valuation and definitive goodwill allocation During 2007 Endesa was consolidated under the dividend accounting method until September 2007, and proportionally during the 4 th quarter. In 2008 Endesa was proportionally consolidated throughout the year
30 Table of Contents Performance Summary Operating Performance Financial Information by Division Post Closing Events Conclusions
31 Agreement with Enel On the 20 th February 2009 ACCIONA and Enel reached an agreement regarding Endesa EARLY EXERCISE OF PUT OPTION ON ITS 25.01% STAKE IN ENDESA Valued at 11,107m in cash As of 20 th February 2009 CONSOLIDATION OF A LEADING RENEWABLE ENERGY COMPANY Simultaneously ACCIONA will acquire 2,105 MW of renewable and hydro assets free of debt for a value of 2,890m Value creation for ACCIONA s shareholders
32 Agreement with Enel: Overview of Assets Assets Gross MWs Net MWs Average Remaining Life (1) Average Load Factor Wind Assets in Spain 1, , (2) 26.9% Wind Assets in Portugal (2) 26.9% Mini-Hydro % Hydro % TOTAL 2, , % All the assets are fully operational, debt free and fully owned (1) Weighted by net capacity (2) Assuming 20 year average useful life period from Commissioning Operating Date (COD)
33 Agreement with Enel: Consolidating Worldwide Leadership Gross Installed Capacity (Q3 2008) 8,487 #2 Gross Installed Capacity (MW) 6,516 2,105 4,411 (1) 5,884 #3 4,411 4,155 1,830 Iberdrola Renovables Acciona Post-agreement Florida Power & Light Acciona EDP Renovaveis EDF Energies Pre-agreement Nouvelles Source: Company presentations (1) Assets to be acquired from Endesa. Hydro conventional assets include 304 MW in the process of reclassification into the, Special Regime
34 Table of Contents Performance Summary Operating Performance Financial Information by Division Post Closing Events Conclusions
35 Conclusions ACCIONA s future business strategy relies on three pillars under the sustainability umbrella: Infrastructures, Energy and Water Under a challenging environment, the sound results of the period respond to the defensive business mix of the company, together with our strong growth potential in the short, medium and long term The agreement with Enel provides ACCIONA a flexible financial position to fund growth Future Capex allocation within three areas driven by IRR, value creation and strategic rationale
COMISIÓN NACIONAL DEL MERCADO DE VALORES Paseo de la Castellana, Madrid. Madrid, 13 de mayo de Muy Sres. nuestros:
 COMISIÓN NACIONAL DEL MERCADO DE VALORES Paseo de la Castellana, 19 28046 Madrid Madrid, 13 de mayo de 2013 Muy Sres. nuestros: ACCIONA adjunta presentación en ingles que se seguirá en la multiconferencia
on 12/14/2009 at 2:05 PM Labrador a4-bc9f-4b81-89f6-657b075eb230
 on 12/14/2009 at 2:05 PM CONTENTS 1. KEY FINANCIAL FIGURES 2. CONSOLIDATED INCOME STATEMENT 3. RESULTS BY DIVISION 3.1. ACCIONA Energy 3.2. ACCIONA Infrastructures 3.3. ACCIONA Real Estate 3.4. ACCIONA
Legal Notice DISCLAIMER
 Legal Notice DISCLAIMER This document has been prepared by Iberdrola, S.A. exclusively for use during the presentation of financial results of the first quarter of the 2018 fiscal year. As a consequence
OUTLOOK 2016 / 20 LONDON / 24th February. Financial Management. José Sáinz Chief Financial & Resources Officer
 OUTLOOK 2016 / 20 LONDON / 24th February Financial Management José Sáinz Chief Financial & Resources Officer Agenda 1. Financial strategy for 2016-2020 period 2. Risk & sensitivity analysis 3. Conclusion
CONTENTS 1. KEY FINANCIAL FIGURES 2. CONSOLIDATED INCOME STATEMENT
 CONTENTS 1. KEY FINANCIAL FIGURES 2. CONSOLIDATED INCOME STATEMENT 3. RESULTS BY DIVISION 3.1. Energy 3.2. Infrastructures 3.3. Real Estate 3.4. Logistic & Transport Services 3.5. Water & Environment 3.6.
2. Consolidated income statement Acciona Infrastructure Acciona Real Estate Acciona Logistics & Transport Services
 Contents 1. Key financials 2. Consolidated income statement 3. Business Divisions 3.1. Acciona Infrastructure 3.2. Acciona Real Estate 3.3. Acciona Energy 3.4. Acciona Logistics & Transport Services 3.5.
Thanks to 36 billion invested between 2007 and 2008 and to the Company s international and diversification policy
 17 February 2009 PRESS release Thanks to 36 billion invested between 2007 and 2008 and to the Company s international and diversification policy IBERDROLA NET PROFIT TOTALLED 2,860.6 MLN IN 2008, DRIVEN
Quality assets. Selective and profitable growth. Self-funding business model
 This presentation has been prepared by EDP Renováveis, S.A. (the "Company") solely for use at the presentation to be made on May 6 th, 2015. By attending the meeting where this presentation is made, or
Legal Notice DISCLAIMER IMPORTANT INFORMATION
 Legal Notice DISCLAIMER This document has been prepared by Iberdrola, S.A. exclusively for use during the presentation of financial results of the 2017 fiscal year. As a consequence thereof, this document
Enel Green Power 9M 2015 consolidated results
 Enel Green Power Rome November 13, 2015 Agenda Overview of recent events Analysis of results Closing remarks 1 Active portfolio management Exit from El Salvador Cash-in: 224 m Capital gain: 123 m Entry
Ignacio Galán Chairman& CEO
 Ignacio Galán Chairman& CEO Legal Notice DISCLAIMER This document has been prepared by Iberdrola, S.A. exclusively for use during the presentation Outlook 2016-2020 update. As a consequence thereof, this
COMPANY PROFILE. ACCIONA, sustainable development as a factor for leadership
 COMPANY PROFILE ACCIONA is one of the world's leading companies in terms of sustainability, standing out especially for its drive to develop renewable energies, infrastructures, water and services, placing
COMPANY PROFILE ACCIONA INTEGRATES SUSTAINABILITY AS A DRIVER OF CHANGE AND PROGRESS VALUES MISSION VISION VALUE GENERATION
 10 COMPANY PROFILE COMPANY PROFILE VALUE GENERATION ACCIONA is a global company with a business model based on sustainability. Its aim is to respond to society s main needs through the provision of renewable
3. Consolidated income statement. 4. Business performance Acciona Infrastructure Acciona Real Estate
 Contents 1. Key financials 2. Acquisition of 21% of Endesa 3. Consolidated income statement 4. Business performance 4.1. Acciona Infrastructure 4.2. Acciona Real Estate 4.3. Acciona Energy 4.4. Acciona
The Company presents strategy for the next three years that responds to evolving patterns of energy demand
 PRESS release 24 October 2007 The Company presents strategy for the next three years that responds to evolving patterns of energy demand IBERDROLA PROJECTS INVESTMENT PROGRAMME OF 24 BLN, NET PROFIT OF
First Quarter 2018 Results (1Q18) April 26, 2018
 April 26, 2018") First Quarter 2018 Results () April 26, 2018 Agenda 1. Highlights and consolidated results 2. results by activity 3. Conclusions Appendices 1 1. Highlights and consolidated results Transformation pillars
First Quarter 2018 Results () April 26, 2018 Agenda 1. Highlights and consolidated results 2. results by activity 3. Conclusions Appendices 1 1. Highlights and consolidated results Transformation pillars
2. Acquisition of 10% of Endesa. 3. Consolidated income statement. 4. Business performance Acciona Infrastructure Acciona Real Estate
 Contents 1. Key points 2. Acquisition of 10% of Endesa 3. Consolidated income statement 4. Business performance 4.1. Acciona Infrastructure 4.2. Acciona Real Estate 4.3. Acciona Energy 4.4. Acciona Logistics
Endesa FY 2017 Results 28/02/2018
 Endesa FY 2017 Results 28/02/2018 1. Highlights and key financial figures 2. Endesa s performance in 2017 market context 3. Financial results 4. Final remarks 2 1. Highlights and key financial figures
Endesa 9M 2017 Results 07/11/2017
 Endesa 9M 2017 Results 07/11/2017 1. Highlights and key financial figures 2. Endesa s performance in 9M 2017 market context 3. Financial results 4. Final remarks 2 1. Highlights and key financial figures
Enel Green Power 1Q 2014 consolidated results
 Enel Green Power Rome May 7, 2014 Agenda Highlights Analysis of results Closing remarks 1 Highlights Over 60% of 20142018 plan addressed with 2.4GW in execution Good operating performance: +15% output
Endesa 1Q 2018 Results 08/05/2018
 Endesa 1Q 2018 Results 08/05/2018 1. Highlights and key financial figures 2. Endesa s performance in 1Q 2018 market context 3. Financial results 4. Final remarks 2 Highlights Outstanding performance of
Recurring (1) EBITDA -4% YoY to 911m Renewables and Brazil underlying growth offset by forex (-6%) and regulatory changes in Portugal (- 66m YoY)
 EBITDA -4% YoY to 911m Renewables and Brazil underlying growth offset by forex (-6%) and regulatory changes in Portugal (- 66m YoY)") 0 Recurring (1) EBITDA -4% YoY to 911m Renewables and Brazil underlying growth offset by forex (-6%) and regulatory changes in Portugal (- 66m YoY) +0.6GW YoY additions of wind and solar capacity; renewables
0 Recurring (1) EBITDA -4% YoY to 911m Renewables and Brazil underlying growth offset by forex (-6%) and regulatory changes in Portugal (- 66m YoY) +0.6GW YoY additions of wind and solar capacity; renewables
Janda III - Cádiz - Spain 15:00 CET 14:00 UK / LISBON
 Janda III - Cádiz - Spain 15:00 CET 14:00 UK / LISBON This presentation has been prepared by EDP Renováveis, S.A. (the "Company ; LEI 529900MUFAH07Q1TAX06) solely for use at the presentation to be made
Enel Green Power business plan. Rome - April 3 rd 2014
 Enel Green Power 20142018 business plan Rome April 3 rd 2014 EGP 20142018 business plan Agenda Snapshot on 2013 key achievements F. Starace, CEO Focus on geothermal R. Deambrogio, Head of Italy & Europe
FY2013 Results Presentation. 19 March 2014
 FY2013 Results Presentation 19 March 2014 Disclaimer This document is of a purely informative nature and does not constitute an offer to sell, exchange or buy, or the solicitation of an offer to buy, securities
Infrastructure. Services 3Q2011 EARNINGS REPORT. Energy
 Infrastructure 3Q2011 EARNINGS REPORT Services Energy 1. HIGHLIGHTS 2 2. EXECUTIVE SUMMARY 3 3. SUMMARY BY BUSINESS AREA 4 4. INCOME STATEMENT 6 5. BALANCE SHEET 9 6. CASH FLOW 12 7. BUSINESS PERFORMANCE
CTT Correios de Portugal. Company Presentation
 CTT Correios de Portugal Company Presentation Disclaimer DISCLAIMER This document has been prepared by CTT Correios de Portugal, S.A. (the Company or CTT ) exclusively for use during roadshows and conferences
3,951 EBITDA 1,174 1,153 1,260 1,284 1,332 Outst shares (mn) 57 EBIT Free float (%)
 57 EBIT Free float (%)") European Equity Research ACCIONA Facing a Good 2017E Spain Electricity November 7, 2016 (07:15 CET) BUY CURRENT PRICE: 69.01 TARGET PRICE: 82.40 ANA released 9M16 results on Nov 4 and we have adjusted
European Equity Research ACCIONA Facing a Good 2017E Spain Electricity November 7, 2016 (07:15 CET) BUY CURRENT PRICE: 69.01 TARGET PRICE: 82.40 ANA released 9M16 results on Nov 4 and we have adjusted
endesa 1H 2012 results
 27 07 2012 endesa 1H 2012 results Market context 1H 2012 Demand consolidated results 1H 2012 Spain: adjusted demand decrease due to industry Spain (1) Endesa distribution area +0.8% Industry -1.8% Services
SMA SOLAR TECHNOLOGY AG Analyst / Investor Presentation Financial Results 2017
 SMA SOLAR TECHNOLOGY AG Analyst / Investor Presentation Financial Results 2017 Pierre-Pascal Urbon, CEO Ulrich Hadding, CFO March 28, 2018 Date, Author SMA Solar Technology AG Disclaimer IMPORTANT LEGAL
2014 Results. 18 February 2015 Madrid
 2014 Results 18 February 2015 Madrid Disclaimer/Notice to Recipients This presentation contains forward-looking statements and information relating to Abertis Infraestructuras, S.A. ( Abertis ) and its
COMISIÓN NACIONAL DEL MERCADO DE VALORES C/ Edison, nº Madrid. Madrid, November 15, 2018
 COMISIÓN NACIONAL DEL MERCADO DE VALORES C/ Edison, nº 4 28006 Madrid Madrid, November 15, 2018 QUABIT INMOBILIARIA, S.A. ( Quabit or the Company ), in compliance with what is established in article 228
SALES AND HIGHLIGHTS 2017 FIRST QUARTER
 SALES AND HIGHLIGHTS 2017 FIRST QUARTER DISCLAIMER This presentation does not constitute an offer to sell securities in the United States or any other jurisdiction. No reliance should be placed on the
Euskaltel 1H15 update and R Cable transaction. 28 July 2015
 Euskaltel 1H15 update and R Cable transaction 28 July 2015 0 Strong momentum across our residential KPIs Inflexion point in Residential subs Residential subs (1) ( 000) 3P & 4P % of total subs Annual churn
Financial Information 1Q 2018
 Financial Information 1Q 2018 May 9th, 2018 Conference call & webcast Date: Wednesday, May 9th, 2018, 15:00 CET 14:00 UK/Lisbon Webcast: www.edpr.com Phone dial-in number: +44 (0) 14 52 541 003 +1 646
Results Presentation th of February, 2014
 Results Presentation 2013 28 th of February, 2014 Executive Summary Consolidation of Global Leadership Good Operating Results Net Profit > 700 Financial structure reinforced HOCHTIEF Restructuring 2 ACS
COMISIÓN NACIONAL DEL MERCADO DE VALORES Calle Edison, nº Madrid Madrid, February 28, 2018
 COMISIÓN NACIONAL DEL MERCADO DE VALORES Calle Edison, nº 4 28006 Madrid Madrid, February 28, 2018 QUABIT INMOBILIARIA, S.A. ( Quabit or the Company ), in compliance with article 228 of the Consolidated
2013 Results. February 2014
 2013 Results February 2014 Table of Contents Discussion Topics Page Section 1 2013 Highlights (CEO) 3 Section 2 2013 Results (CFO) 10 Section 3 2014 Outlook (CEO) 21 Section 4 2014 Guidance (CFO) 27 Section
9M18 Results Presentation
 FUNCIONA CUSTOMER SERVICE, SPAIN ALTO RABAGÃO, PORTUGAL ARKWRIGHT SUMMIT, USA Results Presentation Recurring EBITDA (1) : 2,428m -6% Forex impact on BRL and USD depreciation vs. Euro YoY Regulatory changes
O&M in the Last Mile Ezentis manages, maintains and deploys infrastructure for telecommunications and utilities companies.
 1 O&M in the Last Mile Ezentis manages, maintains and deploys infrastructure for telecommunications and utilities companies. Focus on Latin America where Ezentis activity represents 91,3% of total Group
A New Red Eléctrica February 2003
 RED ELÉCTRICA DE ESPAÑA A New Red Eléctrica February 2003 Red Eléctrica at a Glance Core Business: Electricity Transmission in Spain Main owner of Spain s transmission grid Grid Manager and System Operator
Recurring EBITDA: 1,902m, -5% YoY 62% decline YoY of hydro production in Iberia: 42% below historical avg. in 1H17 vs.
 0 Recurring EBITDA: 1,902m, -5% YoY 62% decline YoY of hydro production in Iberia: 42% below historical avg. in vs. 68% above in Net Profit: 450m, -5% YoY Avg. cost of debt -40bp YoY, OPEX IV savings at
Capital Markets Day. Global Renewable Energies. Antonio Cammisecra
 Capital Markets Day Global Renewable Energies Antonio Cammisecra Integrated model fit for digitalized, low carbon world Generation growth engine Leading geographic expansion Growth engine for the utility
ELIOR GROUP FY RESULTS
 FY 2017-2018 RESULTS DISCLAIMER This document was prepared by Elior Group for the sole purpose of this presentation. This presentation includes only summary information and does not purport to be comprehensive.
The world s leading infrastructure developer. April 2012
 The world s leading infrastructure developer Investors Presentation Company profile, strategy and key financials April 2012 Grupo ACS The world s leading infrastructure developer Engineering contractor
Siemens Gamesa Renewable Energy Q Results
 Siemens Gamesa Renewable Energy Q2 208 Results 04 May 208 Disclaimer This material has been prepared by Siemens Gamesa Renewable Energy, and is disclosed solely for information purposes. This document
January - September 2015 Results
 January - September 2015 Results 23 rd October 2015 Disclaimer The information and forward-looking statements contained in this presentation have not been verified by an independent entity and the accuracy,
Endesa 1Q 2016 Results 09/05/2016
 Endesa 1Q 2016 Results 09/05/2016 1. Highlights and key financial figures 2. Endesa s performance in 1Q 2016 market context 3. Financial results 4. Final remarks 2 1. Highlights and key financial figures
January December 2011 Results
 January December 2011 Results 27 February 2012 Highlights 2011 ASSETS VALUATION As of December 2011, the total asset valuation (GAV) amounted to 4,286 million euro (-4.3% below Dec. 2010), based on market
ANNOUNCEMENT OF INTENTION TO FLOAT ON THE SPANISH STOCK EXCHANGES
 NOT FOR RELEASE OR DISTRIBUTION OR PUBLICATION IN WHOLE OR IN PART, DIRECTLY OR INDIRECTLY, IN OR INTO THE UNITED STATES, CANADA, AUSTRALIA, JAPAN OR ANY OTHER JURISDICTION WHERE TO DO SO MIGHT CONSTITUTE
Madrid, February 25 th, 2011
 Madrid, February 25 th, 2011 This document contains forward-looking statements on the intentions, expectations or forecasts of Grupo ACS or its management at the time the document was drawn up and in reference
9M 2016 consolidated results. November 10, 2016
 9M 2016 consolidated results November 10, 2016 Opening remarks EBITDA +8% net of forex and on a like-for-like basis Double digit growth of net ordinary income on a like-for-like basis Positive contribution
+0.6GW additions of wind and solar capacity Efficiency savings of 141m (26% above 2017 target for OPEX IV Programme)
") 0 EBITDA +6% at 3.99bn, benefiting from the gain on Naturgas disposal (+ 0.5bn one-offs) Recurring EBITDA -5% to 3.52bn, penalised by severe drought in Iberian peninsula (- 0.3bn) +0.6GW additions of wind
0 EBITDA +6% at 3.99bn, benefiting from the gain on Naturgas disposal (+ 0.5bn one-offs) Recurring EBITDA -5% to 3.52bn, penalised by severe drought in Iberian peninsula (- 0.3bn) +0.6GW additions of wind
Ezentis increases its EBITDA by 142,3% in the first nine months of the year up to 16,4 million Euros
 Results Presentation Ezentis increases its EBITDA by 142,3% in the first nine months of the year up to 16,4 million Euros The revenue of the Company increased by 30% up to 228,5 million Euros thanks to
1Q 2015 Results. May 8, 2015
 1Q 2015 Results May 8, 2015 Highlights of the period Good operating results: recurring EBITDA +4% Latam: confirmed positive trends, EBITDA +33% yoy and reorganization kicked -off Renewables: +0.2 GW capacity
January-March 2010 Results. Grupo Prisa. Quarterly Results January- March th May, // Investor Relations
 Grupo Prisa Quarterly Results January- March 2010 13th May, 2010 1 JANUARY- MARCH 2010 PRISA OBTAINED AN EBITDA OF 144.47 MILLION IN THE FIRST QUARTER OF 2010 (+3.9%). THE OPERATING PROFIT (EBIT) INCREASED
First Quarter 2016 Performance Summary
 First Quarter 2016 Performance Summary Operational and Financial Highlights - 1Q 2016 Grifols' revenues increase by +5.6% to Euros 959 million, driven by growth of +10.9% for the Bioscience Division The
Fourth Quarter 2016 Performance Summary
 Fourth Quarter 2016 Performance Summary Operational and Financial Highlights - 2016 Net profit rises by +2.5% to Euros 545.5 million Recurring sales (excluding Raw Materials and Others) rise by +4.5% (+4.6%
Recurring EBITDA +10% to 2,832m including 2% negative impact from ForEx
 0 Recurring EBITDA +10% to 2,832m including 2% negative impact from ForEx Recurring net profit +17% to 661m Net profit -16% to 615m (non recurring gain on Pecém in ) 2.0bn Tariff Deficit Sales in Regulatory
FY 16 results presentation Press conference. Barcelona, 17 th February 2016 ANNUAL RESULTS 2016
 FY 16 results presentation Press conference. Barcelona, 17 th February 2016 ANNUAL RESULTS 2016 2 2016, key highlights & figures Location: France Rural site 3 tenants 3 2016 In a nutshell Full year results
CEMEX Cement. Quarterly Report February 9, CEMEX remains on track to regain its investment grade.
 Quarterly Report CEMEX Market Outperformer 2017 Price Target US$11.0 Price 8.9 12M Price Range 4.1/9.5 Shares Outstanding (Mill)* 1,545 Market Cap USD (Mill) 13,797 Float 78.6% Net Debt USD (Mill)** 12,516
Siemens Gamesa Renewable Energy Q3 18 Results
 Siemens Gamesa Renewable Energy Q3 18 Results 27 July 2018 Disclaimer This material has been prepared by Siemens Gamesa Renewable Energy, and is disclosed solely for information purposes. This document
ROADSHOW POST-Q2 & H RESULTS. September 2016
 ROADSHOW POST-Q2 & H1 2016 RESULTS September 2016 1. COMPANY OVERVIEW Rexel at a glance : Strategic partner for suppliers and customers Energy Providers Suppliers Customers Endusers Economies of scale
Q results. April 27, 2018
 Q1 2018 results April 27, 2018 Consolidated financial statements as of March 31, 2018 were authorized for issue by the Board of Directors held on April 26, 2018. Q118 KEY HIGHLIGHTS Q1 2018 in line with
English Version 6M16 MANAGEMENT REPORT (JANUARY JUNE)
") English Version 6M16 MANAGEMENT REPORT (JANUARY JUNE) September 28 th, 2016 Table of Contents 1. Selected consolidated data...3 2. Significant events...4 3. Consolidated income statement...5 3.1. Key operating
English Version 6M16 MANAGEMENT REPORT (JANUARY JUNE) September 28 th, 2016 Table of Contents 1. Selected consolidated data...3 2. Significant events...4 3. Consolidated income statement...5 3.1. Key operating
Enel Generación Chile. Investor Relations Presentation 9M 2016
 Enel Generación Chile Investor Relations Presentation 9M 2016 Organization structure Enel Generación Chile (after Spin Off) 61% ENEL SpA ITALY Committed Shareholders 60% ENEL CHILE CHILE 3% 3% 18% Enersis
Interim Report 9m Herbert Bodner, CEO
 Interim Report 9m 2008 Investors and Analysts Conference Call on November 10, 2008 Herbert Bodner, CEO 9m 2008: Highlights g Successful growth course has continued despite financial market turbulence Growth
January- December 2009 Results. Grupo Prisa. Annual Results January- December February 19th // Investor Relations
 Grupo Prisa Annual Results January- December 2009 February 19th 2010 1 JANUARY- DECEMBER 2009 PRISA OBTAINED AN EBITDA OF 623.75 MILLION IN 2009. The operating profit (EBIT) reached 368.98 million. Net
Third quarter results. 15 November 2010
 Third quarter results 15 November 2010 1 Period operatives keys Analysis of 3Q10 results Business areas Appendices 2 Period operative keys SyV third quarter results reflect the advancement made in: INTERANTIONAL
ferrovial 2013 Full year results Investing for growth 1 Tel:
 ferrovial 2013 Full year results Investing for growth 1 E-mail: ir@ferrovial.es Tel: +34 91 586 27 30 Disclaimer This document may contain statements that constitute forward looking statements about the
Q Results presentation
 Q1 2016 Results presentation 12 May 2016 1 Disclaimer This presentation (the "Presentation") has been prepared and is issued by, and is the sole responsibility of Telepizza Group, S.A. ( Telepizza" or
1H18 Key figures SALES 17,777 +2,2% +10,1% EBITDA 1, % +8.7% EBIT % +11.9% NET PROFIT % +13.3%
 Key figures Figures in million YoY Var. Like for Like Var. 1 SALES 17,777 +2,2% +10,1% EBITDA 1,248 +2.0% +8.7% EBIT 946 +5.1% +11.9% NET PROFIT 447 +7.4% +13.3% LTM Net Operating Cash Flow 1,605 +24.1%
2014 Results Presentation
 2014 Results Presentation Madrid, March 2 nd 2015 Finance Department Investor Relations 1 Disclaimer This document may contain forward-looking statements regarding intentions, expectations or predictions
Interim Three Months June 2010
 Interim Three Months 2010 9 June 2010 Disclaimer This document is of a purely informative nature and does not constitute an offer to sell, exchange or buy, or the solicitation of an offer to buy, securities
Applus+ Group Full Year 2017 Results Presentation. 27 February 2018
 Applus+ Group Full Year 2017 Results Presentation 27 February 2018 1 Disclaimer This document may contain statements that constitute forward looking statements about Applus Services, SA ( Applus+ or the
RESULTS PRESENTATION FOR THE OCTOBER TO DECEMBER PERIOD (Q4) 27 February 2019
 27 February 2019") RESULTS PRESENTATION FOR THE OCTOBER TO DECEMBER PERIOD (Q4) 27 February 2019 Key Highlights The BoD has appointed Jose Diaz as CEO of Parques Reunidos 2019 Key Actions The company is working on a new
RESULTS PRESENTATION FOR THE OCTOBER TO DECEMBER PERIOD (Q4) 27 February 2019 Key Highlights The BoD has appointed Jose Diaz as CEO of Parques Reunidos 2019 Key Actions The company is working on a new
endesa FY 2012 results
 27 02 2013 endesa FY 2012 results consolidated results FY 2012 Business context in 2012 Demand Spain: demand decrease due to lower industrial activity Spain (1) Endesa distribution area (2) -0.5% -1.3%
CTT Correios de Portugal 9M17. Results Presentation. CTT Correios de Portugal, S.A. 31 October
 CTT Correios de Portugal Results Presentation CTT Correios de Portugal, S.A. 31 October 2017 1 Disclaimer DISCLAIMER This document has been prepared by CTT Correios de Portugal, S.A. (the Company or CTT
Results Report Results Report 3Q14 3Q14. 13th November, Non Audited Figures 1
 13th November, 2014 Non Audited Figures 1 INDEX 1 Executive Summary 3 1.1 Main figures 3 1.2 Relevant facts 4 2 Consolidated Financial Statements 7 2.1 Income Statement 7 2.1.1 Sales and Backlog 7 2.1.2
5. The financial management in 2017
 5. The financial management in 2017 5.1. Consolidated FinanCial statements 5.2. Consolidated balance sheet of the acs Group 5.3. net Cash Flows of the acs Group 5.4. areas of activity evolution: ConstruCtion
FY 2015 consolidated results. March 23, 2016
 FY 2015 consolidated results March 23, 2016 Agenda Delivery on strategic plan Financial results Business analysis Closing remarks 1 Delivery on strategic plan Opening remarks Operational efficiency delivering
Investor and Analyst presentation Senvion S.A.
 Investor and Analyst presentation Senvion S.A. Nine month results for the period ended on 30 September 2018 14 November 2018 Disclaimer This presentation (the Presentation ) has been prepared by Senvion
ENDESA, S.A. and Subsidiaries. Consolidated Management Report for the period January-September 2017
 ENDESA, S.A. and Subsidiaries Consolidated Management Report for the period Madrid, 7 November, ENDESA, S.A. AND SUBSIDIARIES CONSOLIDATED MANAGEMENT REPORT FOR THE PERIOD JANUARY-SEPTEMBER Index. 1. Business
Gas Natural and Unión Fenosa A vertically integrated gas and power leader. 31 July 2008
 Gas Natural and Unión Fenosa A vertically integrated gas and power leader 31 July 2008 1 Disclaimer This document does not constitute an offer for sale or a solicitation to acquire securities, nor shall
Results Presentation 1Q May 12 th 2017
 Results Presentation 1Q 2017 May 12 th 2017 Executive Summary OPERATING OUTPERFORMANCE 11% Sales & EBIT recovery in CIMIC & margins stability NET PROFIT GROWTH in the HIGH END TARGET 12.6% like-for-like*
Tender Offer on Axiare. Barcelona 13/11/17
 Tender Offer on Axiare Barcelona 13/11/17 Disclaimer By accepting this presentation and/or by attending this presentation, you will be taken to have represented, warranted and undertaken that you have
2011 Interim Results. Keith Gordon, Managing Director & Chief Executive Officer Stephen Gobby, Chief Financial Officer
 2011 Interim Results Keith Gordon, Managing Director & Chief Executive Officer Stephen Gobby, Chief Financial Officer Emeco 2011 Interim Results Overview Financials Strategy & Outlook Questions Appendices
COMPANY PRESENTATION NOVEMBER
 COMPANY PRESENTATION NOVEMBER 2018 DISCLAIMER This presentation includes or may include representations or estimations concerning the future about intentions, expectations or forecasts of VIDRALA or its
INFRASTRUCTURE. Management. Report 2008 SERVICES CEMENT ENERGY
 INFRASTRUCTURE Management SERVICES Report 2008 CEMENT ENERGY 1. HIGHLIGHTS 2 2. EXECUTIVE SUMMARY 4 3. SUMMARY BY BUSINESS AREA 5 4. INCOME STATEMENT 7 5. BALANCE SHEET 11 6. CASH FLOW 13 7. BUSINESS PERFORMANCE
Applus+ Group Results Presentation YTD Q st October 2017
 Applus+ Group Results Presentation YTD Q3 2017 31 st October 2017 Disclaimer This document may contain statements that constitute forward looking statements about Applus Services, SA ( Applus+ or the Company
Grupo ACS net profit in 2011 totals EUR 962 million
 Grupo ACS net profit in 2011 totals EUR 962 million Turnover grew up to EUR 28,472 million, a 98.7% increase. International turnover now accounts for 72.5% of the total. The Grupo ACS ordinary net profit
H RESULTS PRESENTATION
 H1 2018 RESULTS PRESENTATION 03.09.2018 H1 2018 RESULTS PRESENTATION DISCLAIMER This presentation (the "Presentation") has been prepared and is issued by, and is the sole responsibility of Telepizza Group,
PROFIT AND LOSS REPORT FIRST HALF YEAR 2017 JANUARY - JUNE
 PROFIT AND LOSS REPORT FIRST HALF YEAR 2017 JANUARY - JUNE PROFIT INFORME AND DE LOSS RESULTADOS REPORT January Enero Junio June 2017 Table of Contents Executive Summary Key Figures Consolidated Income
Third Quarter Performance Summary. November 2, 2017
 Third Quarter 2017 Performance Summary November 2, 2017 Legal Disclaimer The facts and figures contained in this report that do not refer to historical data are future projections and assumptions. Words
Sale of LNG. Madrid,
 Sale of LNG Assets Madrid, February 26 th 2013 Table of Content 1. Summary... 3 2. Rationale of the Transaction... 4 3. Transaction details... 5 a. b. c. d. Scope... 5 Economics... 6 Accounting Impact...
April-September 2017 Results: short term impacts, long term actions. November 6, 2017
 April-September 2017 Results: short term impacts, long term actions November 6, 2017 Disclaimer This material has been prepared by Siemens Gamesa Renewable Energy, and is disclosed solely for information
Investor Day. October 2016
 Investor Day www.larespana.com October 2016 3 Disclaimer This document has been prepared by Lar España Real Estate SOCIMI, S.A. (the Company ) for information purposes only and it is not a regulated information
First Quarter 2016 Results (1Q16) May 11, 2016
 May 11, 2016") First Quarter 2016 Results (1Q16) May 11, 2016 Disclaimer This document is the property of Gas Natural SDG, S.A. (GAS NATURAL FENOSA) and has been prepared for information purposes only. As such, it cannot
First Quarter 2016 Results (1Q16) May 11, 2016 Disclaimer This document is the property of Gas Natural SDG, S.A. (GAS NATURAL FENOSA) and has been prepared for information purposes only. As such, it cannot
1H17 Results 21 July 2017
 1H17 Results 21 July 2017 Disclaimer This document has been prepared by NATURHOUSE HEALTH S.A. ( NATURHOUSE or the Company ) for its exclusive use during the presentations announcing the Company s results
Summary of Group results
 Summary of Group results NET INSTALLED CAPACITY: 9,626 MW (+813) in MW (change from 2013) By resource By geographical area By year EGP WORKFORCE: 3,609 (+140) No. of employees (change from 2013) By geographical