Fitter for the Future Strategic Update
|
|
|
- Claribel Rogers
- 6 years ago
- Views:
Transcription


1 Fitter for the Future Strategic Update
,")
2 Chairman s remarks Global strategic overview Significant market opportunity Basarab Overpass in Bucharest, Romania Naples underground (Toledo Station), Italy

3 Global strategic overview 3 Izmit Bay Bridge, Turkey Good progress made in 2016 on execution of the Strategy Plan Key drivers for the business remain: Sustainable Growth, Drivers for de-risking and Financial Strength Will continue in 2017 as we look to develop the business and capital structure in line with the strategy Geographic focus of the business continue to shift towards opportunities in most attractive global markets

4 Significant market opportunity 4 Worldwide infrastructure spending is expected to grow from $4 trillion per year in 2012 to more than $9 trillion per year by In Canada, the Government has committed to developing a 10-year infrastructure spending plan that will include the doubling of current federal infrastructure investment to $10 billion over each of 2016 and In the US, infrastructure spending is expected to grow by approx. 3% per year on average, taking the total from $700bn in 2014 to more than $975bn per year by In Europe, infrastructure investment requirements remain high with the EU Investment Plan for Europe identifying 13bn in transport infrastructure investment throughout (1) PWC, Capital project and infrastructure spending outlook 2025 (2) PWC, Future infrastructure spending in the US 2015, (3) Government of Canada, Report of Plans and Priorities (4) BAML, European Listed Infrastructure report, 1 Feb Rome Subway Line C (Station-museum San Giovanni), Italy

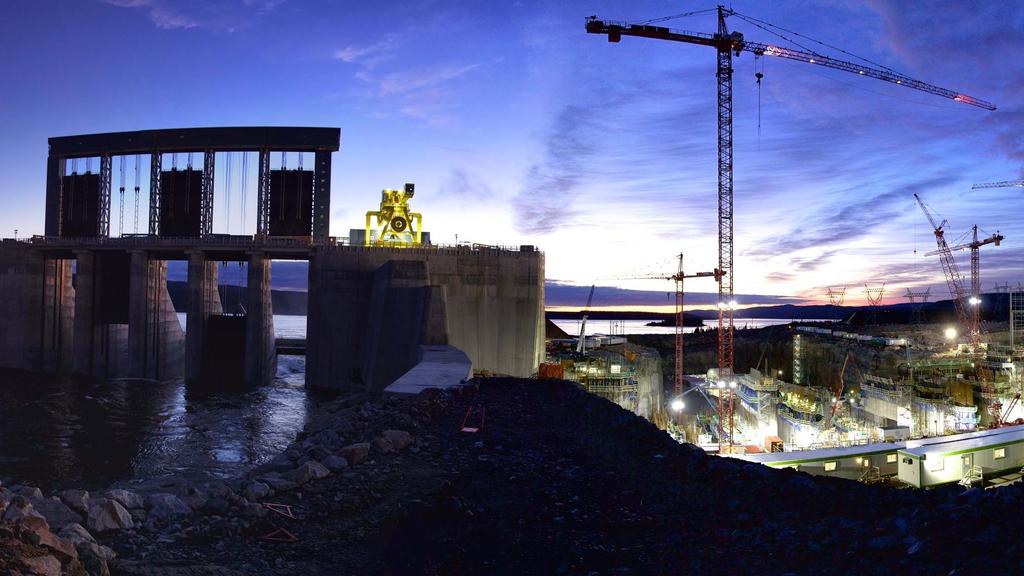
5 Chief Executive Officer Strategic update Financial targets Muskrat Falls hydroelectric plant, Canada
6 Fit for the Future Strategy Plan Objective FY16 achievement Sustainable growth Organization Drivers for de-risking Focus on EPC contracts New approach to concessions Geographic diversification > 60% of revenues coming from EPC contracts positively affecting margins and working capital New concession agreements for Arturo Merino Benitez International Airport and Western Metropolitan Hospital in Santiago (Chile) decrease concession share and increase construction exposure materially 3.6bn new construction orders heavily skewed toward low risk geographies, including USA and Europe Financial strength Debt reduction Net Debt lowered to 1.1bn by Dec 16 vs 1.4bn at June 16 Asset disposals Asset sales delivery ahead of target Working capital task force Working capital down to 805m in 2016 vs 1bn at June 2016) Strong progress made during 2016

7 Strong delivery performance 7

8 Strong progression made during 2016 on Fit for the Future Plan 8 FY 2016 Financial Targets achieved Company guidelines Revenues > 3bn CONFIRMED EBITDA Margin ~12% CONFIRMED EBIT Margin ~10% CONFIRMED Net Debt ~ 1.1bn CONFIRMED Working Capital ~ 800m CONFIRMED Capex 110m concession 48m construction CONFIRMED Naples underground, Toledo Station
9 Fitter for the Future Strategy Plan Sustainable growth EPC contracts: improve quality, lever partnerships Strengthening of O&M activities: conversion of concession backlog into O&M contracts Improved visibility on future revenue streams Drivers for de-risking Accelerated shift towards developed markets Improved project cash flow Reduction in capex Financial strength Swifter delivery of concession asset disposals Ongoing focus on gross and net debt reduction Target reduction in group financing costs UPGRADED revenue growth targets IMPROVED cash conversion of EBITDA DECREASED debt and cost of financing Organization Maximising operating effectiveness: specialization, integration, NWC task force IMPROVED business SUSTAINABILITY A higher earnings quality business

10 Third Bridge on Bosphorus, Turkey Sustainable growth

11 Continued drive to secure EPC contracts 11 Specialized EPC contractor with fully integrated offer Revenue split 2016A Enviable track record for success on large, complex projects 39% 61% World class technical and engineering skills to create innovative solutions Sustainable, visible growth Above sector average margins Advance payments aiding cashflow Going forward over 2 / 3 of revenues coming from EPC contracts EPC contracts Traditional contracts Rome Subway Line C (Station-museum San Giovanni), Italy Leveraging our areas of competitive strength

12 EPC Contracts Focus on highly attractive opportunities 12 Focus on quality tenders not competing solely on price Transport Infrastructure Water & Power Civil & Industrial Buildings Plants Multiple selection criteria No. 3 global contractor in bridges No. 14 global contractor in mass transit & rail No. 19 global contractor in highways No. 5 global contractor in hydro plants No. 19 global contractor in healthcare buildings Current major projects EPC contracts support margin development and cashflow profile I-405 motorway (USA) Gebze-Orhangazi-Izmir motorway (Turkey) Brennero underground railway tunnel (Italy) Naples-Bari HS railway (Italy) Muskrat Falls hydro plant (Canada) Upper Cisokan Pumped Storage Power Plant (Indonesia) Etlik Integrated Health Campus in Ankara (Turkey) E-ELT (Chile) West Metropolitan Hospital in Santiago (Chile) Hospitals (Italy) Railway lines (Italy) Source: 2015 ENR Global Contractor Lists ranking based on 2015 consolidated revenues Well-positioned to win multi-criteria tenders, improving earnings quality

13 EPC Contracts Quality tenders: EPC case study 13 Awarded tender for Naples-Cancello section of the Naples-Bari high-speed railway line in Italy, worth 397m in early 2017 Astaldi s share of consortium 40% Highly competitive tender process, against ~10 international players Ideal contract for Astaldi s expertise Multiple assessment criteria including price, technical abilities, environmental controls and security, project management and organisational capabilities Astaldi consortium awarded the contract despite offering the smallest price discount Achieved best overall score on account of peer group-leading operational and technical expertise Naples-Afragola high-speed railway station (part of HS Naples-Bari railway), Italy

14 EPC Contracts - Better leverage successful partnership model 14 Strong execution track record enables Astaldi to secure partnerships in developed markets with the most highly qualified international firms Case study: I-405 Highway $1.2bn contract Astaldi partnered with OHL USA, Inc., a trusted partner to local agencies, stakeholders and subcontractors in Southern California, where the company has 14 projects totalling >$500m and is a known leader in the construction of highways, toll roads and roadways with 3,700 miles already built Secure growth options by leveraging complementary skill sets Image rendering of I-405 motorway, US (California)


15 Ambition to fully exploit value chain potential 15


16 Maximising our diversified offer 16 CONSTRUCTION CONCESSION Transport Infrastructure Water & Energy Civil & Industrial Building Plan Design & Engineering Concession Participations O&M Operation and maintenance Captive business originated from existing concession contracts, especially in healthcare Complementary services, such as: housing, healthcare technologies, IT Operating model already implementable for: 7 hospitals, for a total of 6,700 beds 1 mining plant Stable source of revenues, higher margins compared to the average Low capital intensive Average contractual terms: ~ 20 years Converting concession backlog into high visibility revenues, with stable margin and low capital intensity
17 Develop revenue synergies from O&M activities 17 Converting the concession backlog into a more stable revenue opportunity Targeting 10% revenues from O&M High margin, low capital intensity, good visibility FY 2016 Total backlog ( bn) > 27bn > 27bn Concession backlog (including options) O&M Concession conversion Construction options (non O&M) Construction backlog in execution From conversion of concessions, agreements already in place: 7 hospitals with 6,700 beds, in Italy and Turkey 1 mining plant Average contract life ~20 years Construction - First in ranking/contractual increase options: Romania (railways) Poland (railways) Italy (railways) Chile (healthcare) Turkey (metro & highways) Of which: 600M booked in 1Q2017 O&M activity supports earnings quality and visibility

18 Leverage capital light concessions to support growth in O&M 18 Keep O&M activities in-house after sale of concession operations where possible Case study: Western Metropolitan Hospital in Santiago, Chile Astaldi signed an agreement with a leading global investor and asset manager specialising in transport and hospital infrastructure. Astaldi maintains 100% construction and O&M services. The contract involves construction and operation for 20 years of a 523 bed hospital Lower capital invested Lower committment for Astaldi from lower share in SPV, greater share in construction Western Metropolitan Hospital in Santiago, Chile


19 O&M activity additional driver for growth 19 Organic growth of the construction business Further significant contribution from O&M activities REVENUES Construction CAGR: 7% Total CAGR: ~9% 4.6bn Target O&M 10% of revenues New Hospital in Massa-Carrara, Italy > 3bn Construction O&M New Hospital in Mestre, Italy Further revenue growth supported by the O&M activity

20 Improved sustainable growth drives revenue upgrade 20 Plan targets 2016A CAGR Backlog Construction 10bn 7.0% Revenues 3bn ~9% Book-to-bill 1.25x 1.2x Visiblity over revenue potential remains strong 100% 80% 60% 40% 20% 100% 70% 50% 0% 2017E 2018E 2019E 2021E Existing portfolio incl. new O&M revenue stream

21 New Hospital in Naples, Italy Drivers for de-risking
22 Accelerated shift towards developed markets 22 Shift in construction backlog already underway Revenues weighted towards lower risk geographies over plan period 100% RoW Turkey 75% Russia Italy & Rest of Europe 50% Americas: +5% 25% 0% 2016A 2021E Source: Coface 2017 country risk assessments. Increase contribution of lower risk countries to revenues

 2006 2010 2021 Markets offer solid investment plans for")

23 Growing our footprint in target markets 23 BACKLOG WEIGHT ON TOTAL BACKLOG Targeting U.S., Canada, Europe, and Chile NORTH AMERICA ~1% ~1% >10% I-405 Motorway, US (California) Markets offer solid investment plans for infrastructure development CHILE _ ~1% >5% E-ELT, Chile Lower margin scope mitigated by better financing terms and improved cash-flow NORTHERN EUROPE ~5% Lodz-Fabryczna railway station, Poland Increase of lower risk countries in backlog
24 Strong, continued focus on NWC reduction 24 Projects in developed markets have a more efficient cashflow profile Focus on operational discipline to continue progression toward normalisation of advance payments (EPC) 2017 Target level of ~ 600m of advanced payments A healthier working capital cycle % 20% % FY2015 1H 2016 FY E 2021E NWC NWC / Sales Ratio (%) NWC dedicated task force to improve management of payables million Advanced payments have been outlier years levels are now normalizing NWC savings support higher cash conversion of EBITDA Dec-13 Mar-14 Jun-14 Sep-14 Dec-14 Mar-15 Jun-15 Sep-15 Dec-15 Mar-16 Jun-16 Sep-16 Dec-16 Dec-17 Dec-18 Target NWC/sales ratio of ~20%
,")
25 CAPEX rationalization 25 CAPEX evolution ( m) Focus on EPC Concession Construction Capital light approach to concessions E 2018E 2019E Strong reduction in capital expenditure Naples underground (San Pasquale station), Italy
 (940) (340) 500 EBITDA Non-cash EBITDA Core EBITDA Change in Working Capital Financial charges + Taxes Construction CAPEX Free Cashflow from Construction Image rendering of Arturo Merino")
26 Improved cash conversion of EBITDA 26 EBITDA from construction activity for period ( m) Lower cash absorption through capital light concession projects and NWC reduction > 2,100 (200) 1,900 (120) (940) (340) 500 EBITDA Non-cash EBITDA Core EBITDA Change in Working Capital Financial charges + Taxes Construction CAPEX Free Cashflow from Construction Image rendering of Arturo Merino Benitez International Airport in Santiago, Chile
27 Improved cash conversion of EBITDA 27 Plan targets 2016A 2018E 2021E Shift towards developed markets strengthens revenue mix New contracts significantly improve project cash flow dynamics Ongoing operating effectiveness further streamlines cost structure Results in improved cash conversion of EBITDA EBITDA ( m) 380m ~ 400m > 460m EBITDA margin 12.6% ~11% ~10% EBIT ( m) 317m ~ 320m ~ 360m EBIT margin 10.6% ~9% ~8% Core EBIT ( m) 229m ~ 280m ~ 330m Core EBIT margin 7.6% ~8% >7% NWC ( m) 805m ~ 740m ~ 930m NWC % revenue 27% ~20% ~20% Company Presentation April 5, 2017

28 New School for Police Officers in Florence, Italy Financial strength
29 Swifter delivery of concession asset disposals supports financial strength 29 H2 16 Q1 17 H A4 Anticipated disposal proceeds over plan period ( m) > 450m Chacayes hydro Mestre Delivered >300m ~ 300m Santiago hospital Turkish assets Milan Line 5 Santiago hospital 10m Chacayes hydro 42m Milan Line 5 65m Tuscany hospitals NEW Etlik hospital A4 Holding 110m E E ~ 250m already delivered out of > 750m disposal plan

30 Cash-flow and asset disposals to reduce debt 30 Sources & Uses of cash over plan period ( m) Sources of cash Uses of cash > 1,3bn Free Cashflow from construction 500 ~ Concession CAPEX Dividends Asset disposal + Dividends from SPV ~800 ~1,000 Gross debt reduction Etlik Integrated Health Campus in Ankara, Turkey Gross debt reduction over plan period driven by NWC action and asset disposal
 Decreased debt and improved cash flow creates group")


31 Financial strategy to lower funding costs 31 NFP evolution ( m) Decreased debt and improved cash flow creates group refinancing options 2017 envisaged refinancing program of existing debt Target: reduction of cost of debt Western High Speed Diameter in Saint Petersburg, Russia Astaldi Strategic Plan Update Presentation, Presentation, 6 April 6 April
32 Maintaining strong focus on reducing debt 32 New debt targets driven by Higher EBITDA cash conversion Swifter delivery on asset disposals Represents a 65% reduction in net debt during the plan versus 50% reduction previously Possibility to take advantage of low interest environment to reduce group finance costs Plan targets Evolution of key capital metrics E ( bn) Gross debt 2.0bn < 1.4bn ~ 900m <1.4 ~ ~ Net debt 1.1bn ~ 900m ~ 400m ~0.5 ~0.4 ~0.4 Concession Inv. capital 837m ~ 500m ~ 400m Gross debt Net debt Concession Inv. Capital 2016A 2018E 2021E

33 Lodz Fabryczna railway station, Poland Organization
34 Maximising operating effectiveness 34 Centralisation of management approach and risk controls Specialist offering capability provided on a global basis by Business Services Division Increased integration to strengthen and standardize processes Major cultural shift underway Restructured reporting lines Strengthening of O&M activities, delivering revenue Fully exploiting value chain potential Centralised knowledge hub Ensuring global, commercial excellence Dedicated working capital task force Supports growth of new orders Delivers sustainable backlog development Helps NWC efficiency Clear actions to deliver new specialized resources and integration benefits Focus on HR & HSE to support cultural change and business growth

35 E-ELT, Chile Outcomes

36 Fitter for the Future Financial Targets Working towards 2021 targets CAGR Revenue ~ 3.6bn ~ 4.6bn ~9% Book-to-bill 1.2x average through period Construction backlog > 12m ~ 14bn ~ 7% EBITDA ~ 400m > 460m EBITDA margin ~11% ~10% EBIT ~ 320m ~ 360m EBIT margin ~9% ~8% Core EBIT ~ 280m ~ 330m Core EBIT margin ~8% >7% NWC/sales ~20% ~20% Asset disposals > 500m to be delivered Net debt ~ 900m ~ 400m

37 Strong progress in 2016, with much more to come 37 Higher growth potential Continued focus on EPC contracts New revenue stream from O&M activities Sustainable growth Improved cash conversion Accelerated shift toward developed geographies Extraction of further operational efficiencies Drivers for de-risking Financial strategy to lower financing costs Swifter timetable set for delivery of disposals Ongoing NWC reduction Financial strength A higher earnings quality business
38 Fitter for the Future Strategic Update
FY16 Results Presentation
 Muskrat Falls Hydro Plant, Canada FY16 Results Presentation March 14, 2017 Agenda Warsaw subway Line 2, Poland 2016 Highlights Q4 & FY16 results Appendix 2 Fit for the Future our Strategy Plan Sustainable
H results 2 August 2017
 H1 2017 results 2 August 2017 Delivering the Strategy Plan 2 Sustainable growth Operational discipline Financial strength Major operational milestones met on time Commercial growth continues Revenue geographic
FY 2015 Results Presentation Conference Call March
 3 rd Bridge on Bosphorus Turkey The largest suspended bridge at worldwide level FY 2015 Results Presentation Conference Call March 9 2016 1 Over the Last 10 Years Investments have supported a Consistent
2015 Nine Months Results
 1. Update on Disposals 2. Update on Special Issues 3. New Orders & Backlog 4. 9M 2014 Results 5. Appendix 2015 Nine Months Results Rome - November 11, 2015 3 rd Bridge on Bosphorus, Turkey 2015 Nine Months
Strategy Plan E Fit for the Future. May 2016
 Strategy Plan 2016-20E Fit for the Future May 2016 Agenda Chairman s remarks Strategy Plan 2016-2020 Q1 2016 Results Appendix 2 Chairman s remarks Transition to renewed BUSINESS MODEL addressing challenges
9M 2017 results 14 November 2017
 9M 2017 results 14 November 2017 Agenda 2 Capital and financial strengthening Program Venezuela write-down 9M Results A comprehensive capital and financial strengthening program 3 A 400 million capital
9M 2013 Results. November 11, 2013
 9M 2013 Results November 11, 2013 1 1 GOALS AND ACHIEVEMENTS FOR 2013 OUR GOALS OUR ACHIEVEMENTS Financial close and start-up of Turkish projects Financial support to domestic projects in order to deliver
1H 2015 Results A Durable Competitive Advantage
 A Durable Competitive Advantage Rome August 3, 2015 Main Topics STRONG 1H 2015 RESULTS BENEFITING FROM A GOOD COMMERCIAL AND OPERATING PERFORMANCE Total Revenue +15.8%, at EUR 1.4 billion Operating revenue
Milan STAR Conference - FY 2014 Results
 1. Update on Disposals 2. Update on Special Issues 3. New Orders & Backlog 4. 9M 2014 Results 5. Appendix Milan STAR Conference - FY 2014 Results Milan March 24 & 25, 2015 FY 2014 Results Main Items FY
FY 2012 Results. March 13 th, 2013
 FY 2012 Results March 13 th, 2013 ASTALDI GROUP FY 2012 RESULTS Conference Call, March 13 2013 1 1 2012 RESULTS OVERALL OUTLOOK Positive Group performance in a very difficult year both in the domestic
COMPANY PRESENTATION. FY 2017 Results. March 15, 2018
 COMPANY PRESENTATION FY 2017 Results March 15, 2018 2 Agenda Capital and Financial Strengthening Program FY 2017 Results Appendix Capital and Financial Strengthening Program Key Features 3 300 M CAPITAL
1Q 2011 Results Conference call May 11, 2011
 1Q 2011 Results Conference call May 11, 2011 Growing steadily since 1920 1 1Q 2011 Results main items Total revenues up +10.1% to 511M, thanks to the positive trend of activities in Italy and abroad Net
RESULTS AT 30 SEPTEMBER 2016
 Astaldi s Board of Directors approves Group s results at 30 September 2016 RESULTS AT 30 SEPTEMBER 2016 REVENUES FOR FIRST NINE MONTHS, UP BY 4.1% TO EUR 2.15 BILLION, NET PROFIT FROM CONTINUING OPERATIONS,
2012 LONDON STAR Conference. London, 2 3 October 2012
 2012 LONDON STAR Conference London, 2 3 October 2012 1 1 ASTALDI is the largest Contractor in Italy, operating only in large infrastructures at worldwide level Construction RoW 42% ( 4.2Bn) Construction
ASTALDI Società per Azioni Head Office: Via Giulio Vincenzo Bona Rome (Italy) Registered with the Companies Register of Rome Tax code no.
 Registered with the Companies Register of Rome Tax code no.") Interim Report on Operations at 31 March 2017 1 ASTALDI Società per Azioni Head Office: Via Giulio Vincenzo Bona 65-00156 Rome (Italy) Registered with the Companies Register of Rome Tax code no.: 00398970582
Interim Report on Operations at 31 March 2017 1 ASTALDI Società per Azioni Head Office: Via Giulio Vincenzo Bona 65-00156 Rome (Italy) Registered with the Companies Register of Rome Tax code no.: 00398970582
EBIT margin of 10%, with EBIT amounting to EUR 57.4 million (+9.4%) Net profit of EUR 21.2 million (+3.0%)
 Net profit of EUR 21.2 million (+3.0%)") FIRST NINE MONTHS FOR ASTALDI: NET PROFIT UP BY 1.6% TO EUR 61.4 MILLION NEW ORDERS TOTALLING EUR 4.2 BILLION ORDER BACKLOG UP BY 24.5% TO EUR 12.7 BILLION Consolidated results at 30 September 2013 Total
FIRST NINE MONTHS FOR ASTALDI: NET PROFIT UP BY 1.6% TO EUR 61.4 MILLION NEW ORDERS TOTALLING EUR 4.2 BILLION ORDER BACKLOG UP BY 24.5% TO EUR 12.7 BILLION Consolidated results at 30 September 2013 Total
Building a stronger Astaldi
 Building a stronger Astaldi Investor presentation May 16, 2018 Disclaimer 1 THIS PRESENTATION IS NOT AN OFFER OR AN INVITATION TO BUY OR SELL SECURITIES. IMPORTANT: Please read the following before continuing.
Interim Financial Report at 31 March 2014
 Interim Financial Report at 31 March 2014 Total revenues of EUR 551.6 million (+3.8%) EBITDA margin up to 13.3%, with EBITDA totalling EUR 73.4 million (+24.4%) EBIT margin of 10.5%, with EBIT totalling
ASTALDI, REVENUES OF EUR 1.8 BILLION, +4.6% DURING THE FIRST NINE MONTHS OF THE YEAR and NET PROFIT OF EUR 60 MILLION, +14.5%
 The Board of Directors approves the consolidated results at 30 September 2012 ASTALDI, REVENUES OF EUR 1.8 BILLION, +4.6% DURING THE FIRST NINE MONTHS OF THE YEAR and NET PROFIT OF EUR 60 MILLION, +14.5%
2010 Q1 RESULTS. Conference call - May 12, 2010
 2010 Q1 RESULTS Conference call - May 12, 2010 Q1 2010 Results Overview The Group continues to perform well even in the midst of a negative scenario Total revenues: +6.9% at EUR 460.7mn EBITDA:+10.5% at
Interim Report on Operations at 30 September 2016
 (Translation from Italian original which remains the definitive version Translation under review) Interim Report on Operations at 30 September 2016 Financial results at 30 September 2016, in line with
Building a stronger Astaldi
 Building a stronger Astaldi Investor Presentation June 2018 Disclaimer 1 THIS PRESENTATION IS NOT AN OFFER OR AN INVITATION TO BUY OR SELL SECURITIES. IMPORTANT: Please read the following before continuing.
Astaldi in 2010: Net profit of EUR 62.6 million, +12% Revenues of EUR 2 billion, +9.2% Reduction of debt to EUR 384 million, 8.8%
 Astaldi s BoD has approved the consolidated results of Q4 2010 (unaudited) and examined the preliminary consolidated results of 2010 Astaldi in 2010: Net profit of EUR 62.6 million, +12% Revenues of EUR
- October, Pont Ventoux Hydroelectric (Venezuela) (Italy) (Italy) Hospital in Mestre. Milan Subway, Line 5. Rome Subway, Line C (Italy)
 (Italy) (Italy) Hospital in Mestre. Milan Subway, Line 5. Rome Subway, Line C (Italy)") - October, 2009 - Rome Subway, Line C Caracas-Tuy Railway Hospital in Mestre Milan Subway, Line 5 Pont Ventoux Hydroelectric (Venezuela) Power Plant 2009-2013 Business Plan as of today 2009-20132013 Business
- October, 2009 - Rome Subway, Line C Caracas-Tuy Railway Hospital in Mestre Milan Subway, Line 5 Pont Ventoux Hydroelectric (Venezuela) Power Plant 2009-2013 Business Plan as of today 2009-20132013 Business
Translation from the Italian original, that remains the definitive version. Interim Report on Operations at 30 September 2017
 Interim Report on Operations at 30 September 2017 ASTALDI Società per Azioni Head Office: Via Giulio Vincenzo Bona 65-00156 Rome (Italy) Registered with the Companies Register of Rome Tax code No.: 00398970582
PRESS RELEASE THE YEAR
 PRESS RELEASE The Board of Directors of Astaldi approves the 2013 half-yearly results ASTALDI: NET PROFIT OF OVER EURR 40 MILLION, +1% DURING D THE FIRST HALF OF THE YEAR NEW ORDERS OF EUR 2.4 BILLION
ASTALDI: +14.8% INCREASE IN TOTAL REVENUES TO EUR 2.36 BILLION IN 2011 NET PROFIT OF EUR 71 MILLION, +12.9%
 The BoD of Astaldi approves the consolidated results at 31 December 2011 ASTALDI: +14.8% INCREASE IN TOTAL REVENUES TO EUR 2.36 BILLION IN 2011 NET PROFIT OF EUR 71 MILLION, +12.9% PROPOSED DIVIDEND OF
Astaldi Group Annual Financial Report
 This translation from the Italian original is for reference purposes only. In the event of any discrepancy, the Italian original shall prevail. Astaldi Group Annual Financial Report 0 This translation
Interim Report on Operations at 30 September 2015
 Interim Report on Operations at 30 September 2015 Main consolidated results: - Total revenue up to EUR 2.1 billion (+11.6% compared to 30 September 2014) - EBITDA margin of 11.7%, with EBITDA of EUR 242.8
February 10, Astaldi. 4Q 2004 and 2004 Preliminary Results
 Astaldi 4Q 2004 and 2004 Preliminary Results February 10, 2005 1 Main Highlights (Million of euro) 2004 yoy 2006 CAGR 03-06 2004 RESULTS ABOVE 2004-2006 STRATEGIC PLAN TARGETS Order backlog 5,011 13.7%
THE BOARD OF DIRECTORS OF ASTALDI APPROVES A SHARE CAPITAL INCREASE UP TO A MAXIMUM OF EUR 300 MILLION AND CALLS THE SHAREHOLDERS MEETING
 THE BOARD OF DIRECTORS OF ASTALDI APPROVES A SHARE CAPITAL INCREASE UP TO A MAXIMUM OF EUR 300 MILLION AND CALLS THE SHAREHOLDERS MEETING 2018-2022 STRATEGIC PLAN AND CONSOLIDATED RESULTS OF Q1 2018 ALSO
INTERIM REPORT ON OPERATIONS AT 31 MARCH Astaldi, consolidated net profit up by 14%
 INTERIM REPORT ON OPERATIONS AT 31 MARCH 2010 1 Astaldi, consolidated net profit up by 14% Total revenues up by 6.9% to EUR 460.7 million EBITDA: +10.5% to EUR 51.8 million, with the EBITDA margin up to
PRESS RELEASE S +7.5% TO
 PRESS RELEASE The Board of Directors of Astaldi approves the 2012 half-yearly results ASTALDI: AT 30 JUNE 2012, NET PROFIT +13.6% TO T EUR 39.8 MILLION TOTAL REVENUES S +7.5% TO EUR 1.2 BILLION NEW ORDERS
Astaldi Group Annual Financial Report
 Note: This English translation is for reference purposes only. This English translation is under review. In the event of any discrepancy between the Italian original and this English translation, the Italian
Astaldi. Italian Investment Seminar April 27, 2005
 Astaldi Italian Investment Seminar April 27, 2005 1 2004-2006 2006 Plan 2005-2009 2009 Plan >> The strong operating capacity of the Group, both in Italy and abroad, as proven by: The efficacy of 2004-2006
ASTALDI: AT 30 JUNE 2011, NET PROFIT +12.4% TO EUR 35 MILLION TOTAL REVENUES +14.3% TO OVER EUR 1.1 BILLION NEW ORDERS OF OVER EUR 1.
 The Board of Directors of Astaldi has approved the 2011 half-yearly results ASTALDI: AT 30 JUNE 2011, NET PROFIT +12.4% TO EUR 35 MILLION TOTAL REVENUES +14.3% TO OVER EUR 1.1 BILLION NEW ORDERS OF OVER
2006 Second Quarter Results. August 1, 2006
 2006 Second Quarter Results August 1, 2006 1 Foreign activities are a strategic asset that guarantees further business development 2006 Second Quarter Results Strong increase in order backlog (+28% yoy)
THE BOARD OF DIRECTORS APPROVES THE RESULTS AT 31 DECEMBER THE BoD EXAMINED THE PROPOSAL OF CAPITAL AND FINANCIAL STRENGTHENING PROGRAMME
 THE BOARD OF DIRECTORS APPROVES THE RESULTS AT 31 DECEMBER 2017 THE BoD EXAMINED THE PROPOSAL OF CAPITAL AND FINANCIAL STRENGTHENING PROGRAMME Capital and financial strengthening programme The Company
Astaldi Business Plan. Milan November 15 th, 2012
 Astaldi 2012-2017 Business Plan Milan November 15 th, 2012 1 1 Executive summary 1 Concession: cash-in value to support the growth 2 2012-2017 Business Plan: targets and drivers 3 2012-2017 Business Plan:
Interim Report on Operations at 31 March 2012
 Interim Report on Operations at 31 March 2012 Increase in profits and revenues despite effects of seasonal factors, already largely made up during the early part of Q2. Total revenues of EUR 522.3 million
CIBC Industrials Conference. Alexandre L Heureux May 18, 2016
 CIBC Industrials Conference Alexandre L Heureux May 18, 2016 A LEADING GLOBAL PROFESSIONAL CONSULTING FIRM 2 Focus on professional services (no construction risk) Solid technical expertise Global presence
Business Plan Business Plan
 1 : the scenario The takes account of changes in the domestic scenario, such as: Change in Italian Government and consequent redefinition of public expenditure priorities, causing a slowdown in construction
ASTALDI: NET PROFIT UP +20.1% AT 32 MILLION EUROS NET INDEBTEDNESS DOWN TO MILLION EUROS
 The Board of Directors has approved the Intermediate Report at 30 September 2008 ASTALDI: NET PROFIT UP +20.1% AT 32 MILLION EUROS NET INDEBTEDNESS DOWN TO 467.7 MILLION EUROS Main consolidated data at
Presentation of the Group
 The world s leading infrastructure developer Presentation of the Group Key figures & Global Strategy July 2012 Grupo ACS The world s leading infrastructure & concessions developer Engineering contractor
ASTM GROUP Investor Presentation 2018
 ASTM GROUP Investor Presentation 2018 2 ASTM GROUP DISCLAIMER This document (the document ) has been prepared by ASTM Group (the Company ) for the sole purpose described herein. Under no condition should
THE BOARD OF DIRECTORS HAS EXAMINED A CAPITAL AND FINANCIAL STREGTHENING PROGRAMME AND APPROVED THE INTERIM REPORT ON OPERATIONS AT 30 SEPTEMBER
 PRESS RELEASE THE BOARD OF DIRECTORS HAS EXAMINED A CAPITAL AND FINANCIAL STREGTHENING PROGRAMME AND APPROVED THE INTERIM REPORT ON OPERATIONS AT 30 SEPTEMBER 2017 Equity and financial consolidation The
2005 First Half Consolidated Results
 2005 First Half Consolidated Results 1 Index 1H 2005 Results Transition to IFRS: main impacts Appendix 2 1H 2005 Main Highlights The following data and all comparisons with previous periods are based on
Translation under review from the Italian original, that remains the definitive version. This report has been translated into the English language
 Annual Financial Report 2015 0 ASTALDI Società per Azioni Registered Office/Head Office: Via Giulio Vincenzo Bona 65-00156 Rome (Italy) Registered with the Companies Register of Rome Tax code no.: 00398970582
(Translation from the Italian original which remains the definitive version)
") (Translation from the Italian original which remains the definitive version) Interim Financial Report at 30 June 2014 I ASTALDI Società per Azioni Registered Office/Head Office: Via Giulio Vincenzo Bona
(Translation from the Italian original which remains the definitive version) Interim Financial Report at 30 June 2014 I ASTALDI Società per Azioni Registered Office/Head Office: Via Giulio Vincenzo Bona
Goldman Sachs Emerging Companies Conference Presentation - May Presented by: Andrew Buckley, Managing Director
 Goldman Sachs Emerging Companies Conference Presentation - May 2011 Presented by: Andrew Buckley, Managing Director 1 Cardno Overview and Strategy Indicative Projects Financial i Overview Cardno Outlook
STAR Conference
 1H 2014 Results Value Building Strategy Astaldi Today Outlook Appendix ASTALDI @ STAR Conference London - October 2&3, 2014 Agenda Value Building Strategy Astaldi Today Outlook Appendix Latest news & 1H
Investor Day April 2010 INVESTMENT STRATEGY. Mr. DAVID DIAZ Corporate Development Director
 Investor Day April 2010 INVESTMENT STRATEGY Mr. DAVID DIAZ Corporate Development Director abertis: Investment strategy 1. An overview of the infrastructure market 2. abertis strategy 3. A robust methodology
Enel Green Power 9M 2015 consolidated results
 Enel Green Power Rome November 13, 2015 Agenda Overview of recent events Analysis of results Closing remarks 1 Active portfolio management Exit from El Salvador Cash-in: 224 m Capital gain: 123 m Entry
2017. Future and concreteness.
 annual report 2017. Future and concreteness. Construction means imagination, design, giving shape to the future. OPENING LAYING OF THE FIRST STONE AWARD 11 October 2017 Opening of the Arts and Science
H FINANCIAL RESULTS. Milan September 18 th, 2018
 H1 2018 FINANCIAL RESULTS Milan September 18 th, 2018 1 AGENDA H1 2018 Highlights o o o Group overview Results by business Outlook Financial results Appendix 2 H1 2018 Financial Highlights Organic sales
H Financial Results
 Milan August 1 st, 2013 1 AGENDA H1 2013 Highlights & FY 2013 Outlook Financial Results Appendix 2 H1 2013 Key Financials Euro Millions, % on Sales Sales Adjusted EBITDA (3) Adjusted EBIT (4) -1.8% * 7,973
Astaldi, the BoD approves the quarterly report at September 30, 2006
 Astaldi, the BoD approves the quarterly report at September 30, 2006 Total revenues of 766.6 million Group net profit for the first nine months of 2006 of 22.6 million Total orders backlog of over 8 billion
ASTALDI, NET PROFIT INCREASED BY 16.7% TO EURO 10.2 MLN ORDER BACKLOG OUTREACHES EURO 8.5 BLN
 ASTALDI, NET PROFIT INCREASED BY 16.7% TO EURO 10.2 MLN ORDER BACKLOG OUTREACHES EURO 8.5 BLN Main consolidated data as at March 31, 2008 Total revenues scored Euro 334.1 million, +26.4% on an annual basis
Strategic Review ELIOR GROUP Develop, Innovate, Accelerate. September 24, 2015
 Strategic Review 2016-2020 ELIOR GROUP 2020 Develop, Innovate, Accelerate September 24, 2015 EXECUTIVE SUMMARY 2020 STRATEGY: Develop, Innovate, Accelerate 1 2 3 ELIOR A successful growth story Track record
Investor Presentation. December 2017
 Investor Presentation December 2017 DISCLOSURE REGARDING FORWARD-LOOKING STATEMENTS This presentation contains, and the officers and directors of the Company may from time to time make, statements that
Second Quarter & First Half Year Results 2015 Neil McArthur, Chief Executive Officer Renier Vree, Chief Financial Officer July 29, 2015
 Second Quarter & First Half Year Results 2015 Neil McArthur, Chief Executive Officer Renier Vree, Chief Financial Officer July 29, 2015 1 Disclaimer Statements included in this presentation that are not
Strategic Review Financial Highlights. Business opportunities. Results by business
 March 2004 Strategic Review 2003 Financial Highlights Business opportunities Results by business Conclusions A Construction & Services Market Reference # 1 in Spanish Construction # 1 in Industrial Services
Presentation to Investors. December 2013
 Presentation to Investors December 2013 Who we are Engineering contractor and greenfield developer Revenues 2012 > 38 bn Current Backlog 67 bn Civil Engineering Industrial Engineering Construction Environment
Forward Looking Statements
 Kingspan 2015 Full Year Results 22 nd February 2016 Disclaimer Forward Looking Statements This presentation contains certain forward-looking statements including, without limitation, regarding the Group
Going Global Strategic Plan. Going Global Strategic Plan JULY 2017
 Going Global 2017-2021 Going Global JULY 2017 2 DISCLAIMER This document (the document ) has been prepared by and SIAS Group (the companies ) for the sole purpose described herein. Under no condition should
Creating a Uniquely Global and Integrated Infrastructure Group. October 2017
 Creating a Uniquely Global and Integrated Infrastructure Group 1 October 2017 Agenda 1. Transaction Overview 2. Rationale for the Combination 3. Profile of the New HOCHTIEF 4. Key takeaways for ACS 2 Strategic
FY16 Preliminary Financial Results
 we build value FY16 Preliminary Financial Results FY16 Preliminary Financial Results Agenda Business Update Pietro Salini Chief Executive Officer Financial Update Massimo Ferrari General Manager Finance
2018 half-year results presentation. 15 August 2018
 2018 half-year results presentation 15 August 2018 Forward-looking statements This presentation may include certain forward-looking statements, beliefs or opinions, including statements with respect to
Investor presentation
 Investor presentation Important information Forward-Looking Statements and Risks & Uncertainties This document and the related oral presentation contain, and responses to questions following the presentation
ROADSHOW USA - June 2001
 ROADSHOW USA - June 2001 1 This presentation has been prepared by VINCI for information purposes only. It is based on sources we believe to be reliable but neither its accuracy nor completeness is guaranteed.
For personal use only. FY2016 Earnings Guidance. Acquisition of Lawrence Group. July 2016
 FY2016 Earnings Guidance Acquisition of Lawrence Group July 2016 Disclaimer This Document should not be considered as an offer or invitation to subscribe for or purchase any securities in OTOC Limited
Q RESULTS BRUSSELS, 23 JULY 2015 WOLFGANG M. NEUMANN, PRESIDENT & CEO KNUT KLEIVEN, DEPUTY PRESIDENT & CFO
 Q2 2015 RESULTS BRUSSELS, 23 JULY 2015 WOLFGANG M. NEUMANN, PRESIDENT & CEO KNUT KLEIVEN, DEPUTY PRESIDENT & CFO Park Inn by Radisson Istanbul Ataturk Airport 1 I Q2-2015 Results Strengthening our position
9M 2018 FINANCIAL RESULTS. November 7, 2018
 9M 2018 FINANCIAL RESULTS November 7, 2018 DISCLAIMER This document has been prepared by Maire Tecnimont S.p.A. (the Company ) solely for use in the presentation of its financial results. This document
H Financial Results. Milan July 28th, 2016
 H1 2016 Financial Results Milan July 28th, 2016 Agenda H1 2016 Highlights o o o Group overview Results by business Outlook Financial results Appendix H1 2016 Financial Results 2 H1 2016 Highlights Organic
Lindorff. Company Presentation. November 2016
 Lindorff Company Presentation November 06 Disclaimer IMPORTANT INFORMATION Not for distribution in or into the United States, Australia, Canada, Japan or any other jurisdiction in which such distribution
13 APRIL WestConnex M4 East, New South Wales. Refer to ASX/Media Release for further information
 ANALYST AND INVESTOR PRESENTATION 1Q17 RESULTS Marcelino Fernández Verdes, Executive Chairman Adolfo Valderas, Chief Executive Officer Angel Muriel, Chief Financial Officer WestConnex M4 East, New South
FY 2016 Financial Results. Milan March 1st 2017
 FY 2016 Financial Results Milan March 1st 2017 Agenda FY 2016 Highlights o o Group overview Results by business Financial results Appendix FY 2016 Financial Results 2 FY 2016 Highlights Adj. EBITDA at
This presentation is being distributed to professional investors only and may not be reproduced, redistributed or published in whole or in part.
 2009 Annual Results Disclaimer This document has been prepared by Vianini Lavori S.p.A. for information purposes only and it is not intended as an offer or solicitation of an offer to purchase or sell
Investor Presentation February Alaskan Way Viaduct (SR 99) Replacement Project, Seattle
 Replacement Project, Seattle") Investor Presentation February 2019 Alaskan Way Viaduct (SR 99) Replacement Project, Seattle Forward-Looking Statements Statements contained in this presentation that are not purely historical are forward-looking
Investor Presentation February 2019 Alaskan Way Viaduct (SR 99) Replacement Project, Seattle Forward-Looking Statements Statements contained in this presentation that are not purely historical are forward-looking
For personal use only. Tempo Australia Ltd (ASX:TPP) Investor Presentation 27 th July An emerging resource services company
 Investor Presentation 27 th July An emerging resource services company") Tempo Australia Ltd (ASX:TPP) Investor Presentation 27 th July 2012 An emerging resource services company Disclaimer This presentation by Tempo Australia Ltd and the information contained herein should
Tempo Australia Ltd (ASX:TPP) Investor Presentation 27 th July 2012 An emerging resource services company Disclaimer This presentation by Tempo Australia Ltd and the information contained herein should
Ordinary General Shareholders' Meeting of
 Ordinary General Shareholders' Meeting of 8 May 2018 Speech by the CEO Marcelino Fernández Verdes Introduction Fellow shareholders, good morning and many thanks for attending this General Shareholders'
Kepler Cheuvreux Autumn Conference. Paris, 18 September 2014
 Kepler Cheuvreux Autumn Conference Paris, 18 September 2014 2014 first half highlights Berjaya Central Park (Kuala Lumpur) 2014 first half: a solid economic performance on a global scale Group revenue
FULL RESULTS TO 31 DECEMBER 2013 INVESTOR ROADSHOW. David Prentice, Chief Executive Gordon Davidson, Chief Financial Officer
 FULL RESULTS TO 31 DECEMBER 2013 INVESTOR ROADSHOW David Prentice, Chief Executive Gordon Davidson, Chief Financial Officer PERFORMANCE SNAPSHOT Financial snapshots Revenue up 13% EBIT increase of $4.2m
Investor presentation. H results September 26, 2017
 Investor presentation H1 2017 results September 26, 2017 Speakers of the day Sébastien CLERC Chief Executive Officer Joined Voltalia in 2011 Marie de LAUZON Chief Administrative Officer Joined Voltalia
Elis 2017 annual results MARCH 7, 2018
 Elis 2017 annual results MARCH 7, 2018 Forward looking statements This document may contain information related to the Group s outlook. Such outlook is based on data, assumptions and estimates that the
2009 Annual Figures C O N N E C T I N G B U S I N E S S & T E C H N O L O G Y
 2009 Annual Figures 23.2.09 11 Contents Devoteam: brief presentation 2009 achievements and figures Outlook & strategy 2 Devoteam 10+ years of international expansion EMEA Consultancy Devoteam Group founded
ENEL STRATEGIC PLAN: FULL SPEED AHEAD ON DIGITALISATION AND CUSTOMERS
 Media Relations Investor Relations T +39 06 8305 5699 T +39 06 8305 7975 F +39 06 8305 3771 F +39 06 8305 7940 ufficiostampa@enel.com investor.relations@enel.com enel.com enel.com ENEL 2018-2020 STRATEGIC
BAML Conference - Miami
 BAML Conference - Miami Francois Luscan, President & CEO Xavier Leclerc de Hauteclocque, CFO December 3, 2013 Forward Looking Statement This presentation may include forward-looking statements. Forward-looking
September 11, Corporate Update. Rich Tobin, President & Chief Executive Officer
 September 11, 2018 Corporate Update Rich Tobin, President & Chief Executive Officer Forward-Looking Statements and Non-GAAP Measures Our comments may contain forward-looking statements that are inherently
2017 Preliminary Results. 1 March 2018
 1 March 2018 Forward-Looking Statement Any forward-looking statements made in this presentation have been made in good faith based on the information available as of the date of this presentation and are
Enel Green Power business plan. Rome - April 3 rd 2014
 Enel Green Power 20142018 business plan Rome April 3 rd 2014 EGP 20142018 business plan Agenda Snapshot on 2013 key achievements F. Starace, CEO Focus on geothermal R. Deambrogio, Head of Italy & Europe
ASTM GROUP. Investor Presentation 9M18 Results
 Investor Presentation 9M18 Results 2 This document (the document ) has been prepared by ASTM Group (the Company ) for the sole purpose described herein. Under no condition should it be interpreted as an
Agenda. 1. Highlights FY 2012 Results. 2. Operational Performance Priorities for Financials. 5. Conclusion
 1MARCH 2013 Legal Disclaimer Information in this presentation may involve guidance, expectations, beliefs, plans, intentions or strategies regarding the future. These forward-looking statements involve
For personal use only
 18 OCTOBER 2016 3Q CASH FLOW FROM OPERATING ACTIVITIES UP 7.3% YOY TO $533M, AN EBITDA CONVERSION RATE OF 192% IN LAST 12 MONTHS (LTM), WHICH ADJUSTS FOR SEASONALITY, EBITDA CONVERSION RATE OF 107% 9M16
Interim Report 9m Investors and Analysts Conference Call on November 10, 2009 Herbert Bodner, CEO
 Interim Report 9m 2009 Investors and Analysts Conference Call on November 10, 2009 Herbert Bodner, CEO 9m 2009: Highlights Increased earnings in services business Risk provision in Civil Outlook confirmed
2018 FINANCIAL RESULTS. March 14, 2019
 2018 FINANCIAL RESULTS March 14, 2019 DISCLAIMER This document has been prepared by Maire Tecnimont S.p.A. (the Company ) solely for use in the presentation of its financial results. This document does
Investor Presentation May Alaskan Way Viaduct (SR 99) Replacement Project, Seattle
 Replacement Project, Seattle") Investor Presentation May 2018 Alaskan Way Viaduct (SR 99) Replacement Project, Seattle Forward-Looking Statements Statements contained in this presentation that are not purely historical are forward-looking
Investor Presentation May 2018 Alaskan Way Viaduct (SR 99) Replacement Project, Seattle Forward-Looking Statements Statements contained in this presentation that are not purely historical are forward-looking
Jefferies 10 th Annual Global Industrials Conference
 Jefferies 10 th Annual Global Industrials Conference August 2014 www.jacobs.com worldwide Forward-Looking Statement Disclaimer Statements included in this presentation that are not based on historical
INTERIM REPORT ON OPERATIONS AT MARCH 31, 2008
 1 INTERIM REPORT ON OPERATIONS AT MARCH 31, 2008 CONTENTS Introduction Reclassified consolidated income statement Reclassified consolidated balance sheet and financial position Comments on the Group s
Solid performance in an uncertain market
 Solid performance in an uncertain market Group operational EBITDA 1 margin stable vs Q2 2012, including Power Products Orders and revenues supported by better geographic balance in automation Strong divisional