On the structure of Italian households consumption patterns during the recent crises
|
|
|
- Beverly Heath
- 5 years ago
- Views:
Transcription
1 On the structure of Italian households consumption patterns during the recent crises Antonio Bassanetti Concetta Rondinelli Filippo Scoccianti VERY PRELIMINARY. PLEASE DO NOT QUOTE. Abstract This paper reviews the evolution of the Italian household consumption during the recent crises. We first provide a comparison between macro data, recovered from the National Accounts, and micro data, from the Household Budget Survey, and show that the main aggregates from the two sources behave in a similar way over time. We then inspect the typologies of households that most suffered from the recent economic crises and provide evidence of sizeable re-composition effects in their consumption patterns. Specifically, younger households faced an increase in the share of housing and food expenses, by compressing the expenditure share of non-basic items; the proportion of housing related consumption increased for working age household heads too, while it decreased for retired. budget shares to a change in relative prices and expenditure. Keywords: micro and macro data, expenditure, food, housing. JEL Codes: D1, C4. Finally, we investigate the reaction of International Monetary Fund, Washington, USA. ABassanetti@imf.org Bank of Italy, Economic Outlook and Monetary Policy Directorate, via Nazionale, 91, Roma Italy. concetta.rondinelli@bancaditalia.it. Corresponding author Bank of Italy, Economic Outlook and Monetary Policy Directorate, via Nazionale, 91, Roma Italy. filippo.scoccianti@bancaditalia.it We are grateful to A. Brandolini and S. Siviero for their useful comments on a preliminary version of the paper. The usual disclaimer applies: the opinions expressed in this paper are those of the authors and do not involve the Bank of Italy. 1
2 1 Introduction The fall in real consumption of Italian households observed over the recent economic crises has been particularly severe, amounting to 4.5% in according to annual National Accounts data; in the same period GDP contracted by 5.8% and real disposable income by 8.3%. The unprecedented drop in household expenditure reflected the effects of the fall in disposable income, arising from the public finance measures, as well as heightened uncertainty and lower confidence levels (Busetti and Cova, 2013). Differently from the Global Financial crisis ( ), the Sovereign Debt crisis was mainly due to factors affecting domestic demand, which jointly account for about two third of the downturn in GDP recorded between mid 2011 and end Given that household consumption represents over 60% of GDP, a sound understanding of its evolution during the recent recessions is useful to correctly appraise its path in the course of the ongoing recovery. Two consecutive recessions in five years may have induced Italian households not only to reduce their expenditure levels, but also to adjust its composition. These adjustments stem from several mechanism: a) the shift in the budget constrain determined by the fall in real disposable income; b) variations in the slope of the budget constraint due to changes in relative prices; c) changes in preferences. The severe contraction in income experienced over the recent years is likely to have induced a re-composition in consumption: in order to minimize the impact of the fall of income on basic, not-easy-to compress expenses (such as rents, health that are inelastic to income), households reshaped their consumption for leisure items, such as clothing and footwear, recreation and culture, accommodation and restaurants. The crises may have also induced a change in households preferences, with a reduction in the quality of purchased goods and a more widespread recourse to discounts. Pozzolo (2011), for example, finds that during the Global financial crisis Italian families consumed more chicken, reducing the quantity of veal and preferred cheaper outlet types, such as discounts. In this paper we ask whether the reduction in consumption that occurred in the last recessions (i) indeed affected budget shares, and if so, whether (ii) the impact was differentiated across households types. We preliminary provide a comparison between National Accounts 2
3 data (macro-data) and the aggregation of the Household Budget Survey (micro-data). It is a widely held view that macro and micro consumption statistics differ markedly (Maki and Garner, 2010; Maki and Nishiyama, 1993), given the underreporting in micro Surveys. We find that in Italy the main consumption aggregates show differences in levels but similar dynamics, once we properly harmonize the definition of households and the classification of services and goods in the two datasets. According to both datasets, the budget shares of leisure expenditures (such as clothing and footwear, furniture and household services) declined, while the share of housing expenditures rose; the share for food remained roughly unchanged. We then turn to analysing whether the effects differed across the population, examining the evolution of the budget shares for households with different socio-demographics characteristics in the pre-crisis ( ) and post-crisis ( ) period. Households in the lowest deciles of the consumption distribution lowered the budget shares allocated to clothing and footwear, transport, furniture and accommodation and restaurants; by contrast, the share of food and housing, which are non-negligible needs, increased. Households in the upper tail of the consumption distribution reduced all the expenses for furniture and other household services, clothing and footwear and slightly rose the one for accommodation and restaurants. We also observe a regularity across age groups: although on average the budget share for food did not change, during the Sovereign Debt crisis younger households increased the share for food and housing, compressing all the others. From the descriptive analysis it emerges that the evolution of the budget shares over the recent crisis may have reflected both (1) an income effect, (2) a change in the relative prices and (3) a change in preferences. As a first attempt to account for the first two effects, we estimate a system of demand equation focussing on a sample of goods representing about 17% of the items included in Consumer Price Index. We find that while the financial crisis left the consumption profiles of Italian households almost unchanged, the Sovereign debt crisis operated a recomposition of consumption structure increasing the heterogeneity in habits. The reminder of the paper is organized as follows. In Section 2 we provide a comparison between macro and micro consumption data available for Italy and describe the evolution of 3
4 the main expenditure aggregates in the recent recessions. Section 3 presents the heterogeneous attitudes adopted by Italian families vis-à-vis the double recessions and identifies the typologies of households that most suffered from the recessions. In Section 4 we show how a change in relative prices and expenditure affected budget shares and discuss issues for future research. Section 5 concludes. 2 A comparison between Macro and Micro consumption data In this Section we provide a comparison between macro data (Annual National Accounts, NA), and micro data, retrieved from the Istat Household Budget Survey (HBS). Given that micro data are obtained from interviews with households, it is worth analysing whether or not the aggregation of individual data diverges from the macro data. To the extent that the comparison between the two datasets shows similar dynamics for the variables of interest, the results obtained from studying the heterogeneous evolution of expenditure patterns on the basis of the micro data may be viewed as consistent with the evolution of macro data. National Accounts are based a the concept of household consumption (introduced with the ESA95) which distinguishes between the time of purchase of goods and services and that of the satisfaction of needs. Moreover, expenditure refers to resident citizens, thus HC = (EX H,int + EX res,abr EX for,int ) (1) where household consumption HC is given by the sum of (i) resident and non-resident households expenditure in the national economic territory (EX H,int ), (ii) expenditure made abroad by resident households (EX res,abr ) and (iii) expenditure made by foreign households on the national economic territory (EX for,int ). The Household Budget Survey (HBS) is an annual Survey conducted by the National Institute of Statistics (ISTAT). It provides information on the patterns and the level of consumption of Italian resident households according to various demographic and social characteristics. It is a continuous Survey, involving approximately 28,000 households each 4
5 year, sampled at random from the residence records of the municipalities involved in the Survey. The data is collected for 278 elementary consumption items, providing a very detailed picture of consumption patterns. Sampling weights allow to expand the sample to the whole population. 1 Real consumption measures are obtained by deflating elementary nominal consumption items with the corresponding price indices from the Consumer Price Index (CPI). 2.1 Total household consumption in the NA and the HBS The Household Budget Survey (Istat, 1995) is one of the main data sources used to estimate Gross Domestic Product (GDP) on the demand side, but it is not the only one. About 30% of the National Accounts consumption is recovered from HBS, 30% from the ISTAT Surveys on business and foreign trade statistics, 10% from the Multi-Purpose Survey (MPS) and the remaining 30% is obtained from administrative data (energy consumption, Siae, etc...) and other data sources. Additionally, the HBS and NA differ along three dimensions: 1. the reference population, 2. the concept and definitions of goods and 3. the reference market. The Survey samples the resident population and refers to households only, whereas the NA consider the population on the national territory and covers the expenditure for both households and cohabitations (i.e., the expenses by those who live in communes Institutions such as convents, boarding schools, prisons, etc.). As far as the concept and definition of goods is concerned: (a) the same item may be treated in a different way in the two datasets; this is the case, for instance, of imputed rents that are based on a self-evaluation of the owner in the HBS, while in NA they are estimated classifying apartments into 42 standard types (see also Section 2.2); (b) some types of expenditure are provided by the Survey but 1 The survey is based on three questionnaires: (1) the book of purchases that records daily expenses, such as the amount spent for food (bread, pasta, meat, etc...) and current goods and services (newspapers, tobacco, bus tickets, etc...). (2) Self-consumption, that records self-produced and auto-consumed goods, during the reference period (one week); (3) summary of expenditure, compiled by the interviewer at the beginning of the month following the period of reference. On this occasion the interviewer also records the socio-demographic characteristics of the households, expenses for housing, the cost of furniture and equipments, clothing and footwear, health, transport and communications, leisure, entertainment and education, other goods and services. 5
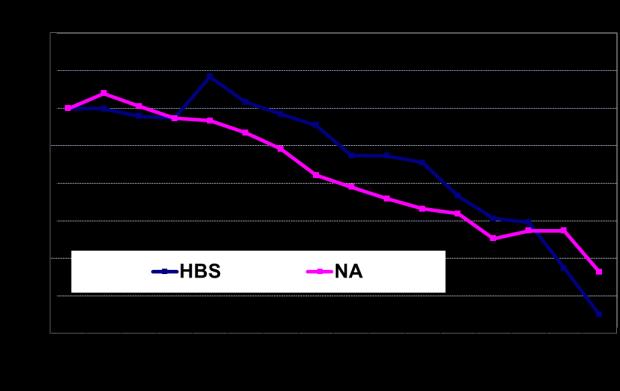
6 not by the NA, such as the buying and selling of cars by one family to another 2 ; (c) in-kind income in NA (such as luncheon vouchers, not detected by the Survey) are estimated using other independent data sources. In 2012 nominal household consumption on the economic territory amounted to 962,721 million of e according to National Accounts; the average monthly expenses of Italian households recovered from the Household Budget Survey was 2,504e. Even correcting for the reference market in the two datasets, a discrepancy emerges, with a clear underestimation of total consumption by the Survey; the Survey underestimation is a common feature of that series (see Figure 1). The ratio between nominal consumption level from HBS and NA has however remained broadly stable, averaging 80% since Following Maki and Garner (2010), underreporting in microeconomic statistics is expected to play an important role. Figure 1: Nominal household consumption on the domestic territory (1997=100) HBS NA Notes: Our calculation from HBS and NA. 2 NA, by definition, consolidates transaction within the same Institution. 6
7 2.2 Household consumption disaggregated by COICOP in the NA and the HBS We now turn to analyse whether households consumption patterns in the NA and HBS evolve in the same way considering not only total consumption, but also the main sub-items. To analyze consumption patterns, we use the COICOP (Classification of Individual Consumption by Purpose) classification developed by the United Nations Statistics Division to classify and analyze individual consumption expenditures incurred by households according to their purpose. 3 Starting from the NA we computed household consumption excluding some of the services that are not sampled in the Survey (such as social protections and financial services); in order to make the comparison feasible we divided total consumption by the number of households on the economic territory and recovered a monthly indicator of consumption. We analyse the evolution of consumption patterns from 1997, the first year the HBS was conducted according to a new methodology, to 2012, the last wave available. For each households i in years t = 1997,.., 2012, we calculate the 12 COICOP consumption chapters (j = 1,..., 12), aggregating the single items included in that chapter (i.e., COICOP1 is obtained summing up pasta, rice, meat, fish, etc...). The total budget share w jt for each COICOP is obtained as the ratio between consumption for good j and total expenditure, i.e. w jt = i C ijt A detailed description of the evolution of the budget shares is provided in Appendix A, where we show that the main aggregates exhibit differences in levels, but similar trends. In Figure 2 we report the budget shares for some relevant COICOP in the NA and HBS. COICOP1. Food and non-alcoholic beverages. The budget share decreased by 0.8 percentage points from 1997 to 2012 in HBS, with a more pronounced drop (-2.1 percentage points) in NA; both data sets show that the share remained roughly unchanged during the 3 The 12 COICOP chapters are (1) food and non-alcoholic beverages; (2) alcoholic beverages and tobacco; (3) clothing and footwear; (4) housing, water, electricity and fuel; (5) furniture and household services; (6) health; (7) transport; (8) communications; (9) recreation, entertainment and culture; (10) education; (11) i C it accommodation services and restaurants; (12) other goods and services. 7
 are")
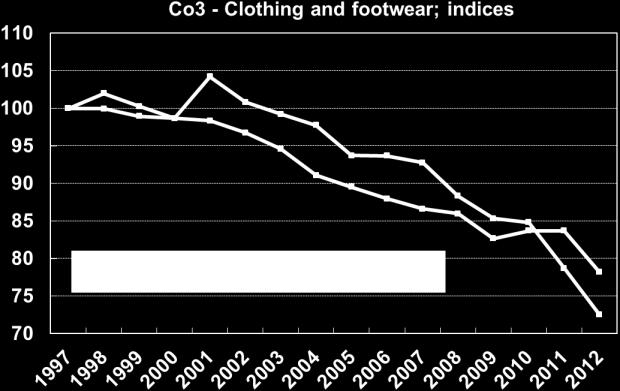
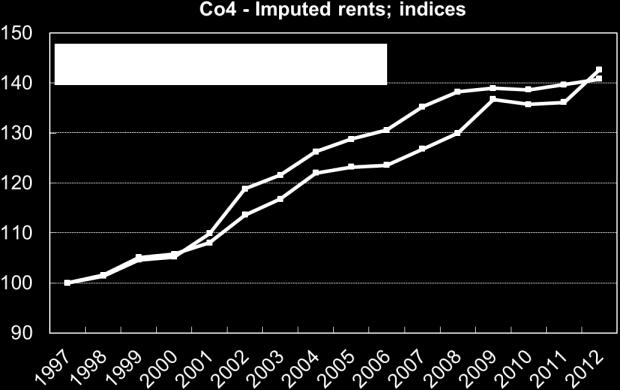
8 Figure 2: Comparison between the NA and HBS budget shares Notes: Our calculation from HBS and NA recent crises. The fact that the evolution of the budget shares is comparable across datasets may also be due to the fact that most items in NA (such as butter, oil and fats; sugar, jam and confectionery; meat) are estimated from HBS. COICOP3. Clothing and footwear. The dynamic of the budged share for clothing and footwear is broadly comparable in the two datasets. NA and HBS both show a decreasing pattern, with a difference of 2 percentage points from 1997 to 2012 (1 p.p. during the recent crises). The total budget share devoted by households to buy clothing and footwear went down from 6.6 in 1997 to 4.8% in 2012 (from 9.2 to 7.2% according to the NA). COICOP4. Housing, water, electricity and fuel. This is a wide sub-component, that includes most of the expenses related to housing. Based on HBS, the budget share increased from 26 to 33% (from 18.7 to 23.9% according to the NA). However, the evolution showed a 8
9 similar dynamic. Actual rents and imputed rents are the two main sub-components of this COICOP. Actual rents are taken from sampled households in HBS and they represent also the main source used to estimate the same component in the NA. In the HBS imputed rents refer to an estimation subjectively given by the households, while in the NA they are estimated classifying apartments into 42 standard types, defined from the house characteristics available in the HBS. From 2008 to 2012, imputed rent shares increased by about 1.3 percentage point in NA and 0.4 p.p in HBS, while actual rent shares rose by about 2 percentage points in both datasets. COICOP5. Furniture and household services. This sub-component includes leisure items like furniture and repairs, linen and other items for the home, appliances and repair, glassware and tableware, tools and equipment for house and garden, goods and services for home maintenance. The budget shares (4.7 in HBS and 7.2% in NA in 2012, respectively) differ considerably across the two datasets; however their evolution shows a decreasing pattern, more pronounced in HBS. In particular, according to the households evaluations the budget share allocated to furniture and other household services decreased by about 0.7 percentage points in the period , NA reports a fall of 0.4 p.p. COICOP7. Transport. The relative expenditure for transport on total consumption in 2012 was about 14% in HBS (13% in NA). Over the period the budget share decreased by 0.7 percentage points in HBS, almost double in the NA; the difference is mainly due to the last four years when the Survey points to an increase and the National Accounts to a decrease. COICOP8. Communications. Communication is the COICOP item that shows the highest divergence between HBS and NA both in levels and budget shares. COICOP9. Recreation, entertainment and culture. According to the subjective evaluation of the households, the relative weight of recreation, entertainment and culture over total consumption decreased over the period by 1.4 percentage points (0.4 p.p. considering NA); one out of forth of this fall was registered during the last recession. COICOP11. Accommodation services and restaurants. The budget share for this COICOP 9
10 was 5% over total consumption for HBS and double for NA in 2012; its evolution shows an upward increase in both datasets. In summary, over the recent crises Italian households have indeed modified their consumption patterns. In particular, the decrease of the budget share related to leisure (like clothing and footwear, furniture and household services) has been associated with an increase in the share devoted to housing expenditure, while the one for food has remained roughly unchanged. Similar evidence is provided by the budget shares in real terms reported in Table 1. Table 1: Real expenditure disaggregated by COICOP. Expenditure: Total Budget shares: Source: Auhtor s calculation from the HBS. Selected COICOP chapters are (1) food and non-alcoholic beverages; (3) clothing and footwear; (4) housing, water, electricity and fuel; (5) furniture, and household services; (7) transport; (8) communications; (11) accommodation services and restaurants. % change for expenditure; percentage points for budget shares. In what follows we will use the consumption expenditure and budget shares recovered from the Household Budget Survey, to account for the heterogeneity of attitudes implemented by household types. 10
11 3 Budget shares and socio-economic characteristics in the recent crises In this Section we check whether the evolution of the budget shares show regularities across socio-demographic characteristics of the households. The analysis is based on the HBS micro data. We will focus on food and non-alcoholic beverages, clothing and footwear, housing, furniture and housing services, transport, communications and accommodation services and restaurants, representing more than 80% of total consumption expenditure. We refer to the socio-economic characteristics across the consumption distribution, as income data are not available in HBS since Table 2: Quartile distribution across socio-demographic characteristics Quartile Primary Secondary High University Primary Secondary High University North Center South North Center South Employee Self-employed Not employed Employee Self-employed Not employed Owners Renters Usufruct Other Owners Renters Usufruct Other Source: Auhtor s calculation from the HBS. Sample weights included. Quartiles are defined according to the equivalised consumption distribution. The recent recession was accompanied by a change in the composition of the Italian population. By applying the equivalence scale used in official statistics, expenditure levels are made comparable, in welfare terms, across households of different size, taking a two- 11
12 member household as the reference. 4 As to demographic characteristics, compared to 2002, in 2012 the share of young households in the richest quartile of the equivalised consumption distribution declined (from 7.9% to 6.6), while the proportion of 65 and over increased (from 6.6% to 8.0); in the poorest quartile, the share of retired households fell (from 10.2% to 8.8), while the one of households of ages between 45 and 64 increased (from 7.9% to 9.7). In terms of geographical areas, Northern households in the highest tail of the distribution increased. As to the occupation of the head of the household, the share of employees increased in the first quartile, while the one for self-employed fell in the forth. Renters became poorer: the share in the lowest quartile increased (from 6.8% to 7.2) while the one in the highest reduced by 7 percentage point (to 2.3%). The recent recession induced a re-composition of consumption expenditure. Food. The budget share of food remained roughly unchanged during the recent recessions; however the aggregate outcomes masks heterogeneity across households types. The share allocated to food and non-alcoholic beverages increased for younger households, by about 1 percentage point, while it decreased for retired household heads and was unchanged for middle aged ones (Figure 3). The percentage change in food expenditure, which recorded a negative variation also in the period , was markedly negative especially for middle aged households. In terms of deciles of the equivalised consumption distribution, we observe a rapid drop for the highest and lowest deciles. Clothing and footwear. The drop observed for the budget share of clothing and footwear over the period (1 percentage point) is in line with the trend in the pre-crisis period. The contraction has been more pronounced for households whose head is in working age (less than 64) and was widespread across all deciles of the equivalised consumption distribution, especially for the highest ones (Figure 4). Considering clothing expenditure, it is interesting to see that it increased for the poorest decile in the period (by about 5%), while it fell by about 25% in the recent crises. This seems to confirm the fact that in the recent recessions households reduced by non-negligible amount 4 The equivalence scale assigns weight 1 to a household of two persons and then weights 0.6 to a single person, 1.33 to three persons, 1.63 to four persons, 1.9 to five or more persons. 12
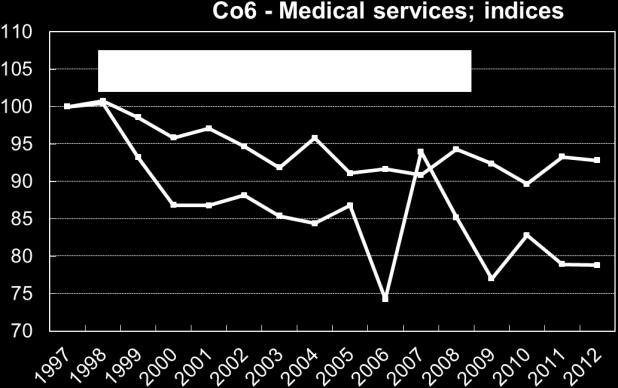
13 their expenditure for non-basic goods and services. The compression was more moderate for household heads aged 65 and over: this could reflect the end of their working life and the subsequent less need to buy new clothes. Miniaci et al. (2003) call retirement consumption puzzle the fact that consumption of work-related goods falls around retirement age while home production of food and other goods increases (see also Battistin et al. 2009). Housing. During the recent crises housing expenditure in real terms decreased by 8%; the fall has been particularly relevant for youngest and middle aged households and for the highest deciles the equivalised consumption distribution (Figure 5). By contrast, the budget share devoted to housing expenses rose for household heads aged less than 64, for the poorest and richest households, for renters and self-employed. On average oldest households devoted 40% of the budget share to housing expenses; this could reflect the fact that this COICOP item includes not only actual rents, but also imputed rents. Furniture. The reduction in furniture and other household services expenditure was particularly severe for the lowest and highest deciles of the consumption distribution and youngest households (Figure 6). The budget share allocated to furniture decreased by about 1 percentage point between 2008 and 2012 for household in working age and by about 2 p.p. for the highest decile, continuing a trend started during the pre-crisis period. Transport. Transport expenditure in real terms fell by 15% during the recession, against a stagnation during pre-crisis period; in particular, the fall reflected a sizeable drop for households less than 44 and affected all deciles of the equivalent consumption distribution (Figure 7). The relative budget shares tell a similar story. Communications. Real communication expenditure, which on average had risen by about 30% in the period , declined by 6% during the recession, reflecting a fall for youngest households. The reduction, particularly relevant for the highest deciles of the equivalised consumption distribution, affected all deciles, with the exception of the 3rd and 4th. The budget share for communication has increased from 1.3% in 2003 to 2.0% in 2012, without any particular pattern across households types (Figure 8). Accommodation. Over the years real expenditure for accommodation and 13
14 restaurant has decreased by about 5% both before and during the crises. The increase observed for the first decile in the pre-crisis period (25%, the largest among deciles) was compensated by the rapid drop in the recession (-32%). In the years 2008 and 2012, youngest households reduced their expenditure for these items. The budget share for accommodation and restaurant remained stable over the period , reflecting a pre-recessions decrease (-0.2 p.p.) and an increase in the recessions (0.2 p.p). The rise was concentrated in the highest deciles of the equivalised consumption distribution and for retired household heads (see Figure 9). 4 Estimating demand elasticities 4.1 Model Specification One of the most widely used specifications in applied demand analysis is the Almost Ideal Demand System (AIDS) model proposed by Deaton and Muellbauer (1980). Its popularity is in part due to the fact that it (i) satisfies axioms of choice exactly (ii) it allows exact aggregation over consumers (iii) it is simple to estimate (allowing for a linear approximation) and (iv) it can be used to test the restriction of homogeneity and symmetry through linear restrictions on fixed parameters (see Deaton and Muellbauer 1980). The model has budget shares as dependent variables and logarithm of prices and real expenditure/income as regressors. However various empirical Engel curve studies suggest that further terms in income may be required to achieve reliable estimations. Rank two models, such as AIDS, do not adequately describe the relationship between demands and total expenditure. Banks, Blundell, and Lewbel (1997) show that a rank three generalization of the AIDS model leads to different conclusions relative to the standard rank two AIDS model. In particular, they prove that although the linear approximation appears to provide a reasonable approximation for the food and fuel share curve, for alcohol and clothing a non linear behaviour is evident. The original AIDS model was subsequently extended to permit non-linear Engel curves. The resulting model, proposed by Banks, Blundell, and Lewbel (1997), is the Quadratic Almost Ideal Demand System (QUAIDS). Under QUAIDS, the i th budget share (w i ) equation 14
15 for household h is given by w ih = α i + n j=1 where i = 1,..., n indicates good i, w ih = p ih q ih /x h and { } xh γ ij lnp j + β i ln + λ [ { }] 2 i xh ln (2) a(p) b(p) a(p) ln(a(p)) = α 0 + n α k lnp k k=1 n n γ kj lnp k lnp j k=1 j=1 b(p) = where p and x stand for the price and total consumption expenditure, respectively. We need to estimate αs, βs, γs and λs. n k=1 From the utility maximization problem under a budget constraint we need to impose the following restrictions: p β k k n n α i = 1; γ ij = 0; i=1 i=1,j=1 i=1 n β j = 0; i λ i = 0 (3) γ ij = 0 (4) j γ ij = γ ij (5) The equalities in (3) are the adding-up restrictions. They express the property that the sum of the budget shares equals 1 (i.e. ih w ih = 1). The restriction in (4) expresses the prediction that the demand functions are homogenous of degree zero in prices and income. Satisfaction of the restriction in (5) ensures that Slutsky symmetry would hold true. 4.2 Estimation Procedure In this Section we estimate demand elasticities by using the HBS integrated with price levels data available from Ministero dello Sviluppo (Osservatorio Prezzi, OP). We will focus on both seven nondurable groups of consumer s expenditure and food products only. 15
16 4.2.1 Price levels Price levels from Osservatorio Prezzi (OP) are obtained from elementary items detected from the municipal offices of statistics within the construction of Consumer Price Index (CPI); these are available for each of the Italian provinces (NUTS3 level) as a minimum, maximin and average price. Due to comparability reasons with the HBS we use the regional dimensions (NUTS2 level) of both dataset and evaluate mean price for goods for each of the 20 Italian regions. 5 Non durable goods include food, alcohol, clothing and footwear, rents, fuels, restaurant and other goods and services. Goods sampled by OP represent about 17% of the items included in the official CPI by the National Institute of Statistics (see Rondinelli and Veronese, 2007); we verified that the selected goods were representative of the main COICOP aggregates 6 Food products include meat, fruit and vegetables, milk, fish, oil and fats, bread and cereals covering about 80% of the processed and unprocessed foods included in the CPI. To proxy COICOP 2 (alcoholic beverages and tobacco) wine and beer were included in the alcohol category; washing and ironing dresses for men and women is used to mimic the evolution of clothing and footwear (COICOP 3). The fuel class is composite of diesel and gasoline, while other goods and services (COICOP 12) include groceries like shampoo, shower gel, toothpaste, laundry detergents, diapers and hair cut (for ladies and gentleman). Restaurant was verified to proxy the evolution over time for COICOP 11 and include coffee, cappuccino, panini, etc. Actual Rent prices at the provincial level are recovered from the Consulente Immobiliare (CI), a semiannual survey conducted for a special review published by Il Sole 24 Ore media group: along with new house prices it collects data on new contract rents for a very large sample of Italian municipalities. In each sampled town, CI provides estimates of the average rent level (per square meter) of an apartment located in three areas: center, semi-center and suburbs. Rents are further distinguished into new and renewed contracts, the latter defined as contracts negotiated with previously sitting tenants upon contract expiration (see also 5 To recover the regional dimension we aggregated observations weighted by the resident population in each province. 6 Results are available upon request. 16
17 Rondinelli and Veronese, 2011). We will focuss on years to conduct a comparison before and after the recession. Price levels for selected years and across the Italian regions are reported in Table 3. We observe a general increase in price levels between 2005 and 2012 common to all Italian regions and products. Except for fuel, the highest increase has occurred between 2005 and Since the beginning of the recession food and fuel prices have almost doubled in all Italian regions; the latter reflected the rapid rice experienced by oil quotations in that years. Prices for other goods and services went up by 40% between 2005 and 2012; rents increased by 10% on average, the highest rise has been observed in Lazio. A downward trend was marked by clothing between 2005 and 2009, especially in Nordic regions; a slight increase was observed between 2009 and Prices for coffee, cappuccino, panini, which are included in the restaurant category, increased by one quarter during the recession. Looking more deeply at the different food categories reported in Table 4, we found that prices increased more markedly between 2005 and 2009; they almost doubled for fruit, vegetables, milk and fish. Prices for oils have decreased by about one quarter during the recession, the drop was more pronounced in Northern regions. Meat became more expensive after 2009, while between 2005 and 2009 the rate of change was more subdued. The increase observed in bread mainly came after 2009 and was concentrated in Southern regions Results In order to estimate the parameters of the QUAIDS, we use the maximum likelihood approach (Poi, 2002; Poi, 2008). The results of the estimates for αs, βs, γs and λs of equation (2) 7 are provided in Table 5. Most of the parameters are statistically significant at the 1% level. In particular, the estimates of the parameters λ are statistically significant for most of the seven commodity groups; this confirms the relevance of the quadratic term extension of the linear AIDS. The quadratic term in the logarithm of expenditure is close to zero only in case of restaurants in 2009 and Thus, omitting the quadratic term of the remaining commodities from our analysis could bias the estimates. 7 All estimation procedures were implemented using Stata 13.1 for Windows, using the command quaids (Poi, 2012). 17
18 Table 3: Average price levels in the Italian regions. Food Alcohol Cloth. Rents Fuel Rest. Other Food Alcohol Cloth. Rents Fuel Rest. Other Food Alcohol Cloth. Rents Fuel Rest. Other Piemonte Valle d Lombardia Trentino Veneto Friuli Liguria Emilia Toscana Umbria Marche Lazio Abruzzi Molise Campania Puglia Basilicata Calabria Sicilia Sardegna Source: Auhtor s calculation from the HBS and OP. Unit of measure is kg for food, liter for alcohol and fuel, one piece for clothing, restaurants and other goods and services, square meters for rents. 18
19 Table 4: Average price food levels in the Italian regions. Meat Fruit Milk Fish Oils Bread Meat Fruit Milk Fish Oils Bread Meat Fruit Milk Fish Oils Bread Piemonte Valle d Lombardia Trentino Veneto Friuli Liguria Emilia Toscana Umbria Marche Lazio Abruzzi Molise Campania Puglia Basilicata Calabria Sicilia Sardegna Source: Auhtor s calculation from the HBS and OP. Unit of measure is kg for meat, fish, fruit and bread; liter for oils; liter, kg, pieces for milk (i.e. it includes eggs, cheese, milk,etc..), 19
20 As changes in real expenditure operates through the βs, in Figure 10 we report the estimated βs from the budget share equation (2) from 2004 to The estimated βs do not change considerably across years. For each year, these coefficients add to zero and are positive for luxuries and negative for necessities. Over the last recession be have observed an increase in the dispersion of the estimated coefficients: in particular we notice broadly stable values during the financial crisis ( ) and a marked dynamic at the end of the sample. The increase in the dispersion suggests that during the Sovereign Debt crisis necessary goods became more necessary, as it is the case for food. If we split the sample considering households below and above the median of the equivalised consumption distribution, we find that clothing, restaurants and other good and services are considered a luxury for poor households. The fact that rents became a luxury goods in the recession is mainly driven by the top of the distribution, while it continued to be a necessity for those at the bottom. The same figure applies to fuel. In Figure 11 (panel a) we plot the income elasticities; they are calculated for each individual household and subsequently an average is constructed. Based on our estimates, the commodity bundle of food, alcohol and housing are necessary goods, as their budget elasticity is positive and below one at the same time. On the contrary, we identified clothing, fuel, restaurants and other goods and services to be luxury goods with income elasticity well above one. We then turn to consider the subgroup of food only and re-estimate equation (2) for meat, fruit and vegetables, milk, fish, oils and fats, bread and cereals. The estimated betas for different food categories remained stable over the studied period. In figure 11 (panel b) we reported the income elasticities and find that meat, fish and oil and fats are luxury goods, while bread and cereals, milk and fruit are necessary. We do not observe any particular difference between households with an equivalised consumption above and below the median. The analysis seems to suggest that while the Financial crisis left almost unchanged the consumption profile of the Italian households, the Sovereign debt crisis operated a recomposition of the consumption structure rendering necessary goods more necessary and luxury goods more luxuries, especially for poor households. 20
21 4.3 Open questions The estimates provided in Section need to be extended in several way. Fist, we should account for demographic characteristics of the households in estimating the QUAIDS equation. This requires that the expenditure share equations 2 should be appropriately modified to account for demographic variables. For example Blacklow et al. (2010) used Ray s (1983) method to incorporate household composition variables in the quadratic AIDS model. Pollak and Wales (1981) provide an alternative ways of incorporating demographic variables by directly modifying the expenditure share equations. Second, we should take care of zero-expenditure, a common feature of survey consumption data and HBS is not an exception. Apart from imperfect recall, three main reasons for zeroexpenditure can be identified: (i) permanent zero expenditure, (ii) zero expenditure during the survey period (iii) recall bias. Unfortunately, it is not possible to identify which of these reasons is responsible for each of the reported zero-expenditures from the HBS data. However, aggregation over commodities helps reduce the problem. Thus we need to consider the sample selection problem that may arise with the presence of zero-expenditure (or a censored dependent variable), as econometric estimates that neglect censoring will be biased and inconsistent (Maddala, 1983). Third, if total expenditure is jointly determined with the budget shares of the specific commodities in the demand model, total expenditure becomes endogenous in the budget share equations. This may induce inconsistent parameter estimates if not taken care of (Blundell and Robin, 1999). Blundell and Robin (1999) illustrate a two step augmented regression technique to solve the problem. First, total expenditure is regressed on a set of exogenous variables including those which may directly influence budget shares. In the second step, the residual from this reduced-form regression is added, as an explanatory variable in the budget share equations together with total expenditure. The OLS estimator of the parameter of the total expenditure variable in this augmented regression is identical to the Two-Stage Least Squares (2SLS) estimator. Testing for the significance of the coefficient of the residual obtained in the first regression serves as a test of the exogeneity of total expenditure in the share equations. 21
22 These questions, that may also help to cast light on the issue of the possible impact of the recent crises on consumer preferences, are left for future research. 5 Conclusions and possible extensions The paper reviews the evolution of the structure of household consumption over the recent crises in Italy. Households types reacted differently to the economic shocks of , reducing the level of their expenditure and modifying their structure. In particular, on average the decrease in the budget shares related to leisure expenditure (e.g., clothing and footwear, furniture and household services) has been associated with an increase in the share of housing expenditure, while the share for food has remained roughly unchanged. Heterogenous attitudes were observed across deciles of the consumption distribution: households in the lowest deciles increased the share of housing expenditure by decreasing the budget share allocated to clothing and footwear, transport, furniture and household services and accommodation and restaurants; at the same time, they increased the share for food, which is a basic item, not easy to reduce below a certain threshold. By contrast, households in the upper tail of the consumption distribution reduced all the expenses for furniture and other household services, clothing and footwear, while they slightly raised the share for recreation, accommodation and restaurant. Turning to consumption patterns by age groups, although the budget share for food remained roughly unchanged in the aggregate, its share went up for younger households and reduced for old ones. The share of housing expenses increased for household heads in working ages and decreased for retired. The estimates of a system of demand equation proves that during the Sovereign Debt crisis we observed an increase in the heterogeneity of habits, as necessary goods, like food, became more necessary and luxury goods, like restaurants, more luxuries. This dynamic was particularly relevant for poor households, suggesting that in the coming years, with a gradual increase in disposable income, we will observe a reduction in heterogeneity and a further recomposition effect. 22
23 Table 5: Estimated coefficients for the budget share equation Coef. Std. Coef. Std. Coef. Std. Coef. Std. Coef. Std. Coef. Std. alpha gamma alpha gamma alpha gamma alpha gamma alpha gamma alpha gamma alpha gamma alpha gamma beta gamma beta gamma beta gamma beta gamma beta gamma beta gamma beta gamma beta gamma gamma gamma gamma gamma gamma gamma gamma lambda gamma lambda gamma lambda gamma lambda gamma lambda gamma lambda gamma lambda gamma lambda Source: Auhtor s calculation from the HBS and PO. 1=food, 2=alcohol, 3=clothing, 4=rents, 5=fuel, 6=restaurant, 7=other goods and services 23
24 Figure 3: Change in real COICOP1 expenditure and shares by age and deciles Notes: Our calculation from HBS. Sample weights included. Deciles are defined according to the equivalised consumption distribution. % change for expenditure; percentage points for shares. Total consumer price index used as deflator for total consumption; consumer price index for COICOP1 used as deflator for food. 24
25 Figure 4: Change in real COICOP3 expenditure and shares by age and deciles Notes:Our calculation from HBS. Sample weights included. Deciles are defined according to the equivalised consumption distribution. % change for expenditure; percentage points for shares. Total consumer price index used as deflator for total consumption; consumer price index for COICOP3 used as deflator for clothing. 25
26 Figure 5: Change in real COICOP4 expenditure and shares by age and deciles Notes: Our calculation from HBS. Sample weights included. Deciles are defined according to the equivalised consumption distribution. % change for expenditure; percentage points for shares. Total consumer price index used as deflator for total consumption; consumer price index for COICOP4 used as deflator for housing. 26

27 Figure 6: Change in real COICOP5 expenditure and shares by age and deciles Notes: Our calculation from HBS. Sample weights included. Deciles are defined according to the equivalised consumption distribution. % change for expenditure; percentage points for shares. Total consumer price index used as deflator for total consumption; consumer price index for COICOP5 used as deflator for furniture. 27
28 Figure 7: Change in real COICOP7 expenditure and shares by age and deciles Notes: Our calculation from HBS. Sample weights included. Deciles are defined according to the equivalised consumption distribution. % change for expenditure; percentage points for shares. Total consumer price index used as deflator for total consumption; consumer price index for COICOP7 used as deflator for transport. 28

29 Figure 8: Change in real COICOP8 expenditure and shares by age and deciles Notes: Our calculation from HBS. Sample weights included. Deciles are defined according to the equivalised consumption distribution. % change for expenditure; percentage points for shares. Total consumer price index used as deflator for total consumption; consumer price index for COICOP8 used as deflator for communications. 29
30 Figure 9: Change in real COICOP11 expenditure and shares by age and deciles Notes: Our calculation from HBS. Sample weights included. Deciles are defined according to the equivalised consumption distribution. % change for expenditure; percentage points for shares. Total consumer price index used as deflator for total consumption; consumer price index for COICOP11 used as deflator for accommodation services and restaurants. 30


31 Figure 10: Estimated betas Notes: Our calculation from HBS and OP. Estimated βs for total population and households below and above the median of the equivalised consumption distribution. 31
")

32 Figure 11: Income elasticities (a) (b) Notes: Our calculation from HBS and OP 32
33 A The evolution of consumption in the NA and HBS ( ) 1. Food and non-alcoholic beverages. According to HBS, in 2012 Italian households devoted in nominal terms 447e to food and non alcoholic beverages, compared to 384 in 1997 (see Table 6). Taking into account the increase of total nominal expenditure (to 2,504e from 2,057), the budget share decreased by 0.8 percentage points, remaining almost stable during the recent crises. A similar pattern is observed from the NA, with a more pronounced drop (-2.1 p.p.). Estimated levels in NA are recovered mainly from the HBS (butter, oil and fats; sugar, jam and confectionery; meat) while other goods are obtained with the Availability Method (AM - metodo della disponibilità ). 8 In particular flour, rice, bouillon cubes, yeast, homogenized foods are obtained with the AM as they require a transformation of industrial products. Overall the dynamic of this component was in line between the two datasets (see Figure 12). 2. Alcoholic beverages and tobacco. The estimation of this sub-component in the National Accounts is not based on the HBS; this explains the differences in levels and dynamics. Over the years however, the total budget share remained roughly unchanged in the two data sources, at 2.8% in NA and 1.7 in HBS. More precisely, as alcoholic beverages (such as beer, wine, whiskey) are industrial products, they are obtained with the Availability Method in the NA. Tobacco is an example of the discrepancy between the amount of smoking declared by the households (in HBS) and the one recovered from administrative sources (the State Monopoly) integrated with smuggling tobacco based on the seizures made by the Financial 8 The AM calculates the amount of goods and services potentially available for end uses. In case of domestic consumption, these are computed as follows: C = P + (I E) + (G1 G2) U where C = domestic consumption; P = national production; I = imports, E = exports; G1 = inventories at the beginning of the year, G2 = inventories at the end of the year; U = resources for investment and intermediate consumption. Consumption functions estimated with this method concern only goods resulting from transformation of industrial products. 33
34 Table 6: Nominal expenditure disaggregated by COICOP Total Budget shares Source: Auhtor s calculation from the HBS. The 12 COICOP chapters are (1) food and non-alcoholic beverages; (2)alcoholic beverages and tobacco; (3) clothing and footwear; (4) housing, water, electricity and fuel; (5) furniture, and household services; (6) health services and health expenditures; (7)transport; (8) communications; (9) recreation, entertainment and culture; (10) education; (11) accommodation services and restaurants; (12) other goods and services. % change for expenditure; percentage points for budget shares. Police (in NA). 3. Clothing and footwear. Although based on the Availability Methods in NA, the dynamic of the budged share for clothing and footwear is broadly comparable between the two datasets.the NA and the HBS both show a decreasing pattern, with a difference of 2 percentage points from 1997 to 2012 (1 p.p. during the recent crises). The total budget share devoted by households to buy clothing and footwear went down from 6.6 in 1997 to 4.8% in 2012 (from 9.2 to 7.2% according to the NA; Figure 12); in absolute terms households spent 120e per month in 2012 (from 136e in 1997). 4. Housing, water, electricity and fuel. This is a wide sub-component, that includes most of the expenses related to housing. Based on HBS, the nominal expenditure of Italian households increased from 534e in 1997 to 826e in 2012; the corresponding budget share also increased from 26 to 33% (from 18.7 to 23.9% according to the NA). However, the 34
35 Table 7: % change in expenditure disaggregated by COICOP. COICOP Item nominal real deflator Food and non-alcoholic beverages Alcoholic beverages and tobacco Clothing and footwear Housing, water, electricity and fuel Actual rents Imputed rents Furniture and household services Health Transport Vehicles purchases Communications Recreation, entertainment and culture Education Accommodation services and restaurants Accommodation Restaurants Other goods and services Source: Auhtor s calculation from NA. pattern showed a similar trend. Actual rents and imputed rents are the two items of this sub-component whose budget shares behave in a comparable way across sources (Figure 15), although based on a different methodology. Indeed, actual rents are taken from sampled households in HBS and they represent also the main source used to estimate the same component in the NA. In the HBS imputed rents refer to an estimation subjectively given by the households, while in the NA they are estimated classifying apartments into 42 standard types, defined from the house characteristics available in the HBS (for a broad comparison between rents measured in different datasets, see also Rondinelli and Veronese, 2011). Rents expenditure in NA (actual and imputed) increased by 14% in nominal terms and 3% in real ones, as shown in Table Furniture and household services. This sub-component includes leisure items like furniture and repairs, linen and other items for the home, appliances and repair, glassware and tableware, tools and equipment for house and garden, goods and services for home maintenance. Although both the nominal expenditure (117e in the HBS and 220e per month in NA in 2012) and the budget shares (4.7 and 7.2%, respectively) differ considerably across the two datasets, the dynamic of the budget share points to a decreasing pattern, 35
36 more pronounced in HBS (Figure 13). In particular, according to the households evaluations the budget share allocated to furniture and other household services decreased by about 0.7 percentage points in the period , NA reports a fall of 0.4 p.p. The different methodology used in the two datasets allows for a possible interpretation of the different drop: households self perception of the expenses devoted to these items were more pessimistic than the one registered in the National Accounts that uses the Availability Methods that is, as previously mentioned, based on industrial production. 6. Health. Health expenditure, on both services and goods, in HBS and NA are broadly comparable: the monthly nominal expenses attained 88e and 92e per month in 2012, respectively; the difference in the budget shares is almost negligible in the studied period and fluctuated around 3% to 4% of the total consumption. The evolution of the budget shares shows a regular divide. In particular, while in NA health goods are estimated with the Availability Method (Istat, 1995), services are mainly recovered from the Multipurpose Survey Health status and use of health services led by National Institute of Statistics. 9 Of the three items included in this subcomponent, medical products show a similar pattern in the two datasets, while hospital services an irregular one; medical services occupy an intermediate position (Figure 15). 7. Transport. On average households spent 350e per month in 2012 (395 according to the NA) for transport; the relative expenditure on total consumption was about 14% (13% in NA). Over the period the budget share decreased by 0.7 percentage points in HBS, almost double in the NA; the difference is mainly due to the last four years when the Survey points to an increase and the National Accounts to a decrease. 10 In the same period, nominal transport expenditure decreased by 2.5% (16.1% in real terms) reflecting the drop occurred in the vehicle purchase (see Table 7). 8. Communications. Communication is the COICOP item that shows the highest di- 9 The Survey measures the quality of life of citizens and the satisfaction of certain public utilities. 10 For the estimation of the transport expenditure NA uses a variety of sources, from which the HBS is excluded. In particular for car expenditure NA adopt a price times quantity approach: car registrations are obtained from DMW with segment types defined by the National Association of car manufacturers (ANFIA). 36
37 vergence between HBS and NA both in levels and budget shares. This discrepancy of an increase of the relative dynamics in the National Accounts and a decrease in the Survey can also be related to the fact that the three sub-items are estimated with different data sources: postal and telephone services using information recovered from the authorities responsible for the provision of the service (like Poste Italiane, Vodafone, Telecom Italia), while telephone goods with the Availability Method. 9. Recreation, entertainment and culture. According to the subjective evaluation of the households, the relative weight of recreation, entertainment and culture over total consumption decreased over the period by 1.4 percentage points (0.4 p.p. considering NA); one out of forth of this fall was registered during the last recession (Figure 14). The proportion of items in the National Accounts that are estimated using the HBS is negligible 11, while the vast majority is recovered with the Availability Method (especially for goods), the Multipurpose Survey (sports), and administrative survey (like SIAE for theater, movie). 10. Education. In 2012 Italian households devoted about 30e per month to cover education expenditure, in line with the amount registered by NA; the budget share has remained around 1% from in the two datasets. If we consider the evolution of the budget share we see a more regular pattern estimated under National Accounts 12 compared to HBS. 11. Accommodation services and restaurants. Taken in nominal terms, the expenditure of Italian households for accommodation services and restaurant was 151e per month in 1997 and attained 205e in The relative budget share was 5% over total consumption for HBS and double for NA; its evolution shows an upward increase in both datasets. NA (Istat, 1995) uses a price times quantity approach to estimate accommodation from the Tourism Statistics and this could explain the spike profile of the item in the Survey compared to National Accounts (see Figure 15). As far as restaurant is concerned the pattern looks more similar across datasets and it is estimated from the Multipurpose Survey and other surveys on vacations. 11 For COICOP 8 and 9, only the repairing (of telephone, TV, etc...) is recovered from HBS. 12 NA consumption data for education are obtained from the Multipurpose Survey, HBS, Ministry of Education and Istat data on education. 37
38 12. Other goods and services. As previously emphasized, to make the comparison between the two datasets feasible, we exclude from the NA both social protections and financial services. The evolution of the budget shares points to an increase in the NA and HBS. 38


39 Figure 12: A comparison between NA and HBS(COICOP1-COICOP4) Notes: Our calculation from HBS and NA. Shares: evolution (left panel); indices 1997=100 (right panel). 39


40 Figure 13: A comparison between NA and HBS(COICOP5-COICOP8) Notes: Our calculation from HBS and NA. Shares: evolution (left panel); indices 1997=100 (right panel). 40


41 Figure 14: A comparison between NA and HBS(COICOP9-COICOP12) Notes: Our calculation from HBS and NA. Shares: evolution (left panel); indices 1997=100 (right panel). 41


42 Figure 15: A comparison between nominal NA and HBS (selected items) Notes: Our calculation from HBS and NA for rents, health and accommodation and restaurants. Indices 1997=100 42
Household consumption expenditure Year 2017
 19 June 2018 Household consumption expenditure Year 2017 In 2017, the average monthly household consumption expenditure, at current values, was 2,564 euros (+1.6% compared to 2016 and +3.8% compared to
CAYMAN ISLANDS CONSUMER PRICE REPORT: 2010 ANNUAL INFLATION (Date: February 9, 2011)
") CAYMAN ISLANDS CONSUMER PRICE REPORT: 2010 ANNUAL INFLATION (Date: February 9, 2011) Consumer Price Index (CPI) Increased by 0.3% in 2010 This report is a consolidated report of the average CPI in 2010
CAYMAN ISLANDS CONSUMER PRICE REPORT: 2010 ANNUAL INFLATION (Date: February 9, 2011) Consumer Price Index (CPI) Increased by 0.3% in 2010 This report is a consolidated report of the average CPI in 2010
Real Estate Market Overview
 Real Estate Market Overview Italy 2017 www.pwc.com/it 01 Italian Macroeconomic Indicators 02 Italian Real Estate Market Overview Market of residential mortgages Real estate market trends Market of residential
HOUSEHOLD EXPENDITURE IN MALTA AND THE RPI INFLATION BASKET
 HOUSEHOLD EXPENDITURE IN MALTA AND THE RPI INFLATION BASKET Article published in the Quarterly Review 2018:3, pp. 33-40 BOX 2: HOUSEHOLD EXPENDITURE IN MALTA AND THE RPI INFLATION BASKET 1 In early 2018,
THE CAYMAN ISLANDS CONSUMER PRICE INDEX REPORT: DECEMBER 2017 (Date of release: February 15, 2018)
") THE CAYMAN ISLANDS CONSUMER PRICE INDEX REPORT: DECEMBER 2017 (Date of release: February 15, 2018) Average CPI Rose by 1.9% in 2017 This report presents the average CPI for 2017 and the results of the
THE CAYMAN ISLANDS CONSUMER PRICE INDEX REPORT: DECEMBER 2017 (Date of release: February 15, 2018) Average CPI Rose by 1.9% in 2017 This report presents the average CPI for 2017 and the results of the
Consumer Price Index, August 2012
 Consumer Price Index, August 2012 (Base year 2007) Detailed by: Expenditure groups Household welfare levels Household type September 5, 2012 Issue No. 8 SCAD. Consumer Price Index 2012 1 Table of Contents
THE DEMAND SYSTEM FOR PRIVATE CONSUMPTION OF THAILAND: AN EMPIRICAL ANALYSIS. - Preliminary -
 THE DEMAND SYSTEM FOR PRIVATE CONSUMPTION OF THAILAND: AN EMPIRICAL ANALYSIS - Preliminary - By Somprawin Manprasert Department of Economics University of Maryland manprase@econ.umd.edu December, 2001
THE CAYMAN ISLANDS CONSUMER PRICE INDEX REPORT: JUNE 2016 (Date of release: August 10, 2016)
") THE CAYMAN ISLANDS CONSUMER PRICE INDEX REPORT: JUNE 2016 (Date of release: August 10, 2016) CPI Falls by 0.8% in the Second Quarter of 2016 The overall Consumer Price Index (CPI) for the second quarter
THE CAYMAN ISLANDS CONSUMER PRICE INDEX REPORT: JUNE 2016 (Date of release: August 10, 2016) CPI Falls by 0.8% in the Second Quarter of 2016 The overall Consumer Price Index (CPI) for the second quarter
PRESS RELEASE. The evolution of the Consumer Price Index (CPI) of April 2018 (reference year 2009=100.0) is depicted as follows:
 of April 2018 (reference year 2009=100.0) is depicted as follows:") HELLENIC REPUBLIC HELLENIC STATISTICAL AUTHORITY Piraeus, 10 May 2018 PRESS RELEASE CONSUMER PRICE INDEX: April 2018, annual inflation 0.0% The evolution of the Consumer Price Index (CPI) of April 2018
HELLENIC REPUBLIC HELLENIC STATISTICAL AUTHORITY Piraeus, 10 May 2018 PRESS RELEASE CONSUMER PRICE INDEX: April 2018, annual inflation 0.0% The evolution of the Consumer Price Index (CPI) of April 2018
Consumer Price Index. March Business and economy
 Consumer Price March 2018 Business and economy Table of Contents A note to the reader...ii 1 MONTHLY CHANGE OF THE CPI... 1 1.1 CPI AND INFLATION... 1 1.2 CHANGES IN SECTOR... 1 1.3 CHANGES IN CATEGORIES
PART II: ARMENIA HOUSEHOLD INCOME, EXPENDITURES, AND BASIC FOOD CONSUMPTION
 PART II: ARMENIA HOUSEHOLD INCOME, EXPENDITURES, AND BASIC FOOD CONSUMPTION 89 Chapter 6: Household Income *, Expenditures, and Basic Food Consumption This chapter presents the dynamics of household income,
Consumer Price Index. February Business and economy
 Consumer Price February 2018 Business and economy Table of Contents A note to the reader...ii 1 MONTHLY CHANGE OF THE CPI... 1 1.1 CPI AND INFLATION... 1 1.2 CHANGES IN SECTOR... 1 1.3 CHANGES IN CATEGORIES
Consumer Price Index. December Business and economy
 Consumer Price December 2018 Business and economy Table of Contents A note to the reader...ii 1 MONTHLY CHANGE OF THE CPI... 1 1.1 CPI AND INFLATION... 1 1.2 CHANGES IN SECTOR... 1 1.3 CHANGES IN CATEGORIES
Consumer Price Index, November, (Base year 2007) Detailed by: Expenditure groups Household welfare levels Household type.
 Detailed by: Expenditure groups Household welfare levels Household type.") Consumer Price Index, November, 2013 (Base year 2007) Detailed by: Expenditure groups Household welfare levels Household type December 10, 2013 Issue No. 11 SCAD. Consumer Price Index 2013 1 Table of Contents
Consumer Price Index, November, 2013 (Base year 2007) Detailed by: Expenditure groups Household welfare levels Household type December 10, 2013 Issue No. 11 SCAD. Consumer Price Index 2013 1 Table of Contents
Consumer Price Index. September Business and economy
 Consumer Price September 2018 Business and economy Table of Contents A note to the reader...ii 1 MONTHLY CHANGE OF THE CPI... 1 1.1 CPI AND INFLATION... 1 1.2 CHANGES IN SECTOR... 1 1.3 CHANGES IN CATEGORIES
Consumer Price Index. June Business and economy
 Consumer Price June 2017 Business and economy Table of Contents A note to the reader...ii 1 MONTHLY CHANGE OF THE CPI... 1 1.1 CPI AND INFLATION... 1 1.2 CHANGES IN SECTOR... 1 1.3 CHANGES IN CATEGORIES
June Namibia Consumer Price Index. Tel: Fax:
 Namibia Consumer Price Index N C P I June 2017 Namibia Statistics Agency P.O. Box 2133, FGI House, Post Street Mall, Windhoek, Namibia Tel: +264 61 431 3200 Fax: +264 61 431 3253 Email: info@nsa.org.na
PART 4 - ARMENIA: SUBJECTIVE POVERTY IN 2006
 PART 4 - ARMENIA: SUBJECTIVE POVERTY IN 2006 CHAPTER 11: SUBJECTIVE POVERTY AND LIVING CONDITIONS ASSESSMENT Poverty can be considered as both an objective and subjective assessment. Poverty estimates
THE CAYMAN ISLANDS CONSUMER PRICE INDEX REPORT: SEPTEMBER 2017 (Inaugural Report Using the 2016 CPI Basket) (Date of release: November 24, 2017)
 (Date of release: November 24, 2017)") THE CAYMAN ISLANDS CONSUMER PRICE INDEX REPORT: SEPTEMBER 2017 (Inaugural Report Using the 2016 CPI Basket) (Date of release: November 24, 2017) CPI Increased by 1.4% in the Third Quarter of 2017 This
THE CAYMAN ISLANDS CONSUMER PRICE INDEX REPORT: SEPTEMBER 2017 (Inaugural Report Using the 2016 CPI Basket) (Date of release: November 24, 2017) CPI Increased by 1.4% in the Third Quarter of 2017 This
NCPI. Namibia Consumer Price index. January 2018
 NCPI Namibia Consumer Price index January 2018 Namibia Consumer Price index - January 2018 1 Mission Statement Leveraging on partnerships and innovative technologies, to produce and disseminate relevant,
Issues in the Measurement and Construction of the Consumer Price Index in Pakistan
 WORKING PAPER No. 020 August 2014 Issues in the Measurement and Construction of the Consumer Price Index in Pakistan Sohail Jehangir Malik, Hina Nazli, Amina Mehmood and Asma Shahzad 8/20/2014 1. INTRODUCTION
Consumer Price Indices Measuring Across Households
 Consumer Price Indices Measuring Across Households Presented by: Yoel Finkel 1, Central Bureau of Statistics, Israel At the: 9th Ottawa Group Meeting on Prices 1th to 16th May 6 Victoria Park Plaza Hotel,
PRESS RELEASE. The evolution of the Consumer Price Index (CPI) of July 2017 (reference year 2009=100.0) is depicted as follows:
 of July 2017 (reference year 2009=100.0) is depicted as follows:") HELLENIC EPUBLIC HELLENIC STATISTICAL AUTHOITY Piraeus, 9 August 2017 PESS ELEASE CONSUME PICE INDEX: July 2017, annual inflation 1.0% The evolution of the Consumer Price Index (CPI) of July 2017 (reference
HELLENIC EPUBLIC HELLENIC STATISTICAL AUTHOITY Piraeus, 9 August 2017 PESS ELEASE CONSUME PICE INDEX: July 2017, annual inflation 1.0% The evolution of the Consumer Price Index (CPI) of July 2017 (reference
PRESS RELEASE. The evolution of the Consumer Price Index (CPI) of March 2018 (reference year 2009=100.0) is depicted as follows:
 of March 2018 (reference year 2009=100.0) is depicted as follows:") HELLENIC REPUBLIC HELLENIC STATISTICAL AUTHORITY Piraeus, 13 April 2018 PRESS RELEASE CONSUMER PRICE INDEX: March 2018, annual inflation -0.2% The evolution of the Consumer Price Index (CPI) of March 2018
HELLENIC REPUBLIC HELLENIC STATISTICAL AUTHORITY Piraeus, 13 April 2018 PRESS RELEASE CONSUMER PRICE INDEX: March 2018, annual inflation -0.2% The evolution of the Consumer Price Index (CPI) of March 2018
PRESS RELEASE. The evolution of the Consumer Price Index (CPI) of October 2017 (reference year 2009=100.0) is depicted as follows:
 of October 2017 (reference year 2009=100.0) is depicted as follows:") HELLENIC EPUBLIC HELLENIC STATISTICAL AUTHOITY Piraeus, 9 November 2017 PESS ELEASE CONSUME PICE INDEX: October 2017, annual inflation 0.7% The evolution of the Consumer Price Index (CPI) of October 2017
HELLENIC EPUBLIC HELLENIC STATISTICAL AUTHOITY Piraeus, 9 November 2017 PESS ELEASE CONSUME PICE INDEX: October 2017, annual inflation 0.7% The evolution of the Consumer Price Index (CPI) of October 2017
Estimation of consumption choices with the EASI demand system: Application to Italian data
 Estimation of consumption choices with the EASI demand system: Application to Italian data Arianna Olivieri * Prometeia Associazione per le Previsioni Econometriche, Bologna This version: 30 August 2014
Headline and Core Inflation February 2018
 Feb-16 Feb-13 May-13 Aug-13 Nov-13 Feb-1 May-1 Aug-1 Nov-1 Feb-15 May-15 Aug-15 Nov-15 Feb-16 Central Bank of Egypt Headline and Core Inflation February 218 Annual headline 1/ and core 2/ (urban) inflation
Headline and Core Inflation April 2018
 Apr-16 Apr-13 Jul-13 Oct-13 Jan-1 Apr-1 Jul-1 Oct-1 Jan-15 Apr-15 Jul-15 Oct-15 Jan-16 Apr-16 Central Bank of Egypt Headline and Core Inflation April 218 Annual headline 1/ (urban) inflation continued
Consumer Price Index
 Consumer Price Index July 2015 1 Released Date: 4 August 2015 (Base year 2007) Detailed by: Expenditure groups Household welfare levels Household type Regions Introduction The (CPI) is an important statistical
NCPI. March Namibia Consumer Price index. Namibia Consumer Price index - March
 NCPI Namibia Consumer Price index March 2018 Namibia Consumer Price index - March 2018 1 Mission Statement Leveraging on partnerships and innovative technologies, to produce and disseminate relevant, quality,
Headline and Core Inflation December 2009
 Headline and Core Inflation December 2009 Headline CPI published by the Central Agency for Public Mobilization and Statistics (CAPMAS) on January 10, 2010, declined by 1.3 percent (m/m) in December 2009,
Egypt. A: Identification. B: CPI Coverage. Title of the CPI: Consumer Price Index
 Egypt A: Identification Title of the CPI: Consumer Price Index Organisation responsible: Central Agency for Public Mobilization and Statistics (CAPMAS) Periodicity: Monthly Price reference period: January
WORKING PAPER SERIES 8
 WORKING PAPER SERIES 8 Kamil Dybczak, Peter Tóth and David Voňka: Effects of Price Shocks to Consumer Demand. Estimating the QUAIDS Demand System on Czech Household Budget Survey Data 2 010 WORKING PAPER
A NUTRITIONAL GOODS AND A COMPLETE CONSUMER DEMAND SYSTEM ESTIMATION FOR SOUTH AFRICA USING ACTUAL PRICE DATA
 SAJEMS NS 19 (016) No 4:615-69 615 A NUTRITIONAL GOODS AND A COMPLETE CONSUMER DEMAND SYSTEM ESTIMATION FOR SOUTH AFRICA USING ACTUAL PRICE DATA Marius Louis van Oordt African Tax Institute, University
Understanding the Consumer Price Index (CPI)
") ESO PUBLICATIONS Consumer Price Index (CPI) Reports Quarterly Economic Reports (QER) Labour Force Survey (LFS) Reports Annual Overseas Trade Reports Annual Compendium of Statistics Annual Economics Report
ESO PUBLICATIONS Consumer Price Index (CPI) Reports Quarterly Economic Reports (QER) Labour Force Survey (LFS) Reports Annual Overseas Trade Reports Annual Compendium of Statistics Annual Economics Report
PRESS RELEASE HOUSEHOLD BUDGET SURVEY 2015
 HELLENIC REPUBLIC HELLENIC STATISTICAL AUTHORITY Piraeus, 5/10/2016 PRESS RELEASE HOUSEHOLD BUDGET SURVEY 2015 The Hellenic Statistical Authority (ELSTAT) announces the results of the Household Budget
INFLATION REPORT MARCH 2009
 c INFLATION REPORT MARCH 2009 Contents A. NOTE: MARCH 2009 I B. APPENDIX: TABLE 1A: Jamaica s Headline Inflation Rates 1 TABLE 1B: CPI without Agriculture 2 TABLE 2 : Contribution to Inflation 3 TABLE
Headline and Core Inflation December 2017
 Dec-15 Jan-16 Mar-16 May-16 Jul-16 Sep-16 Nov-16 Jan-17 Mar-17 May-17 Jul-17 Sep-17 Nov-17 Dec-12 Mar-13 Jun-13 Sep-13 Dec-13 Mar-1 Jun-1 Sep-1 Dec-1 Mar-15 Jun-15 Sep-15 Dec-15 Mar-16 Sep-16 Mar-17 Sep-17
NCPI. August Namibia Consumer Price index. Namibia Consumer Price index - August
 NCPI Namibia Consumer Price index August 2018 Namibia Consumer Price index - August 2018 1 Mission Statement Leveraging on partnerships and innovative technologies, to produce and disseminate relevant,
OF PUBLIC FINANCES. Fabio Pammolli. Roma, 20 Ottobre 2009
 HEALTH CARE AND THE SUSTAINABILITY OF PUBLIC FINANCES Fabio Pammolli Roma, 20 Ottobre 2009 TRENDS< ECOFIN PROJECTIONS OECD PROJECTIONS MICRO MACRO IMBALANCES CONCLUDING DISCUSSION Total expenditure (pub
CONSUMER PRICE INDEX
 1. INTRODUCTION CONSUMER PRICE INDEX (Base period: July 2006 June 2007 = 100) Year This issue of Economic and Social Indicators presents the Consumer Price Index (CPI) for the year. The methodology used
Headline and Core Inflation March 2018
 Mar-16 Mar-13 May-13 Jul-13 Sep-13 Nov-13 Jan-1 Mar-1 May-1 Jul-1 Sep-1 Nov-1 Jan-15 Mar-15 May-15 Jul-15 Sep-15 Nov-15 Jan-16 Mar-16 Central Bank of Egypt Headline and Core Inflation March 218 Annual
Consumer Price Index
 STATISTICAL RELEASE P0141 Consumer Price Index May 2017 Embargoed until: 21 June 2017 10:00 ENQUIRIES: FORTHCOMING ISSUE: EXPECTED RELEASE DATE Marietjie Bennett / June 2017 19 July 2017 Evashnie Govender
CONSUMER PRICE INDEX
 1. INTRODUCTION CONSUMER PRICE INDEX (Base period: July 2006 June 2007 = 100) 1st Quarter 2010 This issue of Economic and Social Indicators presents the Consumer Price Index (CPI) for the first quarter
Headline and Core Inflation December 2010
 Headline and Core Inflation December 2010 Headline CPI published by CAPMAS on January 10, 2011 decelerated by 0.68 percent (m/m) in December following the 0.82 percent (m/m) decline in November. Despite
The CPI annual average rate of change was -0.3% in 2014 and the rate of change on a year earlier was -0.4% in December
 CONSUMER PRICES INDEX December 2014 13 January, 2015 The CPI annual average rate of change was -0.3% in 2014 and the rate of change on a year earlier was -0.4% in December The average rate of change of
The European economy since the start of the millennium
 The European economy since the start of the millennium A STATISTICAL PORTRAIT 2018 edition 1 Since the start of the millennium, the European economy has evolved and statistics can help to better perceive
Harmonized Household Budget Survey how to make it an effective supplementary tool for measuring living conditions
 Harmonized Household Budget Survey how to make it an effective supplementary tool for measuring living conditions Andreas GEORGIOU, President of Hellenic Statistical Authority Giorgos NTOUROS, Household
Short-term Inflation analysis and forecast. October 2018 RESEARCH SERVICES DEPARTMENT RESEARCH AND ECONOMIC PROGRAMMING DIVISION
 Short-term Inflation analysis and forecast October 2018 RESEARCH SERVICES DEPARTMENT RESEARCH AND ECONOMIC PROGRAMMING DIVISION c 2018 Bank of Jamaica Nethersole Place Kingston Jamaica Telephone: (876)
Data Source: National Bureau of Statistics
 ( Report Date: August 2017 Data Source: National Bureau of Statistics Brief Methodology 1 All Items Index 5 Food Index 6 All Items Less Farm Produce 7 Infographics 9 Statistical News 13 Acknowledgements/Contacts
Supplementary Appendices. Appendix C: Implications of Proposition 6. C.1 Price-Independent Generalized Linear ("PIGL") Preferences
 Preferences") Supplementary Appendices Appendix C considers some special cases of Proposition 6 in Section VI, while Appendix B supplements the empirical application in Section VII, explaining how the QUAIDS demand
Supplementary Appendices Appendix C considers some special cases of Proposition 6 in Section VI, while Appendix B supplements the empirical application in Section VII, explaining how the QUAIDS demand
3 EXPENDITURE WEIGHTS AND THEIR SOURCES
 3 EXPENDITURE WEIGHTS AND THEIR SOURCES Conceptual basis of the weights 1. A consumer price index (CPI) is usually calculated as a weighted average of the price change of the goods and services covered
Asian Journal of Economic Modelling MEASUREMENT OF THE COST-OF-LIVING INDEX IN THE EASI MODEL: EVIDENCE FROM THE JAPANESE EXPENDITURE DATA
 Asian Journal of Economic Modelling ISSN(e): 2312-3656/ISSN(p): 2313-2884 URL: www.aessweb.com MEASUREMENT OF THE COST-OF-LIVING INDEX IN THE EASI MODEL: EVIDENCE FROM THE JAPANESE EXPENDITURE DATA Manami
Short-term Inflation analysis and forecast. April 2018 RESEARCH SERVICES DEPARTMENT RESEARCH AND ECONOMIC PROGRAMMING DIVISION
 Short-term Inflation analysis and forecast April 2018 RESEARCH SERVICES DEPARTMENT RESEARCH AND ECONOMIC PROGRAMMING DIVISION c 2018 Bank of Jamaica Nethersole Place Kingston Jamaica Telephone: (876) 922
The CPI annual average rate of change was 1.4% in 2017 and the rate of change on a year earlier was 1.5% in December
 Consumer Prices Index December 2017 11 January 2018 The CPI annual average rate of change was 1.4% in 2017 and the rate of change on a year earlier was 1.5% in December The average rate of change of the
The impact of the Kenya CT-OVC Program on household spending. Kenya CT-OVC Evaluation Team Presented by Tia Palermo Naivasha, Kenya January 2011
 The impact of the Kenya CT-OVC Program on household spending Kenya CT-OVC Evaluation Team Presented by Tia Palermo Naivasha, Kenya January 2011 Kenya Cash Transfer Program for Orphans and Vulnerable Children
CONSUMER PRICE INDEX
 1. INTRODUCTION CONSUMER PRICE INDEX (Base period: January December 2012 = 100) Year 2015 This issue of Economic and Social Indicators presents the Consumer Price Index (CPI) for the year 2015. The methodology
Consumer Price Index (CPI). Base 2016 Harmonised Index of Consumer Prices (HICP). Base 2015 September 2018
. Base 2016 Harmonised Index of Consumer Prices (HICP). Base 2015 September 2018") 11 October 2018 Consumer Price Index (CPI). Base 2016 Harmonised Index of Consumer Prices (HICP). Base 2015 September 2018 Main results The annual rate of CPI for the month of September stands at 2.3%,
11 October 2018 Consumer Price Index (CPI). Base 2016 Harmonised Index of Consumer Prices (HICP). Base 2015 September 2018 Main results The annual rate of CPI for the month of September stands at 2.3%,
UNDERSTANDING ZIMBABWE S CURRENT INFLATION DYNAMICS
 UNDERSTANDING ZIMBABWE S CURRENT INFLATION DYNAMICS BY RESERVE BANK OF ZIMBABWE DECEMBER 2017 INTRODUCTION In February 2017, Zimbabwe s inflation moved from being negative to positive for the first time
PRESS RELEASE. The evolution of the Consumer Price Index (CPI) of December 2017 (reference year 2009=100.0) is depicted as follows:
 of December 2017 (reference year 2009=100.0) is depicted as follows:") HELLENIC EPUBLIC HELLENIC STATISTICAL AUTHOITY Piraeus, 12 January 2018 PESS ELEASE CONSUME PICE INDEX: December 2017, annual inflation 0.7% The evolution of the Consumer Price Index (CPI) of December
HELLENIC EPUBLIC HELLENIC STATISTICAL AUTHOITY Piraeus, 12 January 2018 PESS ELEASE CONSUME PICE INDEX: December 2017, annual inflation 0.7% The evolution of the Consumer Price Index (CPI) of December
Summary of findings of M6.1 questionnaire 1. Annex 1 M6.1 Business start-up aid for young farmers Main findings from questionnaires.
 Summary of findings of M6.1 questionnaire 1 Annex 1 M6.1 Business start-up aid for young farmers Main findings from questionnaires. Summary of findings of M6.1 questionnaire 2 Table of Contents Introduction...
SOMALILAND CONSUMER PRICE INDEX
 Methodology This publication provides monthly Consumer Price Indices Composite of Somaliland which is based on two main market baskets of Hargeisa urban households. The current Consumer Price Index was
Household consumption by purpose
 Household consumption by purpose Statistics Explained Data extracted in November 2018. Planned article update: November 2019. Household expenditure by consumption purpose - COICOP, EU-28, 2017, share of
Overall index Monthly change Change over last Annual change
 13 February 2015 Consumer Price Index (CPI). Base 2011 January 2015 all index Monthly change Change over last Annual change January 1.6 1.6 1.3 Main results The annual change of the CPI for the of January
MONTENEGRO. Name the source when using the data
 MONTENEGRO STATISTICAL OFFICE RELEASE No: 50 Podgorica, 03. 07. 2009 Name the source when using the data THE POVERTY ANALYSIS IN MONTENEGRO IN 2007 Podgorica, july 2009 Table of Contents 1. Introduction...
INFLATION REPORT May 2010
 INFLATION REPORT May 2010 Research Services Department Bank of Jamaica 16 November 2010 CONTENTS A. NOTE: May 2010 i B. APPENDIX: TABLE 1A: Jamaica Headline Inflation Rates 1 TABLE 1B: CPI without Food
Crowding Out Effect of Expenditure on Tobacco in Zambia: Evidence from the Living Conditions Monitoring Survey.
 Crowding Out Effect of Expenditure on Tobacco in Zambia: Evidence from the Living Conditions Monitoring Survey. Grieve Chelwa 1 25 th August, 2013 Abstract: Tobacco consumption is widely recognised as
Short-term Inflation analysis and forecast. May 2018 RESEARCH SERVICES DEPARTMENT RESEARCH AND ECONOMIC PROGRAMMING DIVISION
 Short-term Inflation analysis and forecast May 2018 RESEARCH SERVICES DEPARTMENT RESEARCH AND ECONOMIC PROGRAMMING DIVISION c 2018 Bank of Jamaica Nethersole Place Kingston Jamaica Telephone: (876) 922
Consumer Price Index (CPI). Base 2016 Harmonised Index of Consumer Prices (HICP). Base 2015 January 2019
. Base 2016 Harmonised Index of Consumer Prices (HICP). Base 2015 January 2019") 15 February 2019 Consumer Price Index (CPI). Base 2016 Harmonised Index of Consumer Prices (HICP). Base 2015 January 2019 Main results In January, the annual variation rate of the CPI was 1.0%, two tenths
15 February 2019 Consumer Price Index (CPI). Base 2016 Harmonised Index of Consumer Prices (HICP). Base 2015 January 2019 Main results In January, the annual variation rate of the CPI was 1.0%, two tenths
The Consumer Price Index
 Catalogue no. 62-001-X The Consumer Price Index How to obtain more information For information about this product or the wide range of services and data available from Statistics Canada, visit our website
Short-term Inflation analysis and forecast. January 2018 RESEARCH SERVICES DEPARTMENT RESEARCH AND ECONOMIC PROGRAMMING DIVISION
 Short-term Inflation analysis and forecast January 2018 RESEARCH SERVICES DEPARTMENT RESEARCH AND ECONOMIC PROGRAMMING DIVISION c 2018 Bank of Jamaica Nethersole Place Kingston Jamaica Telephone: (876)
Outline of presentation. National Accounts Office September 2016 Chiba, Japan
 25-27 September 2016 Chiba, Japan National Accounts Office Office of the National Economic and Social Development Board (NESDB) Outline of presentation Short Term Indicator Quarterly Gross Domestic Product
Evaluation, Monitoring and Incentives Mechanisms for Sub-national Capacity Building: Regional Policy in Italy
 Mechanisms for enhancing multi-level governance effectiveness Evaluation, Monitoring and Incentives Mechanisms for Sub-national Capacity Building: Regional Policy in Italy Flavia Terribile Ministry of
INCOME, EXPENDITURE AND CONSUMPTION OF HOUSEHOLDS IN 2017
 INCOME, EXPENDITURE AND CONSUMPTION OF HOUSEHOLDS IN 2017 Household income The annual total income average per capita is 5 586 BGN in 2017 and increases by 8.1 compared to 2016. The total income average
Consumer Price Index (CPI). Base 2016 Harmonised Index of Consumer Prices (HICP). Base 2015 October 2018
. Base 2016 Harmonised Index of Consumer Prices (HICP). Base 2015 October 2018") 14 November 2018 Consumer Price Index (CPI). Base 2016 Harmonised Index of Consumer Prices (HICP). Base 2015 October 2018 Main results The annual variation rate of CPI in October is 2.3%, the same as that
14 November 2018 Consumer Price Index (CPI). Base 2016 Harmonised Index of Consumer Prices (HICP). Base 2015 October 2018 Main results The annual variation rate of CPI in October is 2.3%, the same as that
CONSUMER PRICE INDEX
 CONSUMER PRICE INDEX (Base period: January December 2017 = 100) 3 rd Quarter 2018 1. INTRODUCTION This issue of Economic and Social Indicators presents the Consumer Price Index (CPI) for the third quarter
In general, expenditure inequalities are lower than the income inequalities for all consumption categories as shown by the Lorenz curve for four
 In general, expenditure inequalities are lower than the income inequalities for all consumption categories as shown by the Lorenz curve for four major categories of expenditure (Figures 9 and 10). According
Overall index Monthly variation Accumulated variation Annual variation January
 15 February 2017 Consumer Price Index (CPI). Base 2016 January 2017 all index Monthly variation Accumulated variation Annual variation January -0.5-0.5 3.0 Main results The annual variation of the CPI
CPI annual rate of change was 0.7% in August
 CONSUMER PRICES INDEX August 2015 10 September, 2015 CPI annual rate of change was 0.7% in August The CPI annual rate was 0.7% in August 2015, 0.1 percentage points (p.p.) lower than in the previous month.
Relative regional consumer price levels of goods and services, UK: 2016
 Article Relative regional consumer price levels of goods and services, UK: 2016 UK relative regional consumer price levels (RRCPLs) of goods and services for 2016. They provide an indication of a region's
METHODOLOGICAL ISSUES IN POVERTY RESEARCH
 METHODOLOGICAL ISSUES IN POVERTY RESEARCH IMPACT OF CHOICE OF EQUIVALENCE SCALE ON INCOME INEQUALITY AND ON POVERTY MEASURES* Ödön ÉLTETÕ Éva HAVASI Review of Sociology Vol. 8 (2002) 2, 137 148 Central
ASSOFIN - CRIF - PROMETEIA CALCOLO RETAIL CREDIT SURVEY
 ASSOFIN - CRIF - PROMETEIA CALCOLO RETAIL CREDIT SURVEY JUNE 2001 ISSUE NO.10 WITH DATA UPDATED TO 31 DECEMBER 2000 This Report has been made possible thanks to the co-operation of ASSOFIN - CRIF - PROMETEIA
The CPI annual average rate of change was 0.5% in 2015 and the rate of change on a year earlier was 0.4% in December
 Dec-11 Mar-12 Jun-12 Sep-12 Dec-12 Mar-13 Jun-13 Sep-13 Dec-13 Mar-14 Jun-14 Sep-14 Dec-14 Mar-15 Jun-15 Sep-15 Dec-15 Consumer Prices Index December 2015 January 13, 2016 The CPI annual average rate of
Short-term Inflation analysis and forecasts. November 2017 RESEARCH SERVICES DEPARTMENT RESEARCH AND ECONOMIC PROGRAMMING DIVISION
 Short-term Inflation analysis and forecasts November 2017 RESEARCH SERVICES DEPARTMENT RESEARCH AND ECONOMIC PROGRAMMING DIVISION c 2017 Bank of Jamaica Nethersole Place Kingston Jamaica Telephone: (876)
An ex-post analysis of Italian fiscal policy on renovation
 An ex-post analysis of Italian fiscal policy on renovation Marco Manzo, Daniela Tellone VERY FIRST DRAFT, PLEASE DO NOT CITE June 9 th 2017 Abstract In June 2012, the share of dwellings renovation costs
Living Costs and Food Survey
 Living Costs and Food Survey Main results and developments Giles Horsfield Headline figure 2010 Average household weekly expenditure was 474 ( 455 in 2009) Increase to 2008 levels, after a drop was reported
Statistical release P0141
 Statistical release Consumer Price Index June 2015 Embargoed until: 22 July 2015 10:00 Enquiries: Forthcoming issue: Expected release date Marietjie Bennett / Anita Voges July 2015 19 August 2015 (012)
Consumer Price Index (CPI). Base 2011 January Monthly change Change over last Annual change
. Base 2011 January Monthly change Change over last Annual change") 14 February 2014 Consumer Price Index (CPI). Base 2011 January 2014 all index Monthly change Change over last Annual change January January 1.3 1.3 Main results The annual change of the CPI for the of
14 February 2014 Consumer Price Index (CPI). Base 2011 January 2014 all index Monthly change Change over last Annual change January January 1.3 1.3 Main results The annual change of the CPI for the of
Report Date: May Data Source: National Bureau of Statistics. Brief Methodology 1. All Items Index 5
 ( Report Date: May 2017 Data Source: National Bureau of Statistics Brief Methodology 1 All Items Index 5 Food Index 6 All Items Less Farm Produce 6 Infographics 7 Statistical News 11 Acknowledgements/Contacts
POVERTY ANALYSIS IN MONTENEGRO IN 2013
 MONTENEGRO STATISTICAL OFFICE POVERTY ANALYSIS IN MONTENEGRO IN 2013 Podgorica, December 2014 CONTENT 1. Introduction... 4 2. Poverty in Montenegro in period 2011-2013.... 4 3. Poverty Profile in 2013...
How were Lebanese Households Allocating Their Pay checks in 2012?
 checks in 2012? BLOMINVEST BANK In the words of James W. Frick, the American author, Don t tell me where your priorities are. Show me where you spend your money and I ll tell you what they are. In the
1. The Armenian Integrated Living Conditions Survey
 MEASURING POVERTY IN ARMENIA: METHODOLOGICAL EXPLANATIONS Since 1996, when the current methodology for surveying well being of households was introduced in Armenia, the National Statistical Service of
INCOME, EXPENDITURE AND CONSUMPTION OF HOUSEHOLDS IN 2016
 INCOME, EXPENDITURE AND CONSUMPTION OF HOUSEHOLDS IN 2016 Household income The annual total income average per capita is 5 167 BGN in 2016 and increases by 4.3 compared to 2015. The total income average
CONSUMER PRICE INDEX
 CONSUMER PRICE INDEX (Base period: January December 2012 = 100) 3 rd Quarter 2017 1. INTRODUCTION This issue of Economic and Social Indicators presents the Consumer Price Index (CPI) for the third quarter
The national monthly CPI (2008=100) increased from per cent in November, 2017 to per cent
 increased from per cent in November, 2017 to per cent") CONSUMER PRICE INDEX (CPI) December, 2017: PRESS RELEASE Released on Monday January 17, 2017 at 1:00 pm DECEMBER 2017 MONTHLY INFLATION RATE INCREASES SIGHTLY The national monthly CPI (2008=100) increased
CONSUMER PRICE INDEX (CPI) December, 2017: PRESS RELEASE Released on Monday January 17, 2017 at 1:00 pm DECEMBER 2017 MONTHLY INFLATION RATE INCREASES SIGHTLY The national monthly CPI (2008=100) increased
Working Party on National Accounts
 Unclassified Unclassified Organisation de Coopération et de Développement Économiques Organisation for Economic Co-operation and Development 22-Oct-2015 English - Or. English STATISTICS DIRECTORATE COMMITTEE
The CPI annual average rate of change was 1.0% in 2018 and the rate of change on a year earlier was 0.7% in December
 Consumer Price Index December 2018 11 de January 2019 The CPI annual average rate of change was 1.0% in 2018 and the rate of change on a year earlier was 0.7% in December In 2018, the average rate of change
No 15/96 29 February 1996
 No 15/96 29 February 1996 Interim step towards harmonised measurement of consumer prices NEW WAY OF COMPARING EU INFLATION Required for the assessment of convergence for Economic and Monetary Union An
BP s impact on the economy in. A report by Oxford Economics December 2017
 BP s impact on the economy in A report by Oxford Economics December 2017 1.2bn Gross value added contribution supported by BP in Italy BP supported 24,300 One in every 1,000 in Italy jobs BP s activity
INFLATION REPORT MAY 2009
 c INFLATION REPORT MAY 2009 Contents A. NOTE: MAY 2009 I B. APPENDIX: TABLE 1A: Jamaica s Headline Inflation Rates 1 TABLE 1B: CPI without Agriculture 2 TABLE 2 : Contribution to Inflation 3 TABLE 3: Regional