Port of Port Angeles 2013 Budget Variance Report Operations 4th Quarter December 2013
|
|
|
- Sybil Phillips
- 5 years ago
- Views:
Transcription
1 Port of Port Angeles 2013 Budget Variance Report Operations 4th Quarter December 2013 Table of Contents 1. Operating Budget Variance (Narrative) 2. Operating Budget Variance Graphs 3. Operating Budget to Actual Variance Reports a. General Fund Summary b. Salary and Benefit (Port-Wide) c. Account Summary by Department Operating Variances (Narrative) Total operating revenues are over budget by $589k, which is 7% and operating expenses are under budget by ($255k), which is (4%). Operating net surplus is $2.6 million which is a favorable variance of $845k or 47%. The higher revenue is primarily due to increased Marine Terminal revenues for dockage cargo, wharfage and x-dock services (related to increased log exports). Expenses overall were under due to lower outside services (technology, environmental compliance), marketing, convention travel, community relations, supplies, maintenance, and $180k contingency placeholder. These cost savings were partially offset by $180k overage in salaries & benefits related to salary adjustments and under-budgeting in security, and $81k in Utilities due to change in recording pass-thru utilities. Port-Wide Activity versus Department Activity We have been in the process of restructuring our chart of accounts, integrating budgets into the accounting system and writing new financial reports that align with best practices and accounting standards. The revenues and expenses are correct on a Port-wide basis, however, there are some anomalies at the department level. Salary & Benefits: There is a mix of methods in distributing salary and benefit expenses for employees that are split amongst departments and charging out maintenance labor to include benefit costs. (See the Salary and Benefit Variance Report for a review on a Port-wide basis). Revenue & Expense Groupings: New account coding was implemented in May as well as revised revenue and expense categories for budget and reporting purposes. There are amounts in old accounts that have not been moved to new accounts and categories. We are also working through separating utilities that are used in operations from utilities that are a pass-thru or re-billed to tenants and reclassifying miscellaneous revenues and expenses. Qtr4 Variance-Ops Narrative.doc Page 1 of 6
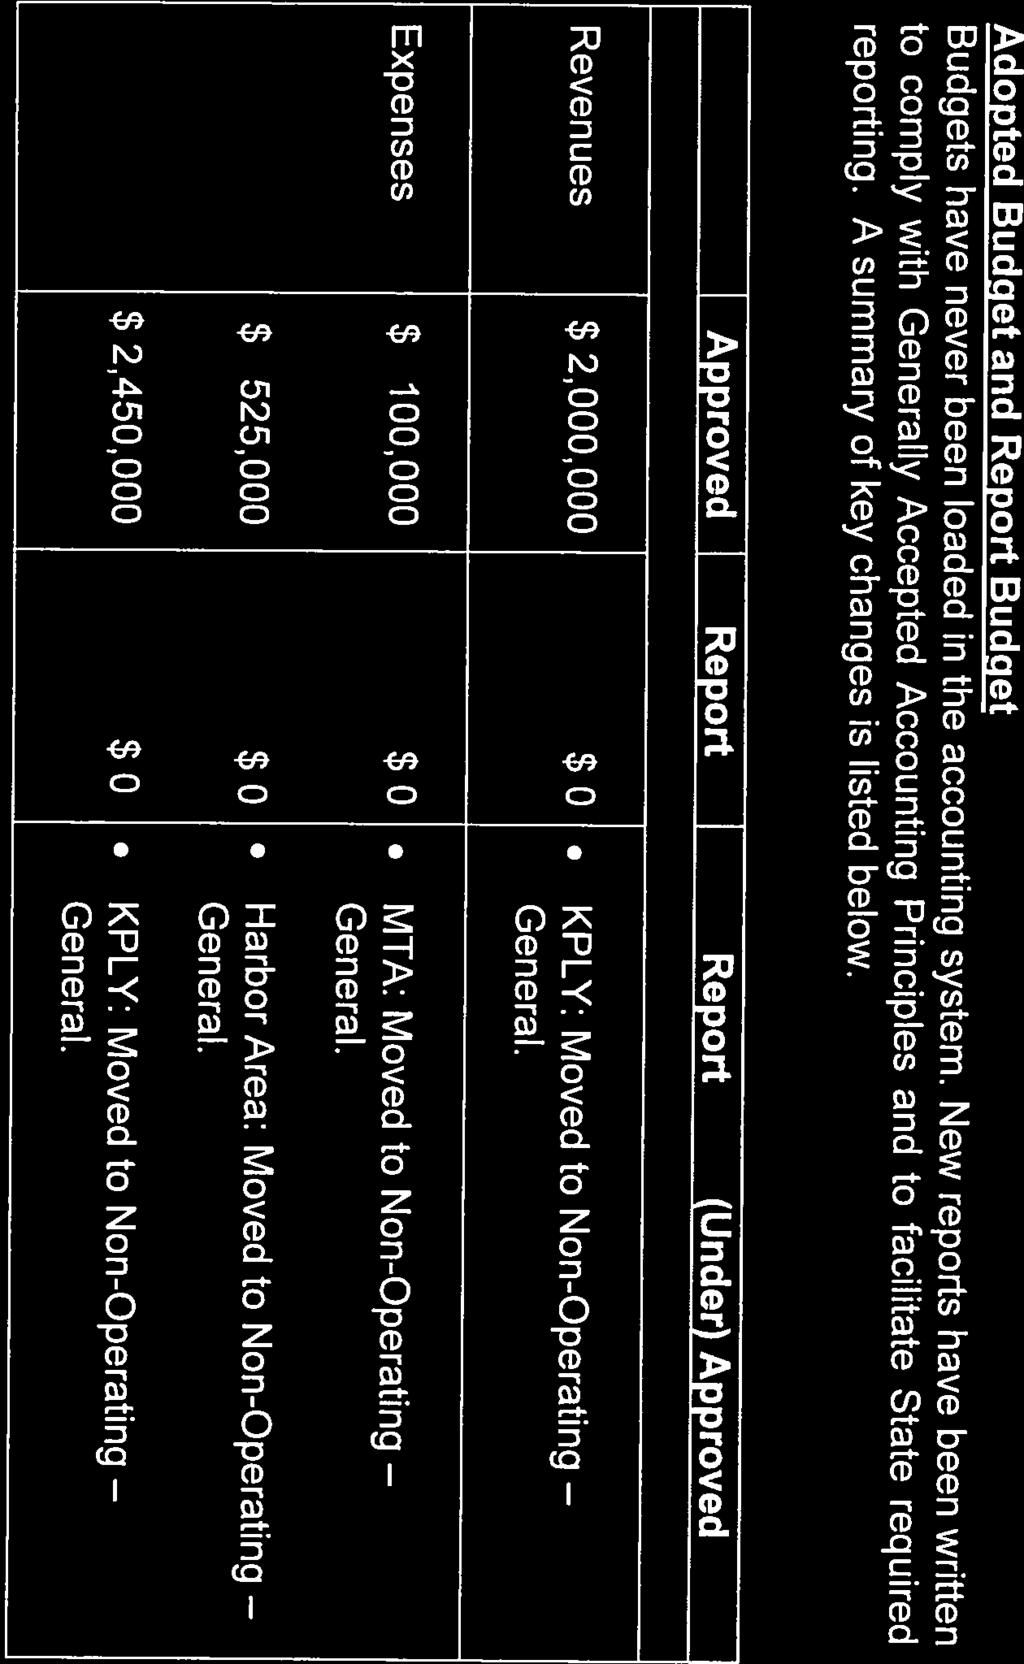
2 Adopted Budget and Report Budget: Budgets have never been loaded in the accounting system and new reports have been written to comply with Generally Accepted Accounting Principles and to facilitate State required reporting. A summary of key changes is listed below. This will continue to be refined. Approved Report Report Over (Under) Approved Operating Revenues $ 7,909,294 $ 7,924,294 Added $10k Airport passenger facility fees. From NonOp to Op $5k late fees. Expenses $ 6,184,598 $ 6,132,298 From NonOp to Op: $11,500 bank fees. From Op to NonOp: ($17k) election From Op to Capital: ($85k) boomboat and swifter maint. From Admin to Econ Dev: $25k Economic Impact Study. Surplus $ 1,724,696 $ 1,791,996 Non-Operating Revenues $ 304,600 General Capital Total $2,299,600 $3,223,341 $5,522,941 Expenses General Capital Total $ 12,200 $3,092,000 $ 430,131 $3,522,131 Surplus $ 292,400 General Capital Total ($792,400) $2,793,210 $2,000,810 Net Surplus $ 2,017,096 $ 3,792,806 Taxes, grants, interest: Added Property Taxes: $1.3 million. From Capital to NonOp General: $2 million Ecology grant for K-Ply. From Capital to NonOp Capital: $1.8 million grants for Airport, MT, Marinas. Bond payments, election: From NonOp to Op: ($11,500) bank fees. From Op to NonOp: $17k election. From Capital to NonOp General: $2,450k K-Ply; $525k Harbor Area; $100k MTA. Added Bond Payments: $430k. Qtr4 Variance-Ops Narrative.doc Page 2 of 6
3 Summary of Budget to Actual Variances Operating Revenues Marine Terminals Log Yard Airports PA Boat Haven John Wayne Marina Boat Yard Public Boat Ramps Variance $589k or 7% overrun $495k or 21% higher ($87k) or (7%) lower $13k or 4% higher $53k or 5% higher $6k or 1% higher $45k or 19% higher ($5k) under or (10%) lower Explanation of Variance Revenues are $495k higher than budget and expenses are ($9k) lower. Revenues are higher due to log exports: $360k Cargo Dockage, $172k Wharfage, $118k Services. This was partially offset by lower Repair Dockage ($92k) under in tankers and ($122k) under in non-tankers. Utility pass through revenues are higher for shore power due to a higher number of dock days. Revenues are ($87k) lower than budget and expenses are $2k higher. Revenues are lower due to lower handling land services (decked loads and containers loaded) which were ($179k) below budget; handling water services (round boom, vessel tending) and staging fees were $56k higher than budget; equipment rental $22k over. Land rental is ($12k) below budget because Nippon lease ended in Revenues are $13k higher and expenses are ($32k) lower. PFCs are $6k higher. Landing fees are ($9k) below budget. Parking fees are ($2k) below budget. Hangar receipts are $1k higher than budget, which was based on a 2013 Budgeted (3%) decrease from All real estate rentals (Land, Structure & Use Agmts) are $10k above budget, some new leases were added but were partially offset by Westport cancellation. Utility pass-thru revenue was $7k compared to a zero budget due to recording of pass-thru amounts as revenues. Revenues are $53k higher and expenses are ($16k) under. Moorage fees are $30k higher due to Guest Moorage, Tribal non-taxable moorage and 60+ foot moorage. Revenues are $6k higher and expenses are $77k higher. Moorage fees are ($71k) lower and are offset by higher Fuel Sales $45k and Pass Thru Utility Sales $30k. Misc. Revenues are the banquet room, late fees and insurance noncompliance fees. Revenues are $45k higher and expenses are ($14k) lower. Yard fees are $86k higher partly due to higher activity and partly due to correcting the coding of revenue from Equipment Rental to Yard Fees. Equipment rental is under by ($59k) due to the change in yard fee coding. Revenues are $($5k) under and expenses are ($1k) under. Public Boat ramps in on track with budget. Qtr4 Variance-Ops Narrative.doc Page 3 of 6
4 Rental Properties Operating Expenses Marine Terminals $67k or 5% higher ($255k) or (4%) under ($9k) or (1%) under budget Log Yard $2k or 0% over budget Airports PA Boat Haven John Wayne Marina Boat Yard ($32k) or (7%) under budget ($16k) or (3%) under budget $80k or 11% over budget ($14k) or (7%) under budget Revenues are $67k higher and expenses are ($64k) lower. Rental revenue is higher due to revising some rents to market value (PUD, OESD and others). We are transitioning to Land and Structure rent re-classifications, therefore, combined revenue should be reviewed. We are also working on recording Utility Pass Thru amounts as revenue and expense, instead of netting the rebilled amount against expense. InterDept revenue is ($50k) negative because it is an offset to revenue to the airport for use of land for the airport industrial park. ($83k) under in Salaries & Benefits due to working through new method of allocating employee costs. $40k over budget in utility costs related to more vessel days at dock, the amounts are re-billed to vessels. $23k over budget in Maintenance services and materials due to Cleat repairs. $89k over in Salaries & Benefits due to working through new method of allocating employee costs and working outside normal business hours at customer request; ($28k) under in general Supplies for fuel due to less use of equipment, which is related to lower handling land services; ($19k) under in outside services. $12k over budget in Salaries & Benefits due to vacation cash-out of retiring Airport Mgr; ($17k) under budget in Supplies, mostly in fuel and a slightly under in safety supplies. ($8k) under in Outside Services. ($22k) under for maintenance labor, materials and services due to delay of Trench drain repair until $26k over budget in Salaries & benefits due to working through new method of allocating costs. ($9k) under in Supplies - changed to lower cost vendor and ($7k) under in Outside Services. ($20k) under in Maintenance charge-out expense for hydrant repair due to change of plan and did not complete fire line installation on West PABH. $32k over in Salaries and benefits due to working through new method of allocating employee costs. $22k over in Utility costs due to change in process. $13k over in General Supplies Fuel purchases. ($19k) under due to lower than expected Maintenance charge out expense. Qtr4 Variance-Ops Narrative.doc Page 4 of 6
5 Public Boat Ramps Rental Properties Mechanical Maintenance Facilities Maintenance Business (Economic) Development Admin ($1k) or (19%) under ($64k) or (13%) under budget ($6k) or (6%) under budget ($1k) or (1%) under budget ($53k) or (22%) under budget ($141k) or (9%) under budget ($1k) under budget due to Maintenance Materials. $38k over in Salaries and Benefits, due to working through new method of allocating employee costs. ($64k) under in outside services due to not hiring temporary help and the delay in legal services for re-writing template leases. ($1k) under in taxes for stormwater, irrigation and weed control assessments (previously charged to Admin); still working through utilities and pass-thru utilities; ($50k) under in InterDept expense due to change in accounting for use of airport land for the industrial park, changed to offset revenue instead of recording as an expense. ($8k) under in Admin Salaries and Maintenance Labor & Benefits due to transition to using a charge-out rate. ($5k) under in Supplies, primarily fuel; $5k over in Outside Services for maintenance of equipment. FM is on track with budget. Admin Salary and Maintenance Labor is slightly over and under due to the new method of charging labor. $8k over in Salaries & Benefits due to transition to using new method to allocate employee costs; ($30k) under in Marketing for specific programs for supplies and advertising; ($19k) under in Community Relations, was not able to do the First Robotics program or science training program; ($26k) under in travel, no attendance at Paris Air Show and determined that some other conferences would not have enough value; ($5k) under in promotional hosting, of which $2,500 was recorded to Log Yard for the Logging Conference. Promotional hosting is budgeted high, because any overages require a budget amendment. $82k over in Salaries & Benefits due to salary adjustments for some positions and transition to new method of allocating employee costs; ($26k) under in office and safety supplies; ($5k) under in Outside Services which includes: ($25k) under in Strategic Plan consulting; ($30k) under in accounting IT support for accounting system improvements which will be capitalized; $28k over in legal for internal investigation; $13k over in audit fees; $55k over for interim Executive Director contract; $5k over for office equipment Rental that was not budgeted and began recording internet as a telecommunication Utility instead of Outside Services; ($48k) under in Other which is a placeholder for insurance deductible claim. ($180k) under in Contingency, which is a placeholder. Qtr4 Variance-Ops Narrative.doc Page 5 of 6
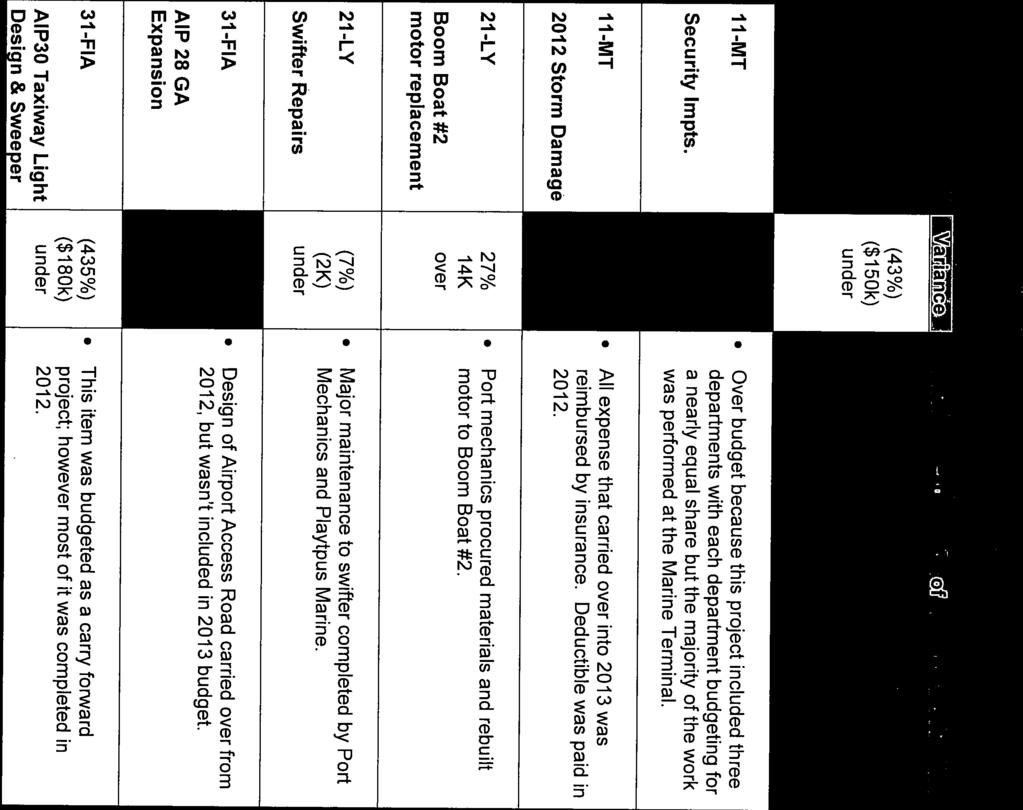
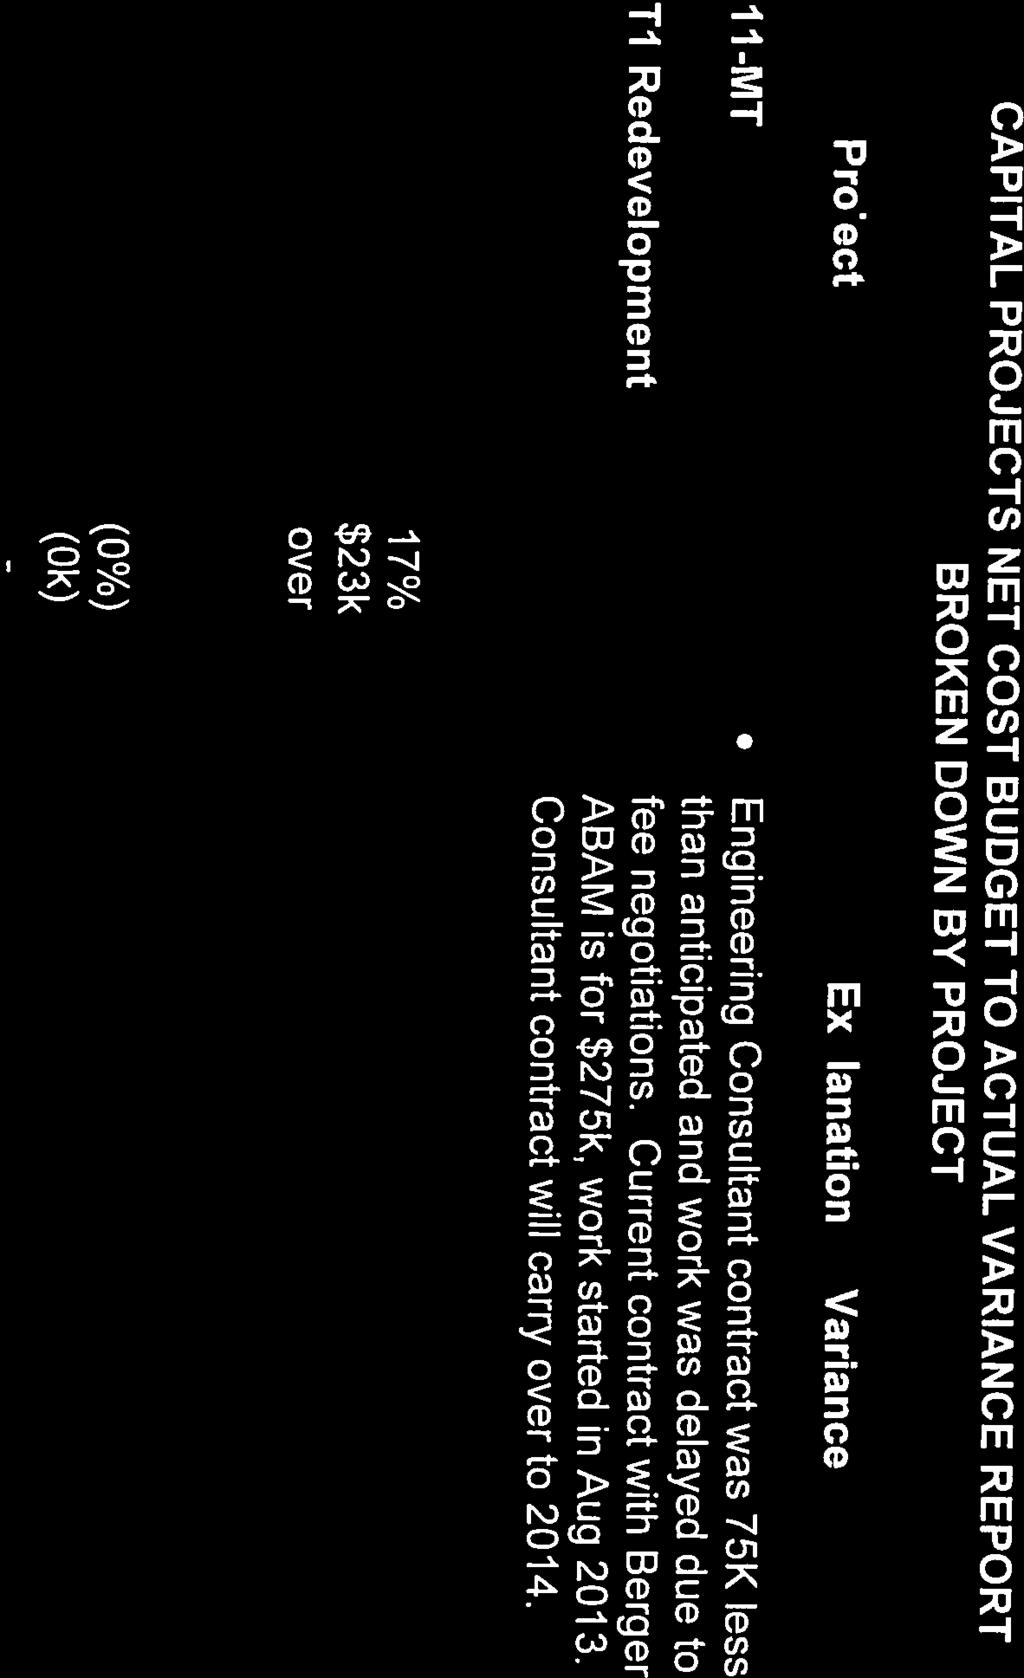
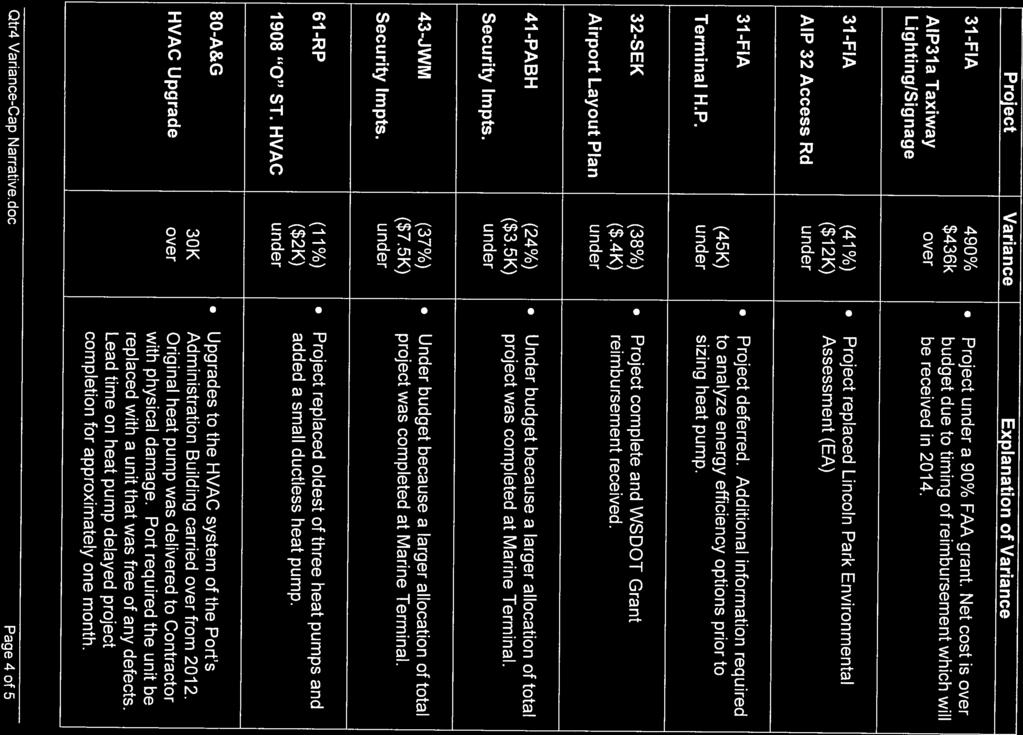
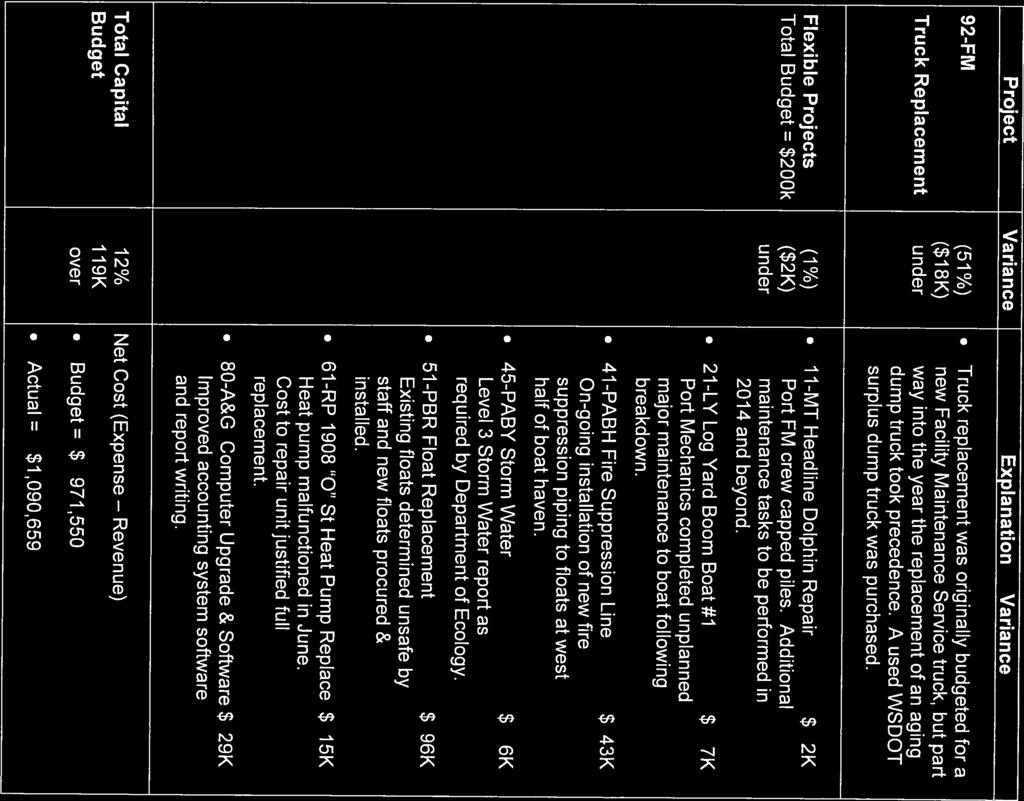
6 Operating Surplus Non-Op General Deficit Non-Op Capital Surplus $845k or 47% higher $309k smaller deficit or 39% better than budget ($1.0 mil) lower surplus or (37%) under budget Revenues were significantly higher for Marine Terminal and Expenses were under in contingency and in some depts. Non-Operating General Revenues: ($1.4 mil) under due to timing of K-Ply grant revenues. Variances include: $158k over in interest due to higher fund balances and maintaining existing interest rates. $90k over in timber tax due to a conservative budget since revenue is unpredictable; $103k over in Misc for insurance recovery related to prior year environmental expenses. ($1.8mil) under in grants, which is for K-Ply and is a timing difference; $338k over for insurance reimbursements for Harbor Area; $28k Special Revenue consisting of $38k gain on sale of Harbor Action equipment and surplus of old Port equipment and scrap and ($10k) settlement expense. Non-Operating General Expenses: ($1.8 mil) under in Environmental expenses due to: ($100k) under for MTA site; ($587k) under for K-Ply Demolition due to good bid price and high budgeting; ($438k) under for K-Ply site investigation due to direct payment by insurance and carryover to 2014; ($226k) under for Harbor Area due to high budgeting; $35k over in Misc Exp due to election costs. Non-Operating Capital Revenues: ($1.1 mil) under in Airport Capital Grants due to timing of projects and grant revenues (AIP30 Taxiway Light/Sweeper completed in 2012; AIP31 Taxiway lighting/signage will be reimbursed in 2014; AIP32 Access Rd replaced Lincoln Park EA). Grants are also reported by Dept see Marine Terminal, Airports, Marinas for Capital Grant Revenue; see Capital Budget to Actual report for capital expenditures. Non-Operating Capital Expenses: $1k over in Bond costs and Interest Expense due to recalculation of 2012 bond issue amortization. Qtr4 Variance-Ops Narrative.doc Page 6 of 6
7 6,000,000 5,000,000 4,000,000 3,000,000 2,000,000 1,000,000 0 Operating Activity (Excludes Non Operating & Depreciation) Operating Revenues Operating Expenses Surplus Actual 8,513,479 5,876,859 2,636,620 Budget 7,924,294 6,132,298 1,791,996 2,500,000 2,000,000 1,500,000 1,000, ,000 0 Marine Terminal (Before Allocations & Depreciation) Revenues Expenses Surplus Actual 2,861, ,096 2,231,151 Budget 2,366, ,859 1,727,141 2,500,000 2,000,000 1,500,000 1,000, ,000 0 (500,000) Log Yard (Before Allocations & Depreciation) Revenues Expenses (Deficit) Actual 1,129, , ,681 Budget 1,217, , ,120 H:\Financial Reports\2013\2013 Qtr4\2013 Q4 Graphs-Ops w Marinas.xlsx, GRAPHS Graph Page 1 of 4
8 2,500,000 2,000,000 1,500,000 1,000, ,000 0 (500,000) Airports (Before Allocations & Depreciation) Revenues Expenses (Deficit) Actual 366, ,889 (61,400) Budget 353, ,186 (106,876) 2,500,000 2,000,000 1,500,000 1,000, ,000 0 PA Boat Haven (Before Allocations & Depreciation) Revenues Expenses Surplus Actual 1,190, , ,530 Budget 1,137, , ,495 2,500,000 2,000,000 1,500,000 1,000, ,000 0 John Wayne Marina (Before Allocations & Depreciation) Revenues Expenses Surplus Actual 1,110, , ,524 Budget 1,104, , ,070 H:\Financial Reports\2013\2013 Qtr4\2013 Q4 Graphs-Ops w Marinas.xlsx, GRAPHS Graph Page 2 of 4
9 2,500,000 PA Boat Yard (Before Allocations & Depreciation) 2,000,000 1,500,000 1,000, ,000 0 Revenues Expenses Surplus Actual 283, , ,567 Budget 238, ,646 50,354 2,500,000 Boat Launch Ramps (Before Allocations & Depreciation) 2,000,000 1,500,000 1,000, ,000 0 Revenues Expenses Surplus Actual 45,093 5,918 39,175 Budget 50,000 7,288 42,712 2,500,000 2,000,000 1,500,000 1,000, ,000 0 Rental Properties (Before Allocations & Depreciation) Revenues Expenses Surplus Actual 1,525, ,802 1,102,301 Budget 1,458, , ,907 H:\Financial Reports\2013\2013 Qtr4\2013 Q4 Graphs-Ops w Marinas.xlsx, GRAPHS Graph Page 3 of 4
10 Allocable Expenses (after Direct Charges) 2,500,000 2,000,000 1,500,000 1,000, ,000 0 Mech Shop Facilities Maint Econ Dev Admin & Gen Allocated Total Actual 91, , ,068 1,505,990 1,944,464 Budget 97, , ,298 1,646,951 2,145,927 3,000,000 2,500,000 2,000,000 1,500,000 1,000, ,000 0 (500,000) (1,000,000) Non Operating General (All Depts) (Interest, Timber Taxes, Misc, Op Grants, Environmental) Revenues Expenses Surplus Actual 852,140 1,335,956 (483,816) Budget 2,299,600 3,092,000 (792,400) 3,000,000 2,500,000 2,000,000 1,500,000 1,000, ,000 0 Non Operating Capital Related (All Depts) (Prop Taxes, Capital Grants, Bonds) Revenues Expenses Surplus Actual 2,184, ,077 1,753,710 Budget 3,223, ,131 2,793,210 H:\Financial Reports\2013\2013 Qtr4\2013 Q4 Graphs-Ops w Marinas.xlsx, GRAPHS Graph Page 4 of 4
11 Port of Port Angeles General Fund Summary Budget Variance Report For the Twelve Months Ending December 31, 2013 DECEMBER 2013 Variance Report YTD YTD OVER (UNDER) OVER (UNDER) ANNUAL ACTUAL BUDGET BUDGET $ BUDGET % BUDGET OPERATING REVENUES MARINE TERMINAL 2,861,246 2,366, ,246 21% 2,366,000 LOG YARD 1,129,934 1,217,000 (87,066) (7%) 1,217,000 AIRPORTS 366, ,310 13,178 4% 353,310 MARINA: Port Angeles Boat Haven 1,190,244 1,137,284 52,960 5% 1,137,284 MARINA: John Wayne Marina 1,110,561 1,104,200 6,361 1% 1,104,200 MARINA: Port Angeles Boat Yard 283, ,000 45,254 19% 238,000 MARINA: Boat Launch Ramps 45,093 50,000 (4,907) (10%) 50,000 RENTAL PROPERTIES 1,525,104 1,458,500 66,604 5% 1,458,500 ADMIN & GENERAL 1, ,555 0% 0 TOTAL OPERATING REVENUES 8,513,479 7,924, ,185 7% 7,924,294 NON-OPERATING REVENUES GENERAL 852,140 2,299,600 (1,447,460) (63%) 2,299,600 CAPITAL 2,184,787 3,223,341 (1,038,554) (32%) 3,223,341 TOTAL NON-OPERATING REVENUES 3,036,926 5,522,941 (2,486,015) (45%) 5,522,941 TOTAL REVENUES 11,550,406 13,447,235 (1,896,829) (14%) 13,447,235 OPERATING EXPENSES MARINE TERMINAL 630, ,859 (8,764) (1%) 638,859 LOG YARD 952, ,880 2,373 0% 949,880 AIRPORTS 427, ,186 (32,297) (7%) 460,186 MARINA: Port Angeles Boat Haven 531, ,789 (16,075) (3%) 547,789 MARINA: John Wayne Marina 788, ,130 79,907 11% 708,130 MARINA: Port Angeles Boat Yard 173, ,646 (13,959) (7%) 187,646 MARINA: Boat Launch Ramps 5,918 7,288 (1,370) (19%) 7,288 RENTAL PROPERTIES 422, ,593 (63,791) (13%) 486,593 BUSINESS UNIT EXPENSES 3,932,395 3,986,371 (53,976) (1%) 3,986,371 MECHANICAL MAINTENANCE 91,062 97,166 (6,104) (6%) 97,166 FACILITIES MAINTENANCE 156, ,512 (1,167) (1%) 157,512 ECONOMIC DEVELOPMENT 191, ,298 (53,230) (22%) 244,298 ADMIN & GENERAL 1,505,990 1,646,951 (140,961) (9%) 1,646,951 MAINT & ALLOCATED EXPENSES 1,944,464 2,145,927 (201,463) (9%) 2,145,927 OPERATING EXPENSES 5,876,859 6,132,298 (255,439) (4%) 6,132,298 NON-OPERATING EXPENSES GENERAL 1,335,956 3,092,000 (1,756,044) (57%) 3,092,000 CAPITAL 431, , % 430,131 TOTAL NON-OPERATING EXPENSES 1,767,032 3,522,131 (1,755,099) (50%) 3,522,131 TOTAL EXPENDITURES 7,643,892 9,654,429 (2,010,537) (21%) 9,654,429 OPERATING NET SURPLUS (DEFICIT) 2,636,620 1,791, ,624 47% 1,791,996 NON-OP NET SURPLUS (DEFICIT) 1,269,894 2,000,810 (730,916) (37%) 2,000,810 NET SURPLUS (DEFICIT) 3,906,514 3,792, ,708 3% 3,792,806 Report: Bud v Act GF Su2 Printed on: 02/05/14 09:09 AM Page 1 Row: General Fund Sum w Marinas Column: Gen Fund Variance Report YTD
12 Port of Port Angeles Summary of All Units Salary and Benefit: Budget to Actual Variance For the Twelve Months Ending December 31, 2013 December 2013 Variance Report YTD YTD OVER (UNDER) OVER (UNDER) ANNUAL ACTUAL BUDGET BUDGET $ BUDGET % BUDGET SALARIES & WAGES 1,761,758 1,625, ,878 8% 1,625,880 OVERTIME 47, ,830 0% 0 MAINTENANCE LABOR 604, ,344 40,627 7% 564,344 MAINTENANCE OVERTIME 12,116 12, % 12,000 SALARIES & OVERTIME 2,426,675 2,202, ,451 10% 2,202,224 PAYROLL TAXES 169, ,028 2,099 1% 167,028 RETIREMENT 139, ,553 10,935 9% 128,553 HEALTH & LIFE INSURANCE 325, ,887 (38,523) (11%) 363,887 OTHER BENEFITS 17,842 9,139 8,703 95% 9,139 MAINT PAYROLL TAXES 58,642 47,854 10,788 23% 47,854 MAINT RETIREMENT 46,613 36,734 9,879 27% 36,734 MAINT HEALTH & LIFE INSURANCE 105,107 80,329 24,778 31% 80,329 BENEFITS 862, ,524 28,659 3% 833,524 SALARIES & BENEFITS 3,288,858 3,035, ,110 8% 3,035,748 BENEFITS AS A % SALARIES 35.53% 37.85% -2.32% -6.13% 37.85% NON-MAINT CHARGE-OUT 673, ,102 0% 0 NON-MAINT Reimbursement (666,407) 0 (666,407) 0% 0 NON-MAINT (Split EE & Security) CHARGE-OUT 6, ,695 0% 0 MAINT CHARGE-OUT EXPENSE 616, ,539 (115,839) (16%) 732,539 MAINT CAPITALIZED LABOR 91, ,408 0% 0 MAINT ENVIRONMENTAL LABOR 5, ,772 0% 0 MAINT CHARGE-OUT Reimbursement (787,966) (732,539) (55,427) 8% (732,539) MAINTENANCE CHARGE-OUT (74,086) 0 (74,086) 0% 0 TOTAL SALARIES & BENEFITS EXPENSES 3,221,467 3,035, ,719 6% 3,035,748 Report: Bud v Act SalBen Printed on: 02/05/14 03:50 PM Page 1 Row: Salaries & Benefits Variance Column: ACTUAL TO BUDGET
13 Port of Port Angeles MARINE TERMINAL (11) Account Summary: Budget to Actual Variance For the Twelve Months Ending December 31, 2013 December 2013 Variance Report YTD YTD OVER (UNDER) OVER (UNDER) ANNUAL ACTUAL BUDGET BUDGET $ BUDGET % BUDGET OPERATING REVENUES DOCKAGE 1,246,726 1,100, ,726 13% 1,100,000 WHARFAGE 805, , ,916 27% 634,000 SERVICE & FACILITIES 479, , ,513 32% 362,000 MT HANDLING 0 2,000 (2,000) (100%) 2,000 LABOR SERVICES 168, ,000 13,906 9% 155,000 OTHER USER FEES 1, ,497 0% 0 EQUIPMENT RENTAL 19,616 20,000 (384) (2%) 20,000 LAND LEASE/RENT 10, ,015 0% 0 STRUCTURE LEASE/RENT 16,821 32,000 (15,179) (47%) 32,000 USE AGMT AND OTHER RENT 24,150 25,000 (850) (3%) 25,000 UTILITY PASS THRU & PRODUCT SALES 87,127 30,000 57, % 30,000 MISC & INTERDEPT REVENUE 958 6,000 (5,042) (84%) 6,000 TOTAL OPERATING REVENUES 2,861,246 2,366, ,246 21% 2,366,000 OPERATING EXPENSES SALARIES & WAGES 79, ,161 (129,634) (62%) 209,161 BENEFITS 26, ,452 (74,528) (73%) 101,452 NON-MAINT EE CHARGE-OUT & REIMBURSEMENT 121, ,315 0% 0 SUPPLIES 14,174 14, % 14,000 OUTSIDE SERVICES 21,754 17,000 4,754 28% 17,000 ADS, DUES & PUBLICATIONS 1,259 2,000 (741) (37%) 2,000 TRAVEL MEETINGS 1, ,376 0% 0 TRAVEL/TRAINING 1,343 5,000 (3,657) (73%) 5,000 RENT, UTILITIES, INSURANCE, TAXES 129, ,000 6,826 6% 123,000 UTILITY (Pass Thru) & COST OF GOODS SOLD 40, ,416 0% 0 OTHER EXPENSES (Misc & Interdept) 1, ,736 0% 0 MAINTENANCE CHARGE-OUT & REIMBURSEMENT 116, ,246 11,237 11% 105,246 MAINTENANCE (Materials & Services) 73,961 62,000 11,961 19% 62,000 TOTAL OPERATING EXPENSES 630, ,859 (8,764) (1%) 638,859 OPERATING SURPLUS (DEFICIT) (before Depr) 2,231,151 1,727, ,010 29% 1,727,141 ALLOCATED EXPENSES % 0 DEPRECIATION (includes donated assets) % 0 NON-OP CAPITAL REVENUES GRANTS - CAPITAL 113,300 60,000 53,300 89% 60,000 TOTAL NON-OP CAPITAL REV 113,300 60,000 53,300 89% 60,000 NET NON-OP CAPITAL SURPLUS (DEFICIT) 113,300 60,000 53,300 89% 60,000 NET NON-OP SURPLUS (DEFICIT) 113,300 60,000 53,300 89% 60,000 TOTAL NET SURPLUS (DEFICIT) (before Depr) 2,344,451 1,787, ,310 31% 1,787,141 TOTAL NET SURPLUS (DEFICIT) (after Depr) 2,344,451 1,787, ,310 31% 1,787,141 Report: Bud v Act Sum Printed on: 02/05/14 03:55 PM Page 1 Row: Inc Stmt Acct Summary Commission Report Column: ACTUAL TO BUDGET
14 Port of Port Angeles LOG YARD (21) Account Summary: Budget to Actual Variance For the Twelve Months Ending December 31, 2013 December 2013 Variance Report YTD YTD OVER (UNDER) OVER (UNDER) ANNUAL ACTUAL BUDGET BUDGET $ BUDGET % BUDGET OPERATING REVENUES LOG YARD STAGING 84,458 50,000 34,458 69% 50,000 LOG YARD LAND SERVICES 476, ,000 (179,022) (27%) 656,000 LOG YARD WATER SERVICES 258, ,000 55,881 28% 203,000 OTHER USER FEES 10, ,814 0% 0 EQUIPMENT RENTAL 189, ,000 21,908 13% 168,000 LAND LEASE/RENT 47,985 60,000 (12,015) (20%) 60,000 UTILITY PASS THRU & PRODUCT SALES 60,890 75,000 (14,111) (19%) 75,000 MISC & INTERDEPT REVENUE 19 5,000 (4,981) (100%) 5,000 TOTAL OPERATING REVENUES 1,129,934 1,217,000 (87,066) (7%) 1,217,000 OPERATING EXPENSES SALARIES & WAGES 265, ,872 9,384 4% 255,872 BENEFITS 97,213 88,752 8,461 10% 88,752 NON-MAINT EE CHARGE-OUT & REIMBURSEMENT 70, ,825 0% 0 SUPPLIES 142, ,000 (27,474) (16%) 170,000 OUTSIDE SERVICES 16,848 36,000 (19,152) (53%) 36,000 TRAVEL MEETINGS % 0 PROMOTIONAL HOSTING 1, ,981 0% 0 RENT, UTILITIES, INSURANCE, TAXES 86,290 79,500 6,790 9% 79,500 UTILITY (Pass Thru) & COST OF GOODS SOLD 56,604 57,000 (396) (1%) 57,000 OTHER EXPENSES (Misc & Interdept) 3, ,967 0% 0 MAINTENANCE LABOR (374) 0 (374) 0% 0 MAINTENANCE CHARGE-OUT & REIMBURSEMENT 135, ,756 (51,885) (28%) 187,756 MAINTENANCE (Materials & Services) 75,070 75, % 75,000 TOTAL OPERATING EXPENSES 952, ,880 2,373 0% 949,880 OPERATING SURPLUS (DEFICIT) (before Depr) 177, ,120 (89,439) (33%) 267,120 ALLOCATED EXPENSES % 0 DEPRECIATION (includes donated assets) % 0 NET NON-OP SURPLUS (DEFICIT) % 0 TOTAL NET SURPLUS (DEFICIT) (before Depr) 177, ,120 (89,439) (33%) 267,120 TOTAL NET SURPLUS (DEFICIT) (after Depr) 177, ,120 (89,439) (33%) 267,120 Report: Bud v Act Sum Printed on: 02/05/14 03:55 PM Page 1 Row: Inc Stmt Acct Summary Commission Report Column: ACTUAL TO BUDGET
15 Port of Port Angeles AIRPORTS (31, 32) Account Summary: Budget to Actual Variance For the Twelve Months Ending December 31, 2013 December 2013 Variance Report YTD YTD OVER (UNDER) OVER (UNDER) ANNUAL ACTUAL BUDGET BUDGET $ BUDGET % BUDGET OPERATING REVENUES PASSENGER FACILIITY CHARGES (PFCs) 15,811 10,000 5,811 58% 10,000 LANDING/PARKING FEES 14,953 26,000 (11,047) (42%) 26,000 HANGAR/TIE DOWN 106, ,000 1,281 1% 105,000 OTHER USER FEES 8,062 9,000 (938) (10%) 9,000 LAND LEASE/RENT 59,643 33,060 26,583 80% 33,060 STRUCTURE LEASE/RENT 98, ,000 (21,103) (18%) 120,000 USE AGMT AND OTHER RENT 5, ,050 0% 0 UTILITY PASS THRU & PRODUCT SALES 7, ,780 0% 0 MISC & INTERDEPT REVENUE 50,010 50,250 (240) 0% 50,250 TOTAL OPERATING REVENUES 366, ,310 13,178 4% 353,310 OPERATING EXPENSES SALARIES & WAGES 106,940 84,629 22,311 26% 84,629 BENEFITS 32,396 26,620 5,776 22% 26,620 NON-MAINT EE CHARGE-OUT & REIMBURSEMENT (16,151) 0 (16,151) 0% 0 SUPPLIES 9,474 26,800 (17,326) (65%) 26,800 OUTSIDE SERVICES 17,807 25,800 (7,993) (31%) 25,800 PUBLIC INFORMATION % 0 ADS, DUES & PUBLICATIONS (50) (17%) 300 TRAVEL MEETINGS 1, ,844 0% 0 TRAVEL/TRAINING 463 2,000 (1,537) (77%) 2,000 RENT, UTILITIES, INSURANCE, TAXES 145, ,900 (2,173) (1%) 147,900 UTILITY (Pass Thru) & COST OF GOODS SOLD 4, ,087 0% 0 OTHER EXPENSES (Misc & Interdept) 137 (500) 637 (127%) (500) MAINTENANCE LABOR 0 6,000 (6,000) (100%) 6,000 MAINTENANCE CHARGE-OUT & REIMBURSEMENT 110, ,487 (19,084) (15%) 129,487 MAINTENANCE (Materials & Services) 13,862 11,150 2,712 24% 11,150 TOTAL OPERATING EXPENSES 427, ,186 (32,297) (7%) 460,186 OPERATING SURPLUS (DEFICIT) (before Depr) (61,400) (106,876) 45,476 (43%) (106,876) ALLOCATED EXPENSES % 0 DEPRECIATION (includes donated assets) % 0 NON-OP CAPITAL REVENUES GRANTS - CAPITAL 609,557 1,673,950 (1,064,393) (64%) 1,673,950 TOTAL NON-OP CAPITAL REV 609,557 1,673,950 (1,064,393) (64%) 1,673,950 NET NON-OP CAPITAL SURPLUS (DEFICIT) 609,557 1,673,950 (1,064,393) (64%) 1,673,950 NET NON-OP SURPLUS (DEFICIT) 609,557 1,673,950 (1,064,393) (64%) 1,673,950 TOTAL NET SURPLUS (DEFICIT) (before Depr) 548,157 1,567,074 (1,018,917) (65%) 1,567,074 TOTAL NET SURPLUS (DEFICIT) (after Depr) 548,157 1,567,074 (1,018,917) (65%) 1,567,074 Report: Bud v Act Sum Printed on: 02/05/14 03:55 PM Page 1 Row: Inc Stmt Acct Summary Commission Report Column: ACTUAL TO BUDGET
16 Port of Port Angeles PA BOAT HAVEN (PABH) (41) Account Summary: Budget to Actual Variance For the Twelve Months Ending December 31, 2013 December 2013 Variance Report YTD YTD OVER (UNDER) OVER (UNDER) ANNUAL ACTUAL BUDGET BUDGET $ BUDGET % BUDGET OPERATING REVENUES WHARFAGE 6,220 6,500 (280) (4%) 6,500 MOORAGE 1,005, ,500 15,104 2% 990,500 MARINA & YARD FEES 17,426 3,000 14, % 3,000 OTHER USER FEES % 0 EQUIPMENT RENTAL 16,870 10,000 6,870 69% 10,000 LAND LEASE/RENT % 0 STRUCTURE LEASE/RENT 3,532 4,084 (552) (14%) 4,084 UTILITY PASS THRU & PRODUCT SALES 137, ,200 15,942 13% 121,200 MISC & INTERDEPT REVENUE 2,180 2, % 2,000 TOTAL OPERATING REVENUES 1,190,244 1,137,284 52,960 5% 1,137,284 OPERATING EXPENSES SALARIES & WAGES 0 56,193 (56,193) (100%) 56,193 NON-MAINT EE CHARGE-OUT & REIMBURSEMENT 82, ,334 0% 0 SUPPLIES 13,005 22,000 (8,995) (41%) 22,000 OUTSIDE SERVICES 161, ,000 (7,104) (4%) 169,000 PUBLIC INFORMATION 1, ,390 0% 0 ADS, DUES & PUBLICATIONS % 0 TRAVEL MEETINGS % 0 TRAVEL/TRAINING % 0 RENT, UTILITIES, INSURANCE, TAXES 201, ,000 (71) 0% 202,000 UTILITY (Pass Thru) & COST OF GOODS SOLD % 0 OTHER EXPENSES (Misc & Interdept) (957) 5,000 (5,957) (119%) 5,000 MAINTENANCE CHARGE-OUT & REIMBURSEMENT 58,269 77,896 (19,627) (25%) 77,896 MAINTENANCE (Materials & Services) 12,027 15,700 (3,673) (23%) 15,700 TOTAL OPERATING EXPENSES 531, ,789 (16,075) (3%) 547,789 OPERATING SURPLUS (DEFICIT) (before Depr) 658, ,495 69,035 12% 589,495 ALLOCATED EXPENSES % 0 DEPRECIATION (includes donated assets) % 0 NON-OP GENERAL REVENUES INTEREST EARNINGS % 0 TOTAL NON-OP GENERAL REV % 0 NET NON-OP GENERAL SURPLUS (DEFICIT) % 0 NON-OP CAPITAL REVENUES GRANTS - CAPITAL 33,050 45,000 (11,950) (27%) 45,000 TOTAL NON-OP CAPITAL REV 33,050 45,000 (11,950) (27%) 45,000 NET NON-OP CAPITAL SURPLUS (DEFICIT) 33,050 45,000 (11,950) (27%) 45,000 NET NON-OP SURPLUS (DEFICIT) 33,159 45,000 (11,841) (26%) 45,000 TOTAL NET SURPLUS (DEFICIT) (before Depr) 691, ,495 57,194 9% 634,495 TOTAL NET SURPLUS (DEFICIT) (after Depr) 691, ,495 57,194 9% 634,495 Report: Bud v Act Sum Printed on: 02/05/14 03:55 PM Page 1 Row: Inc Stmt Acct Summary Commission Report Column: ACTUAL TO BUDGET
17 Port of Port Angeles JOHN WAYNE MARINA (JWM) (43) Account Summary: Budget to Actual Variance For the Twelve Months Ending December 31, 2013 December 2013 Variance Report YTD YTD OVER (UNDER) OVER (UNDER) ANNUAL ACTUAL BUDGET BUDGET $ BUDGET % BUDGET OPERATING REVENUES WHARFAGE 1, ,140 0% 0 MOORAGE 735, ,400 (77,454) (10%) 813,400 MARINA & YARD FEES 14,343 8,000 6,343 79% 8,000 OTHER USER FEES % 0 STRUCTURE LEASE/RENT 49,023 46,100 2,923 6% 46,100 UTILITY PASS THRU & PRODUCT SALES 305, ,400 75,596 33% 230,400 MISC & INTERDEPT REVENUE 3,419 6,300 (2,881) (46%) 6,300 TOTAL OPERATING REVENUES 1,110,561 1,104,200 6,361 1% 1,104,200 OPERATING EXPENSES SALARIES & WAGES 206, ,081 (21,377) (9%) 228,081 BENEFITS 72,823 70,718 2,105 3% 70,718 NON-MAINT EE CHARGE-OUT & REIMBURSEMENT 63, ,749 0% 0 SUPPLIES 104,674 32,600 72, % 32,600 OUTSIDE SERVICES 21,640 30,500 (8,860) (29%) 30,500 PUBLIC INFORMATION % 0 ADS, DUES & PUBLICATIONS % 0 TRAVEL/TRAINING (377) (75%) 500 RENT, UTILITIES, INSURANCE, TAXES 90,699 71,200 19,499 27% 71,200 UTILITY (Pass Thru) & COST OF GOODS SOLD 157, ,700 (35,572) (18%) 192,700 OTHER EXPENSES (Misc & Interdept) 4,098 8,400 (4,302) (51%) 8,400 MAINTENANCE CHARGE-OUT & REIMBURSEMENT 39,550 51,931 (12,381) (24%) 51,931 MAINTENANCE (Materials & Services) 25,942 21,500 4,442 21% 21,500 TOTAL OPERATING EXPENSES 788, ,130 79,907 11% 708,130 OPERATING SURPLUS (DEFICIT) (before Depr) 322, ,070 (73,546) (19%) 396,070 ALLOCATED EXPENSES % 0 DEPRECIATION (includes donated assets) % 0 NON-OP GENERAL REVENUES MISC NON OP REVENUES 1, ,100 0% 0 TOTAL NON-OP GENERAL REV 1, ,100 0% 0 NET NON-OP GENERAL SURPLUS (DEFICIT) 1, ,100 0% 0 NON-OP CAPITAL REVENUES GRANTS - CAPITAL 36,995 60,000 (23,005) (38%) 60,000 TOTAL NON-OP CAPITAL REV 36,995 60,000 (23,005) (38%) 60,000 NET NON-OP CAPITAL SURPLUS (DEFICIT) 36,995 60,000 (23,005) (38%) 60,000 NET NON-OP SURPLUS (DEFICIT) 38,095 60,000 (21,905) (37%) 60,000 TOTAL NET SURPLUS (DEFICIT) (before Depr) 360, ,070 (95,451) (21%) 456,070 TOTAL NET SURPLUS (DEFICIT) (after Depr) 360, ,070 (95,451) (21%) 456,070 Report: Bud v Act Sum Printed on: 02/05/14 03:55 PM Page 1 Row: Inc Stmt Acct Summary Commission Report Column: ACTUAL TO BUDGET
18 Port of Port Angeles BOAT YARD (45) Account Summary: Budget to Actual Variance For the Twelve Months Ending December 31, 2013 December 2013 Variance Report YTD YTD OVER (UNDER) OVER (UNDER) ANNUAL ACTUAL BUDGET BUDGET $ BUDGET % BUDGET OPERATING REVENUES MARINA & YARD FEES 150,716 57,200 93, % 57,200 OTHER USER FEES 3, ,541 0% 0 EQUIPMENT RENTAL 96, ,000 (58,967) (38%) 155,000 STRUCTURE LEASE/RENT 4,941 5,700 (759) (13%) 5,700 USE AGMT AND OTHER RENT 26,910 16,500 10,410 63% 16,500 UTILITY PASS THRU & PRODUCT SALES 1,113 2,300 (1,187) (52%) 2,300 MISC & INTERDEPT REVENUE 0 1,300 (1,300) (100%) 1,300 TOTAL OPERATING REVENUES 283, ,000 45,254 19% 238,000 OPERATING EXPENSES SALARIES & WAGES 0 25,065 (25,065) (100%) 25,065 NON-MAINT EE CHARGE-OUT & REIMBURSEMENT 36, ,133 0% 0 SUPPLIES 5,169 5,600 (431) (8%) 5,600 OUTSIDE SERVICES 77,983 80,000 (2,017) (3%) 80,000 PUBLIC INFORMATION 1, ,390 0% 0 RENT, UTILITIES, INSURANCE, TAXES 22,864 24,700 (1,836) (7%) 24,700 OTHER EXPENSES (Misc & Interdept) (1,285) 500 (1,785) (357%) 500 MAINTENANCE CHARGE-OUT & REIMBURSEMENT 24,165 43,581 (19,416) (45%) 43,581 MAINTENANCE (Materials & Services) 7,268 8,200 (932) (11%) 8,200 TOTAL OPERATING EXPENSES 173, ,646 (13,959) (7%) 187,646 OPERATING SURPLUS (DEFICIT) (before Depr) 109,567 50,354 59, % 50,354 ALLOCATED EXPENSES % 0 DEPRECIATION (includes donated assets) % 0 NET NON-OP SURPLUS (DEFICIT) % 0 TOTAL NET SURPLUS (DEFICIT) (before Depr) 109,567 50,354 59, % 50,354 TOTAL NET SURPLUS (DEFICIT) (after Depr) 109,567 50,354 59, % 50,354 Report: Bud v Act Sum Printed on: 02/05/14 03:55 PM Page 1 Row: Inc Stmt Acct Summary Commission Report Column: ACTUAL TO BUDGET
19 Port of Port Angeles PUBLIC BOAT RAMPS (51) Account Summary: Budget to Actual Variance For the Twelve Months Ending December 31, 2013 December 2013 Variance Report YTD YTD OVER (UNDER) OVER (UNDER) ANNUAL ACTUAL BUDGET BUDGET $ BUDGET % BUDGET OPERATING REVENUES MARINA & YARD FEES 45,093 50,000 (4,907) (10%) 50,000 TOTAL OPERATING REVENUES 45,093 50,000 (4,907) (10%) 50,000 OPERATING EXPENSES SUPPLIES 743 1,200 (457) (38%) 1,200 ADS, DUES & PUBLICATIONS % 0 RENT, UTILITIES, INSURANCE, TAXES 1,411 2,000 (589) (29%) 2,000 OTHER EXPENSES (Misc & Interdept) (400) (100%) 400 MAINTENANCE CHARGE-OUT & REIMBURSEMENT 3,632 3, % 3,088 MAINTENANCE (Materials & Services) (561) (93%) 600 TOTAL OPERATING EXPENSES 5,918 7,288 (1,370) (19%) 7,288 OPERATING SURPLUS (DEFICIT) (before Depr) 39,175 42,712 (3,537) (8%) 42,712 ALLOCATED EXPENSES % 0 DEPRECIATION (includes donated assets) % 0 NET NON-OP SURPLUS (DEFICIT) % 0 TOTAL NET SURPLUS (DEFICIT) (before Depr) 39,175 42,712 (3,537) (8%) 42,712 TOTAL NET SURPLUS (DEFICIT) (after Depr) 39,175 42,712 (3,537) (8%) 42,712 Report: Bud v Act Sum Printed on: 02/05/14 03:55 PM Page 1 Row: Inc Stmt Acct Summary Commission Report Column: ACTUAL TO BUDGET
20 Port of Port Angeles RENTAL PROPERTY (61) Account Summary: Budget to Actual Variance For the Twelve Months Ending December 31, 2013 December 2013 Variance Report YTD YTD OVER (UNDER) OVER (UNDER) ANNUAL ACTUAL BUDGET BUDGET $ BUDGET % BUDGET OPERATING REVENUES LAND LEASE/RENT 505,202 48, , % 48,250 STRUCTURE LEASE/RENT 1,018,180 1,409,000 (390,820) (28%) 1,409,000 USE AGMT AND OTHER RENT % 0 UTILITY PASS THRU & PRODUCT SALES 48, ,968 19,187% 250 MISC & INTERDEPT REVENUE (47,096) 1,000 (48,096) (4,810%) 1,000 TOTAL OPERATING REVENUES 1,525,104 1,458,500 66,604 5% 1,458,500 OPERATING EXPENSES SALARIES & WAGES 0 101,321 (101,321) (100%) 101,321 BENEFITS 0 12,556 (12,556) (100%) 12,556 NON-MAINT EE CHARGE-OUT & REIMBURSEMENT 152, ,160 0% 0 SUPPLIES 1,743 5,600 (3,857) (69%) 5,600 OUTSIDE SERVICES 45, ,000 (64,045) (58%) 110,000 ADS, DUES & PUBLICATIONS % 0 TRAVEL/TRAINING 0 1,000 (1,000) (100%) 1,000 RENT, UTILITIES, INSURANCE, TAXES 107,645 86,400 21,245 25% 86,400 UTILITY (Pass Thru) & COST OF GOODS SOLD 25, ,448 0% 0 OTHER EXPENSES (Misc & Interdept) ,000 (52,623) (99%) 53,000 MAINTENANCE CHARGE-OUT & REIMBURSEMENT 73,401 86,616 (13,215) (15%) 86,616 MAINTENANCE (Materials & Services) 15,203 30,100 (14,897) (49%) 30,100 TOTAL OPERATING EXPENSES 422, ,593 (63,791) (13%) 486,593 OPERATING SURPLUS (DEFICIT) (before Depr) 1,102, , ,394 13% 971,907 ALLOCATED EXPENSES % 0 DEPRECIATION (includes donated assets) % 0 NET NON-OP SURPLUS (DEFICIT) % 0 TOTAL NET SURPLUS (DEFICIT) (before Depr) 1,102, , ,394 13% 971,907 TOTAL NET SURPLUS (DEFICIT) (after Depr) 1,102, , ,394 13% 971,907 Report: Bud v Act Sum Printed on: 02/05/14 03:55 PM Page 1 Row: Inc Stmt Acct Summary Commission Report Column: ACTUAL TO BUDGET
21 Port of Port Angeles MECHANICS MAINTENANCE (91) Account Summary: Budget to Actual Variance For the Twelve Months Ending December 31, 2013 December 2013 Variance Report YTD YTD OVER (UNDER) OVER (UNDER) ANNUAL ACTUAL BUDGET BUDGET $ BUDGET % BUDGET OPERATING EXPENSES SALARIES & WAGES 0 18,809 (18,809) (100%) 18,809 BENEFITS 1,347 47,574 (46,227) (97%) 47,574 NON-MAINT EE CHARGE-OUT & REIMBURSEMENT 26, ,167 0% 0 SUPPLIES 14,762 15,700 (938) (6%) 15,700 OUTSIDE SERVICES 4, ,733 4,733% 100 TRAVEL/TRAINING 1,168 3,000 (1,832) (61%) 3,000 RENT, UTILITIES, INSURANCE, TAXES 19,293 22,300 (3,007) (13%) 22,300 OTHER EXPENSES (Misc & Interdept) (900) (100%) 900 MAINTENANCE LABOR 138, ,230 11,518 9% 127,230 MAINTENANCE BENEFITS 48, ,505 0% 0 MAINTENANCE CHARGE-OUT & REIMBURSEMENT (169,523) (140,047) (29,476) 21% (140,047) MAINTENANCE (Materials & Services) 5,761 1,600 4, % 1,600 TOTAL OPERATING EXPENSES 91,062 97,166 (6,104) (6%) 97,166 OPERATING SURPLUS (DEFICIT) (before Depr) (91,062) (97,166) 6,104 (6%) (97,166) ALLOCATED EXPENSES % 0 DEPRECIATION (includes donated assets) % 0 NET NON-OP SURPLUS (DEFICIT) % 0 TOTAL NET SURPLUS (DEFICIT) (before Depr) (91,062) (97,166) 6,104 (6%) (97,166) TOTAL NET SURPLUS (DEFICIT) (after Depr) (91,062) (97,166) 6,104 (6%) (97,166) Report: Bud v Act Sum Printed on: 02/05/14 03:55 PM Page 1 Row: Inc Stmt Acct Summary Commission Report Column: ACTUAL TO BUDGET
22 Port of Port Angeles FACILITIES MAINTENANCE (92) Account Summary: Budget to Actual Variance For the Twelve Months Ending December 31, 2013 December 2013 Variance Report YTD YTD OVER (UNDER) OVER (UNDER) ANNUAL ACTUAL BUDGET BUDGET $ BUDGET % BUDGET OPERATING REVENUES OTHER USER FEES % 0 MISC & INTERDEPT REVENUE % 0 TOTAL OPERATING REVENUES % 0 OPERATING EXPENSES SALARIES & WAGES 79,688 33,372 46, % 33,372 BENEFITS 32,465 12,414 20, % 12,414 NON-MAINT EE CHARGE-OUT & REIMBURSEMENT (82,246) 0 (82,246) 0% 0 SUPPLIES 25,183 29,700 (4,517) (15%) 29,700 OUTSIDE SERVICES 5, ,256 0% 0 ADS, DUES & PUBLICATIONS % 0 TRAVEL MEETINGS % 0 TRAVEL/TRAINING 2,130 2, % 2,000 RENT, UTILITIES, INSURANCE, TAXES 18,561 18, % 18,300 OTHER EXPENSES (Misc & Interdept) 3,933 5,700 (1,767) (31%) 5,700 MAINTENANCE LABOR 478, ,114 35,599 8% 443,114 MAINTENANCE BENEFITS 161, ,917 (3,060) (2%) 164,917 MAINTENANCE CHARGE-OUT & REIMBURSEMENT (583,766) (568,505) (15,261) 3% (568,505) MAINTENANCE (Materials & Services) 13,961 16,500 (2,539) (15%) 16,500 TOTAL OPERATING EXPENSES 156, ,512 (1,167) (1%) 157,512 OPERATING SURPLUS (DEFICIT) (before Depr) (155,837) (157,512) 1,675 (1%) (157,512) ALLOCATED EXPENSES % 0 DEPRECIATION (includes donated assets) % 0 NET NON-OP SURPLUS (DEFICIT) % 0 TOTAL NET SURPLUS (DEFICIT) (before Depr) (155,837) (157,512) 1,675 (1%) (157,512) TOTAL NET SURPLUS (DEFICIT) (after Depr) (155,837) (157,512) 1,675 (1%) (157,512) Report: Bud v Act Sum Printed on: 02/05/14 03:55 PM Page 1 Row: Inc Stmt Acct Summary Commission Report Column: ACTUAL TO BUDGET
23 Port of Port Angeles ECONOMIC & BUSINESS DEVELOPMENT (81) Account Summary: Budget to Actual Variance For the Twelve Months Ending December 31, 2013 December 2013 Variance Report YTD YTD OVER (UNDER) OVER (UNDER) ANNUAL ACTUAL BUDGET BUDGET $ BUDGET % BUDGET OPERATING EXPENSES SALARIES & WAGES 89,937 46,742 43,195 92% 46,742 BENEFITS 25,880 12,556 13, % 12,556 NON-MAINT EE CHARGE-OUT & REIMBURSEMENT (48,428) 0 (48,428) 0% 0 OUTSIDE SERVICES 76,091 55,000 21,091 38% 55,000 PUBLIC INFORMATION 16,975 20,000 (3,025) (15%) 20,000 MARKETING 17,255 47,000 (29,745) (63%) 47,000 COMMUNITY RELATIONS 0 19,000 (19,000) (100%) 19,000 ADS, DUES & PUBLICATIONS 1, ,968 0% 0 TRAVEL MEETINGS 5,556 28,000 (22,444) (80%) 28,000 TRAVEL/TRAINING 207 6,000 (5,793) (97%) 6,000 PROMOTIONAL HOSTING 5,133 10,000 (4,867) (49%) 10,000 RENT, UTILITIES, INSURANCE, TAXES % 0 TOTAL OPERATING EXPENSES 191, ,298 (53,230) (22%) 244,298 OPERATING SURPLUS (DEFICIT) (before Depr) (191,068) (244,298) 53,230 (22%) (244,298) ALLOCATED EXPENSES % 0 DEPRECIATION (includes donated assets) % 0 NET NON-OP SURPLUS (DEFICIT) % 0 TOTAL NET SURPLUS (DEFICIT) (before Depr) (191,068) (244,298) 53,230 (22%) (244,298) TOTAL NET SURPLUS (DEFICIT) (after Depr) (191,068) (244,298) 53,230 (22%) (244,298) Report: Bud v Act Sum Printed on: 02/05/14 03:55 PM Page 1 Row: Inc Stmt Acct Summary Commission Report Column: ACTUAL TO BUDGET
24 Port of Port Angeles ADMINISTRATIVE & GENERAL (80) Account Summary: Budget to Actual Variance For the Twelve Months Ending December 31, 2013 December 2013 Variance Report YTD YTD OVER (UNDER) OVER (UNDER) ANNUAL ACTUAL BUDGET BUDGET $ BUDGET % BUDGET OPERATING REVENUES STRUCTURE LEASE/RENT 1, ,046 0% 0 MISC & INTERDEPT REVENUE % 0 TOTAL OPERATING REVENUES 1, ,048 0% 0 OPERATING EXPENSES SALARIES & WAGES 981, , ,901 73% 566,635 BENEFITS 362, ,965 66,808 23% 295,965 NON-MAINT EE CHARGE-OUT & REIMBURSEMENT (399,164) 0 (399,164) 0% 0 SUPPLIES 55,214 81,200 (25,986) (32%) 81,200 OUTSIDE SERVICES 316, ,000 7,654 2% 309,000 PUBLIC INFORMATION 1, ,847 0% 0 MARKETING % 0 ADS, DUES & PUBLICATIONS 30,563 28,000 2,563 9% 28,000 TRAVEL MEETINGS 22,023 48,000 (25,977) (54%) 48,000 TRAVEL/TRAINING 32,658 12,000 20, % 12,000 PROMOTIONAL HOSTING % 0 RENT, UTILITIES, INSURANCE, TAXES 50,632 32,400 18,232 56% 32,400 OTHER EXPENSES (Misc & Interdept) 12,512 63,500 (50,988) (80%) 63,500 CONTINGENCY 0 180,000 (180,000) (100%) 180,000 MAINTENANCE CHARGE-OUT & REIMBURSEMENT 20,248 22,951 (2,703) (12%) 22,951 MAINTENANCE (Materials & Services) 18,096 7,300 10, % 7,300 TOTAL OPERATING EXPENSES 1,505,990 1,646,951 (140,961) (9%) 1,646,951 OPERATING SURPLUS (DEFICIT) (before Depr) (1,504,942) (1,646,951) 142,009 (9%) (1,646,951) ALLOCATED EXPENSES % 0 DEPRECIATION (includes donated assets) % 0 NET NON-OP SURPLUS (DEFICIT) % 0 TOTAL NET SURPLUS (DEFICIT) (before Depr) (1,504,942) (1,646,951) 142,009 (9%) (1,646,951) TOTAL NET SURPLUS (DEFICIT) (after Depr) (1,504,942) (1,646,951) 142,009 (9%) (1,646,951) Report: Bud v Act Sum Printed on: 02/05/14 03:55 PM Page 1 Row: Inc Stmt Acct Summary Commission Report Column: ACTUAL TO BUDGET
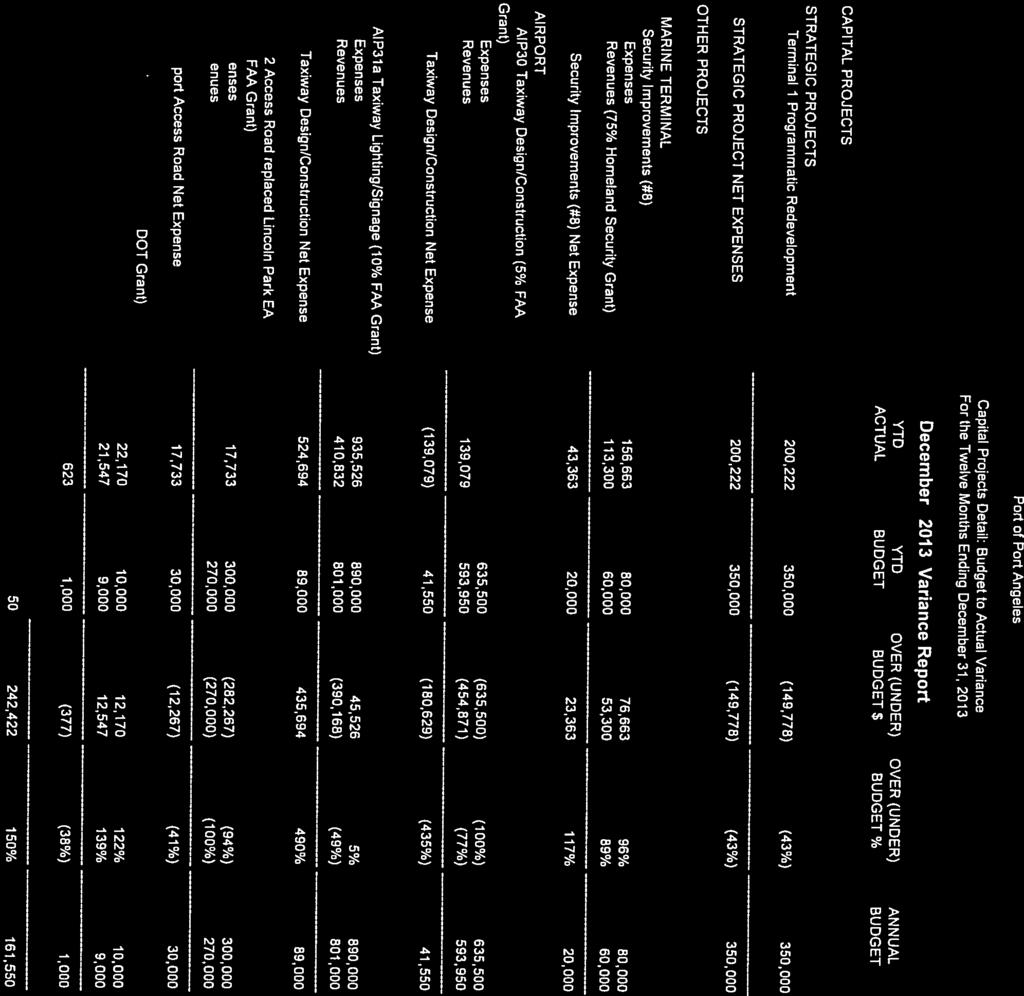
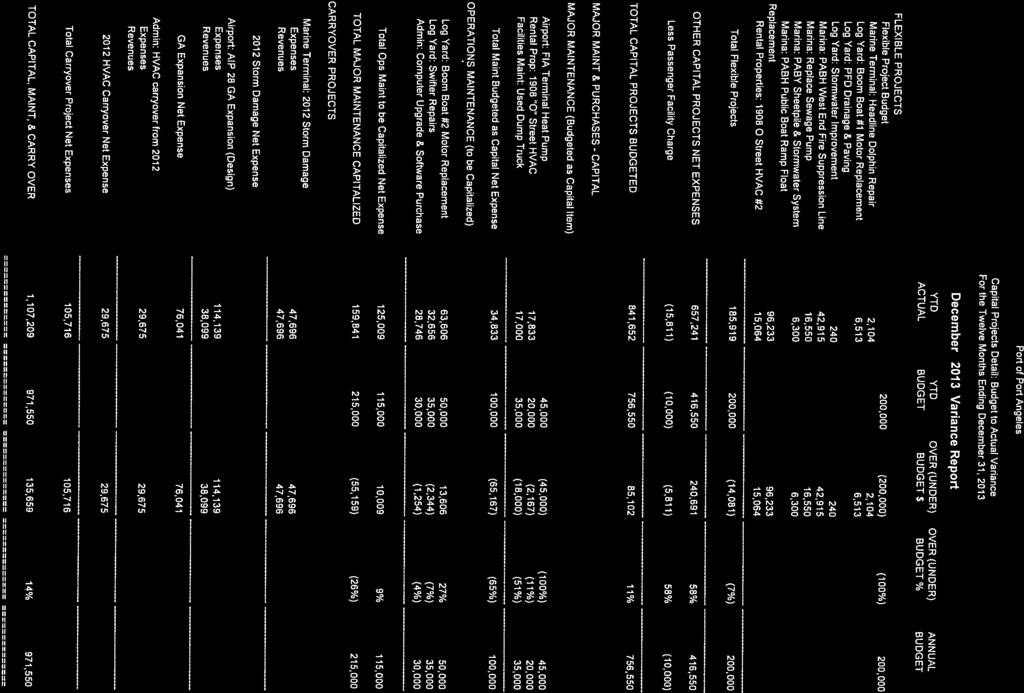
25
26 Capital Projects - Expenses (Total Expense, not Net Cost) 2013 Budget to Actual 3,000,000 2,500,000 2,000,000 1,500,000 1,000, ,000 0 Marine Terminal Log Yard Airports Marinas Rental Property Admin Facility Maint. YTD Actual 406, ,015 1,089, ,480 32,897 58,421 17,000 1,947,066 YTD Budget 430,000 85,000 1,880, ,000 20, ,000 35,000 2,820,500 Total
27 Capital Projects 2013 Annual Budget 3,000,000 2,500,000 2,000,000 1,500,000 1,000, ,000 0 Marine Terminal Log Yard Airports Marinas Rental Property Admin Facility Maint. Expenses 430,000 85,000 1,880, ,000 20, ,000 35,000 2,820,500 Revenues 60, ,683, , ,848,950 Net Expense 370,000 85, ,550 35,000 20, ,000 35, ,550 Total
28

29
30

31
32
Port of Port Angeles 2016 Actual to Budget Variance Report Operations 3rd Quarter YTD September 2016 (excludes Capital Projects)
") 2016 Actual to Budget Variance Report Operations 3rd Quarter September 2016 (excludes Capital Projects) Table of Contents 1. Actual to Budget Variance Explanation 2. Q3 comparison by year 2013 through
2016 Actual to Budget Variance Report Operations 3rd Quarter September 2016 (excludes Capital Projects) Table of Contents 1. Actual to Budget Variance Explanation 2. Q3 comparison by year 2013 through
Port of Port Angeles 2017 Actual to Budget Variance Report Operations 4th Quarter YTD December 2017 (excludes Capital Projects)
") 2017 Actual to Budget Variance Report Operations 4th Quarter December 2017 (excludes Capital Projects) Table of Contents 1. Actual to Budget Variance Explanation 2. Q4 comparison by year 2014 through 2017
2017 Actual to Budget Variance Report Operations 4th Quarter December 2017 (excludes Capital Projects) Table of Contents 1. Actual to Budget Variance Explanation 2. Q4 comparison by year 2014 through 2017
Port of Port Angeles 2014 Budget Variance Report Operations 3rd Quarter September 2014 (excludes Capital Projects)
") Port of Port Angeles 2014 Budget Variance Report Operations 3rd Quarter September 2014 (excludes Capital Projects) Table of Contents 1. Budget Variance Explanation 2. Budget Variance Graphs 3. Budget to
Port of Port Angeles 2014 Budget Variance Report Operations 3rd Quarter September 2014 (excludes Capital Projects) Table of Contents 1. Budget Variance Explanation 2. Budget Variance Graphs 3. Budget to
2018 BUDGET. Port of Port Angeles 338 West First Street / PO Box 1350 Port Angeles, Washington 98362
 2018 BUDGET Port of Port Angeles 338 West First Street / PO Box 1350 Port Angeles, Washington 98362 THIS PAGE INTENTIONALLY LEFT BLANK Port of Port Angeles 2018 Budget Summary Log Yard & PABH & JWM Marine
INFORMATIONAL REPORT TO THE BOARD OF PORT COMMISSIONERS
 INFORMATIONAL REPORT TO THE BOARD OF PORT COMMISSIONERS February 10, 2015 Subject: 2014 Capital Projects Budget vs. Actual Presented by: Chris Hartman BACKGROUND: The 2014 Capital Budget was approved by
2019 Annual Operating Budget
 2019 Annual Operating Budget 2 TABLE OF CONTENTS Message from the Interim Executive Director... 3 INTRODUCTION... 5 About the Port... 5 Mission statement... 5 Port Commission... 6 OPERATING BUDGET... 7
Canaveral Port Authority Proposed Operating Budget For the year ending September 30, 2016
 Operating Revenues Ship Activity FY2016 FY2016 Wharfage $ 51,584,200 $ (1,900,200) $ 49,684,000 Dockage 6,227,200 173,300 6,400,500 Parking 16,148,100 16,148,100 Line handling 1,039,100 17,400 1,056,500
PORT OF PALM BEACH DISTRICT Management s Discussion and Analysis FY 2018 For the month of October 31, 2017
 OPERATING REVENUES PORT OF PALM BEACH DISTRICT Management s Discussion and Analysis FY 2018 For the month of 31, 2017 Net Operating Revenue for 2017 is $1,176,207 which is unfavorable to the FY by only
PORT OF PALM BEACH DISTRICT Management s Discussion and Analysis FY 2017 YTD August 2017
 PORT OF PALM BEACH DISTRICT Management s Discussion and Analysis FY 2017 2017 Net Operating Revenue for the month of 2017 is $1,460,676 and is $15,965,353 which is favorable to the FY by $522,247 primarily
SPECIAL COMMISSION BUSINESS MEETING October 16, 2018 at 9:00am AGENDA. EARLY PUBLIC COMMENT SESSION (total session up to 20 minutes)
") SPECIAL COMMISSION BUSINESS MEETING October 16, 2018 at 9:00am AGENDA I. CALL TO ORDER / PLEDGE OF ALLEGIANCE II. III. EARLY PUBLIC COMMENT SESSION (total session up to 20 minutes) WORK SESSION A. 2019
SPECIAL COMMISSION BUSINESS MEETING October 16, 2018 at 9:00am AGENDA I. CALL TO ORDER / PLEDGE OF ALLEGIANCE II. III. EARLY PUBLIC COMMENT SESSION (total session up to 20 minutes) WORK SESSION A. 2019
2018 Draft Operating Budget Assumptions 3 rd DRAFT. Operating Revenue no changes to revenues in 3 rd Draft. Operating Expenses. Non-Operating Revenue
 2018 Draft Operating Budget Assumptions 3 rd DRAFT As has been discussed at the prior Commissioners meeting, we implemented the following changes for the 2018 Port Operating budget (blue font are updates
OAKLAND COUNTY, MICHIGAN
 PROPRIETARY FUNDS 53500 - CLEMIS Revenues Revenue Charges for Services 630004 Access Fees Non Oakland 0 596,187 596,187 643,882 695,392 619,025 668,547 722,030 630005 Access Fees Oakland 0 267,740 267,740
2019 DRAFT Capital Budget
 2019 DRAFT Capital Budget 2 CAPITAL BUDGET - 2019 Overview In the 2019 Capital budget, only a limited number of projects are currently funded, as capital needs exceed available resources. Obviously there
2018 Budget vs 3rd Qtr
 Operating Revenue: 2018 Budget 3rd Qtr 75.0% Hangar Rentals $ 239,628 $ 179,073 74.7% Tiedown Rentals $ 2,244 $ 1,601 71.4% AP-1 Rental $ 22,320 $ - 0.0% Immelman Hangars Land Lease $ 14,196 $ 14,196 100.0%
OAKLAND COUNTY, MICHIGAN
 PROPRIETARY FUNDS 53500 - CLEMIS Revenues Revenue Charges for Services 630004 Access Fees Non Oakland 649,756 619,025 619,025 668,547 722,030 631,117 681,437 681,437 630005 Access Fees Oakland 278,620
The Landings Yacht Golf & Tennis Club, Inc. For The Month Ending October 31, 2016 Fiscal Period 1
 The Landings Yacht Golf & Tennis Club, Inc. For The Month Ending October 31, 2016 Fiscal Period 1 The Landings Yacht Golf & Tennis Club, Inc. Table of Contents Financial Overview Pages 1-6 Balance Sheet
The Landings Yacht Golf & Tennis Club, Inc. For The Month Ending January 31, 2018 Fiscal Period 4
 The Landings Yacht Golf & Tennis Club, Inc. For The Month Ending January 31, 2018 Fiscal Period 4 The Landings Yacht Golf & Tennis Club, Inc. Table of Contents Financial Overview Pages 1-6 Balance Sheet
Northwest Florida Beaches International Airport. Fiscal Year 2016 Operating & Capital Budget
 Northwest Florida Beaches International Airport Fiscal Year 2016 Operating & Capital Budget Northwest Florida Beaches International Airport Fiscal Year 2016 Operating and Capital Budget Introduction FY
Port of St. Helens ADOPTED BUDGET
 Port of St. Helens 2018-2019 ADOPTED BUDGET PORT OF ST. HELENS 2018-2019 ADOPTED BUDGET TABLE OF CONTENTS Budget Messages Executive Director s Message. 1 Finance Manager Message 3 Budget Summary Resources
The Landings Yacht Golf & Tennis Club, Inc.
 The Landings Yacht Golf & Tennis Club, Inc. For The Month Ending February 28, 2016 Fiscal Period 5 The Landings Yacht Golf & Tennis Club, Inc. Table of Contents Financial Overview Pages 1-6 Balance Sheet
The Landings Yacht Golf & Tennis Club, Inc. For The Month Ending January 31, 2017 Fiscal Period 4
 The Landings Yacht Golf & Tennis Club, Inc. For The Month Ending January 31, 2017 Fiscal Period 4 The Landings Yacht Golf & Tennis Club, Inc. Table of Contents Financial Overview Pages 1-6 Balance Sheet
Clerk of Circuit Court Lee County, Florida
 Clerk of Circuit Court Lee County, Florida Fiscal Year 2009 Budget REVISED 9-22-08 Clerk of Circuit Court Lee County, Florida Fiscal Year 2009 Budget Prepared by: General Accounting, Finance & Records
FISCAL YEAR BUDGET vs ACTUAL VARIANCE ANALYSIS QUARTER ENDING JUN 30, 2012
 GENERAL FUND REVENUES 001.0000.311.010000 Ad Valorem Taxes 10 4,172,405 4,242,405 4,241,429 100.0% 001.0000.316.000100 Local Business Tax 10 180,000 180,000 42,518 23.6% Ad valorem tax revenues typically
Financial Overview. % of Budget/Target. Budget/Target (YTD)
") TO: CONNECT FOR HEALTH COLORADO FINANCE AND OPERATIONS COMMITTEE FROM: BRIAN BRAUN, CHIEF FINANCIAL OFFICER SUBJECT: MAY FY 2016 FINANCIAL REPORT DATE: 6/23/2016 Financial Overview The net change in assets
TO: CONNECT FOR HEALTH COLORADO FINANCE AND OPERATIONS COMMITTEE FROM: BRIAN BRAUN, CHIEF FINANCIAL OFFICER SUBJECT: MAY FY 2016 FINANCIAL REPORT DATE: 6/23/2016 Financial Overview The net change in assets
CADA Board of Directors October 27, 2017, Board Meeting TRANSMITTALS (H) FINANCIAL REPORT FOR THE PERIOD ENDING September 30, 2017
 FINANCIAL REPORT FOR THE PERIOD ENDING September 30, 2017") October 20, 2017 TO: SUBJECT: CADA Board of Directors October 27, 2017, Board Meeting TRANSMITTALS (H) FINANCIAL REPORT FOR THE PERIOD ENDING September 30, 2017 CONTACT PERSON: Noelle Mussen, Controller
October 20, 2017 TO: SUBJECT: CADA Board of Directors October 27, 2017, Board Meeting TRANSMITTALS (H) FINANCIAL REPORT FOR THE PERIOD ENDING September 30, 2017 CONTACT PERSON: Noelle Mussen, Controller
The Landings Yacht Golf & Tennis Club, Inc. For The Month Ending October 31, 2018 Fiscal Period 1
 The Landings Yacht Golf & Tennis Club, Inc. For The Month Ending October 31, 2018 Fiscal Period 1 The Landings Yacht Golf & Tennis Club, Inc. Table of Contents Financial Overview Pages 1-6 Balance Sheet
Changes that were adopted by City Council
 City of Seldovia P.O. Drawer B, Seldovia, Alaska 99663 Phone: (907) 234-7643, Fax: (907) 234-7430 email: citymanager@cityofseldovia.com website: www.cityofseldovia.com For Session, The City of Seldovia
Revenue vs Expense for February 2019
 General Fund Sales Tax $7,000,000.00 $1,227,630.12 17.54% County Sales Tax $2,100,000.00 $358,756.42 17.08% Payment of ACT 9 Taxes $50,000.00 $0.00 0.00% Pay in Lieu of Taxes - Util $1,600,000.00 $237,073.45
Port of Port Townsend
 Financial Statements Audit Report Port of Port Townsend Jefferson County For the period January 1, 2014 through December 31, 2015 Published January 19, 2017 Report No. 1018433 Office of the Washington
CITY OF BOISE Airport Fund Statement of Net Assets as of July 31, 2011
 CITY OF BOISE Airport Fund Statement of Net Assets as of July 31, 2011 ASSETS 7/31//11 7/31/10 Current assets: Cash $ 5,305 $ 1,287,539 Investments 17,466,673 14,212,644 Invest-Pfc 11,517,117 14,948,475
REVENUES ACCT # ACCOUNT NAME 2011/12 BUDGET
 REVENUES ACCT # ACCOUNT NAME 2011/12 BUDGET 4010 Real Estate Tax $ 1,998,179 4015 Interest & Penalties on Taxes $ 2,500 4019 Real Estate Rental Fees $ 18,000 4020 Building Permit Fee $ 15,000 4021 Propane
Revenue vs Expense for December 2017
 General Fund Revenue vs Expense for December 2017 Sales Tax $6,900,000.00 $6,869,780.06 99.56% County Sales Tax $2,000,000.00 $2,017,372.46 100.87% Payment of ACT 9 Taxes $22,000.00 $42,085.50 191.30%
Cumulative Covered Lives - (Plan Year 2016 to date*) 178, ,000 Effectuated Enrollments by Channel (Plan Year 2016 to date)
 178, ,000 Effectuated Enrollments by Channel (Plan Year 2016 to date)") TO: CONNECT FOR HEALTH COLORADO FINANCE AND OPERATIONS COMMITTEE FROM: BRIAN BRAUN, CHIEF FINANCIAL OFFICER SUBJECT: 3 RD QUARTER FY 2016 FINANCIAL REPORT DATE: 5/4/2016 Key Metrics Actual Baseline Cumulative
TO: CONNECT FOR HEALTH COLORADO FINANCE AND OPERATIONS COMMITTEE FROM: BRIAN BRAUN, CHIEF FINANCIAL OFFICER SUBJECT: 3 RD QUARTER FY 2016 FINANCIAL REPORT DATE: 5/4/2016 Key Metrics Actual Baseline Cumulative
The Landings Yacht Golf & Tennis Club, Inc. For The Month Ending June 30, 2017 Fiscal Period 9
 The Landings Yacht Golf & Tennis Club, Inc. For The Month Ending June 30, 2017 Fiscal Period 9 The Landings Yacht Golf & Tennis Club, Inc. Table of Contents Financial Overview Pages 1-6 Balance Sheet Pages
Revenue vs Expense for April 2017
 General Fund Sales Tax $6,900,000.00 $2,237,099.61 32.42% County Sales Tax $2,000,000.00 $658,271.51 32.91% Payment of ACT 9 Taxes $22,000.00 $0.00 0.00% Pay in Lieu of Taxes - Util $1,500,000.00 $433,159.26
CITY OF BOISE Airport Fund Statement of Net Assets June 30, 2012
 CITY OF BOISE Airport Fund Statement of Net Assets June 30, 2012 ASSETS 06/30/12 06/30/11 Current assets: Cash $ (910,908) $ 266,088 Investments 20,129,330 17,961,993 Invest-Pfc 14,935,055 11,036,158 Invest-Car
CITY OF BOISE Airport Fund Statement of Net Assets February 29, 2012
 CITY OF BOISE Airport Fund Statement of Net Assets February 29, 2012 ASSETS 02-29-12 02-28-11 Current assets: Cash $ (1,169,722) $ 280,356 Investments 17,963,743 17,443,383 Invest-Pfc 13,179,829 8,988,949
CITY OF BOISE Airport Fund Preliminary Statement of Net Assets as of Dec. 31, 2010
 CITY OF BOISE Airport Fund Preliminary Statement of Net Assets as of Dec. 31, 2010 ASSETS 12/31//10 12/31/09 Current assets: Cash $ 3,306 $ (401,066) Investments 18,186,910 16,507,335 Invest-Pfc 15,796,970
 CAPE GEORGE COLONY CLUB, INC. TREASURER'S REPORT PRELIMINARY STATEMENTS - SUBJECT TO CHANGE - As of December 31, 2018 The following are a highly summarized comparative balance sheets and statements of
CITY OF BOISE Airport Fund Statement of Net Assets as of Apr. 30, 2011
 CITY OF BOISE Airport Fund Statement of Net Assets as of Apr. 30, 2011 ASSETS 4/30//11 4/30/10 Current assets: Cash $ (59,052) $ 30,348 Investments 18,312,630 16,897,055 Invest-Pfc 9,837,602 13,408,992
The Landings Yacht Golf & Tennis Club, Inc.
 The Landings Yacht Golf & Tennis Club, Inc. For Fiscal Period 5 Ending The Landings Yacht Golf & Tennis Club, Inc. Table of Contents Financial Overview Pages 1-6 Balance Sheet Pages 7 8 Financial Statement
Port of Port Angeles. Financial Statements and Federal Single Audit Report. Clallam County. For the period January 1, 2013 through December 31, 2013
 Financial Statements and Federal Single Audit Report Port of Port Angeles Clallam County For the period January 1, 2013 through December 31, 2013 Published September 25, 2014 Report No. 1012615 Washington
Port of Port Townsend
 Financial Statements Audit Report Port of Port Townsend For the period January 1, 2016 through December 31, 2017 Published December 6, 2018 Report No. 1022749 Office of the Washington State Auditor Pat
City of Williston Fiscal Year 2017/2018 Adopted Budget
 City of Williston Fiscal Year 2017/2018 Adopted Budget (Adopted on September 20, 2017) Table of Contents Page # Budget Summary Budget Comparison by Fund 1-2 Millage Rate Options 3 Team Count by Department
Page 1 TOTAL GENERAL FUNDS AVAILABLE $ 2,711,967 $ 2,835,667 $ 123,700 5%
 San Juan Island EMS Proposed 2017 Budget October 24, 2016 Key Budget Assumptions and Changes From Original Expected Case Budget Presented June 30, 2016 The 2017 budget presented has been updated from the
Port of Long Beach. Legislation Text
 Port of Long Beach 4801 Airport Plaza Drive Long Beach, CA 90815 Legislation Text File #: HD-18-416, Version: 1 DATE: 8/27/2018 TO: Board of Harbor Commissioners FROM: Don Kwok, Acting Director of Finance
Gulfport Biloxi Regional Airport Authority Gulfport, Mississippi. Financial Statements. September 30, 2014 and Contents
 Gulfport Biloxi Regional Airport Authority Gulfport, Mississippi Financial Statements September 30, 2014 and 2013 Contents Independent Auditors' Report... 1-3 Section I Management s Discussion and Analysis...
Heritage Landing Community Development District
 Heritage Landing Community Development District Financial Statements (Unaudited) May 31, 2017 Prepared by: Rizzetta & Company, Inc. St. Augustine Office 2806 North Fifth Street, Unit 403 St. Augustine,
City of Rochester New Hampshire
 City of Rochester New Hampshire Adopted Budget Fiscal Year 27 (July 1, 26 - June 3, 27) FY 7 BUDGET TABLE OF CONTENTS SECTION 1 Table of Contents...tc-i Budget Message Message to the City Council by the
Gulfport Biloxi Regional Airport Authority Gulfport, Mississippi. Financial Statements. September 30, 2015 and Contents
 Gulfport Biloxi Regional Airport Authority Gulfport, Mississippi Financial Statements September 30, 2015 and 2014 Contents Independent Auditors' Report... 1-3 Section I Management s Discussion and Analysis...
City of Seldovia FY2018 Budget GENERAL FUND AUDITED
 2018 Account Name FY2014 FY2014 FY2015 FY2015 FY2016 FY2016 FY2017 ADOPTED BUDGET FY2018 AMOUNTS Tax Generated Revenue PASSED PASSED PASSED PROPOSED FY2016 AMOUNTS 100.41.1042 Personal Property Tax 30,000.00
Gulfport Biloxi Regional Airport Authority Gulfport, Mississippi. Financial Statements. September 30, 2017 and Contents
 Gulfport Biloxi Regional Airport Authority Gulfport, Mississippi Financial Statements September 30, 2017 and 2016 Contents Independent Auditors' Report... 1-3 Section I Management s Discussion and Analysis...
SPECIAL COMMISSION BUSINESS MEETING AGENDA April 25, :00 AM. ** Time Specific at 9:10AM Community Partner Program presentation
 SPECIAL COMMISSION BUSINESS MEETING AGENDA April 25, 2017 9:00 AM. ** Time Specific at 9:10AM Community Partner Program presentation I. CALL TO ORDER / PLEDGE OF ALLEGIANCE II. APPROVAL OF CONSENT AGENDA
SAN DIEGO UNIFIED PORT DISTRICT. Independent Auditors Report, Management s Discussion and Analysis and Basic Financial Statements
 SAN DIEGO UNIFIED PORT DISTRICT Independent Auditors Report, Management s Discussion and Analysis and Basic Financial Statements Years Ended June 30, 2013 and June 30, 2012 Years Ended June 30, 2013 and
Memorandum. Mid Year Budget Review - Amended City Manager's Annual Budget Report
 Mid Year Budget Review Fiscal 2011-12 City Manager's Transmittal Memorandum TO: FROM: COPIES: SUBJECT: Mayor and City Council Bill Horne, City Manager Jill Silverboard, Assistant City Manager Rod Irwin,
A. BUSINESS PLAN OVERVIEW
 A. BUSINESS PLAN OVERVIEW Table III-1 below is a summary of the combined business plan forecasts of the Port s operating divisions, which can be found in Sections IV, V and VI. TABLE III-1: PORT OF SEATTLE
Fox Township Supervisors General Fund Proposed 2019 Budget
 General Fund 301.100 Real estate - Current $ 94,000 301.200 Real Estate - Prior $ 1,500 301.400 Tax Claim $ 5,000 310.010 Per Capita - current $ 9,300 310.020 Per Capita - Prior $ 150 310.100 Reality Transfer
PORT AUTHORITY OF GUAM (A Public Corporation) FINANCIAL STATEMENTS AND INDEPENDENT AUDITORS REPORT
 FINANCIAL STATEMENTS AND INDEPENDENT AUDITORS REPORT") FINANCIAL STATEMENTS AND INDEPENDENT AUDITORS REPORT SEPTEMBER 30, 2001 AND 2000 Deloitte & Touche LLP 361 South Marine Drive Tamuning, Guam 96913-3911 Tel: (671)646-3884 Fax: (671)649-4932 www.dttguam.com
FINANCIAL STATEMENTS AND INDEPENDENT AUDITORS REPORT SEPTEMBER 30, 2001 AND 2000 Deloitte & Touche LLP 361 South Marine Drive Tamuning, Guam 96913-3911 Tel: (671)646-3884 Fax: (671)649-4932 www.dttguam.com
ANNUAL BUDGET OF THE CITY OF KEWAUNEE, WISCONSIN FOR THE CALENDAR YEAR BEGINNING JANUARY 1, 2017 COMMON COUNCIL ADMINISTRATIVE STAFF
 ANNUAL BUDGET OF THE, WISCONSIN FOR THE CALENDAR YEAR BEGINNING JANUARY 1, 2017 COMMON COUNCIL Mayor Sandi Christman Alderman Jeff Dworak Alderman John Griffith Alderman Jason Jelinek Alderman Diane Jirtle
City of Pensacola Revenue Statements For the Budgeted Year Ended September 30, 2018 With Comparative Amounts for 2015 through 2017 (Unaudited)
") City of Pensacola Revenue Statements For the Budgeted Year Ended September 30, 2018 With Comparative Amounts for 2015 through 2017 (Unaudited) Table of Contents Page General Fund 1 CRA Debt Service Fund
City of Pensacola Revenue Statements For the Budgeted Year Ended September 30, 2018 With Comparative Amounts for 2015 through 2017 (Unaudited) Table of Contents Page General Fund 1 CRA Debt Service Fund
SALT LAKE CITY COUNCIL STAFF REPORT BUDGET AMENDMENT ANALYSIS FISCAL YEAR
 SALT LAKE CITY COUNCIL STAFF REPORT BUDGET AMENDMENT ANALYSIS FISCAL YEAR 2002-03 DATE: May 7, 2002 BUDGET FOR: STAFF REPORT BY: cc: DEPARTMENT OF AIRPORTS Gary Mumford Rocky Fluhart, David Nimkin, Tim
TREASURER-TAX COLLECTOR
 TREASURER-TAX COLLECTOR Mission The Treasurer-Tax Collector s Department is responsible for administration of the treasury and for the collection of property taxes, which include secured, unsecured, and
TOTAL TAXES 5,789,395 5,518,500 4,902,272 5,730,002 6,460, ,736
 BEGINNING BALANCE 3,520 316,623 REVENUES 301 REAL ESTATE PROPERTY TAXES 30110 RE TAX CURRENT YEAR 2,120,952 2,282,500 2,085,563 2,143,567 3,148,736 866,236 30120 RE TAX PRIOR YEAR 27,135 25,000 7,254 7,254
PORT OF GALVESTON SUPPLEMENTAL INFORMATION FOR THE 2018 ANNUAL BUDGET
 PORT OF GALVESTON SUPPLEMENTAL INFORMATION FOR THE 2018 ANNUAL BUDGET Operating Budget Renewal and Replacement Budget Capital Improvement Plan and 2018 Capital Improvement Budget 2018 Annual Budget Overview
HILLSBOROUGH COUNTY AVIATION AUTHORITY FINANCIAL STATEMENTS, OTHER FINANCIAL INFORMATION AND COMPLIANCE REPORTS
 FINANCIAL STATEMENTS, OTHER FINANCIAL INFORMATION AND COMPLIANCE REPORTS YEARS ENDED SEPTEMBER 30, 2014 AND 2013 TABLE OF CONTENTS YEARS ENDED SEPTEMBER 30, 2014 AND 2013 INDEPENDENT AUDITORS' REPORT 1
Fort Collins ~ Loveland Municipal Airport
 Fort Collins ~ Loveland Municipal Airport Year Ended December 31, 2014 TABLE OF CONTENTS PAGE Letter of Transmittal... 2 Independent Auditors Report... 4 Management s Discussion and Analysis... 7 Basic
Statement of Changes in Net Position
 Statement of Changes in Net Position BIRMINGHAM AIRPORT AUTHORITY STATEMENT OF NET POSITION Actual 2017 Budget 2018 Proposed Budget 2019 % Change ASSETS Current Assets Cash and cash equivalents $ 33,584,557
TORONTO PORT AUTHORITY MANAGEMENT S DISCUSSION & ANALYSIS (in thousands of dollars)
") TORONTO PORT AUTHORITY MANAGEMENT S DISCUSSION & ANALYSIS 2007 (in thousands of dollars) Management's discussion and analysis (MD&A) is intended to assist in the understanding and assessment of the trends
TORONTO PORT AUTHORITY MANAGEMENT S DISCUSSION & ANALYSIS 2007 (in thousands of dollars) Management's discussion and analysis (MD&A) is intended to assist in the understanding and assessment of the trends
Balance Sheet Account Summary As Of 12/31/2016
 City of Shenandoah Balance Sheet Account Summary As Of 12/31/2016 Account Name Balance Fund: 100 - GENERAL FUND Assets 100-110300 Chase Business Classic W/Interest 1,261.19 100-111000 General Fund-Cash
2015 Appropriation Budget Table of Contents Board Approved August 15, 2014
 INDIANAPOLIS AIRPORT AUTHORITY 2015 APPROPRIATION BUDGET ORDINANCE NO. 4-2014 BOARD APPROVED AUGUST 15, 2014 2015 Appropriation Budget Table of Contents Board Approved August 15, 2014 1 Appropriation Summary
CITY OF WILLISTON, FLORIDA BUDGET WORKSHOP AGENDA
 CITY OF WILLISTON, FLORIDA BUDGET WORKSHOP AGENDA DATE: MONDAY, JULY 17, 2017 TIME: 5:30 P.M. PLACE: WILLISTON CITY COUNCIL ROOM CALL TO ORDER ROLL CALL MEMBERS: Mayor R. Gerald Hethcoat President Charles
Port of Everett Consolidated Summary - Entire Port Budget Worksheet
 Port of Everett Consolidated Summary - Entire Port Worksheet 2016 Actual 2017 Estimate Year End 2017 Estimate to 2018 % Operating Revenue Terminals 18,672,852 22,381,042 18,134,771 17,037,800 (5,343,242)
Cleveland-Cuyahoga County Port Authority. Basic Financial Statements December 31, 2006
 Cleveland-Cuyahoga County Port Authority Basic Financial Statements December 31, 2006 Board of Directors Cleveland-Cuyahoga County Port Authority 1375 East 9th Street, Suite 2300 Cleveland, Ohio 44114-1790
CITY OF KEMPNER US Hwy 190 P.O. Box 660 KEMPNER, TEXAS BUDGET YEAR
 CITY OF KEMPNER 12288 US Hwy 190 P.O. Box 660 KEMPNER, TEAS 76539 BUDGET YEAR 2017-2018 THE 2017-2018 BUDGET WILL RAISE MORE TOTAL PROPERTY TA THAN THE 2016-2017 BUDGET BY $9,711.00 BUDGET YEAR 2016-2017
FOR ADMINISTRATION USE ONLY 92 % OF THE FISCAL YEAR HAS ELAPSED 05/19/ :09PM PAGE: 1
 COMBINED CASH INVESTMENT MAY 31, 2017 COMBINED CASH ACCOUNTS 01-10110 CASH - COMBINED CHECKING 162,650.26 01-10111 PETTY CASH 200.00 01-10114 LUSK STATE BANK - FEMA 52,964.61 01-11165 BANK OF THE WEST
Manassas Regional Airport Minimum Standards Insurance Requirements
 Manassas Regional Airport Minimum Standards Insurance Requirements APPENDIX B Insurance Matrix This matrix is intended as an overview of required coverage. See the individual sections for specific requirements
NOTICE OF COMMITTEE MEETING Sonoma County Fair & Exposition, Inc
 NOTICE OF COMMITTEE MEETING Sonoma County Fair & Exposition, Inc Notice is hereby given that meetings of the Sonoma County Fair and Exposition, Inc. will convene at times and locations set forth in this
Construction Accounting
 Construction Accounting Steven M. Bragg Chapter 1 Overview of the Construction Industry... 1 Learning Objectives... 1 Introduction... 1 Nature of the Construction Contractor... 2 Bonding Requirements...
Heritage Landing Community Development District
 Heritage Landing Community Development District Financial Statements (Unaudited) September 30, 2018 Prepared by: Rizzetta & Company, Inc. worldcommercecdd.org rizzetta.com Balance Sheet As of 9/30/2018
City of Williston Fiscal Year 2014/2015 Adopted Budget
 City of Williston Fiscal Year 2014/2015 Adopted Budget (Adopted on September 23, 2014) Table of Contents Page # Budget Summary Budget Advertisement 1 Budget Summary by Fund 2-3 Budget Comparison by Fund
CITY OF WILLISTON, FLORIDA BUDGET WORKSHOP AGENDA
 CITY OF WILLISTON, FLORIDA BUDGET WORKSHOP AGENDA DATE: TUESDAY, AUGUST 12, 2014 TIME: 7:00 P.M. PLACE: WILLISTON CITY COUNCIL ROOM CALL TO ORDER ROLL CALL MEMBERS: Mayor R. Gerald Hethcoat President Jason
Financial Report st Quarter/Unaudited
 Financial Report 2014 1st Quarter/Unaudited MANAGEMENT S DISCUSSION AND ANALYSIS City and County of Denver Management s Discussion and Analysis For the Three Months Ended March 31, 2014 The following discussion
Palm Beach County, Florida Department of Airports. Financial Report September 30, 2015
 Palm Beach County, Florida Department of Airports Financial Report September 30, 2015 Contents Independent Auditor s Report 1-2 Management s Discussion and Analysis (Unaudited) 3-17 Financial Statements:
Atlantic Pilotage Authority
 Atlantic Pilotage Authority Third Quarter 2017 Management s Discussion and Analysis November 30, 2017 TRAFFIC REVIEW Pilotage Area Actual Budget Actual Variance Percentage Variance Percentage Traffic through
FY15 Actual FY16 Budget FY17 Budget
 Port Everglades Department Port Everglades OTHER FUNDS Port Everglades Operating Fund Percent Positions Change 2016-17 FY16 Budget FY17 Budget $78,081,293 $102,758,770 $115,514,660 12% 226 228 Subtotal
BUDGET GENERAL FUND 2019 BEG. CASH BALANCE
 Borough of St. Lawrence BUDGET GENERAL FUND 2019 BEG. CASH BALANCE $ 163,621.21 REVENUE $ 846,151.37 EXPENDITURES $ (948,189.45) NETCASHINFLOW(OUTFLOW) $ (102,038.08) LIABILITIES $ ENDING CASH BALANCE
Atlantic Pilotage Authority
 Atlantic Pilotage Authority First Quarter 2018 Management s Discussion and Analysis May 30, 2018 TRAFFIC REVIEW Pilotage Area Actual Budget Actual Variance Percentage Variance Percentage Traffic through
Port of Seattle Budget Reading & Final Adoption
 Port of Seattle Item No: 8c_supp Meeting Date: November 27, 2018 2019 Budget Reading & Final Adoption Commission Meeting November 27, 2018 1 Outline 2019 Operating Budget 2019 Comprehensive Operating &
Bradley International Airport Enterprise Fund and General Aviation Airports Enterprise Fund
 Bradley International Airport and General Aviation Airports Financial Report with Supplemental Information June 30, 2018 Contents Independent Auditor's Report 1-3 Management's Discussion and Analysis 4-25
THE VIRGIN ISLANDS PORT AUTHORITY FISCAL YEAR 2019 OPERATING AND CAPITAL BUDGET
 THE VIRGIN ISLANDS PORT AUTHORITY FISCAL YEAR 2019 OPERATING AND CAPITAL BUDGET Schedule-1 Virgin Islands Port Authority Statement of Revenues, Expenses and Change in Net Assets For the Fiscal Year Ended
Proposed Budget. Yellowstone Regional Airport
 FY 7/1/16-6/30/17 Budget Yellowstone Regional Airport 2101 Roger Sedam Cody, WY 82414 (307) 587-5096 Park Budget Hearing Information Location: Cody City Hall Date: 6/21/2016 Time: 7:00 p.m. Budget Prepared
South Londonderry Township 2019 Proposed Budget
 South Londonderry Township 2019 Proposed GENERAL FUND REVENUE 2019 Property Taxes 999,355 Local Enabling 1,465,907 Licenses 125,550 Fines 26,500 Interest/Rent 10,200 Public Safety 143,953 Intergov't Revenue
Fiscal Year Second Quarter Financial Report For the Period Ending December 31, Vision Statement. 697 Vista Ave, Page Arizona 86040
 Fiscal Year 2018 Second Quarter Financial Report For the Period Ending December 31, 2017 Vision Statement The City of Page is a clean, financially responsible, diverse and vibrant community that respects
OPERATION OF ENTERPRISE FUND OPERATIONAL STATEMENT FOR THE FISCAL YEAR
 Page 1 of 1 FUND TITLE: Integrated Waste Management Department Environmental Reserve SERVICE ACT: Sanitation NON-OPERATING REVENUE 275 - Integrated Waste Management 6610 Interest 940,343 720,201 884,721
Quarterly Operations Report
 Quarterly Operations Report November 2016 Page 1 of 95 Quarterly Operations Report - November 2016 Table of Contents Operating Budget - FY2016 Q4 Budget-to-Actual Budget-to-Actual Section Divider Executive
LOUIS ARMSTRONG NEW ORLEANS INTERNATIONAL AIRPORT (A Proprietary Component Unit of the City of New Orleans) Table of Contents
 Table of Contents") Table of Contents Independent Auditors Report 1 3 Management s Discussion and Analysis 4 16 Financial Statements: Statements of Net Position as of 17 18 Statements of Revenues, Expenses, and Changes in
Table of Contents Independent Auditors Report 1 3 Management s Discussion and Analysis 4 16 Financial Statements: Statements of Net Position as of 17 18 Statements of Revenues, Expenses, and Changes in
FINANCIAL ANALYSIS WATERFRONT PLACE IMPLEMENTATION STRATEGY. Prepared for Port of Everett. TEAM Reid Middleton BST Associates RMC Architects
 WATERFRONT PLACE IMPLEMENTATION STRATEGY Prepared for Port of Everett TEAM Reid Middleton BST Associates RMC Architects FINANCIAL ANALYSIS This section Prepared by: BST Associates September 2014 This section
Profit & Loss Budget vs. Actual January through December 2018
 12:25 PM Manheim Borough -General Fund 10/08/18 Profit & Loss Budget vs. Actual January through December 2018 Accrual Basis Income 01 General Fund Income 301 Real Estate Taxes 301.100 Real Estate Tax Current
Atlantic Pilotage Authority
 Atlantic Pilotage Authority Third Quarter 2018 Management s Discussion and Analysis November 16, 2018 TRAFFIC REVIEW Pilotage Area Actual Budget Actual Variance Percentage Variance Percentage Traffic through
Report to: General Committee Meeting Date: November 12, 2018
 SUBJECT: 2018 September Year-To-Date Review of Operations and Year-end Projection PREPARED BY: Andrea Tang, Senior Manager of Financial Planning Jay Pak, Senior Business Analyst RECOMMENDATION: 1) THAT