ANNEX. Graph 4 GDP per capita (PPS) in 1995 and average annual growth
|
|
|
- Dwayne Hunter
- 5 years ago
- Views:
Transcription
1 ANNEX LIST OF GRAPHS Graph 1 Graph 2 Graph 3 GDP growth productivity and employment Regional disparities within Member States (Ratio between GDP share of wealthiest and least wealthy 2% of regional population) GDP per head in PPS in 23 (estimate) Graph 4 GDP per capita (PPS) in 1995 and average annual growth Graph 5 Productivity index and GDP per capita 21 Graph 6 Annual average growth productivity Graph 7 Employment rate and GDP per capita 21 Graph 8 Annual average growth employment Graph 9 Employment rate (15-64) by country and regional extremes, 23 Graph 1 Increase in net structural expenditures (excluding EU funds) in 9 new Member States Graph 11 Mid-term verification of additionality for EU-15. LIST OF TABLES Table 1 Regional GDP per head Table 2 Table 3 Table 4 Table 5 Table 6 Table 7 Table 8 Table 9 Regional disparities within Member States ( ) - ratio between GDP shares of the wealthiest 2% of regional population and the least wealthy 2% Regional disparities Underperforming regions in terms of employment and unemployment Urban Audit Allocation of the performance reserve (2-26 programming period) Proportion of ERDF and ESF commitments allocated to Lisbon objectives per Member State in the 2-26 programming period Key findings from the mid-term evaluations (2-26 programming period) Details on the main events on cohesion policy Summary of programmes in the New Member States EN 1 EN
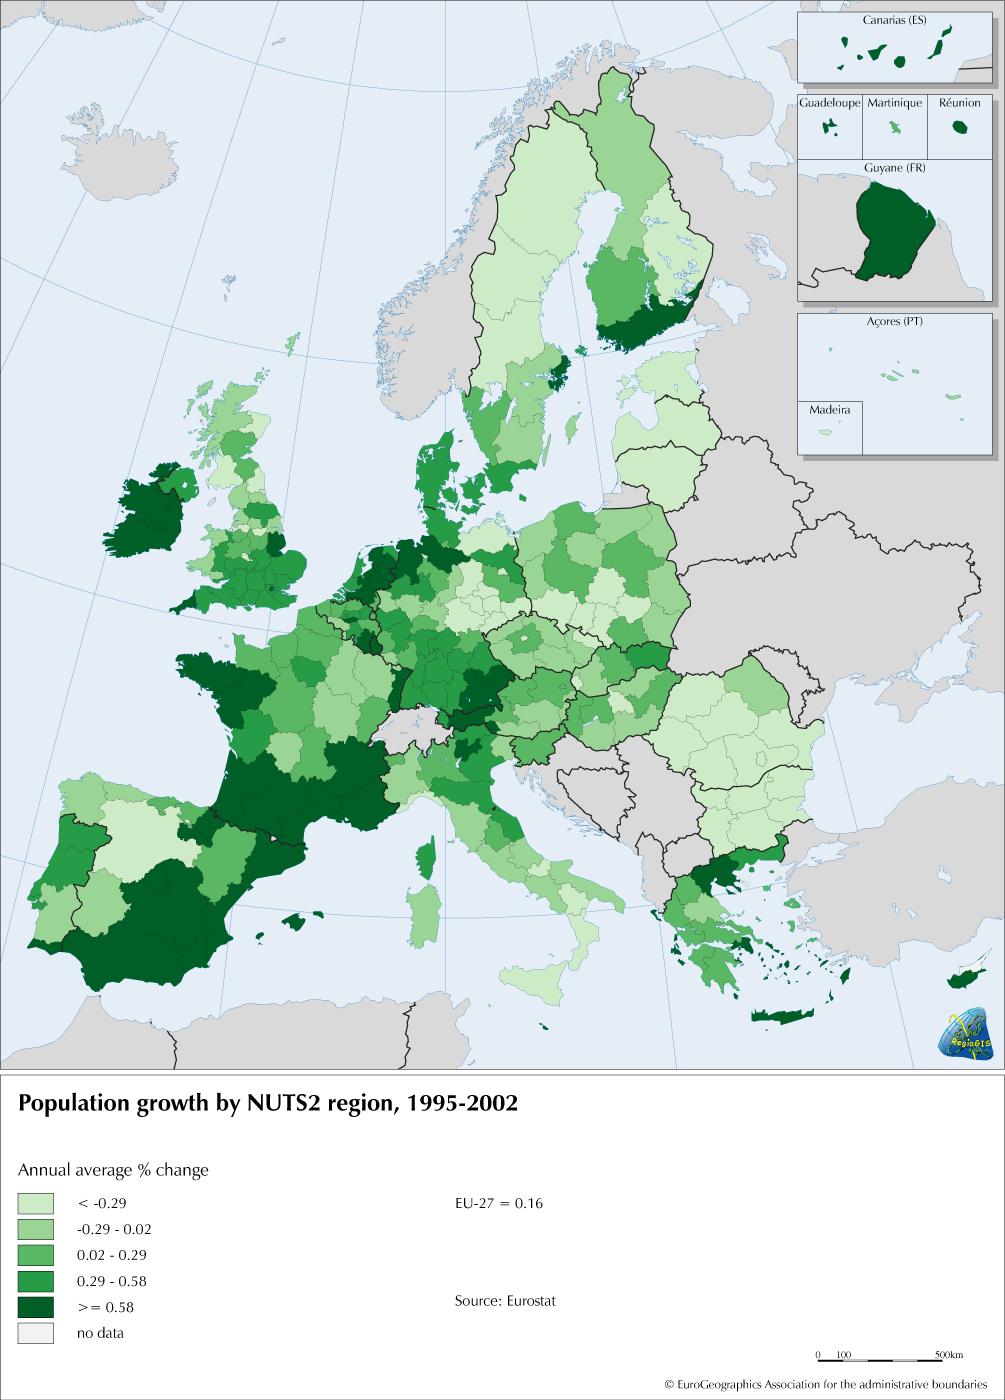
2 LIST OF MAPS Map 1 GDP per head by region (PPS), 22 Map 2 GDP growth, Map 3 Employment rate, 23 Map 4 Old-age dependency rate (effective), 23 Map 5 Old-age dependency rate, 23 Map 6 Population growth by NUTS 2 regions ( ) Map 7 R&D Expenditure (GERD) 22 Map 8 Eligibility for structural funds support Map 9 Provisional eligibility for structural funds support EN 2 EN
3 GRAPHS Graph 1 GDP growth productivity and employment 8 % GDP growth pa GDP growth components Productivity Employment IE LV EE LT LU PL SK HU SI EL FI CY ES US TR MT UK SE PT NL E25 AT E15 FR BE DK CZ IT DE BG RO Graph 2 Regional disparities within Member States (ratio between GDP share of wealthiest and least wealthy 2% of regional population) Ratio BE CZ DE EL ES FR IT HU NL AT PL PT SK FI SE UK EN 3 EN
4 Graph 3 GDP per head in PPS in 23 (estimate) EU25=1 1 5 lu ie dk at nl uk be se fr fi de it es cy gr sl pt mt cz hu sk ee pl lt lv bg ro tr us Graph 4 1 GDP per capita (PPS) in 1995 and average annual growth EU25 Regional GDP per head in 1995 and growth Average annual GDP growth (%) GDP per capita in 1995 (PPS) Graphs 4-8 are scatter graphs, where each region is represented by one dot on the graph, which summarises its relative position with respect to two variables. EN 4 EN
5 Graph 5 Productivity and GDP per capita Productivity and GDP per capita 21 GDP per person employed as % EU25 average GDP per capita in PPS as % EU Graph 6 Annual average growth /22 productivity GDP growth and productivity /22 1 Annual % change in GDP per person employed Annual % change in GDP per capita EN 5 EN
6 Graph 7 Employment rate and GDP per capita Employment rate and GDP per capita 21 Employment rate as % EU25 average GDP per capita in PPS as % EU Graph 8 Annual average growth /22 employment Growth and employment / Annual % change in persons employed Annual % change in GDP per capita EN 6 EN
7 Graph 9 Employment rate (15-64) by country and regional extremes, 23 Employment rate (15-64) by country and regional extremes, 23 % BE CZ DK DE EE EL ES FR IE IT CY LV LT LU HU MT NL AT PL PT SI SK FI SE UK BG RO Graph 1 Increase in net structural expenditures (excluding EU funds) in 9 new Member States Chart 1 Increase in net structural expenditures (excluding EU funds) 35,% 3,% 25,% 2,% 15,% 1,% 5,%,% Czech Republic Estonia Hungary Latvia Lithuania Malta Poland Slovakia Slovenia EN 7 EN
8 Graph 11 Mid-term verification of additionality for EU-15 Mid-term verification of additionality for 2-6 programmes 25 2 Mio euro baseline forecasted annual average in Mio Eur 1999 prices actual annual average in Mio Eur 1999 prices Allemagne Autriche Belgique Espagne Finlande France Grèce (1) Member state Irlande Italie Pays-Bas Portugal Royaume Uni Suède EN 8 EN
9 TABLES Table 1 Regional GDP per head Regions Population % EU25 population Convergence <75% Statistical effect Phasing-in Table 2 Regional disparities within Member States ( ) - ratio between GDP shares of the wealthiest 2% of regional population and the least wealthy 2% BE CZ DE EL ES FR IT HU NL AT PL PT SK FI SE UK EN 9 EN
10 Table 3 Regional disparities Underperforming regions in terms of employment and unemployment Regional disparities - Underperforming regions 1. Share of underperforming regions in terms of employment and unemployment ( in relation to all regions and to the working age population/labour force) (NUTS II) (by gender) 2. Differential between average employment/unemployment of the underperforming regions and the national average in relation to the national average of employment/unemployment (NUTSII) (by gende Thresholds to be applied 9% and 15% of the national average rate for employment and unemployment, respectivel Note An extra column with the national employment and unemployment rates in each country would be added in the presentation of the d % of regions with E.R below 9% of the national % of total national working age population Extent of divergence of the regions concerned Employment average E.R (number of regions affected/ total in the regions concerned from the national average (average E.R of regions number of regions concerned as % of national average) AT BE CZ DE DK EL ES FI FR HU IE IT LU NL PL PT SE SK UK, (/9) 9,1 (1/11), (/8) 5, (2/4), (/1), (/13) 22,2 (4/18) 16,7 (1/6) 13,6 (3/22) 28,6 (2/7), (/2) 3, (6/2), (/1), (/12) 18,8 (3/16), (/7), (/8), (/4) 1,8 (4/37) 12,3 1,7 23,6 12,6 11,3 27, ,2 12, ,5 85, ,8 89,1 89 % of regions with E.R below 9% of the national % of total national working age population Extent of divergence of the regions concerned Employment average E.R (number of regions affected/ total in the regions concerned from the national average (average E.R of regions number of regions concerned as % of national average) AT BE CZ DE DK EL ES FI FR HU IE IT LU NL PL PT SE SK UK 11,1 (1/9) 18,2 (2/11) 25, (2/8) 25, (1/4), (). (/13) 11,1 (2/18) 16,7 (1/6) 13,6 (3/22) 14,3 (1/7), (/2) 3, (6/2), () 8,3 (1/12), (/16), (/7), (/8), (/4) 5,4 (2/37) 2,5 2,7 23, ,4 1,2 1,3 11,3 29 3,5 8,4 18,6 179,4 169,7 21,4 172,1 154,8 152,7 152, ,8 165,9 Source Labour Force Survey (LFS), Eurostat EN 1 EN
11 Table 4 Urban Audit The latest edition of the Commission s Urban Audit was published in 24; it brings together a wide range of indicators for 258 large and medium-size cities across the 25 Member States as well as Romania and Bulgaria. In general, urban residents seem to have a different profile to the population of the countries they live in. They are more likely to be single, of working age, have completed tertiary education and be a foreign citizens. The elderly and households with children under 18 less likely to be living in cities. This confirms the low dependency rates found for large urban regions. Cities act as centres of employment for a widely-drawn population, with one in every three jobs being taken by someone commuting into the city. On the other hand, in 8% of cities surveyed, a lower share of residents was economically active than the population of their respective countries. In 65% of cities, a higher share of urban residents was unemployed than the population of their country. In some cities, unemployment rates were more than double the national rate such as for example in Rotterdam, Porto, Liverpool, Leipzig and Montpellier. In the new Member States and Romania, unemployment has a different geographical distribution. The differences between cities in these countries is greater than in the old Member States, for example in Romania, the city of Arad has an unemployment rate of only 5% compared to 24% in Calarasi. The unemployed are also more often likely to live outside the city. Whereas in the old Member States unemployment rates tend to be higher within the cities than in its suburbs. In the new Member States and Romania, the region surrounding the city has a (far) higher unemployment rate. EN 11 EN
12 Table 5 Allocation of the performance reserve Member State Total amount of performance reserve 2 Areas/activities Austria Belgium Denmark Objective 1 12 million Objective 2 31 million Objective Objective 1 28 million Objective 2 19 million Objective Objective 2 8 million Objective on Obj. 1 Research, technology and development and on Obj. 1 Commercial and industrial activities Obj. 2 Lower Austria more than half of performance reserve on mobilising endogenous potential for regional development Obj. 2 Steiermark, nearly half of performance reserve on information society 2 million on new technology infrastructure as part of the knowledge economy priority axis. 9.8 million on expanding the productive base (stimulating economic growth and creating employment) in Objective 1 areas on equal access to the labour market; and on entrepreneurship and innovation Finland France Objective 1 41 million Objective 2 23 million Objective Objective million Objective million Objective (promotion of employability); (equal opportunities); (development of human capital to support entrepreneurship) in Obj. 3 Performance reserve in France directed primarily to the areas of information technology, R&D, and environment (water/waster management and natural risk prevention). 1 million, part of the performance reserve allocated to broadband networks 2 Commission Decision 24/344/EC of 23 March 24 fixing the allocation of performance reserve by Member States for Community Structural Funds assistance under Objectives 1, 2 and 3 and the Financial Instrument for Fisheries Guidance outside Objective 1 (OJ L ) and Corrigenda OJ L and OJ L EN 12 EN
13 Germany Objective million Objective million Objective of total performance reserve of in Obj. 2 West Berlin to promoting the competitiveness of the industrial economy, particularly SMEs; (entire performance reserve) of Obj. 2 Nord-Rhein Westfalen to "innovation and knowledge development". Greece Objective million National reserve used to increase the effort in favour of human resources from around 19% to around 24% following the MTR to be spent on employment promotion and vocational training; on education and vocational training Performance reserve to include more state aids to business through OP Competitiveness ( ) including important reforms in the delivery system, using banks rather than the public administration to manage state aid applications. Bulk of performance reserve spent on traditional infrastructure projects ( ) Ireland Objective million Entire performance reserve on Economic and social infrastructure OP, primarily infrastructure. Italy Objective million Objective million Objective on Objective 1 Research OP; on Objective 1 Education OP; Luxembourg Objective 2 3 million Objective EN 13 EN
14 Netherlands Objective 1 6 million Objective 2 36 million Objective Objective 2 Noord-Nederland; performance reserve of 14.7 million was allocated essentially to Reinforcement of the market sector, in particular SME support; a second measure was added focusing on knowledge, innovation and sustainability and by re-allocating the bulk of the 59 M priority budget to this new measure Portugal Objective million on Health OP (Obj. 1); on Employment, training and social development OP (Obj. 1); on OP Science, Technology, Innovation Spain Objective 1 1,717 million Objective million Objective on OP Employment Development; on improving competitiveness and developing production structures; on research, development and innovation in Objective 1 areas Sweden UK Objective 1 32 million Objective 2 17 million Objective Objective million Objective million Objective Strengthening public-private partnerships in research now form 15% of all Obj. 2 programmes Most of the performance reserve allocated to measures for infrastructure and business development infrastructure important amounts to the support of broadband in the outer regions and in the sparsely populated areas. Emphasis on sustainable development and environmentally sound living. Objective 1 Northern Ireland OP; 25 million for Economic Growth and Competitiveness Obj towards active labour policies in England; (England) and (Wales) towards equal opportunities and social inclusion EN 14 EN
15 Table 6 Proportion of ERDF and ESF commitments allocated to Lisbon objectives per Member State in the 2-26 programming period 3 Total (excl. TA) ERDF and ESF to Objective 1 More and better jobs* Environment Transport Other** Austria % 4% % 3% Belgium % 8% 1% 9% Finland % 2% 2% 8% France % 15% 14% 2% Germany % 15% 19% 5% Greece % 8% 36% 16% Hungary % 18% 27% 13% Ireland % 9% 35% 4% Italy % 14% 17% 17% Latvia % 1% 19% 15% Netherlands % 18% 2% 16% Portugal % 14% 2% 22% Slovenia % 8% 4% 2% Spain % 19% 28% 11% Sweden % 1% 6% 13% UK % 12% 17% 3% Totals % 14% 24% 13% ERDF and ESF to Objective 2 Total (excl. TA) More and better jobs* Environment Transport Other** Austria % 5% 1% 39% Belgium % 14% 4% 25% Cyprus % 5% 7% 45% Denmark % 5% 2% 21% Finland % 12% 5% 7% France % 19% 9% 24% Germany % 17% 3% 18% Italy % 25% 9% 21% Luxembourg % 39% 3% 18% Netherlands % 25% 4% 25% Spain % 19% 11% 1% Sweden % 8% 9% 16% UK % 1% 2% 14% Totals #REF! #REF! #REF! #REF! * More and better jobs knowledge economy, innovation, ICT, R&D ** Other eg. tourism, social and health infrastructure, rural development 3 At February 25, not all revised programme complements have been adopted. EN 15 EN
16 Table 7 period) Key findings from the mid-term evaluations (2-26 programming Measures promoting economic growth and competitiveness seem to have been reinforced particularly in Objective 2 areas; in some instances, the entire performance reserve for a particular programme has been directed towards competitiveness. Education and vocational training continues to be an important dimension in the majority of Objective 1 and 2 programmes and the performance reserve in several Member States was targeting at reinforcing these programmes as a way of creating employment. The environment was a horizontal priority for the Structural Funds and the evaluations provide insights into how to enhance the practical integration of the priority and how the concept of sustainable development can be made real in the programmes. The Structural Funds also support direct environmental actions including the revitalisation of industrial sites, the development of renewable energy sources and the development of facilities for fresh water supply or waste disposal, as well as the development of protected areas. In general, the more traditional types of projects are proceeding according to plan with more innovative measures taking longer to start up. Objective 1 programmes continue to orient their programmes towards traditional Structural Fundstype projects such as transport and infrastructure. Thus, the allocation of performance reserve in these areas continues to focus on the development of large road and rail projects as well as ports, airports and local transport initiatives. Nevertheless, in some Member States with large Objective 1 areas, more emphasis seems to have been placed on research and innovation. In nearly all cases the evaluators concluded that the programme strategies were still appropriate. For the ESF, the evaluations recommended greater investment in lifelong learning and training for those at work, greater targeting of youth, reinforcement of social inclusion and the strengthening of active employment policies. It was likewise too early to measure impact, although evaluations did in some cases recommend the revision of targets based on the experience of the early years of implementation. Macro economic modelling undertaken for large CSFs suggests that programmes are on course to achieve their global objectives. The impact of EU funding on the level of GDP is estimated 3.13% in Spain, 3.12% in Eastern Germany, 3% in Greece, 2.85% in Italy, 1.9% in Portugal and 1.4% in Ireland 4. Efficiency was more often defined as financial absorption rather than the cost per output or result achieved. Financial absorption is clearly improved compared to the past, driven by the requirements of the N+2 rule. Implementation systems were found to fulfil the regulatory requirements and to be significantly improved on the past. 4 Comparisons should not be made between these figures, given the different methodologies and time horizons used in the models. EN 16 EN
17 Table 8 Details on the main events on cohesion policy In the context of the mid-term review of the Structural Funds, a seminar was held in Brussels on 29-3 January 24 on the implementation of the ESF and its contribution to Cohesion policy and to the European Employment Strategy (EES). Representatives from current and acceding Member States, as well as candidate countries, discussed the ESF achievements and prospects for the current programming period and that after 26. Participants underlined the importance of the links established in the current programming period between ESF interventions and the objectives and guidelines of the EES, within the framework of the Lisbon strategy in particular the ESF s focus on investing in people and its contribution to competitiveness and employment within a coherent EU framework the European Employment Strategy (EES). More than 1,5 regional policy stakeholders participated in the Third Cohesion Forum on 1 and 11 May 24 in Brussels. This major debate brought together the contributions of a wide range of key players on the reform of the cohesion policy in the context of an enlarged Europe. The discussions were organised around two round-tables Setting a new agenda future priorities for cohesion policy and Reforming the delivery system simplification and decentralisation which referred to the proposals made by the Commission in the conclusions of the Third Cohesion Report. The various contributions revealed strong support for cohesion policy in the Member States, regions and cities. Two major conclusions emerged from the Forum (1) Cohesion is at the heart of the Union s efforts to improve the economic performance and the competitiveness of the European economy. This will require mobilisation of all the resources and all the regions. And in this context, enlargement is an opportunity because the economic growth of the new Member States is stronger than that of the 15 old Member States. (2) The cohesion policy could be more targeted, more decentralised and simpler than it is at present. The OPEN DAYS 24, an event jointly organised by the Committee of the Regions, the European Commission s Regional Policy DG and offices of Europe s regions and cities in Brussels, brought together more than 2, regional policy experts between 27 and 3 September. Over 1 regions and cities took part in the initiative, which comprised more than 7 debates, workshops and seminars. The major issue of the event concerned the exchange of best practices in managing regional development policies and the future of cohesion policy and the Structural Funds. Many participating regions organised on this occasion a series of decentralised events dedicated to citizens, such as guided tours to projects funded by the Structural Funds in their region or debates in schools or universities. On the initiative of the European Commission and the Dutch Presidency, more than 6 city representatives, including 6 mayors and 6 Ministers or State Secretaries from all the Member States of the EU, met at the European City Summit on October 24 in Noordwijk and Leiden in the Netherlands. Based on previous city summits in London in 22 and Milan in 23, this one represented a key opportunity for mayors and elected representatives from local authorities to discuss the urban dimension of the Commission s regulations proposals.apart from this, lessons and good practice from the URBAN programmes as well as from URBACT network were drawn and the results of the Urban Audit 24 were presented. On 3 March 25, the Commission organised a conference in Brussels entitled Cohesion and the Lisbon Agenda The Role of the Regions. More than 5 participants - among them the elected leaders of many EU regions, regional policy stakeholders and experts, representing more than 18 regions from 25 Member States and 4 accession/candidate countries (Romania, Bulgaria, Croatia and Turkey) - met to discuss how regions can contribute towards a more competitive EU economy and the objectives of the Commission s growth and jobs agenda. The main conclusion of the conference was that Lisbon needs the regions as much as the regions need Lisbon. In his opening remarks at the conference, President Barroso spoke of the need for Lisbon Ambassadors at the regional and local levels, a point reinforced over the course of the conference with discussion on how regions can contribute to better economic governance and to ownership of the Lisbon strategy. EN 17 EN
18 Table 9 Summary of programmes in the new Member States In the Czech Republic (except the Prague region), the Community Support Framework (EUR 1.45 billion) will be channelled through five Operational Programmes industry and enterprise, infrastructure, human resources development, rural development and multifunctional agriculture, and a joint regional programme. For the Prague region, one programme (EUR 71 million) will concentrate on improving the urban environment and the other (EUR 59 million) on human resource development. In Cyprus, one programme (EUR 28 million) is aimed at sustainable rural development and the development of urban areas in difficulty. A second programme (EUR 22 million) will seek to revitalise the labour market and promote continuous training and education. Cyprus also receives EUR 3.4 million under a programme to support its fisheries sector. In Estonia (EUR 371 million), the structural instruments will pursue four priorities human resources development, competitiveness, agriculture, fisheries and rural development, infrastructures and local development. The programmes for Hungary (EUR million) will concentrate on employment and human resources, economic competitiveness, transport infrastructures and environmental protection, agriculture and rural development, regional development. Latvia will implement a programme (EUR 626 million) based on four priorities territorial cohesion, enterprises and innovation, promotion of employment, rural development and fisheries. The programme for Lithuania (EUR 895 million) will concentrate on improving social and economic infrastructures, human resources development, productive sector development, rural and fisheries development. Malta (EUR 63.2 million) will pursue a policy of strategic investments and measures to improve business competitiveness, promote rural development and fisheries plus a specific support for the island of Gozo. The framework programme for Poland (EUR million) will be channelled through programmes for competitiveness, human resources development, transport infrastructure, modernising the food sector and rural development, fisheries and fish processing, and regional development plus a programme for technical assistance. Slovenia will focus Community funding (EUR million) on three priorities boosting competitiveness in the production sector, developing human resources and employment, and restructuring agriculture, forestry and fishing. Slovakia (except the Bratislava region) will devote four programmes (EUR 1 41 million) to industry and services, human resources, basic infrastructures, agriculture and rural development. The Bratislava region has a programme (EUR 37 million) for investment support and another programme (EUR 45 million) for human resources development. EN 18 EN
19 EN 19 EN
20 EN 2 EN
21 EN 21 EN
22 EN 22 EN
23 EN 23 EN
24 EN 24 EN
25 EN 25 EN
26 EN 26 EN
27 EN 27 EN
COMMISSION STAFF WORKING DOCUMENT Accompanying the document
 EUROPEAN COMMISSION Brussels, 9.10.2017 SWD(2017) 330 final PART 13/13 COMMISSION STAFF WORKING DOCUMENT Accompanying the document REPORT FROM THE COMMISSION TO THE EUROPEAN PARLIAMENT, THE COUNCIL, THE
Growth, competitiveness and jobs: priorities for the European Semester 2013 Presentation of J.M. Barroso,
 Growth, competitiveness and jobs: priorities for the European Semester 213 Presentation of J.M. Barroso, President of the European Commission, to the European Council of 14-1 March 213 Economic recovery
PROGRESS TOWARDS THE LISBON OBJECTIVES 2010 IN EDUCATION AND TRAINING
 PROGRESS TOWARDS THE LISBON OBJECTIVES IN EDUCATION AND TRAINING In 7, reaching the benchmarks for continues to pose a serious challenge for education and training systems in Europe, except for the goal
PROGRESS TOWARDS THE LISBON OBJECTIVES 2010 IN EDUCATION AND TRAINING
 PROGRESS TOWARDS THE LISBON OBJECTIVES IN EDUCATION AND TRAINING In, reaching the benchmarks for continues to pose a serious challenge for education and training systems in Europe, except for the goal
October 2010 Euro area unemployment rate at 10.1% EU27 at 9.6%
 STAT//180 30 November 20 October 20 Euro area unemployment rate at.1% EU27 at 9.6% The euro area 1 (EA16) seasonally-adjusted 2 unemployment rate 3 was.1% in October 20, compared with.0% in September 4.
DATA SET ON INVESTMENT FUNDS (IVF) Naming Conventions
 Naming Conventions") DIRECTORATE GENERAL STATISTICS LAST UPDATE: 10 APRIL 2013 DIVISION MONETARY & FINANCIAL STATISTICS ECB-UNRESTRICTED DATA SET ON INVESTMENT FUNDS (IVF) Naming Conventions The series keys related to Investment
DIRECTORATE GENERAL STATISTICS LAST UPDATE: 10 APRIL 2013 DIVISION MONETARY & FINANCIAL STATISTICS ECB-UNRESTRICTED DATA SET ON INVESTMENT FUNDS (IVF) Naming Conventions The series keys related to Investment
January 2010 Euro area unemployment rate at 9.9% EU27 at 9.5%
 STAT//29 1 March 20 January 20 Euro area unemployment rate at 9.9% EU27 at 9.5% The euro area 1 (EA16) seasonally-adjusted 2 unemployment rate 3 was 9.9% in January 20, the same as in December 2009 4.
Prospects for the review of the EU 2020 Strategy, the Juncker Plan and Cohesion Policy after 2020
 Prospects for the review of the EU 2020 Strategy, the Juncker Plan and Cohesion Policy after 2020 Jurmala, June 3 2015 Philippe Monfort DG for Regional and European Commission Preamble Little information
Social Protection and Social Inclusion in Europe Key facts and figures
 MEMO/08/625 Brussels, 16 October 2008 Social Protection and Social Inclusion in Europe Key facts and figures What is the report and what are the main highlights? The European Commission today published
The EFTA Statistical Office: EEA - the figures and their use
 The EFTA Statistical Office: EEA - the figures and their use EEA Seminar Brussels, 13 September 2012 1 Statistics Comparable, impartial and reliable statistical data are a prerequisite for a democratic
LEADER implementation update Leader/CLLD subgroup meeting Brussels, 21 April 2015
 LEADER 2007-2013 implementation update Leader/CLLD subgroup meeting Brussels, 21 April 2015 #LeaderCLLD 2,416 2,416 8.9 Progress on LAG selection in the EU (2007-2013) 3 000 2 500 2 000 2 182 2 239 2 287
State of play of CAP measure Setting up of Young Farmers in the European Union
 State of play of CAP measure Setting up of Young Farmers in the European Union Michael Gregory EN RD Contact Point Seminar CEJA 20 th September 2010 Measure 112 rationale: Measure 112 - Setting up of young
Economic Integration and Social Cohesion: the European Union s experience. Vasco Cal Mexico November 2004
 Economic Integration and Social Cohesion: the European Union s experience Vasco Cal Mexico November 2004 Structure of this presentation Origins of EU cohesion policy Cohesion policy: value added Main challenges
COUNCIL OF THE EUROPEAN UNION. Brussels, 13 June /1/13 REV 1 SOC 409 ECOFIN 444 EDUC 190
 COUNCIL OF THE EUROPEAN UNION Brussels, 13 June 2013 10373/1/13 REV 1 SOC 409 ECOFIN 444 EDUC 190 COVER NOTE from: to: Subject: The Employment Committee Permanent Representatives Committee (Part I) / Council
Report on the distribution of direct payments to agricultural producers (financial year 2016)
") Report on the distribution of direct payments to agricultural producers (financial year 2016) Every year, the Commission publishes the distribution of direct payments to farmers by Member State. Figures
Report on the distribution of direct payments to agricultural producers (financial year 2016) Every year, the Commission publishes the distribution of direct payments to farmers by Member State. Figures
COMMISSION STAFF WORKING DOCUMENT Accompanying the document. Report form the Commission to the Council and the European Parliament
 EUROPEAN COMMISSION Brussels, 4.5.2018 SWD(2018) 246 final PART 5/9 COMMISSION STAFF WORKING DOCUMENT Accompanying the document Report form the Commission to the Council and the European Parliament on
COMMISSION DECISION of 23 April 2012 on the second set of common safety targets as regards the rail system (notified under document C(2012) 2084)
 2084)") 27.4.2012 Official Journal of the European Union L 115/27 COMMISSION DECISION of 23 April 2012 on the second set of common safety targets as regards the rail system (notified under document C(2012) 2084)
27.4.2012 Official Journal of the European Union L 115/27 COMMISSION DECISION of 23 April 2012 on the second set of common safety targets as regards the rail system (notified under document C(2012) 2084)
NOTE ON EU27 CHILD POVERTY RATES
 NOTE ON EU7 CHILD POVERTY RATES Research note prepared for Child Poverty Action Group Authors: H. Xavier Jara and Chrysa Leventi Institute for Social and Economic Research (ISER) University of Essex The
Gender pension gap economic perspective
 Gender pension gap economic perspective Agnieszka Chłoń-Domińczak Institute of Statistics and Demography SGH Part of this research was supported by European Commission 7th Framework Programme project "Employment
For further information, please see online or contact
 For further information, please see http://ec.europa.eu/research/sme-techweb online or contact Lieve.VanWoensel@ec.europa.eu Seventh Progress Report on SMEs participation in the 7 th R&D Framework Programme
CHAPTER 4. Overview of the EU Rural Development Policy
 CHAPTER 4. Overview of the EU Rural Development Policy 2007-2013 Council Regulation (EC) No 1698/2005 of 20 September 2005 on support for rural development by the European Agricultural Fund for Rural Development
Investment in Ireland and the EU
 Investment in and the EU Debora Revoltella Director Economics Department Dublin April 10, 2017 20/04/2017 1 Real investment: IE v EU country groupings Real investment (2008 = 100) 180 160 140 120 100 80
HOW RECESSION REFLECTS IN THE LABOUR MARKET INDICATORS
 REPUBLIC OF SLOVENIA HOW RECESSION REFLECTS IN THE LABOUR MARKET INDICATORS Matej Divjak, Irena Svetin, Darjan Petek, Miran Žavbi, Nuška Brnot ??? What is recession?? Why in Europe???? Why in Slovenia?
Themes Income and wages in Europe Wages, productivity and the wage share Working poverty and minimum wage The gender pay gap
 5. W A G E D E V E L O P M E N T S At the ETUC Congress in Seville in 27, wage developments in Europe were among the most debated issues. One of the key problems highlighted in this respect was the need
The Eurostars Programme
 The Eurostars Programme The EU-EUREKA joint funding programme for R&D-performing SMEs What is EUREKA? > 2 > EUREKA is a public network supporting R&D-performing businesses > Established in 1985 by French
Taxation trends in the European Union EU27 tax ratio at 39.8% of GDP in 2007 Steady decline in top personal and corporate income tax rates since 2000
 DG TAXUD STAT/09/92 22 June 2009 Taxation trends in the European Union EU27 tax ratio at 39.8% of GDP in 2007 Steady decline in top personal and corporate income tax rates since 2000 The overall tax-to-gdp
COVER NOTE The Employment Committee Permanent Representatives Committee (Part I) / Council EPSCO Employment Performance Monitor - Endorsement
 / Council EPSCO Employment Performance Monitor - Endorsement") COUNCIL OF THE EUROPEAN UNION Brussels, 15 June 2011 10666/1/11 REV 1 SOC 442 ECOFIN 288 EDUC 107 COVER NOTE from: to: Subject: The Employment Committee Permanent Representatives Committee (Part I) / Council
COUNCIL OF THE EUROPEAN UNION Brussels, 15 June 2011 10666/1/11 REV 1 SOC 442 ECOFIN 288 EDUC 107 COVER NOTE from: to: Subject: The Employment Committee Permanent Representatives Committee (Part I) / Council
Standard Eurobarometer
 Standard Eurobarometer 67 / Spring 2007 Standard Eurobarometer European Commission SPECIAL EUROBAROMETER EUROPEANS KNOWELEDGE ON ECONOMICAL INDICATORS 1 1 This preliminary analysis is done by Antonis PAPACOSTAS
Fiscal competitiveness issues in Romania
 Fiscal competitiveness issues in Romania Ionut Dumitru President of the Fiscal Council, Chief Economist Raiffeisen Bank* October 2014 World Bank Doing Business Report Ranking (out of 189 countries) Ease
The Reform of the Common Agricultural Policy Implementation. Catherine Combette DG Agriculture and Rural Development European Commission
 The Reform of the Common Agricultural Policy 2014-2020 Implementation Catherine Combette DG Agriculture and Rural Development European Commission catherine.combette@ec.europa.eu Agriculture and Rural Development
EUROPE 2020 STRATEGY FORECASTING THE LEVEL OF ACHIEVING ITS GOALS BY THE EU MEMBER STATES
 Abstract. Based on the interdependencies that exist between world economies, the effects of the Europe 2020 strategy is going to affect every company no matter if it operates or not in an EU member state.
Investment in Germany and the EU
 Investment in Germany and the EU Pedro de Lima Head of the Economics Studies Division Economics Department Berlin 19/12/2016 11/01/2017 1 Slow recovery of investment, with strong heterogeneity Overall
European Commission. Statistical Annex of Alert Mechanism Report 2017
 European Commission Statistical Annex of Alert Mechanism Report 2017 COMMISSION STAFF WORKING DOCUMENT STATISTICAL ANNEX Accompanying the document REPORT FROM THE COMMISSION TO THE EUROPEAN PARLIAMENT,
Introduction to EU Regional and Innovation Policy
 China EU Training on Regional Policy () Twinning session in Tianjin: Regional development and innovation Introduction to EU Regional and Innovation Policy Tianjin, 29 July 2014 Pablo Gándara Coordinator
Eurofound in-house paper: Part-time work in Europe Companies and workers perspective
 Eurofound in-house paper: Part-time work in Europe Companies and workers perspective Presented by: Eszter Sandor Research Officer, Surveys and Trends 26/03/2010 1 Objectives Examine the patterns of part-time
Two years to go to the 2014 European elections European Parliament Eurobarometer (EB/EP 77.4)
") Directorate-General for Communication PUBLIC OPINION MONITORING UNIT Brussels, 23 October 2012. Two years to go to the 2014 European elections European Parliament Eurobarometer (EB/EP 77.4) FOCUS ON THE
Directorate-General for Communication PUBLIC OPINION MONITORING UNIT Brussels, 23 October 2012. Two years to go to the 2014 European elections European Parliament Eurobarometer (EB/EP 77.4) FOCUS ON THE
Aleksandra Dyba University of Economics in Krakow
 61 Aleksandra Dyba University of Economics in Krakow dyba@uek.krakow.pl Abstract Purpose development is nowadays a crucial global challenge. The European aims at building a competitive economy, however,
Special Eurobarometer 418 SOCIAL CLIMATE REPORT
 Special Eurobarometer 418 SOCIAL CLIMATE REPORT Fieldwork: June 2014 Publication: November 2014 This survey has been requested by the European Commission, Directorate-General for Employment, Social Affairs
August 2008 Euro area external trade deficit 9.3 bn euro 27.2 bn euro deficit for EU27
 STAT/08/143 17 October 2008 August 2008 Euro area external trade deficit 9.3 27.2 deficit for EU27 The first estimate for the euro area 1 (EA15) trade balance with the rest of the world in August 2008
May 2009 Euro area external trade surplus 1.9 bn euro 6.8 bn euro deficit for EU27
 STAT/09/106 17 July 2009 May 2009 Euro area external trade surplus 1.9 6.8 deficit for EU27 The first estimate for the euro area 1 (EA16) trade balance with the rest of the world in May 2009 gave a 1.9
How much does it cost to make a payment?
 How much does it cost to make a payment? Heiko Schmiedel European Central Bank Directorate General Payments & Market Infrastructure, Market Integration Division World Bank Global Payments Week 23 October
Investment in France and the EU
 Investment in and the EU Natacha Valla March 2017 22/02/2017 1 Change relative to 2008Q1 % of GDP Slow recovery of investment, and with strong heterogeneity Overall Europe s recovery in investment is slow,
Fiscal sustainability challenges in Romania
 Preliminary Draft For discussion only Fiscal sustainability challenges in Romania Bucharest, May 10, 2011 Ionut Dumitru Anca Paliu Agenda 1. Main fiscal sustainability challenges 2. Tax collection issues
Communication, Legal Affairs & Civil Protection Protecting the Natural Environment Unit: Nature and Biodiversity
 DG Environment Commissioner: Stavros Dimas Director-General: Mogens Peter Carl Direction A: Direction B: Direction C: Direction D: Direction E: Direction F: Direction G: Communication, Legal Affairs &
Issues Paper. 29 February 2012
 29 February 212 Issues Paper In the context of the European semester, the March European Council gives, on the basis of the Commission's Annual Growth Survey, guidance to Member States for the Stability
REGIONAL PROGRESS OF THE LISBON STRATEGY OBJECTIVES IN THE EUROPEAN REGION EGRI, ZOLTÁN TÁNCZOS, TAMÁS
 REGIONAL PROGRESS OF THE LISBON STRATEGY OBJECTIVES IN THE EUROPEAN REGION EGRI, ZOLTÁN TÁNCZOS, TAMÁS Key words: Lisbon strategy, mobility factor, education-employment factor, human resourches. CONCLUSIONS
Access to EU-Funding. Ulrich Daldrup Riga, 19th February 2002
 Regional Development in the EU Regional Development in the EU and Access to EU-Funding presented by Ulrich Daldrup Riga, 19th February 2002 1 Regional Development in the EU Programmes Funding is available
THE 2015 EU JUSTICE SCOREBOARD
 THE 215 EU JUSTICE SCOREBOARD Communication from the Commission to the European Parliament, the Council, the European Central Bank, the European Economic and Social Committee and the Committee of the Regions
Flash Eurobarometer 441. Report. European SMEs and the Circular Economy
 European SMEs and the Circular Economy Survey requested by the European Commission, Directorate-General Environment and co-ordinated by the Directorate-General for Communication This document does not
January 2009 Euro area external trade deficit 10.5 bn euro 26.3 bn euro deficit for EU27
 STAT/09/40 23 March 2009 January 2009 Euro area external trade deficit 10.5 26.3 deficit for EU27 The first estimate for the euro area 1 (EA16) trade balance with the rest of the world in January 2009
ANNEX CAP evolution and introduction of direct payments
 ANNEX 2 REPORT ON THE DISTRIBUTION OF DIRECT AIDS TO THE PRODUCERS (FINANCIAL YEAR 2005) 1. FOREWORD The Commission regularly publishes the breakdown of direct payments by Member State and size of payment.
Securing sustainable and adequate social protection in the EU
 Securing sustainable and adequate social protection in the EU Session on Social Protection & Security IFA 12th Global Conference on Ageing 11 June 2014, HICC Hyderabad India Dr Lieve Fransen European Commission
Weighting issues in EU-LFS
 Weighting issues in EU-LFS Carlo Lucarelli, Frank Espelage, Eurostat LFS Workshop May 2018, Reykjavik carlo.lucarelli@ec.europa.eu, frank.espelage@ec.europa.eu 1 1. Introduction The current legislation
in focus Statistics Contents Labour Mar k et Lat est Tr ends 1st quar t er 2006 dat a Em ploym ent r at e in t he EU: t r end st ill up
 Labour Mar k et Lat est Tr ends 1st quar t er 2006 dat a Em ploym ent r at e in t he EU: t r end st ill up Statistics in focus This publication belongs to a quarterly series presenting the European Union
STAT/14/ October 2014
 STAT/14/158-21 October 2014 Provision of deficit and debt data for 2013 - second notification Euro area and EU28 government deficit at 2.9% and 3.2% of GDP respectively Government debt at 90.9% and 85.4%
The Skillsnet project on Medium-term forecasts of occupational skill needs in Europe: Replacement demand and cohort change analysis
 The Skillsnet project on Medium-term forecasts of occupational skill needs in Europe: Replacement demand and cohort change analysis Paper presented at the Workshop on Medium-term forecast of occupational
2 ENERGY EFFICIENCY 2030 targets: time for action
 ENERGY EFFICIENCY 2030 targets: time for action The Coalition for Energy Savings The Coalition for Energy Savings strives to make energy efficiency and savings the first consideration of energy policies
Country Health Profiles
 State of Health in the EU Country Health Profiles Brussels, November 2017 1 The Country Health Profiles 1. Highlights 2. Health status 3. Risk Factors 4. Health System (description) 5. Performance of Health
PUBLIC PERCEPTIONS OF VAT
 Special Eurobarometer 424 PUBLIC PERCEPTIONS OF VAT REPORT Fieldwork: October 2014 Publication: March 2015 This survey has been requested by the European Commission, Directorate-General for Taxations and
H Marie Skłodowska-Curie Actions (MSCA)
") H2020 Key facts and figures (2014-2020) Number of NL researchers funded by MSCA: EU budget awarded to NL organisations (EUR million): Number of NL organisations in MSCA: 427 268.91 351 In detail, the number
H2020 Key facts and figures (2014-2020) Number of NL researchers funded by MSCA: EU budget awarded to NL organisations (EUR million): Number of NL organisations in MSCA: 427 268.91 351 In detail, the number
Investment and Investment Finance. the EU and the Polish story. Debora Revoltella
 Investment and Investment Finance the EU and the Polish story Debora Revoltella Director - Economics Department EIB Warsaw 27 February 2017 Narodowy Bank Polski European Investment Bank Contents We look
H Marie Skłodowska-Curie Actions (MSCA)
") H2020 Key facts and figures (2014-2020) Number of PT researchers funded by MSCA: EU budget awarded to PT organisations (EUR million): Number of PT organisations in MSCA: 716 66,67 165 In detail, the number
H2020 Key facts and figures (2014-2020) Number of PT researchers funded by MSCA: EU budget awarded to PT organisations (EUR million): Number of PT organisations in MSCA: 716 66,67 165 In detail, the number
EUROPEAN COMMISSION EUROSTAT
 EUROPEAN COMMISSION EUROSTAT Directorate F: Social statistics Unit F-3: Labour market Doc.: Eurostat/F3/LAMAS/29/14 WORKING GROUP LABOUR MARKET STATISTICS Document for item 3.2.1 of the agenda LCS 2012
H Marie Skłodowska-Curie Actions (MSCA)
") H2020 Key facts and figures (2014-2020) Number of FR researchers funded by MSCA: EU budget awarded to FR organisations (EUR million): Number of FR organisations in MSCA: 1 072 311.72 479 In detail, the
H2020 Key facts and figures (2014-2020) Number of FR researchers funded by MSCA: EU budget awarded to FR organisations (EUR million): Number of FR organisations in MSCA: 1 072 311.72 479 In detail, the
Increasing the fiscal sustainability of health care systems in the European Union to ensure access to high quality health services for all
 Increasing the fiscal sustainability of health care systems in the European Union to ensure access to high quality health services for all EPC Santander, 6 September 2013 Christoph Schwierz Sustainability
H Marie Skłodowska-Curie Actions (MSCA)
") H2020 Key facts and figures (2014-2020) Number of IE researchers funded by MSCA: EU budget awarded to IE organisations (EUR million): Number of IE organisations in MSCA: 253 116,04 116 In detail, the number
H2020 Key facts and figures (2014-2020) Number of IE researchers funded by MSCA: EU budget awarded to IE organisations (EUR million): Number of IE organisations in MSCA: 253 116,04 116 In detail, the number
Standard Eurobarometer 83 Spring 2015 THE EU BUDGET REPORT
 Standard Eurobarometer 83 Spring 2015 THE EU BUDGET REPORT Fieldwork: May 2015 This survey has been requested and co-ordinated by the European Commission, Directorate-General for Communication. http://ec.europa.eu/public_opinion/index_en.htm
In 2008 gross expenditure on social protection in EU-27 accounted for 26.4 % of GDP
 Population and social conditions Author: Antonella PUGLIA Statistics in focus 17/2011 In 2008 gross expenditure on social protection in EU-27 accounted for 26.4 % of GDP Social protection benefits are
H Marie Skłodowska-Curie Actions (MSCA)
") H2020 Key facts and figures (2014-2020) Number of BE researchers funded by MSCA: EU budget awarded to BE organisations (EUR million): Number of BE organisations in MSCA: 274 161,04 227 In detail, the number
H2020 Key facts and figures (2014-2020) Number of BE researchers funded by MSCA: EU budget awarded to BE organisations (EUR million): Number of BE organisations in MSCA: 274 161,04 227 In detail, the number
FIRST REPORT COSTS AND PAST PERFORMANCE
 FIRST REPORT COSTS AND PAST PERFORMANCE DECEMBER 2018 https://eiopa.europa.eu/ PDF ISBN 978-92-9473-131-9 ISSN 2599-8862 doi: 10.2854/480813 EI-AM-18-001-EN-N EIOPA, 2018 Reproduction is authorised provided
STAT/14/64 23 April 2014
 STAT/14/64 23 April 2014 Provision of deficit and debt data for 2013 - first notification Euro area and EU28 government deficit at 3.0% and 3.3% of GDP respectively Government debt at 92.6% and 87.1% In
Library statistical spotlight
 /9/2 Library of the European Parliament 6 4 2 This document aims to provide a picture of the, in particular by looking at car production trends since 2, at the number of enterprises and the turnover they
Croatian Science and Technology System
 Croatian Science and Technology System Tome Antičić, Ph.D. Ministry of Science and Education 1 Strategic documents In 2014 the Croatian parliament adopted the Strategy of Education, Science and Technology
H Marie Sklodowska-Curie Actions (MSCA)
") H2020 Key facts and figures (2014-2020) Number of FR researchers funded by MSCA: EU budget awarded to FR organisations (EUR million): Number of FR organisations in MSCA: 565 198.92 370 In detail, the number
H2020 Key facts and figures (2014-2020) Number of FR researchers funded by MSCA: EU budget awarded to FR organisations (EUR million): Number of FR organisations in MSCA: 565 198.92 370 In detail, the number
Flash Eurobarometer 408 EUROPEAN YOUTH REPORT
 Flash Eurobarometer EUROPEAN YOUTH REPORT Fieldwork: December 2014 Publication: April 2015 This survey has been requested by the European Commission, Directorate-General for Education and Culture and co-ordinated
budgetary implementation
 Analysis of the budgetary implementation of the European Structural and Investment Funds in 2016 May 2017 Budget Europe Direct is a service to help you find answers to your questions about the European
REPORT FROM THE COMMISSION TO THE EUROPEAN PARLIAMENT, THE COUNCIL, THE EUROPEAN ECONOMIC AND SOCIAL COMMITTEE AND THE COMMITTEE OF THE REGIONS
 EUROPEAN COMMISSION Brussels,.4.29 COM(28) 86 final/ 2 ANNEXES to 3 ANNEX to the REPORT FROM THE COMMISSION TO THE EUROPEAN PARLIAMENT, THE COUNCIL, THE EUROPEAN ECONOMIC AND SOCIAL COMMITTEE AND THE COMMITTEE
H Marie Skłodowska-Curie Actions (MSCA)
") H2020 Key facts and figures (2014-2020) Number of FI researchers funded by MSCA: EU budget awarded to FI organisations (EUR million): Number of FI organisations in MSCA: 155 47.93 89 In detail, the number
H2020 Key facts and figures (2014-2020) Number of FI researchers funded by MSCA: EU budget awarded to FI organisations (EUR million): Number of FI organisations in MSCA: 155 47.93 89 In detail, the number
December 2010 Euro area annual inflation up to 2.2% EU up to 2.6%
 STAT/11/9 14 January 2011 December 2010 Euro area annual inflation up to 2.2% EU up to 2.6% Euro area 1 annual inflation was 2.2% in December 2010 2, up from 1.9% in November. A year earlier the rate was
Investing inregions and cities: EU Cohesion Policy Cohesion policy
 Investing inregions and cities: EU Cohesion Policy 2014-2020 Cohesion policy The European Union is diverse GDP/capita 2 The European Union is diverse Unemployment 3 The European Union is diverse Third-level
Note to ERAC Delegates
 EUROPEAN COMMISSION DIRECTORATE-GENERAL FOR RESEARCH & INNOVATION Directorate A - Policy Development and Coordition Head of Unit A.2 - Programming and interinstitutiol relations Ref. Ares(214)275666-5/2/214
H Marie Skłodowska-Curie Actions (MSCA)
") H2020 Key facts and figures (2014-2020) Number of SE researchers funded by MSCA: EU budget awarded to SE organisations (EUR million): Number of SE organisations in MSCA: 138 114.71 150 In detail, the number
H2020 Key facts and figures (2014-2020) Number of SE researchers funded by MSCA: EU budget awarded to SE organisations (EUR million): Number of SE organisations in MSCA: 138 114.71 150 In detail, the number
Overview of Eurofound surveys
 Overview of Eurofound surveys Dublin 21 st October 2010 Maija Lyly-Yrjänäinen Eurofound data European Working Conditions Survey 91, 95, 00, 05, 10 European Quality of Life Survey 03, 07, 09, 10 (EB), 11
May 2009 Euro area annual inflation down to 0.0% EU down to 0.7%
 STAT/09/88 16 June 2009 May 2009 Euro area annual inflation down to 0.0% EU down to 0.7% Euro area 1 annual inflation was 0.0% in May 2009 2, down from 0.6% in April. A year earlier the rate was 3.7%.
H Marie Skłodowska-Curie Actions (MSCA)
") H2020 Key facts and figures (2014-2020) Number of AT researchers funded by MSCA: EU budget awarded to AT organisations (EUR million): Number of AT organisations in MSCA: 215 78.57 140 In detail, the number
H2020 Key facts and figures (2014-2020) Number of AT researchers funded by MSCA: EU budget awarded to AT organisations (EUR million): Number of AT organisations in MSCA: 215 78.57 140 In detail, the number
H Marie Skłodowska-Curie Actions (MSCA)
") H2020 Key facts and figures (2014-2020) Number of LV researchers funded by MSCA: EU budget awarded to LV organisations (EUR million): Number of LV organisations in MSCA: 35 3.91 11 In detail, the number
H2020 Key facts and figures (2014-2020) Number of LV researchers funded by MSCA: EU budget awarded to LV organisations (EUR million): Number of LV organisations in MSCA: 35 3.91 11 In detail, the number
In 2009 a 6.5 % rise in per capita social protection expenditure matched a 6.1 % drop in EU-27 GDP
 Population and social conditions Authors: Giuseppe MOSSUTI, Gemma ASERO Statistics in focus 14/2012 In 2009 a 6.5 % rise in per capita social protection expenditure matched a 6.1 % drop in EU-27 GDP Expenditure
EBA REPORT ON HIGH EARNERS
 EBA REPORT ON HIGH EARNERS DATA AS OF END 2017 LONDON - 11/03/2019 1 Data on high earners List of figures 3 Executive summary 4 1. Data on high earners 6 1.1 Background 6 1.2 Data collected on high earners
Investing in regions: The reformed EU Cohesion Policy
 Investing in regions: The reformed EU Cohesion Policy 2014-2020 Presentation by David Müller, Member of cabinet For Alpeuregio summer school Cohesion policy Basics on EU Cohesion Policy Cohesion policy
No work in sight? The role of governments and social partners in fostering labour market inclusion of young people
 No work in sight? The role of governments and social partners in fostering labour market inclusion of young people Joint seminar of the European Parliament and EU agencies 30 June 2011 1. Young workers
H Marie Skłodowska-Curie Actions (MSCA)
") H2020 Key facts and figures (2014-2020) Number of PT researchers funded by MSCA: EU budget awarded to PT organisations (EUR million): Number of PT organisations in MSCA: 592 54.79 135 In detail, the number
H2020 Key facts and figures (2014-2020) Number of PT researchers funded by MSCA: EU budget awarded to PT organisations (EUR million): Number of PT organisations in MSCA: 592 54.79 135 In detail, the number
Flash Eurobarometer 470. Report. Work-life balance
 Work-life balance Survey requested by the European Commission, Directorate-General for Justice and Consumers and co-ordinated by the Directorate-General for Communication This document does not represent
WELCOME TO THE EUROPEAN PARLIAMENT! Directorate General for Communication, Visits and Seminars Unit
 WELCOME TO THE EUROPEAN PARLIAMENT! jan.rebrina@ep.europa.eu Directorate General for Communication, Visits and Seminars Unit WORKING PLACES 2 EU OBJECTIVES 3 Peace Stability Sustainability Freedom and
The economic and budgetary consequences of ageing populations
 The economic and budgetary consequences of ageing populations Henri Bogaert Bureau du Plan and Chairman of the Ageing Working Group Giuseppe Carone European Commission DG ECFIN Rome, 23 February 2007 Outline
The Future of CAP: Community led local development based on Leader approach
 The Future of CAP: Community led local development based on Leader approach Mihail Dumitru, Director E European Commission DG Agriculture and Rural development Raise the stake" conference, Siret, Romania
The Trend Reversal of the Private Credit Market in the EU
 The Trend Reversal of the Private Credit Market in the EU Key Findings of the ECRI Statistical Package 2016 Roberto Musmeci*, September 2016 The ECRI Statistical Package 2016, Lending to Households and
Macroeconomic Policies in Europe: Quo Vadis A Comment
 Macroeconomic Policies in Europe: Quo Vadis A Comment February 12, 2016 Helene Schuberth Outline Staff Projection of the Euro Area Monetary Policy Investment Rebalancing in the euro area Fiscal Policy
EUROSTAT SUPPLEMENTARY TABLE FOR REPORTING GOVERNMENT INTERVENTIONS TO SUPPORT FINANCIAL INSTITUTIONS
 EUROPEAN COMMISSION EUROSTAT Directorate D: Government Finance Statistics (GFS) and Quality Unit D1: Excessive deficit procedure and methodology Unit D2: Excessive deficit procedure (EDP) 1 Unit D3: Excessive
COMMISSION IMPLEMENTING DECISION
 L 338/70 Official Journal of the European Union 17.12.2013 DECISIONS COMMISSION IMPLEMENTING DECISION of 9 December 2013 on an additional financial towards Member States fisheries control programmes for
Transition from Work to Retirement in EU25
 EUROPEAN CENTRE EUROPÄISCHES ZENTRUM CENTRE EUROPÉEN 1 Asghar Zaidi is Director Research at the European Centre for Social Welfare Policy and Research, Vienna; Michael Fuchs is Researcher at the European