Title: Update: 2018 Third Quarter Financial Review, Period Ending September 30, 2018
|
|
|
- Shanon May
- 5 years ago
- Views:
Transcription
1 To: From: Honorable Mayor and Members of Town Council Trish Muller, Finance Director Title: Update:, Period Ending September 30, 2018 Executive Summary This Third Quarter Financial Review is presented in a new format which endeavors to communicate a financial update for the Town of Castle Rock in a comprehensive and engaging presentation. Additional financial information can be found at CRGov.com/transparency. The Town has accomplished significant progress toward community priorities as identified within the 2018 Budget through the third quarter of the year. The following discussion and financial information reflects the positive financial condition of the Town and highlights the continued focus on strategic priorities established by Council. Financial reporting for the Town takes a team effort between Finance, Managers and staff. Reporting helps to keep departments apprised of potential revenue shortages that could trigger spending reductions and deferrals. As demonstrated by the following information, departments continue effective and responsible management of the Town s finances while working towards accomplishing community priorities. The overall financial position of the Town remains positive with all funds currently estimated to end the year under expense budgets. Town staff will continue to monitor the items below throughout the last quarter of the year. Sales Tax: Revenue remains consistent with previous estimates of 4.5% growth over 2017 at this time Development Revenue: Revenue remains strong and yearend estimates have been revised to reflect permitting numbers totaling 990 single family and 372 multifamily units Employee Benefits: Medical and prescription claim costs are trending higher than in previous years Capital Projects: The timing of capital projects is being monitored by the Finance department for yearend status and carryforward to 2019 This serves as a snapshot of the Town s third quarter s financial activity in comparison to the seasonally adjusted 2018 amended budget. Note that the year to date budget represented in this report has been adjusted to reflect seasonal trends within funds in order to provide a more accurate reflection of Town financial trends through the third quarter of the year.
2 The financial information as of the third quarter of 2018 in this report includes: Highlights of yeartodate revenue and expenditures including financial summaries by major category for each Town fund Status updates related to community priorities Sales tax revenue reporting Town of Castle Rock investment summary information Budget Amendment items approved by council on October 16th Proposed Motion This memo is intended for discussion purposes only. Attachments Attachment A: 2018 Third Quarter Financial Information by Fund Schedule A General Fund Schedule B Development Services Fund Schedule C Water Fund Schedule D Water Resources Fund Schedule E Stormwater Fund Schedule F Wastewater Fund Schedule G Transportation Fund Schedule H Transportation Capital Projects Fund Schedule I Fleet Services Fund Schedule J Fire Capital Fund Schedule K Police Capital Fund Schedule L Police Forfeiture Fund Schedule M Parks and Recreation Capital Fund Schedule N Conservation Trust Fund Schedule O Community Center Fund Schedule P Golf Course Fund Schedule Q Economic Development Fund Schedule R Downtown Development TIF Fund Schedule S Philip S. Miller Trust Fund Schedule T Special Events Fund Schedule U Public Art Fund Schedule V Municipal Facilities Capital Fund Schedule W General Long Term Planning Fund Schedule X Employee Benefits Fund Schedule Y Townwide Summary Attachment B: Third Quarter Sales Tax Collections by and Geographical Area Attachment C: Investment Summary


3 Period Ending September 30, 2018 Financial Reporting Town of Castle Rock financial management and reporting involves numerous complexities and requires the effort of Townwide departments and staff. This quarterly financial review includes fund balance, revenue, expenditure, and reserve information by fund as well as on a Townwide perspective. The Town s budget includes 24 different funds with a variety of revenue sources, of which, some have restrictions for how the funds can be spent. The Town s revenue sources, and their respective uses, is represented below for reference. The following pages provide a summary of the Town s financial performance at this point in the year categorized as shown below, detailed financial schedules in Attachment A, Sales Tax collections by category and geographic area in Attachment B, and the Town s investment summary in Attachment C. What sources generate funds? Sales tax overview Townwide revenue summary How is the Town focusing resources on priorities? Ensuring our Water Future Enhancing our Transportation Ensuring our Public Safety Maintaining strong Parks and Recreation How is the Town growing? Development related revenue Development services department overview How does the Town manage finances conservatively? Financial Monitoring Future Planning TABOR Transparency 1

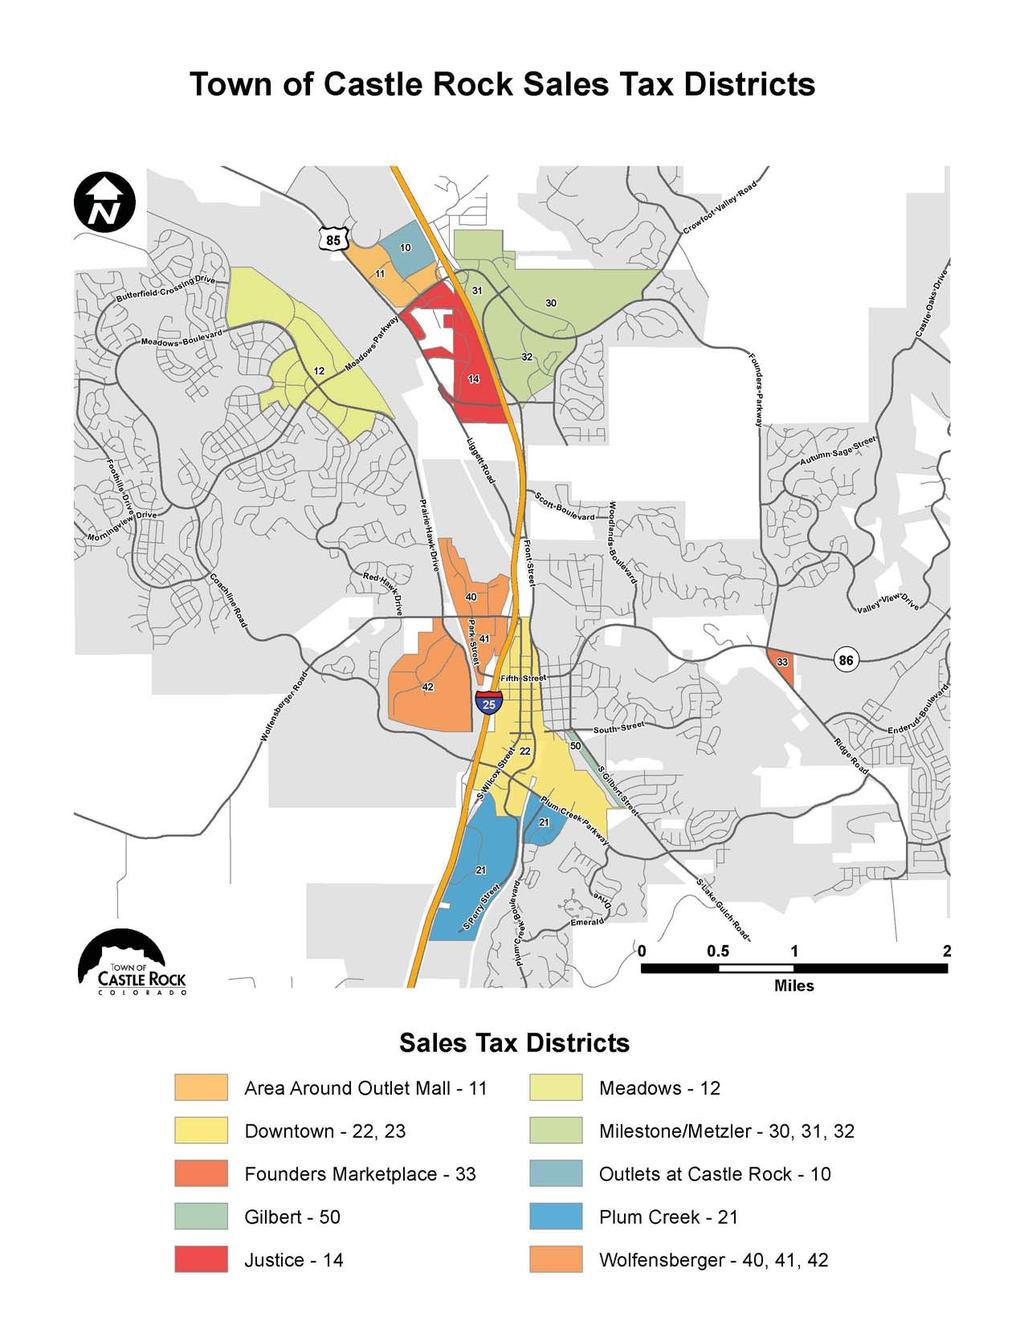
4 Period Ending September 30, 2018 What sources generate funds? Sales and property tax Gross sales tax collections are 5.4 percent greater than JanuaryAugust 2017, with September estimated at 4.5 percent greater Sales tax revenue in 2018 is projected to be 4.5 percent over 2017 totals The top three areas for sales tax are Milestone/Metzler, Outlet Mall, and Promenade, making up 55 percent of sales tax collections There are 4,600 active business licenses at this time, 50 percent of which are located in Castle Rock Property tax collections for 2018 reflect a mill levy assessment of 1.330, reduced from the 2017 mill due to a growth limitation of 5.5 percent in property tax revenue from the prior year as required by Town Charter More detailed financial information, including the Town s various revenue sources, can be found in the schedules in Attachment A. Townwide revenue Tax revenues including sales, property, use, motor vehicle, and other taxes, make up 34 percent of the Townwide budget, with sales tax making 75 percent of the total tax revenue. However, several other revenue sources support Town services. As of September 30, 2018, Townwide revenues are at 76 percent of the annual budgeted amount. The information below identifies types of revenue received by the Town, and the percentage of budget that has been collected at this point in the year. 2

5 Period Ending September 30, 2018 How is the Town growing? The 2018 Budget for developmentrelated revenue is based on 700 single family permits and 634 multifamily units. Actual development revenue received by fund varies based on size, type, value, and water needs of the specific project. The expected number of single family, multifamily, commercial, and other development permits issued determine budget amounts for growth related revenues such as impact fees, building use tax and (water) tap fees. Impact fees, system development fees, and use tax collections are at roughly 90 percent of the amended budget for The Finance closely monitors development related revenues and is estimating 990 single family and 372 multifamily units to be permitted in earned from development in Castle Rock are used to help fund growth related projects across the Town. Building use tax is levied at 4 percent on materials used in construction and is received into the Transportation, Transportation Capital, General Long Term Planning, and Community Center Funds. Impact fees and system development fees are charged as part of the building permit process and fund needs related to growth including Municipal Facilities, Parks and Recreation, Fire, Police, Transportation, and Castle Rock Water. As identified in this chart, these revenue sources are trending well through the third quarter these revenues combined are at 90 percent of the annual budget at this point in the year. Based on updated projections, development related revenues are expected to finish the year over budget by 17 percent. The Development Services oversees development in Castle Rock. This department is funded partially in the General Fund, which has utilized 68 percent of the annual budget at this point in the year and is estimated to be under budget by about 3 percent at the end of The Development Services enterprise fund is projected to be 11 percent under budget for the year due to personnel savings and has utilized only 63 percent of the annual expenditure budget as of September 30, 2018 as shown in the following information. 3


6 How is the Town focusing resources on priorities in the third quarter? Ensuring our water future Period Ending September 30, 2018 Castle Rock Water is comprised of four enterprise funds Water, Water Resources, Stormwater, and Wastewater. Existing and new users alike support these funds. in these funds tend to be seasonal and are highly variable based temperature and precipitation levels throughout the year. in these funds include operational costs and significant capital projects to accommodate needs in our growing community. Capital expenditures make up 70 percent of the total Castle Rock Water expenditure budget, of which 22,073,679 has been expended for Estimates indicate that capital expenditures will be 49 percent under budget, with most of the unspent funds planned to carry forward to Significant projects for Castle Rock Water in 2018 include: Installation of a pipeline and pump station from the diversion structure the Town purchased on Plum Creek in 2017 Advanced water treatment capability at the Plum Creek Water Purification Facility Continued funding for the Chatfield Reallocation project Ongoing renewable water initiatives as part of the WISE project Redrilling of two wells in the Plum Creek neighborhood Continued work on stream and tributary stabilizations at McMurdo Gulch, Hangmans Gulch, and Douglas Lane tributary Construction of two additional wells at the Lanterns development and in the Castlewood Ranch neighborhood Total revenues for Castle Rock Water Funds combined are about 10 percent over budget through September, and operating expenditures are tracking 21 percent under the year to date budget. Currently, each of the water funds is considered to be on track for the year and are expected to be under budget by the end of the year. To see more detailed financial information about Castle Rock Water, please see Schedules CF in Attachment A. 4
. The Transportation Fund supplements the capital fund to support the construction of growthrelated projects as appropriate and available.")

7 Period Ending September 30, 2018 Enhancing our transportation The Public Works manages Castle Rock transportation services, with budgeted expenditures in the Transportation (operational costs) and Transportation Capital funds (onetime projects). The Transportation Fund supplements the capital fund to support the construction of growthrelated projects as appropriate and available. Transportation expenditures tend to be seasonal, related to construction seasons, for both maintenance and new construction. The timing of weather events affect snowplowing operations. Through the third quarter, total expenditures include 16 million in Transportation Fund costs and 2.1 million in onetime capital costs and debt within the Transportation Capital Fund. Actual expenditures for the Transportation Fund are 60 percent of the annual budget at this point in the year and 11 percent within the Transportation Capital fund budget. Current yearend estimates indicate that the Transportation Fund will be under budget by about 9 percent. The Transportation Capital Fund is estimated to end the year about 43 percent under budget, with significant capital projects planned to be carried forward to Significant progress to date includes: Construction of a roundabout at Plum Creek Parkway and Wolfensberger Road is planned to be complete by the end of the year Design of improvements at Founders Parkway and Allen Way, with construction funding planned to be carried forward to 2019 Design of improvements at Founders Parkway and Crowfoot Valley Road, with construction funding planned to be carried forward to 2019 Pavement maintenance in The Meadows area of Castle Rock including reconstructions Transportation Fund revenues include sales tax, Highway User Tax Fund (HUTF), use tax, and other resources. Total Transportation Fund revenues are expected to be over budget by 8 percent by the end of the year due to additional HUTF revenue related to a recent state bill dedicating funding to transportation infrastructure projects. Transportation Capital fund revenue, including impact fees for onetime capital expenditures is 55 percent to budget and is estimated to be under budget by 15 percent due to project contributions for Founders/Allen and Founders/Crowfoot intersections. See schedules G and H in Attachment A for more detailed financial information for transportation. Did you know The Public Works also manages the Town s Fleet Fund. That fund maintains 390 vehicles and pieces of equipment. Staff evaluates and monitors vehicles to determine optimal replacement schedules. In 2018, a total of 5 new vehicles and 23 replacement vehicles are planned to be purchased. As of September 30, the Fleet Fund has expended 85 percent of budgeted funds and is expected to be under budget by 7 percent at yearend. Savings are attributed to lower than anticipated vehicle costs. Transfers into the Fleet Fund from other funds make up the majority of revenue. To see more detailed information about the Fleet Fund, see Schedule I of Attachment A. 5


8 Period Ending September 30, 2018 Ensuring our public safety Police and Fire and Rescue services operate out of the General Fund. Growthrelated expenses are included in the Fire and Police Capital Funds while Police Forfeiture funding is used for special projects when revenue is received. Charts on this page represent the public safety operations at this point in the year. Public safety operations Fire Station 152 serving southern Castle Rock, including Crystal Valley, opened in August 2018: Twelve new personnel hired Equipment purchased to get up and running such as uniforms, fire engines, breathing apparatuses, bunker gear, and search and rescue gear General Fund Fire and Rescue expenditures are currently at 69 percent of the annual budget at this point in the year and will likely finish about 5 percent under budget by the yearend. Castle Rock Police added five new positions as approved in the 2018 budget including: Two Dispatchers Special Ops Sergeant Community Service Officer Public Information Officer Operating costs for the Police in the General Fund are at 76 percent of the annual budget as of September and are expected to finish the year at the annual budget amount. Looking forward Capital expenditures vary throughout the year based on project timing. Impact fee revenue received from new development in Castle Rock funds these projects. Town staff considers the Police and Fire funds on target at this point in the year and estimates the Police Capital Fund to end the year at the annual expenditure budget and the Fire Capital Fund to end the year about 9 percent under budget due to Station 152 construction savings. Police and Fire Capital Fund projects in 2018 include: Construction of Fire Station 152 Renovation of the south building at the Public Safety Training Campus Interfund loan payments related to previous building projects The Police receives forfeiture related revenue from participation in cooperative efforts with state and federal law enforcement. There are no budgeted revenues or expenditures planned for Learn more about public safety financial performance, and view the detailed financial schedules as of September 30, 2018, in Attachment A Schedules A, J, K, and L. 6
, Recreation Center, outdoor pools, and special events. Budgets for these areas are included in multiple funds.")


9 Period Ending September 30, 2018 Maintaining strong parks and recreation Castle Rock Parks and Recreation oversees Town open space, developed parks, Red Hawk Ridge Golf Course, Miller Activity Complex (MAC), Recreation Center, outdoor pools, and special events. Budgets for these areas are included in multiple funds. Sales tax, user fees, statewide lottery distributions, Douglas County share back funds and grants, as available and awarded, support Parks and Recreation. Detailed financial information for Parks and Recreation can be found in Attachment A Schedules A and M P. Parks operations The General Fund includes ongoing parks maintenance and operations with total 2018 funding of 7,017,810. This area is under budget by 6 percent at this point in the year, and staff expects it to remain under by 26 percent at the end of the year due to timing of the onetime completion of a 2mile extension of the East Plum Creek Trail. A 1 million grant from Great Outdoors Colorado supports this project, with remaining resources provided by approved sales tax funding for trail improvements. Parks projects Recreation The Community Center Fund accounts for operations at the Recreation Center, MAC and outdoor pools. Visits to the Recreation Center yeartodate total 187,837, a decrease of 17 percent compared to last year, while MAC visits total 84,218, or 1 percent lower than last year. Total expenditures todate are 78 percent of the annual budget and are estimated to be slightly under budget for the year. Planned improvements at various facilities in 2018 include: Parks and Recreation also utilizes Conservation Trust and Parks and Recreation Capital funds for projects. The capital fund can only be used for growthrelated projects, including the planned construction of a new neighborhood park in The Meadows in Based on the timing of this project and debt service payments, the capital fund has only utilized 28 percent of the 6,063,850 budget for the year. The Conservation Trust Fund, supported by state lottery proceeds, has used 80 percent of the 940,054 budget including a contribution of 600,000 to the neighborhood park in The Meadows. The Conservation Trust Fund is projected to be under budget by 3 percent for the year, while the Parks and Recreation Capital Fund is expected to be about 26 percent under budget due to actual timing of planned projects. Resurfacing the Leisure Pool at the Recreation Center HVAC maintenance, replacing windows with broken seals, and painting the gym ceiling and walls at the Recreation Center Replacement of the boiler at Butterfield Crossing Pool Planning for a new boarding system on the small indoor field at the MAC Golf The golf course enterprise fund is about 3 percent over budget for the year. Strong revenues prevail, with 33,796 rounds played through September, an increase of 7 percent over last year. User fees highly seasonal based on weather conditions throughout the year support this fund entirely. Staff projects the Golf Fund to surpass the revenue budget by 5 percent and remain under budgeted expenditures by 2 percent at the end of the year. 7


: Arapahoe Community College Collaboration Campus Murdoch s incentive agreement Dorsey Pictures")
10 Period Ending September 30, 2018 Other Town funds and initiatives In addition to the specific priorities shown previously, the Town manages other funds that help support economic development, community character, longterm municipal facility funding, and employee benefits. These funds support Town Council direction and responsible longterm Town management. Supporting economic development The Town uses the Economic Development Fund, supported by commercial building use tax to focus on priorities of creating primary employment jobs, expanding the tax base, and maintaining an outstanding business climate. In addition, taxincrement funds from Downtown Castle Rock fund the Downtown Development Authority Tax Increment Financing (DDA TIF) Fund used to support improvements Downtown. Initiatives funded by these areas include: Economic Development Fund (Attachment A Schedule Q): Arapahoe Community College Collaboration Campus Murdoch s incentive agreement Dorsey Pictures employment incentive agreement SRP Companies employment incentive agreement DDA TIF Fund (Attachment A Schedule R): Riverwalk North and South development incentives Redesign of Festival Park, completed in 2018 Community character Funding from the Philip S. Miller Trust, received into the Philip S. Miller Trust (Attachment A Schedule S) and the Public Art (Attachment A Schedule U) funds, supports and maintains Castle Rock s character. Philip S. Miller Trust funds support special events managed by Parks and Recreation, provide nonprofit grant funding, produce annual fireworks displays at Independence Day and Starlighting events, and fund the service contracts with the Castle Rock Museum and Senior Center. The Town utilizes the Public Art Fund for the annual Art Encounters program that leases new artwork on an annual basis for display around the community as well as for purchasing artwork when appropriate. Town facility and employee support An important part of ongoing Town management consists of supporting Town facilities and employees. As the Town grows, the need for facility space grows. The Municipal Facilities Capital Fund uses impact fee revenue received from new development to support facility growth. The General Long Term Planning Fund helps keep up with facility and asset maintenance. Projects in that fund this year include replacement of artificial turf at Metzler Park, replacement of the Town s telephone system, and updates to Town Hall. Both funds are on track. Find detailed financial information about the Municipal Facilities Capital Fund in Attachment A Schedule V and about the General Long Term Planning Fund in Attachment A Schedule W. The Employee Benefits Fund serves to administer the Town s medical, dental and vision health benefit plans including employee contributions, premium, and claim costs and the employee wellness program, all in support of more than 500 benefited employees. Medical and prescription claim activity in 2018 is trending higher than budget, and staff continues to monitor actual fund activity. Estimates place this fund slightly under budget at the end of the year. For more financial information about this fund, see Attachment A Schedule X. 8

11 Period Ending September 30, 2018 How does the Town manage finances conservatively? The Town continually works to manage Town finances conservatively and ensure that taxpayer funds are prudently expended in support of Town priorities. This multifaceted effort includes: Ongoing monitoring of revenues and expenditures Future budgeting and longterm planning Taxpayer Bill of Rights (TABOR) assessment Financial transparency Financial monitoring In addition to this quarterly report, Finance staff: Reviews lineitem financial information each month Analyzes performance compared to budget Reconciles Town accounts monthly Performs periodic audits to ensure accuracy and appropriate use of Town funds Future planning and investments Longterm financial planning is incorporated into Town decisionmaking and included in the Town s budget process. Each year, the Town adopts a oneyear budget and approves a threeyear balanced financial plan and fiveyear capital improvement program. The longerterm plans guide future decisionmaking and are based on projected available resources. The Town s investment earnings through the third quarter of 2018 are 1.8 million which is less than a percent of the Town s total investment balance of 197 million. The majority of investments coming from Local Government Investment Pools (38 percent) and U.S. Agencies (24 percent). Information about the Town s investments can be found in Attachment C. The 2019 Budget was approved on Sept. 18, 2018, and is available at CRgov.com/2019Budget. TABOR Revenue collections are monitored throughout the year and compared with TABOR revenue limits. In 2016, Town Council directed staff to manage revenues to stay within the limit to the extent possible. Based on 2018 projections, the Town does not anticipate a TABOR surplus. Actual revenues will determine the Town s final TABOR position. Final TABOR calculations are performed after completion of the Town s annual audit. Did you know The Taxpayers Bill of Rights (TABOR), Amendment X of the Colorado Constitution, restricts the Town s revenue collection. Amendment X specifically and significantly addresses the following issues: 1) imposes revenue limits, 2) requires elections for tax changes and increases or new bonded debt, 3) requires emergency reserves, and 4) prohibits multiple fiscal year financial obligations. Transparency The Town s financial information is available for review on the Town s Transparency Portal (CRgov.com/transparency). The Financial Information section includes: Annual budgets, including previous years Pay table information Financial reporting Unclaimed property Check and vendor listings Staledated checks For questions about Town financial information, please contact finance@crgov.com 9
12 Schedule A Fund: General Fund Summary : All LY Actual CY Budget CY Actual YTD Budget YTD ActYE Estimate Ann Est to B Annual Actual Budget 2018 Budget* Budget Estimates Budget LY Actual CY Budget CY Actual Taxes 36,338,103 38,878,577 28,130,635 27,790, ,738 38,086,883 (791,694) Property 1,134,063 1,208,703 1,195, , ,889 1,194,973 (13,730) Sales 31,051,731 33,063,514 24,071,763 23,880, ,702 32,339,262 (724,252) Motor Vehicle 3,803,645 4,254,975 2,610,625 3,191,231 (580,606) 4,184,390 (70,585) Other 348, , , ,539 (11,247) 368,258 16,873 Franchise Fees 2,323,993 2,442,480 1,785,076 1,831,860 (46,784) 2,465,099 22,619 Licenses & Permits 114, ,117 57,166 79,588 (22,422) 97,550 (8,567) Intergovernmental 394,184 1,355, , ,559 (116,221) 350,416 (1,005,141) Charges for Service 2,460,155 2,681,466 1,931,252 2,011,100 (79,848) 2,493,425 (188,041) Management Fees 3,274,465 3,519,368 2,639,526 2,639,526 3,519,368 Fines & Forfeitures 399, , , ,455 (123,219) 352,970 (195,636) Investment Earnings 153, , ,766 75,954 93, ,272 Contributions & Donations 164,500 29,500 16,400 16,400 30, Transfers In 1,025, , ,250 Interfund Loan Revenue 381,186 1,191,969 55,700 55, ,896 (212,073) Other Revenue 306, , , ,918 (17,941) 311,035 (16,212) Total 47,336,512 47,336,515 51,733,409 51,733,409 35,503,072 35,248,353 35,475,957 27,115 49,339,164 (2,394,245)
13 Schedule A Fund: General Fund Summary : All LY Actual CY Budget CY Actual YTD Budget YTD ActYE Estimate Ann Est to B Annual Actual Budget 2018 Budget* Budget Estimates Budget Town Council 711, , , ,495 59, ,393 56,856 Town Manager 540, , , ,690 46, ,234 33,259 Deputy Town Manager 306, , , ,316 8, ,540 8,336 Human Resources 865, , , ,790 53, ,245 83,897 Community Relations 716, , , ,451 (1,597) 830,683 56,282 DoIT 2,808,214 3,905,200 2,803,091 2,967, ,471 3,746, ,794 Facilities 1,253,389 1,460, ,734 1,110, ,579 1,288, ,018 Town Attorney 643, , , , , ,598 44,272 Town Clerk 299, , , ,058 36, ,903 (23,574) Municipal Court 355, , , ,461 60, ,070 30,169 Finance 2,237,575 2,759,211 2,003,341 2,176, ,590 2,633, ,920 Police 12,876,383 14,148,544 10,751,459 10,881, ,453 14,137,640 10,904 Fire & Rescue 13,760,569 16,143,790 11,142,280 12,113, ,475 15,308, ,262 Development Services 542, , , ,436 50, ,077 16,084 Parks & Recreation 4,284,488 7,017,810 3,349,286 3,567, ,622 5,177,601 1,840,209 Nonal 4,621,195 3,564, ,411 1,748, ,006 3,498,508 66,048 Downtown Projects 67,066 16,216 12,162 12,162 16,216 Total 46,890,797 46,890,800 53,378,714 54,482,021 35,693,942 38,786,190 3,092,248 50,967,285 3,514,736 Net / 445,715 (2,748,612) (190,870) (3,310,233) 3,119,363 (1,628,121) 1,120,491 Beginning Funds Available 18,362,061 18,807,776 18,807,776 18,807,776 18,807,776 Ending Funds Available 18,807,776 16,059,164 18,616,906 15,497,543 3,119,363 17,179,655 Less Reserves & Designations: 42,846,622 Contractual Reserve 300, ,000 Revenue Stabilization Reserve 1,891,626 1,891,626 Catastrophic Events Reserve 1,050,000 1,050,000 Capital Reserve 2,141,754 2,141,754 Opportunity/Economic Development Reserve 1,210,000 1,210,000 TABOR Reserve 1,981,611 1,981,611 Projected Ending Funds Available 18,807,776 7,484,173 8,604,664
14 Schedule A Fund: General Fund : All LY Actual CY Budget CY Actual YTD Budget YTD ActYE Estimate Ann Est to B Annual Actual Budget 2018 Budget* Budget Estimates Budget Taxes 36,338,103 38,878,577 28,130,635 27,790, ,738 38,086,883 (791,694) Property 1,134,063 1,208,703 1,195, , ,889 1,194,973 (13,730) Sales 31,051,731 33,063,514 24,071,763 23,880, ,702 32,339,262 (724,252) Motor Vehicle 3,803,645 4,254,975 2,610,625 3,191,231 (580,606) 4,184,390 (70,585) Other 348, , , ,539 (11,247) 368,258 16,873 Franchise Fees 2,323,993 2,442,480 1,785,076 1,831,860 (46,784) 2,465,099 22,619 Licenses & Permits 114, ,117 57,166 79,588 (22,422) 97,550 (8,567) Intergovernmental 394,184 1,355, , ,559 (116,221) 350,416 (1,005,141) Charges for Service 2,460,155 2,681,466 1,931,252 2,011,100 (79,848) 2,493,425 (188,041) Management Fees 3,274,465 3,519,368 2,639,526 2,639,526 3,519,368 Fines & Forfeitures 399, , , ,455 (123,219) 352,970 (195,636) Investment Earnings 153, , ,766 75,954 93, ,272 Contributions & Donations 164,500 29,500 16,400 16,400 30, Transfers In 1,025, , ,250 Interfund Loan Revenue 381,186 1,191,969 55,700 55, ,896 (212,073) Other Revenue 306, , , ,918 (17,941) 311,035 (16,212) Total 47,336,512 51,733,409 35,503,072 35,475,957 27,115 49,339,164 (2,394,245) (1) (1) Revenue is estimated to be under budget due to actual sales tax trending, lower than budget Fines and Forfeitures revenue, and timing of when grant proceeds will be received Town Council Personnel 67,333 67,995 51,128 52,304 1,176 68,023 (28) Services & Other 642, , , ,804 55, ,254 55,818 Supplies 1,608 3, ,387 2,000 2,116 1,066 Subtotal Town Council 711, , , ,495 59, ,393 56,856 Town Manager Personnel 444, , , ,791 (394) 519,901 (22,273) Services & Other 93,048 77,013 15,827 57,760 41,933 27,653 49,360 Supplies 3,088 10,852 2,900 8,139 5,239 4,680 6,172 Subtotal Town Manager 540, , , ,690 46, ,234 33,259 Deputy Town Manager Personnel 300, , , ,385 2, ,890 1,411 Services & Other 4,696 17,303 7,221 12,977 5,756 10,533 6,770 Supplies 532 1,272 1, (77) 1, Subtotal Deputy Town Manager 306, , , ,316 8, ,540 8,336
15 Fund: General Fund : All Schedule A LY Actual CY Budget CY Actual YTD Budget YTD ActYE Estimate Ann Est to B Annual Actual Budget 2018 Budget* Budget Estimates Budget Human Resources Personnel 459, , , ,372 (3,283) 484,268 (6,684) Services & Other 309, , , ,873 63, ,089 96,742 Supplies 96,478 4,727 10,395 3,545 (6,850) 10,888 (6,161) Subtotal Human Resources 865, , , ,790 53, ,245 83,897 Community Relations Personnel 388, , , ,044 (2,328) 385,984 15,773 Services & Other 313, , , ,196 4, ,960 (7,366) Supplies 14,319 13,614 13,729 10,211 (3,518) 15,739 (2,125) Capital 50,000 50,000 Subtotal Community Relations 716, , , ,451 (1,597) 830,683 56,282 DoIT Personnel 1,655,715 2,010,435 1,552,494 1,546,488 (6,006) 2,052,339 (41,904) Services & Other 543,050 1,158, , , ,832 1,006, ,938 Supplies 380, , , ,141 51, , ,361 Capital 224, , , ,000 14, ,601 (64,601) Transfers Out 4,170 25,824 19,368 19,368 25,824 Subtotal DoIT 2,808,214 3,905,200 2,803,091 2,967, ,471 3,746, ,794 Facilities Personnel 727, , , ,397 61, ,402 67,414 Services & Other 383, , , ,497 56, ,797 81,865 Supplies 94, ,376 53,131 75,282 22,151 77,637 22,739 Transfers Out 48,131 49,516 37,137 37,137 49,516 Subtotal Facilities 1,253,389 1,460, ,734 1,110, ,579 1,288, ,018 Town Attorney Personnel 534, , , ,210 67, ,697 42,076 Services & Other 104, ,325 57, ,994 57, ,831 17,494 Supplies 4,583 5,772 18,331 4,329 (14,002) 21,070 (15,298) Subtotal Town Attorney 643, , , , , ,598 44,272 Town Clerk Personnel 233, , , ,448 5, ,438 (255) Services & Other 64, ,136 75, ,852 33, ,152 (20,016) Supplies 2,242 1,010 3, (2,712) 4,313 (3,303) Subtotal Town Clerk 299, , , ,058 36, ,903 (23,574) (2) (3) Town Clerk is estimated over budget due to increased election costs. Other savings within the General Fund will be utilized to offset these expenses
16 Fund: General Fund : All Schedule A LY Actual CY Budget CY Actual YTD Budget YTD ActYE Estimate Ann Est to B Annual Actual Budget 2018 Budget* Budget Estimates Budget Municipal Court Personnel 319, , , ,269 24, ,182 23,468 Services & Other 23,883 57,057 6,353 42,793 36,440 48,902 8,155 Supplies 11,827 12,532 10,057 9,399 (658) 13,986 (1,454) Subtotal Municipal Court 355, , , ,461 60, ,070 30,169 Finance Personnel 1,822,230 2,066,707 1,549,631 1,589,775 40,144 2,075,453 (8,746) Services & Other 390, , , ,643 82, , ,424 Supplies 24, , , ,513 50, ,405 3,242 Subtotal Finance 2,237,575 2,759,211 2,003,341 2,176, ,590 2,633, ,920 Police Personnel 10,739,529 12,042,352 9,031,112 9,263, ,236 11,953,843 88,509 Services & Other 876, , , ,941 (97,113) 996,255 (154,894) Supplies 729, , , ,989 (4,670) 726,696 77,289 Capital 23,017 Debt & Financing 102,661 Transfers Out 405, , , , ,846 Subtotal Police 12,876,383 14,148,544 10,751,459 10,881, ,453 14,137,640 10,904 Fire & Rescue Personnel 10,226,284 12,346,776 8,783,419 9,497, ,101 11,705, ,512 Services & Other 1,091,407 1,428, ,715 1,071, ,859 1,114, ,379 Supplies 929, , , ,995 26, ,646 (103,319) Capital 332,209 91, ,311 68,250 (40,061) 108,310 (17,310) Debt & Financing 210,139 Transfers Out 971,362 1,411, , ,416 1,411,922 Subtotal Fire & Rescue 13,760,569 16,143,790 11,142,280 12,113, ,475 15,308, ,262 Development Services Personnel 468, , , ,589 17, ,068 14,298 Services & Other 35,380 68,574 22,018 51,431 29,413 69,354 (780) Supplies 5,671 8,096 2,369 6,072 3,703 5,530 2,566 Transfers Out 32,686 7,125 5,344 5,344 7,125 Subtotal Development Services 542, , , ,436 50, ,077 16,084
17 Fund: General Fund : All Schedule A LY Actual CY Budget CY Actual YTD Budget YTD ActYE Estimate Ann Est to B Annual Actual Budget 2018 Budget* Budget Estimates Budget Parks & Recreation Personnel 2,117,012 2,230,016 1,657,873 1,665,778 7,905 2,224,872 5,144 Services & Other 1,241,184 1,804,868 1,204,971 1,237,854 32,883 1,677, ,911 Supplies 378, , , ,537 9, ,088 6,611 Capital 309,111 2,360,708 59, , , ,696 1,702,012 Transfers Out 238, , , ,889 (469) 274,988 (469) Subtotal Parks & Recreation 4,284,488 7,017,810 3,349,286 3,567, ,622 5,177,601 1,840,209 Nonal Personnel (10) 95,573 (95,573) 95,572 (95,572) Services & Other 981, , , , , , ,955 Supplies 68, ,000 13, ,250 87, ,335 (11,335) Capital 497,574 2,289,000 58, , ,522 2,289,000 Transfers Out 3,073, , , ,500 37, ,000 Subtotal Nonal 4,621,195 3,564, ,411 1,748, ,006 3,498,508 66,048 Downtown Projects Capital 67,066 16,216 12,162 12,162 16,216 Subtotal Downtown Projects 67,066 16,216 12,162 12,162 16,216 Total 46,890,797 46,890,800 53,378,714 54,482,021 35,693,942 38,786,190 3,092,248 50,967,285 3,514,736 Net / 445,715 (2,748,612) (190,870) (3,310,233) 3,119,363 (1,628,121) 1,120,491 Beginning Funds Available 18,362,061 18,807,776 18,807,776 18,807,776 18,807,776 Ending Funds Available 18,807,776 16,059,164 18,616,906 15,497,543 2,557,742 17,179,655 Less Reserves & Designations: 42,846,622 Contractual Reserve 300, ,000 Revenue Stabilization Reserve 1,891,626 1,891,626 Catastrophic Events Reserve 1,050,000 1,050,000 Capital Reserve 2,141,754 2,141,754 Opportunity/Economic Development Reserve 1,210,000 1,210,000 TABOR Reserve 1,981,611 1,981,611 Projected Ending Funds Available 18,807,776 7,484,173 8,604,664
18 Fund: Development Services Fund : Development Services LY Actual CY Budget CY Actual YTD Budget YTD Budget 2018 Actual Budget 2018 Budget* Budget Estimates Licenses & Permits 4,283,048 5,114,341 3,965,634 4,106,816 (141,182) 5,192, Annual Budget 77,659 Charges for Service 1,435,819 1,545,000 1,394,203 1,158, ,453 1,633,648 88,648 Investment Earnings 56,054 19,466 27,849 14,600 13,249 42,914 23,448 Total 5,776,685 5,776,685 6,678,807 6,678,807 5,387,686 5,387,686 5,280, ,520 6,868, ,755 Personnel 4,303,622 5,242,769 3,481,255 4,032, ,644 4,731, ,260 Services & Other 1,003,183 1,089, , , , , ,920 Supplies 399, , , ,996 51, ,504 64,157 Capital 4,518, , , ,101 82, ,134 Transfers Out 212, ,278 87,846 87, ,666 3,612 Total 10,437,422 10,437,420 7,018,743 4,403,572 5,369, ,696 6,217, ,949 Net / (4,660,735) (339,936) 984,114 (89,102) 1,073, , ,704 Beginning Funds Available 7,401,480 2,740,745 2,740,745 2,740,745 2,740,745 Ending Funds Available 2,740,745 2,400,809 3,724,859 2,651,643 1,324,050 3,391,513 Less Reserves & Designations: 7,401,480 Revenue Stabilization Reserve 2,400,809 2,400,809 3,391,513 Projected Ending Funds Available 2,740,745 1,324,049 Schedule B
19 Fund: Water Fund : Castle Rock Water LY Actual CY Budget CY Actual YTD Budget YTD Budget 2018 Actual Budget 2018 Budget* Budget Estimates 2018 Annual Budget Intergovernmental 3,200, , , , ,000 Charges for Service 13,544,545 14,160,843 11,739,946 10,631,803 1,108,143 15,065, ,370 Fines & Forfeitures 336, , , ,275 (17,749) 338,994 (30,706) Investment Earnings 197, , ,611 89,726 79, , ,064 System Development Fees 2,795,827 2,746,300 2,475,798 2,205, ,519 3,472, ,913 Contributions & Donations 30,000 30,000 Interfund Loan Revenue 2,544, ,250 15,188 15, ,250 Other Revenue 126, , , ,870 (42,949) 196,529 3,369 Total 22,745,764 22,745,764 18,439,888 18,439,888 14,886,990 14,886,990 13,489,141 1,397,849 20,162,898 1,723,010 Personnel 2,855,311 3,167,902 2,465,578 2,436,848 (28,730) 3,279,806 (111,904) Services & Other 4,570,041 6,651,296 2,920,589 4,088,472 1,167,883 6,355, ,956 Supplies 1,029,220 1,325, , , ,423 1,190, ,988 Capital 14,729,444 13,769,407 5,515,449 7,966,804 2,451,355 13,414, ,430 Debt & Financing 1,737,328 1,746, , ,861 1,746,879 Transfers Out 1,440,288 1,870,744 1,476,583 1,405,429 (71,154) 1,870,744 Total 26,361,631 26,361,632 21,828,083 28,532,214 13,455,128 13,455,127 17,173,904 3,718,777 27,858, ,470 Net / (3,615,868) (10,092,326) 1,431,863 (3,684,763) 5,116,626 (7,695,846) 2,396,480 Beginning Funds Available 24,504,642 20,888,774 20,888,774 20,888,774 20,888,774 Ending Funds Available 20,888,774 10,796,448 22,320,637 17,204,011 11,524,189 13,192,928 Less Reserves & Designations: 24,504,642 Operating Designation 1,631,968 1,311,108 1,631,968 Capital Reserve 1,228,345 3,586,715 3,624,825 Catastrophic Events Reserve 5,346,135 4,829,249 5,346,135 Rate Stabilization Reserve 1,590,000 1,590,000 Projected Ending Funds Available 20,888,774 1,000,000 12,593,565 1,000,000 Schedule C
20 Fund: Water Resources Fund : Castle Rock Water LY Actual CY Budget CY Actual YTD Budget YTD Budget 2018 Actual Budget 2018 Budget* Budget Estimates 2018 Annual Budget Licenses & Permits 13,580 13,580 15,385 15,385 Intergovernmental 9,264 9,264 13,896 13,896 Charges for Service 8,573,021 8,701,060 6,477,774 6,477,774 8,686,380 (14,680) Fines & Forfeitures 91,583 6, ,163 4, , , ,859 Investment Earnings 746, , , ,690 19, ,057 74,471 System Development Fees 14,451,282 16,289,876 14,233,886 13,080,770 1,153,116 18,879,970 2,590,094 Transfers In 1,239,645 1,484,575 1,154,809 1,115,802 39,007 1,556,298 71,723 Debt & Financing Revenue 1,712,249 1,041,000 1,041,000 1,561,500 1,561,500 Other Revenue 182, , ,600 97,652 26, ,736 56,534 Total 26,996,213 26,996,213 27,135,299 27,135,299 23,577,082 23,577,081 21,192,032 2,385,049 31,629,081 4,493,782 Personnel 1,787,528 2,180,587 1,459,156 1,677, ,219 1,928, ,296 Services & Other 1,615,633 6,111,593 2,378,003 4,583,695 2,205,692 3,317,966 2,793,627 Supplies 385, , , ,953 (83,599) 469,523 (104,253) Capital 53,090,032 54,779,824 3,070,570 27,588,477 24,517,907 11,421,555 43,358,269 Debt & Financing 3,661,112 4,265,747 1,447,406 1,447,406 3,679, ,972 Transfers Out 4,707 4,951 3,713 4,948 1,235 4,951 Total 60,544,203 63,601,540 67,707,972 8,716,400 35,575,854 26,859,454 20,822,061 46,885,911 (1) Net / (33,547,990) (40,572,673) 14,860,681 (14,383,821) 29,244,502 10,807,020 51,379,693 Beginning Funds Available 88,185,948 54,637,958 54,637,958 54,637,958 54,637,958 Ending Funds Available 54,637,958 14,065,285 69,498,639 40,254,137 55,433,354 65,444,978 Less Reserves & Designations: 88,185,948 Operating Designation 1,337, ,240 1,337,956 Capital Reserve 9,797,614 69,891,867 61,177,307 Catastrophic Events Reserve 2,429,715 2,429,715 Projected Ending Funds Available 54,637, ,000 (1,055,468) 500,000 Schedule D (1) Unspent capital project funding will be carried forward to 2019 due to project timing
21 Fund: Stormwater Fund : Castle Rock Water LY Actual CY Budget CY Actual YTD Budget YTD Budget 2018 Actual Budget 2018 Budget* Budget Estimates 2018 Annual Budget Intergovernmental 280, , , , ,004 Charges for Service 3,187,045 3,273,942 2,580,469 2,580,469 3,451, ,483 Fines & Forfeitures (34) 150 Investment Earnings 55,280 29,759 68,362 22,319 46,043 93,036 63,277 System Development Fees 1,451,575 1,554,700 1,404,774 1,248, ,350 1,716, ,467 Contributions & Donations 5,615 2,315 1,736 1, , ,785 Transfers In 39,684 Other Revenue 4,798 3,946 2,960 2,960 38,636 34,690 Total 5,024,924 5,024,924 4,864,812 4,864,812 4,832,231 4,159,583 3,957, ,359 6,060,518 1,195,706 Personnel 1,552,421 1,649,029 1,201,526 1,268,484 66,958 1,604,112 44,917 Services & Other 522, , , , , , ,379 Supplies 89,491 82,664 40,851 61,998 21,147 62,522 20,142 Capital 2,142,358 4,795,983 1,424,339 2,614,895 1,190,556 2,889,056 1,906,927 Interfund Loan 20, ,250 15,188 15, ,250 Transfers Out 98, , , ,270 2, ,894 Total 4,425,641 4,425,640 7,984,486 8,144,486 3,253,599 3,253,600 4,686,335 1,432,735 6,001,121 2,143,365 Net / 599,284 (3,279,674) 905,983 (729,111) 1,635,094 59,397 3,339,071 Beginning Funds Available 7,091,072 7,690,356 7,690,356 7,690,356 7,690,356 Ending Funds Available 7,690,356 4,410,682 8,596,339 6,961,245 4,185,657 7,749,753 Less Reserves & Designations: 7,091,072 Operating Designation 396, , ,821 Capital Reserve 3,513,861 6,852,932 Projected Ending Funds Available 7,690, ,000 8,256, ,000 Schedule E
22 Fund: Wastewater Fund : Castle Rock Water LY Actual CY Budget CY Actual YTD Budget YTD Budget 2018 Actual Budget 2018 Budget* Budget Estimates 2018 Annual Budget Charges for Service 10,100,573 9,956,973 7,927,980 7,927,980 10,605, ,579 Fines & Forfeitures Investment Earnings 196,756 82, ,756 61, , , ,857 System Development Fees 2,385,774 2,473,795 2,809,814 1,986, ,357 3,707,867 1,234,072 (1) Contributions & Donations 28,795 29,510 29,510 Other Revenue 191, , , , , ,834 Total 12,903,823 12,903,823 12,674,864 12,674,864 11,524,061 11,140,893 10,108,437 1,032,456 15,235,206 2,560,342 Personnel 1,440,839 1,408,473 1,081,076 1,083,441 2,365 1,433,236 (24,763) Services & Other 7,318,254 6,242,805 4,023,828 4,682, ,276 5,307, ,423 Supplies 295, , , ,264 24, ,351 43,667 Capital 185,337 20,969,192 12,063,321 12,132,507 69,186 18,663,088 2,306,104 Debt & Financing 332, ,594 45,008 45, ,594 Transfers Out 67, , , , ,639 Total 9,639,270 9,518,268 29,498,944 29,495,721 17,629,631 18,383, ,275 26,235,290 3,260,431 Net / 3,264,553 (16,820,857) (6,488,738) (8,275,468) 1,786,730 (11,000,084) 5,820,773 Beginning Funds Available 24,005,548 27,270,101 27,270,101 27,270,101 27,270,101 Ending Funds Available 27,270,101 10,449,244 20,781,363 18,994,633 10,332,119 16,270,017 Less Reserves & Designations: 24,005,548 Operating Designation 1,324, ,018 1,324,604 Catastrophic Events Reserve 6,477,618 10,211,036 6,477,618 Capital Reserve 1,647,022 7,467,795 Projected Ending Funds Available 27,270,101 1,000,000 9,717,309 1,000,000 Schedule F (1) System Development Fees are estimated over budget due to variation in tap size of permits anticipated to be issued
23 Schedule G Fund: Transportation Fund : Public Works LY Actual CY Budget CY Actual YTD Budget YTD ActYE Estimate Ann Est to B Annual Actual Budget 2018 Budget* Budget Estimates Budget Taxes 18,607,673 19,545,393 14,977,121 14,659, ,076 19,942, ,118 Use 2,707,656 2,500,187 2,869,043 1,875, ,903 3,228, ,128 Sales 13,369,246 14,214,140 10,334,017 10,266,136 67,881 13,930,094 (284,046) Motor Vehicle 2,530,771 2,831,066 1,774,061 2,123,300 (349,239) 2,784,102 (46,964) Intergovernmental 3,538,364 4,469,648 3,850,552 3,018, ,566 5,703,869 1,234,221 Charges for Service 8,392 Investment Earnings 45,299 27, ,472 20,491 85, , ,440 Contributions & Donations 312,759 6,000 71,215 69,715 1,500 67,725 61,725 Other Revenue 3,936 1,200 12, ,619 12,235 11,035 Total 22,516,423 22,516,424 24,049,562 24,049,562 19,017,879 17,769,137 1,248,742 25,858,101 1,808,539 Personnel 3,535,230 4,318,349 2,992,462 3,321, ,345 4,058, ,564 Services & Other 11,544,452 14,714,828 9,945,826 11,736,027 1,790,201 12,865,849 1,848,979 Supplies 555, , , , , ,823 29,900 Capital 1,535,371 4,245,375 2,037,697 3,608,496 1,570,799 4,019, ,893 Debt & Financing 297, , , , ,104 (404) Transfers Out 1,081,455 2,488, , ,197 2,488,117 Total 18,549,261 26,806,092 16,027,344 19,845,073 3,817,729 24,442,160 2,363,932 Net / 3,967,162 (2,756,530) 2,990,535 (2,075,936) 5,066,471 1,415,941 4,172,471 Beginning Funds Available 5,264,249 9,231,411 9,231,411 9,231,411 9,231,411 Ending Funds Available 9,231,411 6,474,881 12,221,946 7,155,475 5,747,065 10,647,352 Less Reserves & Designations: 5,264,249 Revenue Stabilization Reserve 319, ,663 Catastrophic Events Reserve 1,645,519 1,645,519 Projected Ending Funds Available 9,231,411 4,509,699 8,682,170
24 Fund: Transportation Capital Projects Fund : Public Works LY Actual CY Budget CY Actual YTD Budget YTD Budget 2018 Actual Budget 2018 Budget* Budget Estimates Taxes 1,996,035 2,253,544 2,129,820 1,690, ,662 2,453, Annual Budget 200,106 Use 1,996,035 2,253,544 2,129,820 1,690, ,662 2,453, ,106 Intergovernmental 32,550 1,447, , ,471 (357,109) 191,362 (1,255,638) Investment Earnings 97,771 82,362 44,221 61,772 (17,551) 65,343 (17,019) Impact Fees 3,411,637 6,712,613 5,367,289 5,390,228 (22,939) 7,518, ,086 Contributions & Donations 2,459, ,333 (1,882,000) Transfers In 462,411 1,200,000 1,200,000 Total 6,000,404 6,000,403 14,154,852 14,154,852 7,732,693 7,732,692 7,690,629 42,063 12,006,387 (2,148,465) (1) Personnel 46,506 Services & Other 1,058 40,665 34,460 30,499 (3,961) 43,460 (2,795) Capital 558,195 17,093,528 1,023,218 14,379,173 13,355,955 9,233,528 7,860,000 Debt & Financing 1,353,450 1,350, , ,556 1,351,138 (300) Interfund Loan 2,524,247 Transfers Out 29, , , , ,847 13,610 Total 4,512,779 18,481,453 18,631,488 2,113,081 15,465,075 13,351,994 10,760,973 7,870,515 (1) Net / 1,487,625 (4,476,636) 5,619,611 (7,774,446) 13,394,057 1,245,414 5,722,050 Beginning Funds Available 5,021,489 6,509,114 6,509,114 6,509,114 6,509,114 Ending Funds Available 6,509,114 2,032,478 12,128,725 (1,265,332) 10,096,247 7,754,528 Less Reserves & Designations: 5,021,489 Capital Reserve 1,250,000 1,250,000 Committed for Fund Purpose 782,478 6,504,528 Projected Ending Funds Available 6,509,114 12,128,725 Schedule H (1) Revenue and expenditures are estimated under budget due to the planned carryforward of capital projects and corresponding grant revenue receipts to 2019
25 Fund: Fleet Services Fund : Public Works LY Actual CY Budget CY Actual YTD Budget YTD Budget 2018 Actual Budget 2018 Budget* Budget Estimates 2018 Annual Budget Charges for Service 3,334,032 3,895,331 2,867,478 2,921,498 (54,020) 3,837,806 (57,525) Investment Earnings 11,242 6,404 12,455 4,803 7,652 16,716 10,312 Transfers In 1,356,954 1,415, , ,020 (35,008) 1,393,095 (22,445) Other Revenue 253, , , ,664 (9,455) 205,513 (706) Total 4,955,511 4,955,512 5,523,494 5,523,494 3,804,154 3,804,154 3,894,985 (90,831) 5,453,130 (70,364) (1) Personnel 522, , , ,005 68, ,164 68,343 Services & Other 159, , , ,256 (34,612) 216,294 (30,620) Supplies 396, , , ,756 (7,164) 261,993 39,015 Capital 3,739,191 4,879,861 4,266,958 4,101,462 (165,497) 4,518, ,171 Transfers Out 11,149 13,119 9,839 9,839 13,119 Total 4,829,323 4,829,322 6,010,169 5,099,941 5,099,940 4,961,318 (138,622) 5,572, ,909 Net / 126,189 (486,675) (1,295,786) (1,066,333) (229,453) (119,130) 367,545 Beginning Funds Available 2,740,562 2,866,751 2,866,751 2,866,751 2,866,751 Ending Funds Available 2,866,751 2,380,076 1,570,965 1,800,418 (809,111) 2,747,621 Less Reserves & Designations: 2,740,562 Committed for Fund Purpose 2,380,076 1,570,965 2,747,621 Projected Ending Funds Available 2,866,751 Schedule I (1) Total revenues for the Fleet fund are estimated under budget due to fleet repair and maintenance trending low for the year
26 Fund: Fire Capital Fund : Fire LY Actual CY Budget CY Actual YTD Budget YTD Budget 2018 Actual Budget 2018 Budget* Budget Estimates Investment Earnings 25,208 2,032 24,311 1,524 22,787 36, Annual Budget 34,423 Impact Fees 720,541 1,032, , ,285 (29,619) 1,130,348 97,614 Transfers In 3,006,029 Total 3,751,778 3,751,777 1,034,766 1,034, , , ,809 (6,832) 1,166, ,037 Services & Other 53,056 75,511 67,196 56,633 (10,563) 79,507 (3,996) Supplies 289, , ,962 48, ,029 31,253 Capital 1,357,096 4,029,203 3,515,293 3,602,082 86,789 3,602, ,121 Interfund Loan 429,265 33, , , ,265 Transfers Out 1,028, , ,479 Total 2,918,654 2,438,654 5,296,740 3,784,692 4,197, ,934 4,842, ,378 Net / 1,313,124 (4,261,974) (2,960,715) (3,366,817) 406,102 (3,675,559) 586,415 Beginning Funds Available 3,348,931 4,662,055 4,662,055 4,662,055 4,662,055 Ending Funds Available 4,662, ,081 1,701,340 1,295,238 1,301, ,496 Less Reserves & Designations: 3,348,931 Committed for Fund Purpose 400,081 1,701, ,496 Projected Ending Funds Available 4,662,055 Schedule J
27 Fund: Police Capital Fund : Police LY Actual CY Budget CY Actual YTD Budget YTD Budget 2018 Actual Budget 2018 Budget* Budget Estimates Investment Earnings 1,643 4,441 1,231 3,331 (2,100) 4, Annual Budget Impact Fees 327, , , ,429 (22,896) 484,117 22,811 Transfers In 588 Total 329, , , , , , ,760 (24,996) 488,558 22,811 Services & Other 20,721 25,447 21,269 19,085 (2,184) 25,447 Interfund Loan 86, ,943 12,347 12, ,943 Transfers Out 57, , , , ,000 Total 645, , , , ,196 (2,184) 319,390 Net / 164, , , ,564 (27,180) 169,168 22,811 Beginning Funds Available 118, , , , ,824 Ending Funds Available 282, , , ,388 58, ,992 Less Reserves & Designations: 118,491 Committed for Fund Purpose 429, , ,992 Projected Ending Funds Available 282,824 Schedule K
28 Fund: Police Forfeiture Fund : Police LY Actual CY Budget CY Actual YTD Budget YTD Budget 2018 Actual Budget 2018 Budget* Budget Estimates Intergovernmental 20, Annual Budget Investment Earnings (124) Total 21,080 21, (124) Total Net / 21, (124) Beginning Funds Available ,601 21,601 21,601 21,601 Ending Funds Available 21,601 21,725 21,601 21,601 (124) 21,601 Less Reserves & Designations: 521 Committed for Fund Purpose 21,725 21,601 21,601 Projected Ending Funds Available 21,601 Schedule L
29 Fund: Parks & Recreation Capital Fund : Parks and Recreation LY Actual CY Budget CY Actual YTD Budget YTD Budget 2018 Actual Budget 2018 Budget* Budget Estimates 2018 Annual Budget Investment Earnings 35,685 3,536 28,631 2,652 25,979 42,909 39,373 Impact Fees 3,100,074 3,941,813 3,294,059 3,165, ,783 4,246, ,373 Contributions & Donations 20,000 20,000 20,000 Transfers In 9, , , , ,000 Other Revenue 129 Total 3,165,749 3,165,749 3,965,349 3,965,349 3,922,690 3,922,690 3,167, ,762 4,909, ,746 Services & Other 247, , ,074 (19,685) 259,098 (12,000) Supplies 8,960 (8,960) Capital 5,732,245 3,534, , , ,917 1,969,431 1,565,237 (1) Debt & Financing 709, , , , ,862 Interfund Loan 731, ,000 15,750 15, ,000 Transfers Out 1,470, , , , , ,222 Total 8,643,572 8,643,573 5,054,045 6,063,850 1,687,685 2,053, ,522 4,510,613 1,553,237 Net / (5,477,824) (2,098,501) 2,235,005 1,114,721 1,120, ,482 2,496,983 Beginning Funds Available 7,592,812 2,114,988 2,114,988 2,114,988 2,114,988 Ending Funds Available 2,114,988 16,487 4,349,993 3,229,709 4,333,506 2,513,470 Less Reserves & Designations: 7,592,812 Committed for Fund Purpose 16,487 4,349,993 2,513,470 Projected Ending Funds Available 2,114,988 Schedule M (1) Unspent funding for construction of the new neighborhood park will be carried forward to 2019
30 Fund: Conservation Trust Fund : Parks and Recreation LY Actual CY Budget CY Actual YTD Budget YTD Budget 2018 Actual Budget 2018 Budget* Budget Estimates 2018 Annual Budget Licenses & Permits 127, ,500 87, ,493 (18,415) 134,500 (20,000) Intergovernmental 453, , , ,254 25, ,591 19,919 Investment Earnings 1,404 3,487 2,098 2,615 (517) 2,760 (727) Other Revenue 154 Total 582, ,328 1,014,659 1,014, , , ,362 6,406 1,013,851 (808) Personnel 86,648 89,756 68,759 69, , Services & Other 27,457 45,000 31,444 33,750 2,306 32,074 12,926 Supplies 29, ,500 19,369 80,625 61, ,896 (11,396) Capital 69,202 97,798 35,687 73,349 37,662 67,918 29,880 Transfers Out 600, , , ,000 Total 212, , , , , , , ,495 31,559 Net / 369,651 74,605 (324,491) (432,405) 107, ,356 30,751 Beginning Funds Available 157, , , , ,344 Ending Funds Available 527, , ,853 94,939 (399,096) 632,700 Less Reserves & Designations: 157,693 Committed for Fund Purpose 601, , ,700 Projected Ending Funds Available 527,344 Schedule N
31 Fund: Community Center Fund : Parks and Recreation LY Actual CY Budget CY Actual YTD Budget YTD Budget 2018 Actual Budget 2018 Budget* Budget Estimates 2018 Annual Budget Taxes 3,027,601 3,273,072 2,411,709 2,386,280 25,429 3,238,775 (34,297) Use 335, , , ,874 67, ,220 26,721 Sales 2,319,271 2,469,173 1,797,933 1,783,356 14,577 2,415,078 (54,095) Motor Vehicle 373, , , ,050 (56,955) 410,477 (6,923) Intergovernmental 10,000 16,688 16,688 16,688 16,688 Charges for Service 3,752,932 4,208,095 2,906,781 3,262,115 (355,334) 4,193,833 (14,262) Investment Earnings 7,296 22,131 5,395 16,598 (11,203) 8,180 (13,951) Interfund Loan Revenue 418, ,000 9,000 9, ,000 Other Revenue 41,779 47,587 21,539 35,690 (14,151) 27,536 (20,051) Total 7,257,608 7,257,609 7,962,885 7,962,885 5,390,611 5,371,112 5,709,683 (338,571) 7,897,012 (65,873) (1) Personnel 3,695,102 3,838,839 2,998,400 3,005,352 6,952 3,890,878 (52,039) Services & Other 2,055,823 2,197,413 1,629,703 1,321,304 (308,399) 2,164,337 33,076 Supplies 563, , , ,881 (74,376) 553,353 (27,771) Capital 256, , , ,500 (6,046) 296,298 93,702 Transfers Out 98, , , ,813 10, ,210 3,651 Total 6,669,065 6,669,064 7,105,695 5,533,400 5,161,850 (371,550) 7,055,076 50,619 (1) Net / 588, ,190 (162,288) 547,833 (710,121) 841,936 (15,254) Beginning Funds Available 911,250 1,499,794 1,499,794 1,499,794 1,499,794 Ending Funds Available 1,499,794 2,356,984 1,337,506 2,047,627 (1,019,478) 2,341,730 Less Reserves & Designations: 911,250 Capital Reserve 288, , ,759 Revenue Stabilization Reserve 98, ,000 98,192 Projected Ending Funds Available 1,499,794 1,970, ,982 1,954,779 Schedule O (1) The 2018 YTD Budget is based on historical seasonal averages. Community Center/MAC programming is highly seasonal. Staff will continue to monitor this fund throughout the year and will make necessary adjustments as needed.
32 Fund: Golf Course Fund : Parks and Recreation LY Actual CY Budget CY Actual YTD Budget YTD Budget 2018 Actual Budget 2018 Budget* Budget Estimates 2018 Annual Budget Charges for Service 3,054,728 3,200,711 2,826,368 2,784,298 42,070 3,349, ,691 Investment Earnings 15,600 10,765 7,160 8,074 (914) 9,249 (1,516) Transfers In 80,000 80,000 80,000 80,000 80,000 Other Revenue 2, Total 3,153,148 3,153,148 3,291,476 3,187,721 2,914,455 2,914,455 2,872,372 42,083 3,439, ,012 Personnel 1,233,943 1,298,991 1,034,217 1,030,823 (3,394) 1,319,345 (20,354) Services & Other 576, , , ,822 (103,505) 546,086 63,326 Supplies 614, , , ,744 63, ,846 (20,603) Capital 200, , , ,442 60, ,014 38,385 Debt & Financing 650, , , , ,599 2,200 Interfund Loan 7,512 7,512 5,634 5,634 7,512 Transfers Out 2,742 2,539 1,904 1,904 2,539 Total 3,285,978 3,331,435 3,403,895 2,312,502 2,257,155 (55,347) 3,340,941 62,954 (1) Net / (132,830) (112,419) 601, ,217 (13,264) 98, ,966 Beginning Funds Available 1,723,566 1,590,736 1,590,736 1,590,736 1,590,736 Ending Funds Available 1,590,736 1,478,317 2,192,689 2,205, ,372 1,689,283 Less Reserves & Designations: 1,723,566 Revenue Stabilization Reserve 200, , ,000 Capital Reserve 145,061 10,211, ,061 Debt Service Reserve 500, ,815 Projected Ending Funds Available 1,590, ,441 (11,666,007) 843,407 Schedule P (1) The 2018 YTD Budget is based on historical seasonal averages. The golf course is highly seasonal and dependent on weather. Although over budget at this point in the year, this fund is considered to be on track given this variability. However, staff will continue to monitor this fund throughout the year and will make necessary adjustments as needed. Estimates indicate this fund will end the year under budget.
33 Fund: Economic Development Fund : Town Manager LY Actual CY Budget CY Actual YTD Budget YTD Budget 2018 Actual Budget 2018 Budget* Budget Estimates Taxes 1,100, , , , , ,738 Use 1,100, , , , , , Annual Budget 177, ,280 Investment Earnings 55,295 58,763 43,671 44,072 (401) 63,964 5,201 Interfund Loan Revenue 307, , ,784 (231,784) 76,228 (232,817) Total 1,463,422 1,490,494 1,189,266 1,189, , , ,950 (4,221) 1,138,930 (50,336) Services & Other 280,623 3,730, ,960 2,797,726 2,543,766 2,525,481 1,204,820 Transfers Out 924,000 Total 1,204,623 3,730, ,960 2,797,726 2,543,766 2,525,481 1,204,820 Net / 258,799 (2,541,035) 633,769 (1,905,776) 2,539,545 (1,386,551) 1,154,484 Beginning Funds Available 4,287,087 4,545,886 4,545,886 4,545,886 4,545,886 Ending Funds Available 4,545,886 2,004,851 5,179,655 2,640,110 3,174,804 3,159,335 Less Reserves & Designations: 4,287,087 Future Incentive Obligation 2,000,000 2,000,000 Committed for Fund Purpose 4,851 5,179,655 1,159,335 Projected Ending Funds Available 4,545,886 Schedule Q
34 Fund: Downtown Development TIF Fund : Finance LY Actual CY Budget CY Actual YTD Budget YTD Budget 2018 Actual Budget 2018 Budget* Budget Estimates Taxes 1,033,379 1,467,389 1,096,183 1,100,542 (4,359) 1,310, Annual Budget (157,389) Property 41, , , ,000 11, ,000 Sales 991,841 1,307, , ,542 (16,114) 1,150,000 (157,389) Investment Earnings 3,471 2,603 (2,603) 3,471 Transfers In 900,000 Other Revenue 7,500 9,000 9,000 Total 1,940,879 1,940,878 1,479,860 1,479,860 1,096, ,779 1,103,145 (6,962) 1,322,471 (157,389) (1) Services & Other 1,119, , , , ,338 (152,410) Supplies 4,565 Capital 632, ,963 Debt & Financing 256, ,286 83,789 83, ,387 54,899 Interfund Loan 307, , , ,097 Total 1,687,829 2,108, , ,930 1,158, ,549 Net / 253,050 (628,437) 192, ,215 (6,962) 163, ,160 Beginning Funds Available 1,655,964 1,909,014 1,909,014 1,909,014 1,909,014 Ending Funds Available 1,909,014 1,280,577 2,101,267 2,108, ,690 2,072,737 Less Reserves & Designations: 1,655,964 Committed for Fund Purpose 56, ,482 Loan Reserve 900, ,000 Debt Service Reserve 324,255 2,101, ,255 Projected Ending Funds Available 1,909,014 (1) Sales Tax revenue in the downtown area is under projections through the third quarter, resulting in lower than estimated tax increment revenue through September. Note that the actual nine month period reflected represents December 2017 August Schedule R
35 Fund: Philip S. Miller Trust Fund : Town Council LY Actual CY Budget CY Actual YTD Budget YTD Budget 2018 Actual Budget 2018 Budget* Budget Estimates 2018 Annual Budget Charges for Service 172, , ,836 (29,445) 136,391 (36,409) Investment Earnings , ,668 1,049 Contributions & Donations 270, , , , ,000 21,000 Transfers In 151, , , ,758 Total 270, , , , , , ,558 (28,664) 580,817 (14,360) (1) Personnel ,578 79,416 86,837 7, ,387 3,191 Services & Other 253, , , ,283 3, ,855 27,036 Supplies 12,820 6,855 10,787 3,932 7,454 5,366 Total 254, , , , ,907 14, ,696 35,593 Net / 16,279 (21,112) (72,660) (58,349) (14,311) ,233 Beginning Funds Available 221, , , , ,352 Ending Funds Available 237, , , ,003 (51,548) 237,473 Less Reserves & Designations: 221,073 Committed for Fund Purpose 216, , ,473 Projected Ending Funds Available 237,352 Schedule S (1) The 2018 YTD Budget includes estimated special event ticket sales. Staff will continue to monitor this fund throughout the year and will make necessary adjustments as needed. Note: The remaining balance from the Special Events Fund has been transferred to this fund in June 2018
36 Fund: Special Events Fund : Parks and Recreation LY Actual CY Budget CY Actual YTD Budget YTD Budget 2018 Actual Budget 2018 Budget* Budget Estimates Charges for Service 114, Annual Budget Transfers In 73,503 Other Revenue 122 Total 188, ,094 (1) Personnel 90,069 Services & Other 208,077 Supplies 6,168 Transfers Out 1,758 1,758 1,758 1,758 Total 304,314 1,758 1,758 1,758 1,758 (1) Net / (116,220) (1,758) (1,758) (1,758) (1,758) Beginning Funds Available 117,978 1,758 1,758 1,758 1,758 Ending Funds Available 1,758 Less Reserves & Designations: 117,978 Committed for Fund Purpose Projected Ending Funds Available 1,758 Schedule T (1) Revenue and expenditures for Special Events have been moved to the Philip S. Miller Trust Fund beginning in The remaining fund balance was transferred to the Philip S. Miller Trust Fund in June 2018 and this fund will no longer be used.
37 Fund: Public Art Fund : Town Council LY Actual CY Budget CY Actual YTD Budget YTD Budget 2018 Actual Budget 2018 Budget* Budget Estimates Investment Earnings , Annual Budget 838 Contributions & Donations 25,000 25,000 12,500 12,500 25,000 Other Revenue 3 Total 25,713 25,713 25,374 25,374 13,408 13,408 12, , Services & Other 21,358 56,050 14,003 42,038 28,035 15,002 41,048 Supplies (162) 162 (162) Total 21,683 21,682 56,050 14,165 42,038 27,873 15,164 40,886 Net / 4,031 (30,676) (757) (29,257) 28,500 11,048 41,724 Beginning Funds Available 61,157 65,188 65,188 65,188 65,188 Ending Funds Available 65,188 34,512 64,431 35,931 29,919 76,236 Less Reserves & Designations: 61,157 Committed for Fund Purpose 34,512 64,431 76,236 Projected Ending Funds Available 65,188 Schedule U
38 Fund: Municipal Facilities Capital Fund : Deputy Town Manager LY Actual CY Budget CY Actual YTD Budget YTD Budget 2018 Actual Budget 2018 Budget* Budget Estimates 2018 Annual Budget Investment Earnings 11,272 2,647 24,317 1,985 22,332 30,590 27,943 Impact Fees 429, , , ,278 (24,618) 525,324 25,600 Transfers In 2,612,925 1,189,111 1,189,111 1,189,111 1,189,111 Interfund Loan Revenue 26,809 26,808 2,781 2,781 26,808 Total 3,080,680 3,080,680 1,718,290 1,718,290 1,592,869 1,592,869 1,595,155 (2,286) 1,771,833 53,543 Services & Other 117,575 49,480 47,712 47,712 49,480 Capital 165,609 5,187,301 1,986,285 1,986,285 5,187,301 Interfund Loan 51,982 51,982 Transfers Out 489,089 Total 1,012, ,273 5,288,763 2,033,997 2,033,997 5,288,763 Net / 2,308,407 (3,570,473) (441,128) (438,842) (2,286) (3,516,930) 53,543 Beginning Funds Available 1,557,159 3,865,566 3,865,566 3,865,566 3,865,566 Ending Funds Available 3,865, ,093 3,424,438 3,426,724 3,129, ,636 Less Reserves & Designations: 1,557,159 Committed for Fund Purpose 295,093 3,424, ,636 Projected Ending Funds Available 3,865,566 Schedule V (1) Impact Fees are estimated under budget due to reduced multifamily permit projections
39 Fund: General Long Term Planning Fund : Deputy Town Manager LY Actual CY Budget CY Actual YTD Budget YTD Budget 2018 Actual Budget 2018 Budget* Budget Estimates Taxes 1,554,389 1,749,235 1,658,338 1,311, ,412 1,909, Annual Budget 160,465 Use 1,554,389 1,749,235 1,658,338 1,311, ,412 1,909, ,465 Investment Earnings 18,345 9,801 9,917 7,351 2,566 15,274 5,473 Transfers In 308, ,700 Other Revenue 31 Total 1,572,765 1,572,766 2,067,736 2,067,736 1,668,255 1,668,255 1,319, ,978 2,233, ,938 Services & Other 209, , , , ,484 87,401 Supplies 128, , , , ,412 (15,693) Capital 198, , , , ,250 (4,250) Transfers Out 1,641, , , , ,889 Total 2,177,675 1,868,493 1,310,600 1,310,600 1,801,035 67,458 Net / (604,910) 199, ,655 8, , , ,396 Beginning Funds Available 1,598, , , , ,515 Ending Funds Available 993,515 1,192,758 1,351,170 1,002, ,412 1,426,154 Less Reserves & Designations: 1,598,425 Committed for Fund Purpose 1,192,758 1,351,170 1,426,154 Projected Ending Funds Available 993,515 Schedule W
40 Fund: Employee Benefits Fund : Deputy Town Manager LY Actual CY Budget CY Actual YTD Budget YTD Budget 2018 Actual Budget 2018 Budget* Budget Estimates 2018 Annual Budget Charges for Service 5,736,585 7,116,504 4,768,099 5,337,378 (569,279) 6,231,499 (885,005) Investment Earnings 32,806 14,786 32,116 11,090 21,026 45,401 30,615 Contributions & Donations 1,335,818 1,465,865 1,227,536 1,099, ,137 1,604, ,804 Other Revenue 2,444 Total 7,107,653 7,107,654 8,597,155 8,597,155 6,027,751 6,027,751 6,447,867 (420,116) 7,881,569 (715,586) (1) Personnel 59,570 62,104 47,219 46,578 (641) 61, Services & Other 7,059,414 8,416,781 6,001,608 6,312, ,978 8,353,071 63,710 Supplies 630 2,000 1,234 1, , Total 7,119,613 7,119,614 8,330,885 8,480,885 6,050,061 6,360, ,603 8,416,205 64,680 Net / (11,961) 116,270 (22,310) 87,203 (109,513) (534,636) (650,906) (2) Beginning Funds Available 2,592,611 2,580,650 2,580,650 2,580,650 2,580,650 Ending Funds Available 2,580,650 2,696,920 2,558,340 2,667,853 (138,580) 2,046,014 Less Reserves & Designations: 2,592,611 Claims Reserve 1,482,862 1,438,226 1,520,362 Health Care Cost Reserve 274, , ,826 Projected Ending Funds Available 2,580, , , ,826 Schedule X (1) Revenue is estimated under budget due to various position vacancies townwide and reflects actual increases in healthcare premiums (2) are estimated at the maximum of claim activity. A budget amendment, which was approved by Council on its first reading October 16th, includes an increase of budget for claims activity that is trending high
41 Townwide Summary Schedule Y LY Actual CY Budget CY Actual YTD Budget YTD ActYE Estimate Ann Est to B Annual Actual Budget 2018 Budget Budget Estimates Budget Taxes 63,658,037 67,988,668 51,247,864 49,160,473 1,692,922 67,940,257 (48,411) Property 1,175,601 1,368,703 1,327, , ,644 1,354,973 (13,730) Use 7,694,140 7,710,923 7,858,940 5,783,192 2,075,748 9,003,623 1,292,700 Sales 47,732,089 51,054,216 37,168,141 36,910, ,046 49,834,434 (1,219,782) Motor Vehicle 6,707,543 7,503,441 4,640,781 5,627,581 (986,800) 7,378,969 (124,472) Other 348, , , ,539 (11,247) 368,258 16,873 Franchise Fees 2,323,993 2,442,480 1,785,076 1,831,860 (46,784) 2,465,099 22,619 Licenses & Permits 4,525,581 5,374,958 4,123,458 4,305,477 (182,019) 5,439,435 64,477 Intergovernmental 7,930,064 8,253,877 4,944,999 4,544, ,262 7,387,826 (866,051) Charges for Service 55,302,296 58,912,725 45,556,741 45,259, ,740 59,684, ,849 Management Fees 3,274,465 3,519,368 2,639,526 2,639,526 3,519,368 Fines & Forfeitures 827, , , ,418 (35,311) 823,073 (101,483) Investment Earnings 1,766,459 1,129,028 1,462, , ,817 1,937, ,447 Impact Fees 7,989,231 12,648,190 10,185,207 10,156,496 28,711 13,904,674 1,256,484 System Development Fees 21,084,458 23,064,671 20,924,272 18,520,931 2,403,341 27,776,217 4,711,546 Contributions & Donations 2,162,487 4,337,523 1,474,887 1,345, ,637 3,326,337 (1,011,186) Transfers In 10,806,600 6,380,934 3,954,690 3,350, ,999 7,030, ,278 Interfund Loan Revenue 3,677,762 2,635,072 82, ,453 (231,784) 2,190,182 (444,890) Debt & Financing Revenue 1,712,249 1,041,000 1,041,000 1,561,500 1,561,500 Other Revenue 1,125,940 1,050, , ,894 (45,002) 1,497, ,330 Total 188,167, ,662, ,742, ,675,887 6,672, ,483,360 7,820,509
42 Townwide Summary Schedule Y LY Actual CY Budget CY Actual YTD Budget YTD ActYE Estimate Ann Est to B Annual Actual Budget 2018 Budget Budget Estimates Budget Personnel 51,715,417 59,059,223 43,182,256 45,468,210 2,285,957 57,404,215 1,655,008 Services & Other 45,838,177 62,307,685 36,643,026 46,229,259 9,606,193 53,678,124 8,629,561 Supplies 7,243,966 8,078,422 5,523,500 6,124, ,692 7,798, ,581 Capital 89,930, ,262,560 36,628,508 80,957,559 44,329,051 79,436,627 60,825,933 Debt & Financing 9,311,357 9,689,705 3,403,910 3,403,910 9,047, ,367 Interfund Loan 3,677,761 2,635,072 82, , ,199 2,220, ,097 Transfers Out 13,430,684 10,076,699 6,222,714 6,333, ,132 10,056,295 20,404 Total 221,148, ,109, ,686, ,888,343 57,201, ,642,415 72,466,951 Net / (32,980,512) (93,446,515) 19,056,302 (45,212,456) 64,268,758 (13,159,055) 80,287,460 Beginning Funds Available 208,521, ,541, ,541, ,541, ,541,257 Ending Funds Available 175,541,257 82,094, ,597, ,328, ,502, ,382,202 Less Reserves & Designations: #N/A Contractual Reserve 300, ,000 Revenue Stabilization Reserve 4,910,290 5,900,994 Catastrophic Events Reserve 16,948,987 16,948,987 Capital Reserve 20,012,416 82,948,433 Opportunity/Economic Development Reserve 1,210,000 1,210,000 TABOR Reserve 1,981,611 1,981,611 Committed for Fund Purpose 6,431,753 17,954,724 Operating Designation 4,691,349 4,691,349 Rate Stabilization Reserve 1,590,000 1,590,000 Debt Service Reserve 825, ,070 Claims Reserve 1,482,862 1,520,362 Health Care Cost Reserve 274, ,826 Total Reserves & Designations 60,658, ,134,356 Projected Ending Funds Available 175,541,257 21,436,112 26,247,846
43 YearlySalesTaxRevenue PriorYearCollections* 247, , , , ,216 75,460 Jan 2,257,836 2,336,654 2,529,828 2,708,833 2,939,153 3,303,954 Feb 2,064,347 2,246,138 2,356,187 2,628,882 2,942,236 3,044,888 Mar 2,649,418 3,033,526 3,249,291 3,274,629 3,856,165 4,092,323 Apr 2,320,815 2,595,907 2,697,616 2,991,981 3,559,192 3,488,927 May 2,707,992 2,843,580 3,089,557 3,235,763 3,703,943 4,042,545 Jun 2,997,737 3,295,338 3,607,345 3,836,672 4,304,723 4,464,989 Jul 2,722,544 2,905,715 3,307,172 3,547,768 3,899,703 4,068,563 Aug 2,809,796 3,041,373 3,336,810 3,551,913 3,898,049 4,178,111 Sep 2,936,950 3,215,915 3,513,438 3,946,825 4,190,106 Oct 2,685,614 2,757,974 2,999,064 3,528,073 3,513,275 Nov 2,772,558 2,951,578 3,055,060 3,479,493 3,877,471 Dec 4,002,002 4,113,480 4,367,857 4,855,770 5,426,023 Totals 33,175,372 35,457,107 38,340,444 41,753,601 46,285,255 30,684,300 YeartoYearChange 6.9% 8.1% 8.9% 10.9% 5.4% Footnote: *PriorYearCollectionslineitemincludespaymentsreceivedincurrentyearapplicabletoprioryearsalestaxreturns.As prioryearaccounting recordshavebeenclosedandthe"previousperiod"amountisnotdeemedmaterialtothepreviousyearytdtotal,therevenuewillberecorded indecemberofthecurrentyear.prioryearmonthlyandannualtotalswillnotchangeduetoareceiptofalatepayment.
44 ThreeYearSalesTaxRevenueComparison % Change % Change PreviousPeriod* 166, ,216 NA 75,460 NA Jan 2,708,833 2,939, % 3,303, % Feb 2,628,882 2,942, % 3,044, % Mar 3,274,629 3,856, % 4,092, % Apr 2,991,981 3,559, % 3,488, % May 3,235,763 3,703, % 4,042, % Jun 3,836,672 4,304, % 4,464, % Jul 3,547,768 3,899, % 4,068, % Aug 3,551,913 3,898, % 4,178, % Sep 3,946,825 4,190, % Oct 3,528,073 3,513, % Nov 3,479,493 3,877, % Dec 4,855,770 5,426, % Totals 41,753,601 46,285, % 30,684,300
45
46 MonthlySalesTaxComparisons August2017 August2018 %ChangeMonth 3,898,049 4,178, % YTD2017* YTD2018* %ChangeYTD 29,103,164 30,684, % MonthlySalesTaxComparisonsByGeographicalArea August2017 August2018 %ChangeMonth %TotalMonth Milestone/Metzler 876, , % 21.6% OutletMall 785, , % 18.4% Promenade 493, , % 14.8% OutofTown 318, , % 9.1% Downtown 418, , % 10.2% OutofState 287, , % 6.9% AreaAroundOutletMall 131, , % 3.2% Wolfensberger 144, , % 3.3% FoundersMarketPlace 127, , % 2.9% Justice 120, , % 2.8% PlumCreek 84, , % 2.5% Misc/Other 63,985 74, % 1.8% Meadows 31,225 31, % 0.7% AuditRevenue 15,274 66, % 1.6% YTD2017* YTD2018* %ChangeYTD %TotalYTD Milestone/Metzler 7,538,578 7,063, % 23.0% OutletMall 4,901,636 5,130, % 16.7% Promenade 2,834,650 4,371, % 14.2% OutofTown 2,870,122 2,997, % 9.8% Downtown 2,696,563 2,731, % 8.9% OutofState 2,484,697 2,574, % 8.4% AreaAroundOutletMall 1,101,406 1,179, % 3.8% Wolfensberger 1,117,662 1,071, % 3.5% FoundersMarketPlace 949,749 1,005, % 3.3% Justice 817, , % 2.7% PlumCreek 758, , % 2.5% Misc/Other 370, , % 1.8% Meadows 267, , % 0.9% AuditRevenue 394, , % 0.5% *YTDbreakoutdoesnotincludeprioryearcollections
47 MonthlySalesTaxComparisons August2017 August2018 %ChangeMonth 3,898,049 4,178, % YTD2017* YTD2018* %ChangeYTD 29,103,164 30,684, % MonthlySalesTaxComparisonsByIndustry August2017 August2018 %ChangeMonth %TotalMonth FoodandGeneralMerchandise 1,158,713 1,235, % 29.6% ApparelandAccessories 780, , % 19.3% Restaurants&Bars 470, , % 12.0% MiscRetail 336, , % 8.2% HomeandGarden 252, , % 6.3% Utilities 164, , % 4.4% AutoandAutoItems 170, , % 4.6% Communication 101, , % 2.7% FurnitureandHomeDécor 99, , % 2.7% LeasingandRentals 59,362 71, % 1.7% Services 64,449 65, % 1.6% AgriculturalandConstruction 71,463 78, % 1.9% WholesaleandManufacturing 62,657 56, % 1.3% RanchSupply/PetNeeds 37,090 38, % 0.9% Hotel 52,905 54, % 1.3% AuditRevenue 15,274 66, % 1.6% YTD2017* YTD2018* %ChangeYTD %TotalYTD FoodandGeneralMerchandise 8,031,761 8,873, % 28.9% ApparelandAccessories 4,920,938 5,292, % 17.2% Restaurants&Bars 3,452,067 3,747, % 12.2% MiscRetail 2,600,101 2,651, % 8.6% HomeandGarden 2,239,617 2,366, % 7.7% Utilities 1,427,098 1,519, % 5.0% AutoandAutoItems 1,400,297 1,401, % 4.6% Communication 885, , % 3.0% FurnitureandHomeDécor 872, , % 2.8% LeasingandRentals 534, , % 2.1% Services 606, , % 1.8% AgriculturalandConstruction 529, , % 1.8% WholesaleandManufacturing 571, , % 1.6% RanchSupply/PetNeeds 317, , % 1.1% Hotel 320, , % 1.0% AuditRevenue 394, , % 0.5% *YTDbreakoutdoesnotincludeprioryearcollections


48 Period Ending September 30, 2018 Attachment C Investment Summary Conservative financial management is a core priority of the Town. Successful management of the Town s cash balances and investments is important in order to support long range planning, as shown in the amended 2018 Budget and the Five Year Capital Improvement Plan. The following includes information about the Town s cash and investment balances by Town fund. Please note that the following information may vary from the fund balance information in Attachment A on timing differences between budget and cash investment reporting. These balances may include internal and external reservations of funds, and the accumulation of funding for future project needs. Additionally, the value of units in an investment portfolio can fluctuate and past performance is not necessarily indicative of future results. Net investment earnings through the third quarter are about 1.8 million, including about 56 thousand in corresponding professional service costs. The Town maintains a conservative investment policy. The principal objectives include: Preservation and protection of capital Maintenance of sufficient liquidity Diversification to avoid unreasonable risk Attainment of adequate market rate of return Conformance with all stated regulations Investments held to maturity As of 9/30/2018, the Town's Cash and Investment Balances by Fund are: Governmental Activities General Fund 18,659,136 Economic Development Fund 6,187,911 Transportation Fund 13,682,610 Capital Funds: Transportation Capital Fund 12,176,287 Parks Capital Fund 4,349,993 Fire Capital Fund 1,895,903 Facilities Capital Fund 3,504,945 Police Capital Fund 487,208 Other Governmental Funds: General Long Term Planning Fund 1,351,170 DDA TIF Fund 1,451,151 Conservation Trust Fund 204,638 P.S. Miller Trust Fund 165,614 Public Art Fund 104,431 Special Events Fund Police Forfeiture Fund 21,601 Internal Service Funds: Employee Benefits Fund 3,491,162 Fleet Fund 1,591,230 Total Governmental Funds 69,324,991 Businesstype Activities Water Fund 21,683,604 Water Resources Fund 69,381,584 Stormwater Fund 9,138,449 Wastewater Fund 19,745,011 Golf Fund 2,323,425 Community Center Fund 1,239,941 Development Services Fund 3,832,176 Total Enterprise Funds 127,344,190 Total All Funds 196,669,181 Attachment C Investment Summary
AGENDA MEMORANDUM. Item # Meeting Date: April 3, Honorable Mayor and Members of Town Council. Trish Muller, Finance Director
 Item # Meeting Date: April 3, 2018 AGENDA MEMORANDUM To: From: Honorable Mayor and Members of Town Council Trish Muller, Finance Director Title: Preliminary 2017 Unaudited YearEnd Financial Review Executive
Balanced Financial Plan Projected Changes and Assumptions
 Appendix I Resolution Adopting the Three Year Plan Town of Castle Rock Projected Changes and Assumptions Unless otherwise noted, following is a general list of Townwide growth rates used in future years:
2019 BUDGET MESSAGE. September 18, Honorable Mayor and Town Council Members,
 2019 BUDGET MESSAGE September 18, 2018 Honorable Mayor and Town Council Members, On behalf of Town staff, I am pleased to submit the 2019 Budget to Town Council and the community. The budget includes a
PROPOSED 2018 BUDGET MESSAGE
 PROPOSED 2018 BUDGET MESSAGE August 15, 2017 Honorable Mayor and Town Council Members, Budgets reflect priorities. On behalf of Town staff, I am pleased to submit the Proposed 2018 Budget to Town Council
Town of Castle Rock. Comprehensive Annual Financial Report For the year ended December 31, Excellence Dedication Service
 Town of Castle Rock Comprehensive Annual Financial Report For the year ended December 31, 2008 Excellence Dedication Service 2008 Comprehensive Annual Financial Report For the Year Ended December 31, 2008
Excellence Dedication Service. Town of Castle Rock, Colorado
 Excellence Dedication Service Town of Castle Rock, Colorado 2017 COMPREHENSIVE ANNUAL FINANCIAL REPORT FOR THE YEAR ENDED DECEMBER 31, 2017 2017 Comprehensive Annual Financial Report For the Year Ended
City of Ocala. Fiscal Year Proposed General & Ancillary Funds Budget - Summary. Ocala is a great place to live, play, and prosper
 City of Ocala Fiscal Year 217-218 Proposed General & Ancillary Funds Budget - Summary Ocala is a great place to live, play, and prosper TABLE OF CONTENTS Fiscal Year 217-218 General Fund and Ancillary
City of Ann Arbor Revenue Discussion
 City of Ann Arbor Revenue Discussion Sept. 2017 1 City manages its activities by establishing separate funds for transparency & accountability Enterprise Funds General Fund Water Sewer Storm Water Special
Salt lake City. FISCAL YEAR Budget Summary
 Salt lake City FISCAL YEAR 2012-13 Budget Summary Introduction Preparing a budget for Salt Lake City is a collaborative undertaking that requires the resources of multiple departments and a diverse group
Letter of Transmittal
 Letter of Transmittal October 25, 2019 To: New Hanover Township Board of Supervisors Introduction I am pleased to submit the proposed 2019 Budget for your consideration. The budget document consists of
Re: Lanterns Fiscal Impact Analysis. Background. Analysis Process. June 7, Mr. Scott Carlson Carlson Land PO Box 247 East Lake CO 80614
 June 7, 2013 Mr. Scott Carlson Carlson Land PO Box 247 East Lake CO 80614 Re: Lanterns Fiscal Impact Analysis Dear Mr. Carlson: As per your request, this analysis quantifies the likely fiscal effects of
Quarterly Budget Report
 City of Chicago Quarterly Report 2 nd Quarter Mayor Rahm Emanuel Quarterly Report-2 nd Quarter Content and Purpose This quarterly report presents an overview of the City s operating revenues and expenditures
CITY OF JOPLIN FY 2018 PROPOSED BUDGET
 CITY OF JOPLIN FY 2018 PROPOSED BUDGET CITY OF JOPLIN ESTIMATE OF NEEDS PROJECTED FUND BALANCES FOR FISCAL YEAR 2017-2018 Audited Projected Projected Fund Projected 2016-2017 Activity Fund Projected 2017-2018
City and County of Broomfield, Colorado CITY COUNCIL AGENDA MEMORANDUM,
 , Colorado To: From: Prepared by: CITY COUNCIL AGENDA MEMORANDUM, Mayor and City Council Charles Ozaki, City and County Manager Kevin Standbridge, Deputy City and County Manager Pat Soderberg, Finance
a b c d (c-b) Sept 30, 2015 Cash Balance
 Sept 30, 2015 Cash Balance") Staff Report To: From: Mayor John Muhlfeld and City Councilors Dana Smith, Finance Director Date: October 29, 2017 Re: 1st Quarter Financial Report for Fiscal Year 2018 This quarterly financial report
Staff Report To: From: Mayor John Muhlfeld and City Councilors Dana Smith, Finance Director Date: October 29, 2017 Re: 1st Quarter Financial Report for Fiscal Year 2018 This quarterly financial report
NOTES TO FINANCIAL STATEMENTS
 NOTES TO FINANCIAL STATEMENTS 43 (This page intentionally left blank) 44 NOTE 1. SUMMARY OF SIGNIFICANT ACCOUNTING POLICIES A. Reporting Entity The City of Grand Junction, Colorado (the City) was incorporated
OPERATING BUDGET - REVENUE CONTENTS
 OPERATING BUDGET - REVENUE CONTENTS by Source... C-1 by... C-2 County Property Tax... C-3 ed Property Tax... C-3 Property Tax... C-4 Assessed Valuation & Residential Assessment Rate History... C-4 County
Letter of Transmittal
 Letter of Transmittal November 15, 2017 To: New Hanover Township Board of Supervisors Introduction I am pleased to submit the proposed 2018 Budget for your consideration. The budget document consists of
Table of Contents. Transmittal... i Introduction Executive Overview...1 Organization Chart...7. Community Profile...8. GFOA Budget Award...
 Table of Contents Transmittal... i Introduction Executive Overview...1 Organization Chart...7 Community Profile...8 GFOA Budget Award...18 Budget Calendar...19 How to use this document...20 General Fund
Town of Wellington, Colorado. Financial Statements and Supplementary Information For the Year Ended December 31, 2017
 , Colorado Financial Statements and Supplementary Information For the Year Ended December 31, 2017 < Contents Independent Auditor s Report 1-2 Management s Discussion and Analysis 3-15 Basic Financial
Financial Summaries. Long Range Financial Plan Multi-Year Budget
 Long Range Financial Plan MultiYear Budget 20152018 The City of Novi has long recognized the need for planning to provide quality services to its residents. This is evident in the work performed by the
CITY OF WOODWARD, OKLAHOMA WOODWARD, OKLAHOMA
 WOODWARD, OKLAHOMA ANNUAL FINANCIAL STATEMENTS AND ACCOMPANYING INDEPENDENT AUDITOR'S REPORT FOR THE YEAR ENDED JUNE 30, 2017 The City of Woodward, Oklahoma Table of Contents Year Ended June 30, 2017 INDEPENDENT
City of La Palma Agenda Item No. 4
 City of La Palma Agenda Item No. 4 MEETING DATE: May 15, 2018 TO: FROM: SUBMITTED BY: CITY COUNCIL CITY MANAGER Sea Shelton, Administrative Services Director AGENDA TITLE: Third Quarter Operating Report,
Town of Wellington, Colorado. Financial Statements and Supplementary Information For the Year Ended December 31, 2016
 , Colorado Financial Statements and Supplementary Information For the Year Ended December 31, 2016 Contents Independent Auditor s Report 1-2 Management s Discussion and Analysis 3-15 Basic Financial Statements:
MANAGEMENT S DISCUSSION & ANALYSIS
 MANAGEMENT S DISCUSSION & ANALYSIS Our discussion and analysis of the City of Grand Junction s (the City) financial performance provides an overview of the City s financial activities for the fiscal year
Q Internal Financial Report (Unaudited)
") Q3 2013 Internal Financial Report (Unaudited) Index Financial Commentary... 1 Summary of All City Funds... 7 Second Quarter Year-to-Date Actuals by Fund compared to Current Budget and Prior Year: General
Q3 2013 Internal Financial Report (Unaudited) Index Financial Commentary... 1 Summary of All City Funds... 7 Second Quarter Year-to-Date Actuals by Fund compared to Current Budget and Prior Year: General
River Edge Fiscal Impact Analysis
 Final Report Prepared for: Carbondale Investments Prepared by: Economic & Planning Systems, Inc. EPS #20813 App. N-2 Table of Contents 1. INTRODUCTION AND SUMMARY OF FINDINGS... 1 Summary of Findings...
CITY OF BOYNTON BEACH FY ADOPTED SUMMARY BUDGET
 CITY OF BOYNTON BEACH, FLORIDA CITY OF BOYNTON BEACH FY 2017-2018 ADOPTED SUMMARY BUDGET P a g e 1 46 Boynton Beach Mayor and City Commission Commissioner Joe Casello, Commissioner Christina Romelus, Vice
GENERAL FUND REVENUES BY SOURCE
 BUDGET DETAIL BUDGET DETAIL The Budget Detail gives more information on the budget, than is shown in the Executive Summary. Detail information is provided on the General Fund, Special Revenue Funds, Enterprise
CITY OF SALIDA, COLORADO BASIC FINANCIAL STATEMENTS DECEMBER 31, 2010
 BASIC FINANCIAL STATEMENTS DECEMBER 31, 2010 CITY COUNCIL AND KEY EMPLOYEES December 31, 2010 City Council Charles Rose, Mayor Scott Damman, Councilmember Keith Baker, Councilmember Jim McCormick, Councilmember
Budget Summary. City Organization
 This section has been prepared as a general summary of the 2019-2020 biennial budget for the City of Mercer Island. It is designed to provide City residents and other interested readers with a quick overview
CHAPTER 11: Economic Development and Sustainability
 AGLE AREA COMMUNITY Plan CHAPTER 11 CHAPTER 11: Economic Development and Sustainability Economic Development and Sustainability The overall economy of the Town and the Town government s finances are inextricably
Capital Improvement Program Fund
 Capital Improvement Program Fund The Capital Improvement Program Fund provides funding for streets, public buildings (both governmental and school facilities), land, and other capital assets. Capital Improvement
CITY OF STURGIS, MICHIGAN FINANCIAL REPORT WITH SUPPLEMENTAL INFORMATION SEPTEMBER 30, 2017
 , MICHIGAN FINANCIAL REPORT WITH SUPPLEMENTAL INFORMATION SEPTEMBER 30, 2017 TABLE OF CONTENTS Independent Auditor's Report 1 2 PAGE Management s Discussion and Analysis 3 12 Basic Financial Statements
SALT LAKE CITY BUDGET SUMMARY. Fiscal Year
 INTRODUCTION Preparing a budget for Salt Lake City is a collaborative undertaking that requires the resources of multiple departments and a diverse group of professionals all dedicated to making Salt Lake
Fiscal Year Proposed Annual Budget
 Fiscal Year 2017 18 Proposed Annual Budget FUND General $ 14,431,889 $ 14,875,896 $ 17,241,548 $ 16,199,841 Debt Service 6,972,348 3,846,082 3,846,082 3,841,820 Economic Development 8,653,771 2,647,587
Council Communication August 2, 2016, Business Meeting
 Council Communication August 2, 2016, Business Meeting 4th Quarterly Financial Report of the 2015-17 Biennium FROM: Lee Tuneberg, Administrative Services/Finance Director, tuneberl@ashland.or.us BACKGROUND
CITY OF TWIN FALLS, IDAHO
 FINANCIAL STATEMENTS SEPTEMBER 30, 2008 FINANCIAL STATEMENTS TABLE OF CONTENTS INDEPENDENT AUDITOR'S REPORT 1-2 FINANCIAL STATEMENTS Government-Wide Financial Statements 3 Statement of Net Assets 4 Statement
Monthly Financial Report. Citywide Revenue, $26.1 million (7.9% of the total annual budget
 SnapShot Citywide Revenues & Expenditures General Fund Revenues & Expenditures Capital Projects Tax Totals & Comparison Geo Codes & Sales Tax SIC Sales Tax Collections 2-3 4 5 6-7 8-9 10 Lodging Tax 11
FINANCIAL REPORT. Report o verv. ~ ~~W - August General Fund Governmental Capital Fund. Water Fund Sewer Fund
 ~,.;!\.city~~---.'. _. T1i~~rl)~on -.,-' ''"---,--~ ~-- Report o verv. ~ ~~W - FINANCIAL REPORT ~:-----~ ;-;;:.-. '. August 2018 General Fund Governmental Capital Fund Water Fund Sewer Fund Thornton Development
2017 Preliminary Operating and Capital Budgets. November 22, 2016
 2017 Preliminary Operating and Capital Budgets November 22, 2016 1 Overview Budget Consultation Public Engagement Multi Year Budget View Budget Priorities Preliminary Operating and Capital Budgets Future
2017 Mid-Year Financial Report
 2017 Mid-Year Financial Report BACKGROUND The mid-year report provides information regarding the City of Regina s (City) financial performance. This report provides a high level summary on how the City
FY 16 - FY 18 Capital Fund Revenues
 FY 16 - FY 18 Capital Fund Revenues Fiscal Year $ Change 2016 2017 2018 FY 17 to Revenue Source Budget Budget Budget FY 18 Local Transfer from General Fund $3,136,950 $2,977,556 $6,087,130 $3,109,574 Local
FISCAL YEAR FINANCIAL REPORT Quarter Ended June 30, 2015
 FISCAL YEAR 2014-2015 FINANCIAL REPORT Quarter Ended June 30, 2015 To: From: City Manager, Mayor and City Council Rebecca Underhill, Finance Director Subject: Financial Report for Quarter Ended June 30,
City of Phoenix, Arizona. Monthly Financial Report
 City of Phoenix, Arizona Monthly Financial Report March 212 Monthly Financial Report March 212 Executive Summary The budget amounts in this report represent the official adopted budget, as approved by
BASIC FINANCIAL STATEMENTS
 BASIC FINANCIAL STATEMENTS COUNTY OF WELD Statement of Net Assets December 31, 2008 Primary Government Governmental Business-type Activities Activities Total Component Units Housing Authority E-911 Authority
Section E. Recap By Fund. Table of Contents
 Section E. Recap By Fund Table of Contents Fund # Fund Name Page # General Purpose Funds 001 General Fund... E-3 037 Self-Insurance Claim Reserve... E-9 061 Youth Services Endowment Fund... E-11 Special
SnapShot. March Monthly Financial Report. Sales / Use Tax Basics. City of Loveland 500 East 3rd Street Loveland, CO (970)
") SnapShot Citywide Revenues & Expenditures 2-3 General Fund Revenues & Expenditures 4 Capital Projects 5 Monthly Financial Report Citywide Revenue, 76.1 million (20.2% of the total annual budget) Sales
SnapShot Citywide Revenues & Expenditures 2-3 General Fund Revenues & Expenditures 4 Capital Projects 5 Monthly Financial Report Citywide Revenue, 76.1 million (20.2% of the total annual budget) Sales
Quarterly Budget Report
 City of Chicago Quarterly Report 1st Quarter Mayor Rahm Emanuel Quarterly Report-1st Quarter Content and Purpose This quarterly report presents an overview of the City s operating revenues and expenditures
2018 Five Year Financial Plan
 2018 Five Year Financial Plan Five Year Financial Plan City of Pittsburg, Kansas May 19, 2018 Introduction: It is the role of the City Commission and the City s management staff to find ways to not just
July Financial Report September 4, 2018
 Financial Report September 4, 2018 Overview The monthly financial report is directed at providing a snapshot of the General Fund revenues and expenditures, as well as other important financial information,
FY 2016 FY 2020 Capital Improvement Program (CIP) Executive Summary
 Executive Summary") FY 2016 FY 2020 Capital Improvement Program (CIP) Executive Summary The adopted FY 2016 FY 2020 CIP is $205.3 million (including prior year expenditures) and is $2.9 million lower than the previous CIP
FY 2016 FY 2020 Capital Improvement Program (CIP) Executive Summary The adopted FY 2016 FY 2020 CIP is $205.3 million (including prior year expenditures) and is $2.9 million lower than the previous CIP
2013 BUDGET. Photo by D.J. Hannigan
 PARK Park COUNTY County, GOVERNMENT Colorado 2013 BUDGET Photo by D.J. Hannigan 2013 Budget Land & Water Support Business Dev & Tourism Health & Human Svcs Public Safety Roads Staff & Buildings The Many
BUDGET TRACKING REPORT
 To: Mayor and City Council From: Charles Ozaki, City and County Manager Prepared by: Kevin Standbridge, Deputy City and County Manager Pat Soderberg, Finance Director Joyce Alberts, Budget Manager Valerie
ST. PETERSBURG ClTY COUNCIL
 ST. PETERSBURG ClTY COUNCIL Meeting of November 24, 2014 TO: SUBJECT: City Council Chair and City Council Members An Ordinance Enacting Year-End Appropriation Adjustments -FY14 Operating Budget & Capital
2019 Operating & Capital Budget. November 26, 2018 City Council Meeting
 2019 Operating & Capital Budget November 26, 2018 City Council Meeting Expenditures by Function Total 2019 Operating & Capital Budget $84,143,970 Expenditures by Function Parks & Recreation 5% Street/Sanitation/
Vision, Mission, Values and Critical Success Factors
 Approved Budget Vision, Mission, Values and Critical Success Factors The City of Tallahassee, through workshops, surveys and commission retreats has developed the following vision, mission, and target
GENERAL FUND Revenues
 GENERAL FUND Revenues The General Fund is used to account for general purpose revenues, which are used to fund general governmental services, excluding utilities. Following are descriptions of the City's
CAPITAL FUNDS 2015 Budget
 CAPITAL FUNDS This section provides comparisons of revenues and expenditures/appropriations for all capital funds for 2014 2016, the 2017 budget, and the 2018 2022 plan. Historical fund balances and the
CITY OF MIAMI INTER OFFICE MEMORANDUM. TO: Honorable Mayor and Members DATE: May 23, 2016 of the City Commission
 INTER OFFICE MEMORANDUM TO: Honorable Mayor and Members DATE: May 23, 2016 of the City Commission FROM: Christopher Rose, Director SUBJECT: FY 2015 16 End of Year Office of Management and Projections based
FY 08/09 ADOPTED GENERAL FUND REVENUES $224,391,325
 GENERAL FUND REVENUES FY 08/09 ADOPTED GENERAL FUND REVENUES $224,391,325 State Revenue 10% Transfers 1% Federal Revenue 2% Fund Balance 0.2% Other Local Revenue 3% Other Local Taxes 22% Gen. Property
Financial Performance Report for the year ending December 31, 2010
 , Colorado QUARTER 4, 2010 Financial Performance Report for the year ending December 31, 2010 Important note: The data contained in this report is unaudited and not considered final. The figures represent
FUND STATUS FY 2017/18. As of December 31 st
 FUND STATUS FY 2017/18 As of December 31 st Enhance the quality of life in the City by delivering public services in a knowledgeable, responsive and financially responsible manner. Explanation of Tables
Town of Flower Mound Town Council. Town Administration
 Town of Flower Mound Town Council Melissa D. Northern Mayor Kendra Stephenson Place 1 Mark Wise Place 3 Tom Hayden Place 5 Al Filidoro Mayor Pro Tem Place 2 Steve Lyda Deputy Mayor Pro Tem Place 4 Town
FY PROPOSED ANNUAL BUDGET
 CITY OF ENNIS, TX FY 2016-2017 PROPOSED ANNUAL BUDGET PREPARED BY THE ADMINISTRATION DEPARTMENT RANDALL SCOTT DIXON, CITY MANAGER REVISED 08/19/2016 CITY OF ENNIS SUMMARY OF DEDUCTIONS BY FUND FY2016-17
Financial Status Report
 Financial Status Report Month of December, 2018 Prepared by: Deborah Barber, CFO 1 Executive Summary Fund Balance As of December 31, 2018 - Preliminary/Unaudited 50.0% of the Fiscal Year Has Elapsed Year
TOWN OF LAKE LURE Office of the Town Manager
 TOWN OF LAKE LURE Office of the Town Manager Incorporated 1927 TO: FROM: Mayor and Commissioners Chris Braund DATE: RE: Budget Message and Proposed Budget for Fiscal Year 2012-2013 In accordance with Sections
TOTAL GENERAL FUND REVENUES
 General Fund Revenues Budget Actual Actual Budget Actual Actual FY 2018 12-31-2017 12-31-2016 FY 2018 12-31-2017 12-31-2016 GENERAL PROPERTY TAXES: NON-CATEGORICAL AID: Current Real Estate Taxes 10,400,000
CITY OF EL PASO CITY MANAGER
 CITY OF EL PASO CITY MANAGER The Community El Paso is a city on the move! Located in far west Texas and on the border with Mexico, El Paso is known for being a leader in international trade. The City is
City of Mercer Island. Section C Budget Summary
 City of Mercer Island Section C Budget Summary This section has been prepared as a general summary of the 2017-2018 biennial budget for the City of Mercer Island. It is designed to provide City residents
Revenues. FY2018 Total County Revenue Sources. (Note: Excludes Operating Transfers In) Other Localities 2.8% Misc 0.7%
 Other Localities 2.8% Misc 0.7%") All Funds Revenue Summary FY2018 Total County Revenue Sources (Note: Excludes Operating Transfers In) Misc 0.7% Other Localities 2.8% Use of Money & Prop 0.7% Fines & Forfeit 0.1% Charges For Serv 13.2%
All Funds Revenue Summary FY2018 Total County Revenue Sources (Note: Excludes Operating Transfers In) Misc 0.7% Other Localities 2.8% Use of Money & Prop 0.7% Fines & Forfeit 0.1% Charges For Serv 13.2%
City of DeSoto. Memo. Date: VVednesday, August11, 2011 ~~ Dr. Tarron Richardson, City Manager t/ To: Eden a Atmore, Assistant Director of Finance
 Memo Date: To: From: Subject: City of DeSoto VVednesday, August11, 2011 ~~ Dr. Tarron Richardson, City Manager t/ Eden a Atmore, Assistant Director of Finance July 2011 Financial Reports Attached are the
Ten-Year Capital Improvement Program (CIP)
") Ten-Year Capital Improvement Program (CIP) 1 Introduction to CIP Buildings, infrastructure, technology, and major equipment are the physical foundation for providing services to constituents. Capital planning
Ten-Year Capital Improvement Program (CIP) 1 Introduction to CIP Buildings, infrastructure, technology, and major equipment are the physical foundation for providing services to constituents. Capital planning
Allocated Costs A method for allocating overhead time and other expenses to activities that provide direct services.
 Accounting System - The total set of records and procedures used to record, classify, and report information on the financial status and operations of an entity. Accrual A method of accounting that matches
FY 2018 FY 2022 Capital Improvement Program (CIP) Executive Summary
 Executive Summary") FY 2018 FY 2022 Capital Improvement Program (CIP) Executive Summary The adopted FY 2018 FY 2022 CIP is $138 million (including prior year expenditures) and is $100 million lower than the previous CIP due
FY 2018 FY 2022 Capital Improvement Program (CIP) Executive Summary The adopted FY 2018 FY 2022 CIP is $138 million (including prior year expenditures) and is $100 million lower than the previous CIP due
Monthly Financial Report
 SnapShot Citywide Revenues & Expenditures 2-3 Monthly Financial Report General Fund Revenues & Expenditures Capital Projects Tax Totals & Comparison Geo Codes & Sales Tax SIC Sales Tax Collections 4 5
CITY OF AURORA. Budget in Brief. Prepared by the Office of Budget and Financial Planning City of Aurora, Colorado
 CITY OF AURORA 2010 Budget in Brief Prepared by the Office of Budget and Financial Planning City of Aurora, Colorado 2010 BUDGET ACKNOWLEDGEMENTS City Council Edward J. Tauer... Mayor Bob FitzGerald Mayor
Village of North Palm Beach Budget-in-Brief
 of North Palm Beach -in-brief Fiscal Year 2018-2019 At a Glance Date of Incorporation August 13, 1956 Fiscal Year October 1 September 30 Form of Government Council/Manager Area 5.8 square miles Population
ORDINANCE AN ORDINANCE TO LEVY TAXES AND ESTABLISH A MUNICIPAL BUDGET FOR THE FISCAL YEAR BEGINNING JULY
 ORDINANCE AN ORDINANCE TO LEVY TAXES AND ESTABLISH A MUNICIPAL BUDGET FOR THE FISCAL YEAR BEGINNING JULY 1, 2013 and ENDING JUNE 30, 2014, AND A CAPITAL IMPROVEMENT PROGRAM FOR FISCAL YEAR 2014 2016. WHEREAS,
Monthly Financial Report
 SnapShot Citywide Revenues & Expenditures General Fund Revenues & Expenditures Capital Projects Tax Totals & Comparison Geo Codes & Sales Tax SIC Sales Tax Collections 2-3 4 5 6-7 8-9 10 Lodging Tax 11
General Fund Overview. General Fund Summary General Fund Revenues General Fund Expenditures
 General Fund Overview General Fund Summary General Fund Revenues General Fund Expenditures 113 GENERAL FUND SUMMARY BEGINNING FUND BALANCE $ 4,973,719 $ 5,515,205 $ 4,170,154 $ 7,012,255 $ 6,202,700 REVENUE
Mayor Donahue called the Meeting to Order at 6:00 pm Time Speaker Note. Appointment to Utilities Commission
 Description Regular Meeting of the Castle Rock Town Council held October 25, 2011 at 100 N. Wilcox St. Castle Rock, Colorado. Mayor Donahue called the Meeting to Order at 6:00 pm Time Speaker Note 6:00:48
LEADING THE WAY CHART ORGANIZATIONAL
 LEADING THE WAY COUNCILOR JOHNNIE PARKS AT LARGE VICE MAYOR RICHARD CARTER WARD 1 THE CITY OF BROKEN ARROW operates under a Council-Manager form of government. The City Council hires the City Manager,
CITY OF DURAND, MICHIGAN
 ANNUAL FINANCIAL REPORT with Supplementary Information FOR THE YEAR ENDED JUNE 30, 2016 TABLE OF CONTENTS JUNE 30, 2016 Page Number Independent Auditor's Report 1 Management s Discussion and Analysis 3
2010 ADOPTED BUDGET IN BRIEF
 2010 ADOPTED BUDGET IN BRIEF 2010 Total Expenditures $29,054,040 (excluding transfers) General $23,891,701 Recreation Center $2,360,597 Open Space $1,485,287 Capital Investment Program $1,350,000 Conservation
Submitted herewith is the adopted operating budget for fiscal year
 To the Residents of Pasadena: Submitted herewith is the adopted operating budget for fiscal year 2009-2010. The economic uncertainty which has plagued our nation for much of the past year had a negative
Economic Update 3 General Fund Update 4 Water / Wastewater Funds Update 6 Cultural Services Fund Update 7 Recreation Fund Update
 City of Aurora COLORADO FINANCIAL PERFORMANCE REPORT FOR QUARTER ENDING JUNE 30, City of Aurora Financial Performance Report Second Quarter Released July 19, Page 1 Issued by the Office of and Financial
This Page Left Blank Intentionally
 Glossary This Page Left Blank Intentionally ACCOUNT - A grouping of transactions which have similar characteristics. Taxes would be an example of a revenue account. ACCOUNT NUMBER - A five-digit number
City Manager E. Alameda Parkway, Aurora, CO 80012
 City Manager 15151 E. Alameda Parkway, Aurora, CO 80012 The Community Aurora is Colorado s third largest city and the safest large city in Colorado spanning three counties in the eastern Denver-Aurora
CITY FLORIDA REPORT COUNCIL (MARCH 2017) LITA MANAGER BMC R 30, 2016 MIKE BRADY NC.
 LITA MANAGER BMC R 30, 2016 MIKE BRADY NC.") CITY OF DEBARY, FLORIDA ANNUAL FINANCIAL REPORT FOR THE FISCAL YEAR ENDED SEPTEMBER R 30, 2016 CITY COUNCIL (MARCH 2017) BOB GARCIA, MAYOR LITA HANDY-PETERS, VICE MAYOR STEPHEN BACON ERIKA BENFIELD MIKE
CITY OF DEBARY, FLORIDA ANNUAL FINANCIAL REPORT FOR THE FISCAL YEAR ENDED SEPTEMBER R 30, 2016 CITY COUNCIL (MARCH 2017) BOB GARCIA, MAYOR LITA HANDY-PETERS, VICE MAYOR STEPHEN BACON ERIKA BENFIELD MIKE
CITY OF APACHE JUNCTION SUMMARY SCHEDULE OF ESTIMATED REVENUES AND EXPENDITURES FISCAL YEAR 2009/2010 ESTIMATED DIRECT REVENUES
 SUMMARY SCHEDULE OF ESTIMATED REVENUES AND EXPENDITURES ESTIMATED DIRECT REVENUES ADOPTED UNRESERVED PROPERTY OTHER THAN OTHER FUNDING TOTAL ADOPTED BUDGETED ACTUAL FUND TAX PROPERTY SOURCES RESOURCES
Village of Harrisville Dissolution Study
 Village of Harrisville Dissolution Study Alternatives to Existing Conditions - Services August 15, 2017 Visit the website: www.danc.org/operations/engineering/village-harrisville-dissolution-study Alternatives
Budget in Brief Proposed City Commission Budget FY 2017
 City of Treasure Island Budget in Brief Proposed City Commission Budget FY 2017 Where charm meets contemporary All Funds Budget Summary Total Proposed Budget Budget % Fund FY 2016 FY 2017 Change General
CITY OF MONTE VISTA, COLORADO 2008 BUDGET
 CITY OF MONTE VISTA, COLORADO 2008 MAYOR DONALD K. SCHALL CITY COUNCIL JOSE ART MEDINA, MAYOR PRO-TEM ROSE WILSON GABE DURAN WILLIAM SPICER TABLE OF CONTENTS SECTION 1 TRANSMITTAL MESSAGE 1-8 CITY OF MONTE
City of Niles Berrien County, Michigan FINANCIAL STATEMENTS. September 30, 2012
 Berrien County, Michigan FINANCIAL STATEMENTS September 30, 2012 TABLE OF CONTENTS September 30, 2012 Page INDEPENDENT AUDITOR S REPORT MANAGEMENT S DISCUSSION AND ANALYSIS i-ii iii-xi BASIC FINANCIAL
City of Aurora, Colorado FINANCIAL PERFORMANCE REPORT SECOND QUARTER. Prepared by the Office of Budget and Financial Planning
 City of Aurora, Colorado 214 FINANCIAL PERFORMANCE REPORT SECOND QUARTER Released July 23, 214 Prepared by the Office of and Financial Planning Table of Contents Economic Update 3 General Fund Update 4
2017 General Fund Operating Budget
 2017 General Fund Operating Budget November 17, 2016 2017 GENERAL FUND OPERATING BUDGET TABLE OF CONTENTS Page Introduction... 1 Challenges Facing the Park District in 2017 and Beyond... 1 Priorities of
CITY OF ST. PETERSBURG FISCAL YEAR 2013 ADOPTED OPERATING BUDGET & CAPITAL IMPROVEMENT PROGRAM
 CITY OF ST. PETERSBURG FISCAL YEAR 2013 ADOPTED OPERATING BUDGET & CAPITAL IMPROVEMENT PROGRAM City of St. Petersburg Budget I. FUND SUMMARIES General Fund (0001) 1 Preservation Fund (0002) 4 Industrial
3 YEAR BUDGET FORECAST
 3 YEAR BUDGET FORECAST City of Fairview Heights, IL FISCAL YEARS: 2014 2015 2015 2016 2016-2017 Report Date: 6/20/2013 07/03/2013 Page 1 of 16 Revenue Forecast The City of Fairview Heights is a fiscally
DEVELOPMENT CHARGES BACKGROUND STUDY
 DEVELOPMENT CHARGES BACKGROUND STUDY Town of Innisfil C o n s u l t i n g L t d. July 19, 2018 TABLE OF CONTENTS EXECUTIVE SUMMARY... 1 I PURPOSE OF THE DEVELOPMENT CHARGES BACKGROUND STUDY... 6 A. INTRODUCTION