ANNUAL FI NANC IAL PL AN
|
|
|
- Tracy Sanders
- 5 years ago
- Views:
Transcription

1 ANNUAL FI NANC IAL PL AN

2 Annual financial plan for the city of burnaby Produced by the Finance Department at the City of Burnaby, in cooperation with all civic departments, offices and agencies. Designer: Carolyn Pang City of Burnaby, British Columbia, Canada
3 Contents Burnaby at a Glance The Local Setting Demographic Profile Organization and Structure Executive Summary Social Sustainability and Direction Five Strategic Objectives Operating Plan Five Year Operating Summary Provision from General Revenue to Departments Tax Levy for City Services Graphical Distribution of Expenditures and Source of Revenue City Council City Manager Engineering Finance Planning and Building Parks, Recreation and Cultural Services Fiscal Items Tax Levies for Other Taxing Authorities and Utilities Revenue & Expenditure Summary Summary Details - Revenue Details - Expenditure Capital Program Five Year Summary Capital Program Summary by Director

4 4 City of Burnaby Annual financial plan Message From the Mayor My vision for Burnaby as a Creative City continues to grow as we commit to pursuing innovative and imaginative opportunities to support the growth, development and sustainability of our City. This unwavering commitment has resulted in the completion of many successful initiatives and the launch of several new programs and plans for. One of our greatest achievements this year is our Social Sustainability Strategy, the roadmap that builds on the City s goal of becoming a sustainable community through the implementation of a trilogy of Economic, Social and Environmental sustainability strategies. Burnaby, as a sustainable City, will continue strengthening its overall well-being, enhancing our status as a livable, vibrant and sustainable community and becoming a place that facilitates an engaged and active citizenry, a healthy economy and a strong respect for the natural environment. In February, the Federation of Canadian Municipalities honoured the City of Burnaby and SFU Community Trust with the Sustainable Communities Award in the inaugural category of Integrated Neighbourhood Development, which recognizes excellence in environmental responsibility. Most recently, the Canadian Institute of Planners selected UniverCity Community for the Award for Planning Excellence in the category of Neighbourhood Planning. The SFU Community Trust will formally receive this award at the CIP Conference in St. John s Newfoundland on July 11,. Burnaby s financial position remains very strong, boding well for the future of our businesses and citizens. Debt-free and with a relatively low taxation rate, we are the rock solid foundation for business in our community. Our financial reserves, which are in excess of 518 million and a result of our prudent financial practices, are the envy of cities across Canada. In fact, recent accounting changes have required all cities to follow the same kind of methodology that we use in order to assess their long-term financial health. Due to the fact that we only borrow internally, we have the flexibility to react quickly in any situation. For instance, the recent economic downturn has given us the opportunity to advance major civic building projects, such as the projected 43 million investment for a new Edmonds Aquatic and Community Centre.

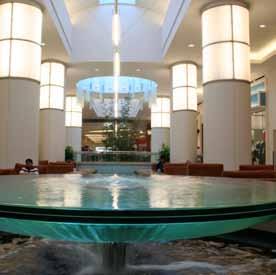
5 Annual financial plan City of Burnaby 5 The City has entered the construction stage of the new Edmonds Aquatic and Community Centre to be located on the existing Eastburn site in Richmond Park. This new facility which was designed based on a community-focused consultative design process will have a six-lane pool, two gyms and a 7,500 square foot exercise facility. Concept plans have also been completed for a community plaza at Richmond Park. The impressive new clubhouse at Riverway Golf Course celebrated its grand opening in April. The building is approximately 11,500 square feet and has a west coast design, making extensive use of wood and stone elements that integrate beautifully with the surrounding buildings and landscape. The building has a restaurant/mixed grill and bar and lounge services that can be converted into banquet facilities to accommodate up to 225 guests. This will enable the facility to host tournaments, banquets and other special functions. Another significant initiative is the Virtual City Hall project, which will provide citizen-centered services through a new internet design that enhances the citizen experience and the opportunity for online business services. The design for the new website is framed around three strategic pillars ( find, do and engage ) which focus on: enabling easy access to information; providing systems to conduct routine business transactions online; and engaging with both resident and business audiences. We ll launch this new site early this fall. I am honoured to be the Mayor of the City of Burnaby, proud of our many achievements and anticipating an exceptional for Burnaby citizens and businesses. I look forward to working with you in the coming year, as we launch many important new programs that will help enhance Burnaby s status as a creative, innovative, sustainable City. On behalf of Council, thank you for your role throughout the year in making Burnaby a great place to live, work, learn, play and do business.

6 Burnaby at a Glance
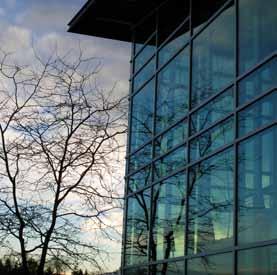
7 ANNUAl financial plan City of Burnaby 7 The Local Setting 1892 Burnaby was incorporated in 1892 and achieved city status in 1992, one hundred years after incorporation. In the first 30 to 40 years after its incorporation, the growth of Burnaby was influenced by its location between expanding urban centres of Vancouver and New Westminster. It first served as a rural agricultural area supplying nearby markets. Later, it served as an important transportation corridor between Vancouver, the Fraser Valley and the interior of the Province. 92 Square Kilometres Burnaby occupies 36 square miles (92 square kilometres) and is located at the geographic centre of Metro Vancouver. Situated between the City of Vancouver on the west and Port Moody, Coquitlam and New Westminster on the east, the City is further bounded by Burrard Inlet and the Fraser River on the north and south respectively. Burnaby, Vancouver and New Westminster collectively occupy the major portion of the Burrard Peninsula. The elevation of Burnaby ranges from sea level to a maximum of 1,200 feet (370 m) atop Burnaby Mountain. Overall, the physical landscape of Burnaby is one of hills, ridges, valleys and an alluvial plain. The land features and their relative locations have had an influence on the location, type and form of development in the City. 223,000 While Burnaby occupies about 4 percent of the land area of Metro Vancouver, it accounted for about 9.6 percent of the Region s population in It is the third most populated urban centre in British Columbia with a total population of 223,000 as per estimates from BC Stats in Debt Free Burnaby is a mature, increasingly integrated community. Due to its central position within Metro Vancouver, it is in an excellent position to keep capturing significant shares of new high quality commercial and industrial development that generate employment and other economic benefits. The City now features high density residential areas, major commercial town centre development, rapid transit, high technology research and business parks, comprehensive industrial estates and major post-secondary institutions. It has a responsive City government comprised of a committee system with citizen representation on many committees. Burnaby is proud to be one of a few debt-free cities in the province which is a testament to the City s sound financial policies and practices. Clockwise from top left: View from Burnaby Mountain British Columbia Institute of Technology Library Entrance to Simon Fraser University Glenlyon Business Park

8 Aerial view of Greater Vancouver Regional District

9 Annual financial plan City of Burnaby 9 Demographic ProFIle The City at Large This section includes statistical information related to Burnaby s population and residents. Burnaby is the third most populated urban centre in British Columbia with a total population of 223,000 as per estimates from BC Stats in Industry & Employment As per the Statistics Canada Census, Burnaby had an experienced labour force of 109,545 in 2006; Burnaby has above-average strength in utilities, recreation, construction, wholesale and retail trade, manufacturing, education and other services. Burnaby is at or near the regional average in real estate, administration and technical industries. Head or regional offices of a number of major employers are located in Burnaby including telus, Metro Vancouver, Simon Fraser University, and British Columbia Institute of Technology. In recent years, Burnaby has developed as the high tech centre of the Metro Vancouver area and is home to companies such as Electronic Arts, PMC Sierra, Ballard Power Systems, Kodak, Spectrum Signal Processing, IBM and many more. Burnaby is also emerging as a major film industry centre and has more than 52 percent of the sound stages in the Lower Mainland. Housing Mix Burnaby has a full range of housing forms, each in a variety of settings ESTIMATE OF DWELLING UNITS SINGLE FAMILY 45% T/HOUSES 9.3% LOW RISE 27% HIGH RISE 18.7% % 20 40

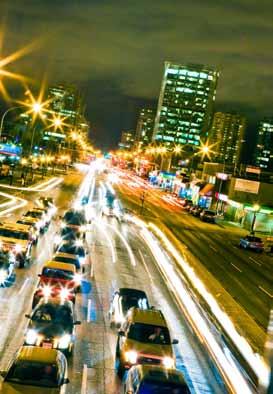
10 Commercial and Retail Burnaby s Metrotown Retail and Entertainment Complex is BC s largest shopping complex with more than 500 shops, restaurants and services, 22 cinemas and the Metropolis Entertainment Centre. Lougheed and Brentwood Malls, located in north Burnaby along the new Millennium SkyTrain line, also contain a wide range of shops and services. The Heights neighbourhood in north Burnaby offers more of a traditional street-front shopping atmosphere with a colourful mix of individually owned and operated shops, restaurants, cafes and services catering to residents and visitors. Metropolis at Metrotown

11 Education and Health Services The City has two post-secondary institutions, Simon Fraser University and British Columbia Institute of Technology. Burnaby also has 40 elementary schools and 8 secondary schools with a total enrolment of 24,000 students. Burnaby Hospital is one of the region s major health centres with 309 acute care beds and a variety of other patient care services. Simon Fraser University

12 Parks and Open Space Parks and open spaces serve essential roles in the preservation of our natural environment and ecosystems, meeting community needs for recreation and leisure activities, and supporting the quality of life in Burnaby. As Burnaby s population and urban areas continue to grow, parks and open spaces will become increasingly valuable community assets. Currently, about 24.7% of the City s land area is devoted to green space. Other parks and open spaces include neighbourhood and district parks, school playing fields, urban plazas and botanical gardens. The City was the 1996 recipient of the Communities in Bloom Award for Canadian communities with populations between 100,000 and 300,000. In addition, Burnaby recognizes the need for the planning and management of parks and open spaces to protect environmental attributes. Burnaby was the 1992 and 1996 recipient of the Provincial Minister s Environmental Award for municipalities in BC. Riverway Golf Course

13 The City s parks and open spaces offer kilometres of walking, hiking and cycling trails and include: Burnaby Mountain Park Deer Lake Park Central Park Trans Canada Trail BC Parkway Barnet Marine Park Burnaby Lake Regional Nature Park Central Valley Greenway The City has two public golf courses: Burnaby Mountain Golf Course and Riverway Golf Course. The City's golf infrastructure has significantly improved with the recent construction of a new 60-stall driving range at Burnaby Mountain and a spectacular new clubhouse at Riverway.

14 Recreational facilities The City has a number of recreation and leisure centres, swimming pools, ice rinks and playing fields (including several artificial turf fields) throughout the City, and offers a wide range of programs through its Parks, Recreation and Culture Commission. The City s Swangard Stadium is home to outdoor giant screen movie nights, Kabbadi tournaments, and celebrations such as the Fiji Festival are bringing people to the Stadium, along with traditional events like the BC High School Track & Field Championships, the 24-hour relay and the Harry Jerome Track Classic. In, the Bill Copeland Sports Centre saw the completion of a new wood sports floor, providing a premium playing surface for lacrosse, and the opportunity to attract a greater range of events, such as basketball, martial arts, badminton, table tennis, gymnastics, trade shows and other dry-floor activities all year round. The Bill Copeland Sports Centre is also home to the Burnaby Lakers lacrosse team. Swangard Stadium

15 Arts, Heritage and Culture Burnaby has a number of arts, heritage and cultural facilities. The Burnaby Village Museum and Carousel is an open air museum depicting life in the early 20th Century that features a town street with shops, homes and costumed interpreters, a farmhouse and the C W Parker Carousel. The City is celebrating the 40th anniversary of the Museum by providing free admission for the season. Approximately 140,000 visitors attended Burnaby Village Museum in 2010; the goal is to increase this number to more than 300,000 for this anniversary year. The Shadbolt Centre for the Arts is the City's 47,000 square foot multi-purpose community arts facility, which houses studios for dance, visual arts, ceramics, music and theatre classes. It is home to Burnaby's signature music event, the Burnaby Blues and Roots Festival, and many free festivals such as the Rhododendron Festival, Symphony in the Park, Discovery Day Festival and Seasonal Celebration. Carousel at Burnaby Village Museum


16 Embracing Diversity: Sharing Our Songs and Rhymes is a public education project, undertaken by Burnaby Public Library on behalf of the Burnaby Intercultural Planning Table, that encourages learning about cultural diversity and promotes inclusiveness. The project invites Burnaby as well as other communities to explore their diversity and share across cultures through children's songs and rhymes. It was created to help build neighbourhoods where everyone, regardless of where they are from, is better understood and respected and has a greater sense of belonging. Embracing Diversity resources are designed for use by community workers who serve children and families, by families themselves, and by all who endeavour to create welcoming and inclusive communities. Visit for more information.

17 Libraries Burnaby Public Library (BPL) serves the community from four branches and offers a mobile service for those residents who are homebound or who have a visual impairment. The Bob Prittie Metrotown Branch, opened in 1991, is considered the central branch. The McGill Branch, redeveloped in 2001, serves the Brentwood Town Centre and houses the City of Burnaby s Archives. The Cameron Branch, opened in 1980, serves the Lougheed Town Centre and is located in the Cameron Recreation Centre. Burnaby s newest branch, the Tommy Douglas Library, serves the Edmonds Town Centre and celebrated its first full year of operation on November 20. This branch has proven very popular with the public use of the branch has increased more than 34%. The key priorities for include expanding My First Language Kits, completing the Embracing Diversity project, and continuing to purchase materials that contribute to the depth and breadth of the Library's collections, including adult books in Chinese, Farsi, French, Korean, and Spanish. Plans for also include completing the implementation of BiblioCommons, the Library's new discovery tool and launching an application to provide access to the library catalogue via a mobile device. Tommy Douglas Library
18 18 City of Burnaby Annual financial plan THE CITIZENS OF BURNABY BURNABY ELECTORATE COUNCIL Mayor D.R. Corrigan P. Calendino C. Jordan R. Chang A. Kang COUNCILLORS S. Dhaliwal P. McDonell D.N. Johnston N.M. Volkow Advisory Planning Commission Community Heritage Commission ADVISORY BODIES APPOINTED BY COUNCIL Environmental Sustainability Strategy Steering Committee Executive Committee of Council Environment Committee Social Issues Committee MANAGER S OFFICE CITY MANAGER * R.H. Moncur FIRE CHIEF * B. Cook O.I.C. R.C.M.P. * R. Taylor CHIEF LIBRARIAN * M.E. Toner-Rogala EXECUTIVE BODIES APPOINTED BY COUNCIL Board of Variance Parks, Recreation & Cultural Commission Public Library Board Community Policing Committee Mayor s Task Force on Graffiti Social Sustainability Strategy & Steering Committee Finance & Civic Development Committee Community Development Committee Traffic Safety Committee Transportation Committee Simon Fraser Liaison Committee HUMAN RESOURCES DIRECTOR K. Munro ERP PROJECT PROGRAM MANAGER M. Schmidt ASSISTANT DIRECTOR HUMAN RESOURCES S. Bahry ASSISTANT PROGRAM MANAGER P. Tennant ENGINEERING DIRECTOR * L.S. Chu FINANCE DIRECTOR * D. Jorgenson DEPUTY CITY MANAGER * C.A. Turpin DEPUTY CITY MANAGER * R.A. Earle PLANNING & BUILDING DIRECTOR * B. Luksun PARKS, RECREATION & CULTURAL SERVICES DIRECTOR * D. Ellenwood DEPUTY DIRECTOR B.C. Davis ASSISTANT DIRECTOR DEVELOPMENT SERVICES & INFRASTRUCTURE PLANNING L. Bjorseth ASSISTANT DIRECTOR ENGINEERING ENVIRONMENTAL SERVICES D. Dattani ASSISTANT DIRECTOR ENGINEERING FACILITIES MGMT T. Ng ASSISTANT DIRECTOR TRAFFIC & ENGINEERING SYSTEMS D. Louie DEPUTY DIRECTOR B. Klimek ASSISTANT DIRECTOR FINANCIAL SERVICES (vacant) ASSISTANT DIRECTOR FINANCIAL PLANNING & CAPITAL EQUITY R. Tan ASSISTANT DIRECTOR TREASURY SERVICES (vacant) CHIEF INFORMATION OFFICER B. Sameshima CHIEF LICENCE INSPECTOR C.M. Collis PURCHASING MANAGER G. Caron RISK MANAGER M. Fitz-Gerald CITY CLERK D.R. Comis CITY SOLICITOR B.R. Rose ADMINISTRATOR CITIZEN SUPPORT SERVICES A. Waller ADMINISTRATIVE COORDINATOR W. Wilson FILMING COORDINATOR S. Rae DEPUTY DIRECTOR PLANNING & BUILDING L. Pelletier ASSISTANT DIRECTOR CURRENT PLANNING (vacant) CHIEF BUILDING INSPECTOR P. Shek ASSISTANT DIRECTOR RECREATION W. Scott ASSISTANT DIRECTOR CULTURAL SERVICES D. Nokony ASSISTANT DIRECTOR GOLF OPERATIONS D. O Connor ASSISTANT DIRECTOR PARKS D. Hunter MANAGER BUSINESS OPERATIONS D. Pelletier INTERNAL AUDITOR F. Lee * Members of the Management Committee. This organization chart shows reporting relationships only and does not necessarily reflect levels of responsibility

19 Annual financial plan City of Burnaby 19 From Top left: Nick Volkow, Dan Johnston, Mayor Derek Corrigan, Paul McDonell, Sav Dhaliwal, Pietro Calendino, Colleen Jordan, Anne Kang, Richard Chang Mayor and CoUNCIl The Mayor and Council are elected by the residents of Burnaby and are responsible for providing municipal government services. The Mayor is the head and chief executive officer of the City. The Council is the governing body of the City, and is responsible for seeing that City resources are used for the benefit and protection of its citizens. The City is advised by various Boards, Committees, and Commissions which are appointed by City Council. Executive bodies, appointed by Council, make decisions within guidelines provided by Council. These bodies include: Board of Variance Accountable for approving requests for minor variances to the Burnaby Zoning Bylaw regarding the site, size and dimensions of buildings. Parks, Recreation & Culture Commission Accountable for the development, maintenance and operation of all parks and parks' property and the organization of recreation programs in the City. Public Library Board Accountable for the operation of all libraries in Burnaby. Advisory bodies, appointed by Council, are identified in the City s Organizational Chart. These bodies advise and make recommendations to City Council.
20 20 City of Burnaby Annual financial plan Organization and Structure City Manager s Office The City Manager is the Chief Administrative Officer for the City and makes recommendations to Council on a broad range of policy and administrative issues. The City Manager s Office directs the operations of the City and is responsible for implementing City policies. Clerk s The Clerk s Department keeps the official Council records and assists the general public by providing information on bylaws, Council agendas, Council and Committee meetings and other Council activities. They also provide administrative support to Council and its various Committees, Boards, and Commissions. Fire The Fire Department is responsible for preventing and extinguishing fires and protecting life and property. Other services include rescue and safety and emergency medical care. Legal The Legal Department is responsible for coordinating and drafting bylaws, contracts and providing legal advice on City matters. The Department also manages claims and legal proceedings involving the City. Police The Police Department is responsible for working with citizens to prevent crime and maintain order in accordance with the Canadian Criminal Code. The City also funds Integrated Regional Units for Homicide, Emergency Response, Forensic Identification, Dog Services and Traffic Reconstructionists. Citizen support Services The Citizen Support Services Department is responsible for improving the quality of life for Burnaby citizens by providing them with volunteer support services that would otherwise not be available to them. Library The Library is responsible for providing a publicly available collection of books, magazines, compact discs and videos to the residents of Burnaby and other Lower Mainland Public Libraries. Human Resources The Human Resources Department is responsible for providing a variety of services to employees, including employment, benefits, labour relations, training and development, and occupational health and safety.

21 Simon Fraser University

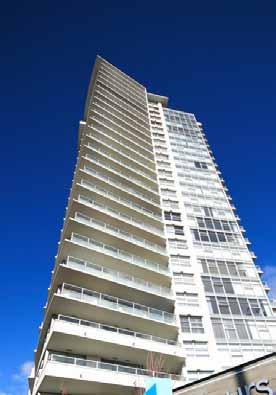
22 22 City of Burnaby Annual financial plan Engineering The Engineering Department is responsible for ensuring the adequacy and continuity of City infrastructure. These services include: construction and maintenance of the road, waterworks, sanitary sewer, and storm drainage systems, snow removal on streets, establishment of engineering service requirements needed for land development projects, provision of refuse and recycling collection programs, installation and maintenance of traffic signals and street lights, parking enforcement, civic building maintenance, fleet maintenance, and administration of the City s local area service programs and environmental services. Finance The Finance Department is responsible for ensuring financial stewardship of City assets through a number of financial management policies that promote the long-term financial stability of the City. This framework supports the City's overall fiscal planning, investment and management of resources and the delivery of financial information services. Financial accountability is achieved through reporting, monitoring, controlling and auditing programs managed by the department. Annual and Provisional 5-Year Plans and year-end Financial Statements provide key information and results to keep taxpayers, residents, business leaders and other interested parties informed of the City's financial performance. The department also administers the business licensing program, manages rental of City property, and provides purchasing services for departments. The strength of the City's financial position is reinforced by Council through prudent financial practices that have produced a debt-free City with strong reserves that are needed to support the replacement of the City's capital infrastructure and promote economic sustainability. Rendering of Sovereign Tower

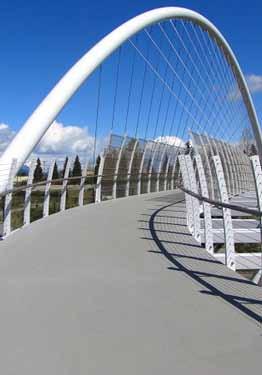
23 Annual financial plan City of Burnaby 23 Planning and Building The Planning Department plans and controls land development within the City of Burnaby. Planning functions supporting this include setting and administering policy for use of land and ensuring adherence to the policy. They also provide policy advice to City Council along with administrative functions in relation to current and future uses of land and matters concerning housing, the environment, transportation, heritage and social policy. The Building Department issues permits and inspects and regulates the construction of buildings and structures within the City. It also enforces City bylaws and co-ordinates the development and construction of major civic projects. Parks, Recreation and Cultural Services The Parks, Recreation and Cultural Services Department is responsible for three major areas: the provision and maintenance of park space; the provision, maintenance and programming of recreation facilities; and the provision, maintenance and programming of fine arts and cultural facilities. The Department is also responsible for maintenance and programming of golf courses, as well as food service operations found in some of the recreation, golf and cultural facilities. Rendering of MetroPlace Tower
24 24 City of Burnaby Annual financial plan Executive summary Members of Council The City is pleased to present the Annual Financial Plan. The Annual Financial Plan reflects the City s long history of strong fiscal management that has been firmly supported by Council to provide for economic sustainability in Burnaby. The Plan includes projected expenditures and revenues, and changes in the property tax levy. The five year estimates are presented on a fund basis and take into consideration program and service delivery enhancements to meet increased demands for City services. The Library Board and the Parks, Recreation and Culture Commission have approved their respective budgets as they appear in this document. The City, like most organizations, is impacted by the overall economy. At the time of the City s Provisional Budget in December 2010, economic reports estimated BC s economic growth at 3.1%, compared with 3.8% in 2010 and 2.0% in More recent reports suggest that the growth in BC will be less, at 2.7%, due to further global economic slowdown and the winding down of fiscal stimulus, and locally, without the boost from the winter Olympic Games. Prospects for 2012 and 2013 are still positive, with resurgence in private investment and consumer spending growth and the global economy on a stronger footing. BC s independent Economic Forecast Council forecast is unchanged at 3.0% for 2012; the average annual forecast for is 2.8%. The Annual Financial Plan provides an operating program of 356,623,804 and incorporates a proposed 2.95% property tax increase for after allowing for new growth. This increase is required to fund a number of budget challenges in that surpass the projected annual rate of inflation. These include wage and salary agreements and utility and refuse disposal rate increases passed on from Metro Vancouver. Funding for new initiatives is focused on high priority items such as the annualization of operating costs for new facilities and services that were built in Inflation has been taken into account in estimating certain price sensitive cost items, and depreciation is also reflected in expenditures. Waterworks Utility and Sanitary Sewer include a provision for rate increases of 11% and 7.5% respectively, based on long range estimates provided by the Greater Vancouver Sewerage and Drainage District and the Greater Vancouver Water District. Of significant value is the strength of the City s financial reserves which continue to remain healthy. Council s long standing policy to fund, through operations, the replacement of capital as a capital asset is depleted continues to provide infrastructure replacement funding in a sustainable way. The health of reserves is maintained by tax contributions for depreciation, investment income and land sales. Investment income has decreased due to lower interest rates. Land sales have been less vigorous than prior years due to a slower economy. Despite the slow down, Burnaby continues to attract a significant number of offices, institutional, industrial and commercial developments as the recovery slowly improves. The City has advanced capital projects to support this business development and to provide a community that is rich in parkland and civic facilities, including childcare centres, non-profit office space, affordable/special needs housing units, and community police offices for the community it serves. Specific economic initiatives such as Council s Bonus Density Program provide additional needed community resources in this time of economic constraint. Through this program, developers seek City approval to build more units in exchange for giving up space in their buildings or contributing money to the City for future community facilities. This innovative program demonstrates the City's commitment to supporting Burnaby seniors, families and children by providing additional community amenities.


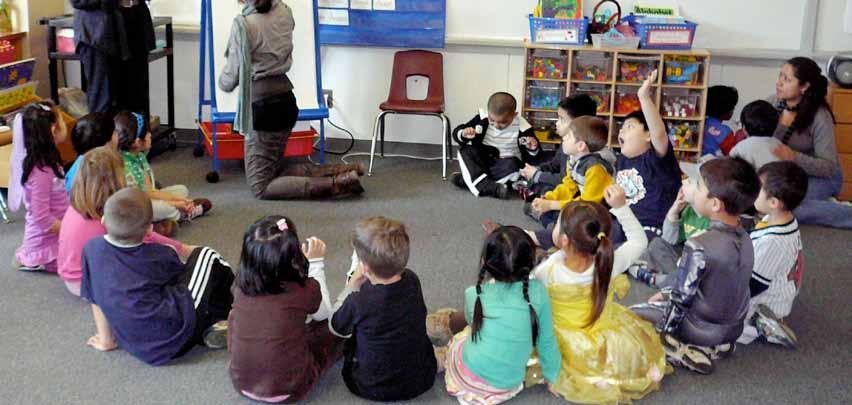
25 Annual financial plan City of Burnaby 25 The opening of the Cameron Childcare Centre in Burnaby this year was made possible by the Bonus Density Program. This centre is the third childcare space developed for the City as part of its community amenity program. The City now owns five childcare centres that provide licensed childcare spaces for 232 children. A ground breaking ceremony on January 29, occurred for a new seniors housing project for accessible supportive housing. Funding of 355,000 from the Bonus Density Program was provided to support a project for 46 Independent Living BC sponsored units being built as part of the Swedish Canadian Rest Home Association project in Burnaby. Burnaby seniors expressed a need for accessible, supportive housing options to allow them to live independently for as long as they can; this project represents a significant enhancement to seniors' housing in our community. In the spring/summer of, the City will tender approximately 16,000 square feet of community programming or associated office space for non-profit organizations in the Metrotown area for developments on Telford Avenue as a result of the Bonus Density Program. The budget provides for a capital expenditure program of 159,237,645. The following highlights some of the major projects included in this program. From left to right: Mayor Derek Corrigan Adele Clarke (Lower Mainland Purpose Society) Councillor Paul McDonell Councillor Colleen Jordan Ward McAllister (Ledingham McAllister) Edmonds Aquatic and Community Centre: The total project cost for the design and construction of this new recreation centre is estimated at 49.7 million. The budget for is 22.6 million. This new recreation centre slated for completion in 2012 will provide twice the space of Bonsor Recreation Centre and will feature a 6-lane 25 m lap pool, leisure pool, hot tub, sauna, community space and a double gymnasium. Riverway Golf Course Clubhouse: With phased design and construction over multiple years, this project reached completion in April of, the budget is 2.86 million. The clubhouse building is an 11,500 square foot single storey structure containing a restaurant/bar/grill/coffee shop and banquet facilities capable of accommodating up to 225 guests. Fire Station #1: The renovation and upgrade of this Fire Hall will reach completion in. The budget for is 1.44 million. The main purpose of the renovation is to improve the use of existing space within the fire station. This project will result in a modular building for training, a female dormitory, exercise area and an exterior training structure. Deer Lake Centre: Repairs, upgrades and renovations to roofs, lobbies and hallways, elevators, heat pump and plaza areas. The budget is 2.82 million. Pavement Overlay Program: This ongoing program extends the pavement life and provides safer travel surface for road users. A budget of 2.94 million is provided for the City's major roads network and a budget of 3.39 million for local and arterial roads.
26 26 City of Burnaby Annual financial plan Service Centre: Design and construction of the Still Creek Works Yard and the Laurel Street Service Centre. The budget for is 4.5 million. The new works yard will be comprised of a 12 acre Engineering and Parks operations facility which will meet the growing service needs of the City. Douglas Road: Still Creek Avenue to Goring Street. The budget is 2.14 million. This project includes a total reconstruction of the road pavement, installation of street lights, additional traffic lanes at the intersections, upgrades to the traffic signals and rail crossing. Existing water and sanitary sewer infrastructure will also be renewed to minimize restoration costs and avoid damage to new pavement. Marine Way: Road widening at North Fraser Way. The budget is 5.6 million. The road will be widened by two travel lanes (one in each direction) and signalization at the intersection will be upgraded. Water and Sewer Mains: Annual programs to replace aging infrastructure with a history of high maintenance costs. The sewer budget includes provision for the implementation of a combined sewer separation program as part of Metro Vancouver's liquid waste management plan. The Waterworks budget is 17.5 million and the Sanitary Sewer budget is 13.6 million. Urban Trails: A City wide network of primary trails to accommodate walking and cycling as an alternative means of transportation and as a recreational activity. The trails provide linkages between town centres, waterfront areas, community facilities, parks and other destinations in Burnaby. This is an ongoing program with a budget of 1.38 million in the budget. Burnaby Lake Rejuvenation Project: Continuation of lake dredging. The budget is 5.4 million. The rejuvenation project, when completed in, will have removed 185,000 cubic metres of sediment towards creating better fish passage and enhancing the aquatic and animal life in the lake. In addition to these major works, there is also a continuation of other transportation improvements throughout the community, a replacement program for City vehicles and equipment, the phased replacement of the City s business systems, and the purchase and development of land for residential and park purposes. Appreciation I would like to express my appreciation to the Management Committee, the various Boards and Commissions, and to staff for their effort and assistance in the preparation of this financial plan. Respectfully submitted, Robert H. Moncur CITY MANager
27 Annual financial plan City of Burnaby 27 Budget overview Planning Process The City s planning process for preparation of the Annual Financial Plan began with the placement of advertisements in local newspapers in January and on the City's website to provide Burnaby citizens an opportunity for input on the City s Annual Operating Budget and the 2015 Annual Capital Program. In preparation of the Annual Financial Plan, departments submitted revised estimates of anticipated changes in annual operating expenditures and revenues and capital projects. To ensure the City continues to maintain low tax rates in the Annual Operating Budget, adjustments were necessary. The Annual Financial Plan contains a section on Social Sustainability and Direction that outlines the City s long-term social sustainability vision and strategic priorities. It also includes current strategic direction and objectives to manage fiscal resources. Information is provided about the City s achievements in 2010 and new priorities and measures for and budget assumptions The estimates are based on available information at the time this Financial Plan was prepared. The projections for provide future expenditure and revenue components of the City s budgets. As subsequent years estimates are based on assumptions, these estimates may be increasingly less accurate, but are still an indication of priorities and will be updated annually. reserve balances Over many years, the City has established reserves which are used to fund operating and capital program expenditures as the need arises. The level of reserves is an indicator of financial strength and affords Council the ongoing ability to maintain taxation stability and to provide capital funding for City projects without incurring debt on the external markets. The majority of reserves used for capital program financing are statutory in nature. Their purpose and authority for collecting and spending money is established by a City bylaw governed by the statutes or laws contained within the Community Charter of the Province of British Columbia. A smaller proportion of the funds on hand are dedicated for operating needs, namely Stabilization, Insurance and Snow Removal Reserves. These Operating Reserves were created from appropriations of operating surpluses and are used to fund current or one-time operating expenditures reducing the property tax burden. The Annual Financial Plan includes funding from City reserves to offset operating and capital budget expenditures in accordance with City business practices. The City adopted Public Sector Accounting Board (PSAB) standards for the presentation of financial statements and the inclusion of tangible capital assets in the delivery of the City s 2009 Annual Financial Report. The City, over the last three years, has undertaken to inventory, value (at actual or estimated historical cost), and depreciate its tangible capital assets including equipment, buildings, vehicles, parks, utility infrastructure and land.
28 28 City of Burnaby Annual financial plan The Annual Financial Plan incorporates the change in accounting standards and reflects the depreciation of the City s tangible capital assets in the operating budget and as a contribution to reserves. The following table provides the projected reserve fund balances over the next five years. CAPITAL & OPERATING RESERVES (000S) 2009 Actual 2010 Actual Budget 2012 Budget 2013 Budget 2014 Budget 2015 Budget Opening Balance Land Held For Resale 87,440 88,285 92,695 96, , , ,195 Discretionary Capital Reserves 274, , , , ,410 93,146 44,949 Other Capital Reserves & Funds 178, , , , , , ,045 Development Cost Charges 57,213 55,692 64,843 69,841 75,769 81,971 88,760 Operating Reserves & Surplus 39,972 32,647 32,764 27,216 23,276 20,922 20, , , , , , , ,980 Increase to Reserves & Funds Investment Income 30,231 25,745 25,195 23,615 21,513 20,816 19,963 General Revenue Fund Contributions 50,594 43,252 46,912 48,517 50,497 52,931 55,160 Utility Funds Contributions 23,187 23,522 31,183 29,900 28,800 30,550 30,600 Development Cost Charges 2,764 7,596 5,000 5,000 5,000 5,000 5,000 Private Funds, Grants and Other 19,606 14,185 16,256 11,502 10,450 9,650 9,650 Sale of Land & Other Assets 1,787 2,653 2,200 2,200 2,200 2,200 2,200 Others 3,967 6,647 1,706 1,904 2,014 2,106 2,163 Total Reserves & Funds Increases 132, , , , , , ,736 Land Held for Resale Transactions 845 4,410 4,000 4,000 4,500 5,000 5,000 Decreases to Reserves & Funds Cost of Land Purchased for Resale (1,045) (4,526) (5,000) (5,000) (5,500) (6,000) (6,000) Capital Expenditures from CAWME (31,463) (36,915) (77,813) (82,538) (42,735) (48,553) (40,100) Capital Exp. from Other Capital Reserves & Funds (60,911) (54,769) (73,424) (75,818) (82,443) (82,496) (76,887) Capital Exp. from Development Cost Charges (7,893) (1,523) (3,000) (2,300) (2,300) (2,000) (2,000) Transfer to Operating (4,266) (1,009) Operating Reserves & Surplus Expenditures (20,211) (7,373) (7,857) (6,396) (4,921) (3,549) (1,201) Total Reserves & Funds Decreases (125,789) (106,115) (167,094) (172,052) (137,899) (142,598) (126,188) Net Increase/(Decrease) in Reserves & Funds 7,192 21,895 (34,642) (45,414) (12,925) (14,345) 3,548 Ending Balance-Capital & Operating Reserves 644, , , , , , ,528 The growth in the reserves arises mainly from General Revenue Fund contributions, investment income and land sales. Reserve funds are primarily used for equipment replacement, capital construction, working capital and the purchase of land. Land purchased for assembly and development will be sold in the future to facilitate the implementation of Burnaby s long range community plan.

29 Annual financial plan City of Burnaby 29 Operating BUDget Projections The Annual operating budget of 356,623,804 calls for a residential tax rate increase of 2.95%, after allowing for new taxes from building construction. Funding for the operating budget comes from numerous sources including program and service revenues such as patron charges for the use of swimming pools, golf courses and recreation centres, revenue from property taxes, levies for water and sewer, and building permit and development fees. Revenues have trended upward during the first quarter of, enabling Council to reduce the tax rate from the Provisional estimate of 3.95% to 2.95%. Major expenditure increases over the 2010 operating budget are provided below. These expenditures were funded by revenue increases and an increase in the tax levy of 2.95% RESIDENTIAL TAX LEVY 188,026,260 Contract provisions Incease in capital funding Increase in GVS & DD drainage levy Increase in waste disposal fees Provision for current year assessment appeals Other expenditure increases Increase in revenues Total Net Increase 7,710,100 1,899, , , ,500 96,625 (2,574,905) 8,333,380 RESIDENTIAL TAX LEVY 196,359,640
30 30 City of Burnaby Annual financial plan Staffing The City has a budgeted staffing complement of 1,743 regular full-time staff and 2,258 full-time staff equivalents. There were 4 new full-time positions approved for and 3 positions converted to regular full-time. The four new positons are: Mayor s Office: administrative Assistant 1 Human Resources: Compensation Manager 1 Engineering: assistant Director Facilities Maintenance 1 Facilities Management Program Planner 1 Totals 4 waterworks utility and Sanitary sewer Projections for Waterworks Utility and Sanitary Sewer include a provision for rate increases of 11% and 7.5% respectively. The Waterworks Utility rate increase is required to offset the increase in the cost of water billed by the Metro Vancouver Greater Vancouver Water District for water supplied to the City. The increased costs provide funding for the Drinking Water Quality Improvement Plan which includes debt repayment and the operating costs of a new filtration plant for the Seymour water source and the construction of a water tunnel between the Capilano and Seymour sources. The City, through an annual replacement program, is also replacing all asbestos cement watermains in the City which are at the end of their useful life. This is a long term 20 year program. The flat rate for a family home is ( ). The Sanitary Sewer increase is based on the long range estimates provided by the Metro Greater Vancouver Sewerage and Drainage District and is due to levy increases and higher costs for aging infrastructure replacement and maintenance. The flat sewer parcel tax for a family home is ( ). Both the Waterworks Utility and Sanitary Sewer continue to be self supporting funds billed separately from property taxes.
31 Annual financial plan City of Burnaby 31 Five Year tax levy estimates The five year operating plan reflects projected increases in discretionary and non-discretionary expenditures which are offset against increased revenue projections in the General Revenue Fund. The following table provides a five year summary of the tax levy changes and what makes up the increases. GENERAL REVENUE FUND Prior Year Expenditures Additional Costs: 339,186, ,623, ,564, ,031, ,325,320 Transfer to Capital Funds & Reserves (168,825) Depreciation Expense 2,137,197 2,788,410 2,880,026 2,500,794 2,235,206 Contract Increases 7,710,100 6,372,885 6,119,655 6,163,605 6,602,465 Programs, Services & Utilities 7,758,482 8,779,771 8,466,999 7,629,371 7,343,269 17,436,954 17,941,066 17,466,680 16,293,770 16,180,940 Total Expenditures 356,623, ,564, ,031, ,325, ,506,260 Prior Year - Other Revenue Additional Revenue: 144,160, ,647, ,526, ,182, ,883,425 Stabilization & Surplus 2,890,819 (5,058,452) Programs, Services & Utilities 9,595,960 7,937,408 5,655,970 4,701,130 3,630,500 12,486,779 2,878,956 5,655,970 4,701,130 3,630,500 Total Other Revenue 156,647, ,526, ,182, ,883, ,513,925 Prior Year Tax Levy New Levy: 188,026, ,359, ,238, ,147, ,672,854 Taxes From New Growth 2,193,083 2,200,000 2,200,000 2,200,000 2,200,000 Taxes Rate Increase 6,140,297 11,678,438 8,709,661 9,325,115 10,343,990 8,333,380 13,878,438 10,909,661 11,525,115 12,543,990 Total Tax Levy 196,359, ,238, ,147, ,672, ,216,844 Non-Cash Item 3,616,795 4,800,467 5,701,516 5,769,041 5,775,491 Total Revenue 356,623, ,564, ,031, ,325, ,506,260 Contingencies The City is currently awaiting the decision of the BC Assessment Authority Appeal Board on several properties. The outcome is not known at this time, however 696,500 is provided in this budget for successful current and prior years appeals. If appeals are greater than this amount, funding may be drawn from the Stabilization Reserve. The contingency in the Annual Operating Budget includes a provision for unexpected items which may arise. The City Manager authorizes the use of this contingency and reports any significant transactions to Council.
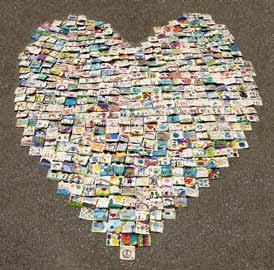
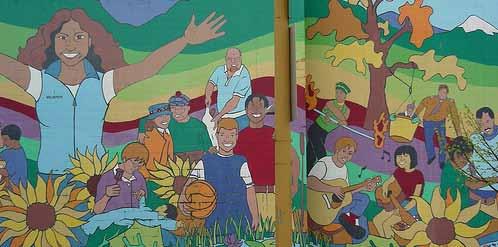
32 32 City of Burnaby Annual financial plan Capital BUDget Five Year Projections The five year Capital Plan provides for the City's planned capital works. Capital expenditures are defined as expenditures that are of significant value and have a useful economic life of more than one year. Capital projects add value to the City's physical assets or significantly increase their useful life. The operational impact of these works has been incorporated where appropriate within the five year Operating Plan. The Capital Plan is presented on a fund basis of accounting. Burnaby's Official Community Plan provides the framework for the orderly management of growth and development of Burnaby. As a strategy to manage and achieve a higher level of livability in Burnaby, the City purchases and holds land until it is needed to facilitate development or redevelopment. The exact timing of specific land acquisitions is difficult to predict as it hinges on many factors. Likewise, it is difficult to accurately predict when land will be sold during the year. The numbers in the Capital Plan represent a best estimate. Five Year Capital Expenditure Estimates Budget 2012 Budget 2013 Budget 2014 Budget 2015 Budget Capital Expenditures (000) Roads 28,717 17,532 18,422 16,760 16,955 Park Facilities and Development 41,871 40,037 19,495 30,135 21,670 Parkland Acquisition (incl. Deer Lake Park) 3,000 2,000 2,000 2,000 2,000 Vehicles and Equipment 14,823 20,995 18,681 17,141 15,095 Land Assembly and Development 9,962 10,500 10,000 10,500 9,000 Sanitary Sewer 13,640 12,000 12,000 12,500 12,500 Waterworks 17,558 15,000 14,000 14,500 15,000 Municipal Buildings 13,782 29,278 24,581 22,713 22,767 Other 15,885 18,314 13,800 12,800 10,000 Total Capital Expenditures 159, , , , ,987 Clockwise from top rightt Watercolours Tower Peace of Art Gift Bags Burnaby Mural Community Arts
33 SOcial Sustainability and Direction

34 34 City of Burnaby Annual financial plan SoCIal sustainability strategy Burnaby is a City that continues to be a great place to live, work, learn, play and visit. Social sustainability is about people - individuals and the community working together to meet their needs, realize their potential, and prosper in a healthy environment. The framework for Burnaby's draft Social Sustainability Strategy includes a long-term vision, three 10-year goals, and seven strategic priorities. The goals frame the City's long-range plans over a 10 to 15-year period, creating a framework for action on the City's overarching vision. Due to the complex and multifaceted nature of the social realm, there is no single agreed-upon definition for social sustainability. Most definitions include some reference to the following concepts: The dynamic evolution of society in meeting individual needs, achieving common goals, and improving quality of life The participation of community members in community life through a strong civil society and democracy The increased capacity of current and future generations to build healthy and livable communities VISION GOALS INCLUSION LIVABILITY RESILIENCE Strategic Priorities Meeting Basic Needs Celebrating Diversity and Culture Getting Involved Learning for Life Enhancing Neighbourhoods Getting Around Protecting Our Community City Roles Individual, Community and Partner Roles
35 Annual financial plan City of Burnaby 35 Community Inclusion Burnaby will be an inclusive community An inclusive community values all its members and helps them to meet their basic needs so that they can live in dignity, engage actively, and contribute to their community. This goal is particularly concerned with ensuring the city is affordable, accessible and welcoming of all cultures, identities and abilities. In an inclusive community, all members have equal opportunities for participation in decisions that affect their lives, allowing all to improve their living standards and overall well-being. Community inclusion focuses on principles of economic and social security and justice. It fosters full participation in work, education and society by those who face economic and social barriers. livability Burnaby will continue to be livable for those who live, work, learn, play and visit A livable community speaks to the interests and needs of all who live, work, learn, play and visit in the City. Livability is focused on making Burnaby a more desirable community, one that has a sense of identity nourished by its unique artistic and cultural assets, heritage and access to nature. Its neighbourhoods are human-scale - places where people feel safe and secure. People experience a sense of well-being through healthy living opportunities and strong community connections found in abundance through the community. resilience Burnaby will be a resilient community, able to adapt and thrive IN times of change Resilience is about a community's ability to adapt, recover and continue to prosper when faced with unexpected social, economic or environmental trends or events. Burnaby's citizens, organizations and institutions need the collective capacity to respond to and influence the course of change. As a resilient community, Burnaby will be strengthened by a spirit of shared positive action and co-operation, and fired by a creative and innovative mindset that supports and is supported by a flourishing economy and environment.

36 36 City of Burnaby Annual financial plan

37 Annual financial plan City of Burnaby 37 Five Strategic objectives direction The Annual Financial Plan presents the City of Burnaby s strategy to manage its fiscal resources to meet the needs of Burnaby citizens today and for the next five years. Under the direction of Council, staff is focused on creating and sustaining a vibrant, healthy, safe and caring community within a livable region. This section contains information about the City s achievement of objectives in In addition, it outlines the objectives for and Future Annual Financial Reports will provide information on the City s performance in meeting these objectives, and the Annual Financial Plan will establish new priorities for future years. This section is intended to give a clearer picture of how the City of Burnaby is managing its responsibilities and commitments to its citizens today, while working to ensure sustainability for the future. The Official Community Plan (OCP) sets directions to guide Burnaby s development and to meet anticipated needs over the next decade and beyond. The Plan helps to ensure that Burnaby continues to develop as a complete and livable community that reflects local needs, aspirations and values, while contributing to help shape a livable region. The OCP has incorporated five strategic directions to provide a framework for the work carried out by Council and staff. Within the framework of each of the five strategic directions are guidelines for establishing specific objectives to move the City forward. To be successful and sustainable, the City must also fulfill social responsibilities by becoming more responsive, flexible and open.


38 Objective 1: A More Complete CoMMUNIty Creating a complete community means providing all facilities required by citizens within the boundaries of the City of Burnaby. By balancing residential and commercial buildings and providing adequate and well-located community services and facilities, the City supports family diversity and opportunities to work closer to home through land assembly, development and a greater mix of housing Measure & Achievement: Eastburn and Edmonds The Eastburn and Edmonds Complex, was comprised of two community recreation centres that provided recreation programs and services to the Edmonds community. The detailed design and tendering of the new Edmonds Aquatic and Community Centre project was completed in 2010 and construction was initiated Measure & Achievement: Development applications The Engineering Department processed 49 development applications consistent with adopted City Plans and Policies. In 2010, 1,710 building permits were issued by the Planning and Building Department with of a total value of 539 million. These approved developments continued to reflect a balanced growth of residential, commercial, institutional and industrial uses across the City, with projects ranging from very large and complex mixed-use redevelopments to the smaller individual developments. The UniverCity community located on the Simon Fraser University campus on Burnaby Mountain was significantly advanced in 2010 with a third phase of development approval. This award-winning sustainable project has attracted regional, national and worldwide attention as an innovative example of a modern, environmentallyaware community Measure & Achievement: riverway golf course Clubhouse Construction of an impressive new clubhouse at the Riverway Golf Course commenced in 2010 and was completed in April. Equipped with a coffee shop to service early morning golfers, the 11,500 square foot, single-level building also has a restaurant/mixed grill and bar and lounge services that can be converted into banquet facilities to accommodate up to 225 guests.


39 Measures Advance the review and update of programs, policies and plans for the development of a complete community, including specific area plans, a renewed Park and Open Space Plan, revised Burnaby Transportation Plan, development of an Environment Sustainability Strategy and completion of the Social Sustainability Strategy. Initiate the design of new facilities for Bonsor seniors. The proposed two-story 8,500 square foot facility will complement existing facilities at the Bonsor Recreation Complex and include meeting rooms, a large multipurpose room, a lounge, coffee bar and snooker room Measures Advance the review of the City's Official Community Plan and other key policies and programs, and pursue implementation of approved plans and strategies. The new Bonsor Seniors' facility will be incorporated into a new residential development, with construction to commence in The new Edmonds Aquatic and Community Centre will open for business, providing the community with a wide range of recreational, arts, and community participation opportunities Measure & Achievement: community amenities The City advanced a significant amendment of its zoning bylaw to enhance the Supplementary Community Benefit Bonus Density program in Burnaby s four Town Centres. This economic innovative provision assists the City in securing services and amenities for our communities such as affordable housing, childcare centres, nonprofit space, park improvements and other amenities for residents Measure & Achievement: burnaby mountain golf course Driving Range Construction of a new state-of-the-art, two-level, 60-stall driving range was completed in June The new facility also has a storage and maintenance area with capacity for a large fleet of golf carts. The Burnaby Mountain Golf Course has been rated by Golf Digest as "One of the Best Places to Play" in North America, boasting over 5,800 yards of natural tree-lined terrain Measure & Achievement: Master Redevelopment Plan The master redevelopment plan for the Laurel Street Works Yards was completed. The City retained the firm of Walter Francl Architecture to undertake the detailed design of the Still Creek Works Yard and Recycling/Green Waste Depot which accommodates some of the City's services being relocated from the overcrowded Laurel Street site.


40 Objective 2: environmental awareness Responsible environmental stewardship means preserving and enhancing the ecological systems and diversity of the City. Encouraging an environmentally aware community requires proactively addressing concerns for the preservation of the natural environment and ecosystems and incorporating these issues into the infrastructure planning and development process for the City of Burnaby Measure & Achievement: burnaby lake Rejuvenation In March 2010, the City commenced the dredging program for Burnaby Lake. Targeted for completion in spring/summer, it is expected the project will remove approximately 180,000 cubic metres of sediment from the lake's bottom. The rejuvenated lake will create a healthier and cleaner environment for fish and wildlife habitants and restore the lake as a world-class recreational facility for rowing, kayaking, and canoeing Measure & Achievement: Environmental Policies and Action Plans With an updated solid waste and recycling bylaw, the City has also adopted municipal action items in its regional integrated solid/liquid waste and resource management plans. The Byrne Creek Stormwater Management Plan was completed in 2010, and the Kaymar Creek Integrated Stormwater Management Plan's program was initiated Measure & Achievement: Food Scraps Collection Program The Food Scraps Collection program was initiated in May 2010 for single- and twofamily residences serviced by the City. It is estimated that food waste accounts for about 35% of the weight of the total waste stream; this program reduces the stream by a further 15%, moving closer to the regional waste reduction goal of 70% by 2015.


41 Measures Advance the development of the City's Environmental Sustainability Strategy through the Council approved blue-ribbon steering committee process, and pursue other related initiatives through the Environment Committee and other bodies and venues as appropriate. Offer workshops to residents on the identification and removal of invasive plant species from gardens and greenspaces. Continue with 2.5 km of sewer separation involving 5M in expenditures on an annual basis; 1.2M in sewer rehabilitation and 0.75M on system evaluation Measures Advance implementation of a completed Environmental Sustainability Strategy. Continue with the phase III pre-design for upgrading of the Fraser River Dyke sections. Research and purchase hybrid vehicles to replace current gas-powered Fire vehicles and continue meeting Emission Control Standards by purchasing vehicles with diesel particulate filters Measure & Achievement: Southpoint Rain Garden Project The Southpoint Rain Garden project transformed 2,300 square metres of paved space into a more natural state, providing enhanced stormwater runoff qualty, reduced erosion, new fish habitat, and an environmental learning opportunity Measure & Achievement: Duthie water Pump Station The City initiated the design for a new water pump station in North Burnaby to improve water supply for 10,000 residents and to provide an emergency backup supply of water for Burnaby Mountain. The design assignment for the new Duthie Pump Station was initiated and construction is planned to commence in Measure & Achievement: Energy Conservation Many City facilities have been retrofitted to conserve energy including building lighting, air conditioning and heating controls, and boiler replacements. Results of these energy saving measures have yielded an annual energy cost savings of approximately 530,000. The City also implemented a low-flush toilet rebate program for single and two-family homeowners who replace their toilets with a water-efficient replacement.


42 Objective 3: economic opportunity Building a community of economic opportunity requires the City to capture a significant share of high-quality commercial and industrial development that generates employment and economic benefits. An improving streetscape will create a more attractive environment for residents, businesses, and visitors, contributing to the overall growth of the tax base and employment in the City. With more and more City services being delivered online, the City is streamlining its business processes through the use of technology Measure & Achievement: Development Applications Burnaby s economic development program was advanced in the Big Bend area with over 8.5 million square feet of industrial and warehouse space and 2 million square feet of office floor area currently constructed or approved. In 2010, an additional 2 million square feet of industrial/warehouse floor area and 500,000 square feet of office floor space was pursued through the development approval process. In 2010, Burnaby s economic development plan to remain competitive on a regional scale was recognized through the annual local survey of development costs conducted by NAIOP which continued to recognize Burnaby as having lower fees than most other municipalities in the region and one of the fastest development and building permit approval times Measure & Achievement: Beautification strategy In 2010, the City completed three projects to enhance the experience for visitors, residents, and the business community. The Gaglardi/Lougheed intersection features new curbs, an urban trail, wheelchair ramps, street furniture, and 21 coloured LED light columns to provide a comfortable pedestrian experience. Along with a new 'Welcome to Burnaby' fixture, street trees, lighting and a separated sidewalk were installed to highlight the entrance to Burnaby at North Road and Lougheed Highway. On Griffiths Avenue, a series of plantings, plinths, and a bridge creates a beautiful connection from the Edmonds Skytrain into the heart of Edmonds Town Centre and surrounding community.


43 Measures Initiate development of a framework for Asset Management planning for infrastructure (water, sewer, roads, drainage). Complete the first phase of the Virtual City Hall project with a newly designed website with content structured to better address the information needs of the citizens of Burnaby Measures Advance the pursuit of new development projects within Burnaby's town centres, urban villages, business centres, industrial areas, and neighbourhoods. Update achievements of the City in relation to the adopted Economic Development Strategy, and pursue implementation of approved plans and projects Measure & Achievement: marketing & communications plan In 2010, the City continued its successful partnership with Tourism Burnaby to advance the tourism marketing sector through the Provincial Community Tourism Program funding to complete the implementation of an Integrated Marketing and Communications Plan. The Plan targets specific advertising sectors and capitalizes on opportunities to market the City to local residents and visitors as a place to visit and stay in Metro Vancouver Measure & Achievement: Town centres Major development projects advanced in the City in 2010 included successfully marketed high-rise residential developments in the City s four Town Centres. In Metrotown, two completed projects include: The Sovereign, a mixed use development with a 45-storey residential and hotel tower at Kingsway and Willingdon, and Metroplace, a similarly scaled project for residential and street front commercial uses adjacent to the Metrotown SkyTrain Station.

 of the Major Road Network and 10.8 km (of 11.4 km) of the Burnaby Road Network.")
44 Objective 4: transportation choices The City strives to maximize community mobility by actively supporting alternative methods of transportation and working to minimize congestion. By promoting alternate modes of travel and increasing the transportation choices available, more people will move in fewer cars and make the most of existing roadways Measure & Achievement: Major Roads Network The operation of the Major Roads Network include the maintenance of pavements, streetlights, traffic signals, bridge structures, pedestrian overpasses, street cleaning, and road markings and signage. The City completed 2.7 km (of 3.0 km) of the Major Road Network and 10.8 km (of 11.4 km) of the Burnaby Road Network Measure & Achievement: GPS Signal Pre-emption System In 2010, the City completed the installation of an emergency vehicle traffic signal pre-emption system to provide Fire and Police vehicles with a green light when responding to emergencies. The system has been installed at every signalized intersection within Burnaby and helps improve response times and reduce potential collissions with other vehicles.


45 Measures Proceed with implementation of approved transportation projects while initiating a review of the Burnaby Transportation Plan. Proceed with design for seismic retrofit and structural rehabilitation of the Stormont Brunette River overpass on Gaglardi Way. Advance adopted urban trail and bicycle improvement projects Measures Review pedestrian facility needs and develop long term strategies for improvement. Pursue implementation of an updated Burnaby Transportation Plan and prepare responses to new proposals and initiatives arising from City, Regional and Provincial initiatives Measure & Achievement: burnaby heights/capital hill In 2010, the City initiated a consultation process with residents of the Burnaby Heights/ Capitol Hill area on improvements and policies to help address local concerns with traffic volume and safety Measure & Achievement: public transit Partnerships with transit authorities have resulted in improved bus stops and pedestrian facilities, providing greater access to transit services and alternative modes of travel Measure & Achievement: gateway program In 2010, the City advanced the completion of a significant financial and transportation agreement with the Provincial Government to authorize civic implementation of the Gateway program to widen the Trans-Canada Highway. The agreement ensures that the interests of the City and its residents are implemented related to environmental enhancement, protection of residential neighbourhoods, integration with municipal infrastructure and the protection of municipal lands and park assets.


46 Objective 5: involved community The City encourages public awareness of programs and initiatives and provides opportunities for public input, involvement, and contributions. City resources provide timely and effective responses to public requests and inquiries and ensure thorough comprehension of local issues and values through the active participation of citizens in advisory roles Measure & Achievement: Public Works Week The City has proclaimed National Public Works Week (NPWW) annually since The NPWW event provides an opportunity to increase awareness of the scope and benefits of the work and services provided through the public works operations. It is also an opportunity to recognize the excellent public service provided by City staff Measure & Achievement: Burnaby Lake Rejuvenation Project The Burnaby Lake Education Centre was created to provide information on the Burnaby Lake Rejuvenation project. Information at the Centre explained the lake's history, the benefits of the dredging project, and how the project will save the lake from filling up and turning into a swamp. The Centre hosted groups from local schools and addressed questions from interested residents Measure & Achievement: Hastings Street Public information was provided for the Hastings Road Improvement and Hastings Sewer Separation projects. Public input and comment on the City's policy, project, service, and facility initiatives were welcome.


47 Measures Completion of Environmental and Social Sustainability Strategies through public awareness and consultation. Inclusion of opportunities for public input and comment on City policy, project, service and facility initiatives, including major public events and concerts Measures Increase public awareness of City construction projects through the City's website. Enhance public participation in waste reduction activities through the new recycling centre Measure & Achievement: Local Heroes awards In 2010, Burnaby celebrated the 14th annual Local Heroes Awards program. Many citizens were honoured as 'Local Heroes' who represent diverse interests and backgrounds, and who have contributed to the community as volunteers. Since 1997, Council has recognized over 200 individuals as Burnaby Local Heroes Measure & Achievement: Anti-Graffiti Program The Anti-Graffiti program continues to see success; instances of reported and identified graffiti in the City decreased from 707 in the period between June 2007 to June 2008 to 193 between June 2009 to June A Mural Grant program was implemented, providing artisitic outlets for creative expression Measure & Achievement: swinging girl neon sign In 2010, the acquisition and restoration of the historic Swinging Girl neon sign was celebrated by a crowd of 200 that cheered the return and relighting of the sign. This much loved heritage landmark now brands the Heights shopping district to new generations of shoppers.

48 Operating Plan
49 ANNUAL financial plan City of Burnaby 49 Five Year Operating summary ExpeNDItures, Revenue and Property Tax Levy tmst Center L01 Cost Center EXPENDITURES Total Expenditures LCity Council 2,158,695 2,191,755 2,225,805 2,260,875 2,297,005 LCity Manager 99,133, ,769, ,584, ,228, ,282,398 L Administrative Services 6,487,309 5,851,468 5,989,938 6,132,548 6,279,448 L Fire 33,965,081 35,682,641 36,771,611 38,752,361 40,803,281 L Police 47,139,652 49,829,287 52,150,692 54,397,607 56,971,372 L Library 11,541,523 11,405,972 11,671,987 11,946,012 12,228,297 LEngineering 141,481, ,387, ,735, ,006, ,094,311 L Engineering 64,169,930 67,203,700 68,901,140 70,475,750 71,933,050 L Utilities 77,311,253 85,183,661 90,834,631 95,530,761 99,161,261 LFinance 30,056,124 30,747,794 31,282,714 31,801,284 33,303,904 LPlanning & Building 11,340,364 11,617,214 11,938,414 12,269,254 12,625,014 LParks, Recreation & Cultural Services 58,864,762 61,908,712 64,440,952 66,434,202 68,342,962 LFiscal Items 13,589,109 12,942,664 15,823,664 18,324,664 20,560,664 TOTAL EXPENDITURES 356,623, ,564, ,031, ,325, ,506,258 REVENUE Total Revenue LCity Council (89,685) (89,685) (89,685) (89,685) (89,685) LCity Manager (6,374,428) (5,171,421) (5,171,421) (5,171,421) (5,171,421) L Administrative Services (966,681) (196,410) (196,410) (196,410) (196,410) L Fire (216,550) (216,550) (216,550) (216,550) (216,550) L Police (3,529,925) (3,529,925) (3,529,925) (3,529,925) (3,529,925) L Library (1,661,272) (1,228,536) (1,228,536) (1,228,536) (1,228,536) LEngineering (88,016,438) (95,888,846) (101,539,816) (106,235,946) (109,866,446) L Engineering (10,705,185) (10,705,185) (10,705,185) (10,705,185) (10,705,185) L Utilities (77,311,253) (85,183,661) (90,834,631) (95,530,761) (99,161,261) LFinance (11,998,700) (11,998,700) (11,998,700) (11,998,700) (11,998,700) LPlanning & Building (6,315,349) (6,345,349) (6,350,349) (6,355,349) (6,355,349) LParks, Recreation & Cultural Services (21,615,627) (21,230,627) (21,230,627) (21,230,627) (21,230,627) LFiscal Items (22,237,142) (18,801,697) (18,801,697) (18,801,697) (18,801,697) Total Departmental & Fiscal Revenue (156,647,369) (159,526,325) (165,182,295) (169,883,425) (173,513,925) Tax Levies For City Services (196,359,640) (210,238,080) (221,147,739) (232,672,854) (245,216,844) TOTAL REVENUE (353,007,009) (369,764,405) (386,330,034) (402,556,279) (418,730,769) LNon-cash Item (Depreciation Balance) (3,616,795) (4,800,465) (5,701,514) (5,769,039) (5,775,489) Capital Expenditures 159,237, ,655, ,978, ,048, ,987,405 Reserve Funding Capital Works, Machinery & Equipment Reserves 82,813,300 87,538,120 62,479,825 70,737,075 59,467,325 Local Improvement Reserve 4,409,725 2,000,000 2,000,000 2,000,000 2,000,000 Vehicle Equipment Replacement Reserves 3,390,000 5,573,000 5,297,250 4,597,670 2,166,000 General Replacement Fund 12,990,945 8,681,080 9,151,080 9,514,080 9,704,080 Utilities & Utility Replacement Fund 31,182,610 29,900,000 28,800,000 30,550,000 30,600,000 Gaming 14,795,205 27,761,830 22,100,000 19,600,000 19,000,000 DCC & Density 3,000,000 2,300,000 2,300,000 2,000,000 2,000,000 Others 6,655,860 1,901, ,000 50,000 50,000 TOTAL CAPITAL FUNDING SOURCES 159,237, ,655, ,978, ,048, ,987,405
50 50 City of Burnaby ANNUAL financial plan Five Year Provision from General Revenue to Departments tmst Center L01 Cost Center Total Expenditures LCity Council 2,069,010 2,102,070 2,136,120 2,171,190 2,207,320 LCity Manager 92,759,137 97,597, ,412, ,057, ,110,977 L Administrative Services 5,520,628 5,655,058 5,793,528 5,936,138 6,083,038 L Fire 33,748,531 35,466,091 36,555,061 38,535,811 40,586,731 L Police 43,609,727 46,299,362 48,620,767 50,867,682 53,441,447 L Library 9,880,251 10,177,436 10,443,451 10,717,476 10,999,761 LEngineering 53,464,745 56,498,515 58,195,955 59,770,565 61,227,865 L Engineering 53,464,745 56,498,515 58,195,955 59,770,565 61,227,865 L Utilities LFinance 18,057,424 18,749,094 19,284,014 19,802,584 21,305,204 LPlanning & Building 5,025,015 5,271,865 5,588,065 5,913,905 6,269,665 LParks, Recreation & Cultural Services 37,249,135 40,678,085 43,210,325 45,203,575 47,112,335 LFiscal Items (8,648,033) (5,859,033) (2,978,033) (477,033) 1,758,967 LLess: Non-cash Item (Depreciation Balance) (3,616,795) (4,800,465) (5,701,514) (5,769,039) (5,775,489) TAX LEVIES FOR CITY SERVICES 196,359, ,238, ,147, ,672, ,216,844
51 ANNUAL financial plan City of Burnaby 51 Property Tax Rate Changes Property tax increases will be allocated between property classes, using the same rate of increase for all classes; except where the rates are under the control of Provincial legislation or directly related to other property classes. Rate Structure objectives Individual property class rates will not be set based on arbitrary ratios or tax burden. Ratios and burden metrics are calculated from assessed values that are not equivalent or comparable between classes. Also, the market value change in individual tax classes is independent of the market impact on other classes and therefore constantly changes, over time, at differing rates. The lack of homogeneity between classes renders ratios and burdens unacceptable for property tax rate setting policy purposes. Property taxes are not a fee for service or user fee; they are an allocation of the cost of government services based on the assessed value of land and improvements and will, therefore, not be set, in relation to estimates of services consumed. The property tax rates, as dictated by the amended Community Charter, will be set with consideration to the following assessment class objectives: General To fairly allocate the municipal tax levy, by property class, based on the assessed value of land and its associated improvements. Residential To maintain a stable and predictable level of tax for the residential property class in order to support objectives for sustaining Burnaby s residential neighbourhoods and community services, affordable home ownership, affordable rental housing, and security of tenure. Utilities To recover the share of the tax draw for public and private utility properties in Burnaby as defined and established by Provincial legislation. Major Industry To maintain a stable and predictable level of tax for major industrial properties in Burnaby. This supports objectives for sustaining existing local employment-based industries with defined services and amenities for the long-term benefit of the community, broader economic activity and for its employees and customers. Light Industry To maintain a stable and predictable level of tax for light industrial properties in Burnaby, at a level equivalent to the Business tax class, in order to attract and sustain local employment based industries with services and amenities for the long-term benefit of the community, local economic activity, and for its employees and customers. Business To maintain a stable and predictable level of tax for commercial business properties in Burnaby in order to attract and sustain local employment based businesses and in order to foster vibrant commercial precincts to serve the City that are supported by a broad level of community services and amenities, for the longterm benefit of the community, local economic activity, and for its employees and customers. Recreation To maintain a stable and predictable level of tax for privatelyowned recreational and social properties in Burnaby in order to support delivery of recreational services and amenities of benefit to citizens, business and visitors that are supported by a broad level of community services and amenities. Farm To maintain a stable and predictable level of tax for agricultural properties in Burnaby in order to support, establish and sustain a viable local farming sector for food and agricultural production businesses in addition to protecting the defined Agricultural Land Reserve and the adopted regional green zone, which are supported by a broad level of community services and amenities.
52 52 City of Burnaby ANNUAL financial plan Permissive exemption Objectives: Council is empowered to exempt land and buildings from taxation for services or organizations which are the most complementary extensions of government services, provided that the burden resulting from the exemption is justifiable to taxpayers of Burnaby. guidelines Council, in 1986, adopted a set of guidelines as the basis for assessing applications for permissive exemption from taxation. The guidelines ensure that organizations recommended for permissive exemption under Section 224 of the Community Charter are: a. Consistent with municipal policies, plans, bylaws, codes and regulations b. Non-profit c. Complementary extensions to municipal services and programs d. Accessible to the public e. Used primarily by Burnaby residents Council adopted these guidelines to ensure that the broad range of community organizations in Burnaby are dealt with consistently and receive equal treatment and consideration for tax exemption. The spirit in using the guidelines is one of identifying the services and organization which are the most complementary extensions of municipal services, and for which the burden resulting from the exemption is a justifiable expense to the taxpayers of Burnaby. As a further step in dealing with permissive exemptions, Council, in 1987, resolved that residential facilities including seniors housing, community care facilities, licenced group homes, private hospitals and assisted family housing would not be considered for permissive exemption from taxation.
53 ANNUAL financial plan City of Burnaby 53 Tax Levy for City Services Class Revised Roll % of Assessments Municipal Purposes Tax Levy % Tax Load by Class Tax Rate ( per 1,000 of Assessment) Increase (Decrease) in Tax Rate* Versus 2010 Relationship Res. = 1.0 Residential 39,503,527, % 93,903, % % 1.00 Utilities 145,326, % 5,023, % % Supportive Housing % % N/A 1.00 Major Industry 161,950, % 7,081, % % Light Industry 933,495, % 9,363, % % 4.22 Business 8,065,615, % 80,903, % % 4.22 Recreation 45,778, % 70, % % 0.65 Farm 1,331, % 13, % % ,857,025, % 196,359, % Class 2010 Revised Roll % of Assessments Municipal Purposes Tax Levy % Tax Load by Class Tax Rate ( per 1,000 of Assessment) Increase (Decrease) in Tax Rate* Versus 2009 Relationship Res. = 1.0 Residential 34,725,252, % 89,823, % % 1.00 Utilities 149,580, % 4,877, % % Supportive Housing % % N/A 1.00 Major Industry 154,742, % 6,883, % % Light Industry 811,755, % 8,141, % % 3.88 Business 7,798,676, % 78,217, % % 3.88 Recreation 41,456, % 69, % % 0.65 Farm 1,331, % 13, % % ,682,794, % 188,026, % * After adjusting for the BC Assessment Authority general assessment increase and new growth.
54 54 City of Burnaby ANNUAL financial plan Assessments, Tax Rates & Taxes Levied for City Purposes Assessments Class 2009 Budget Revised Roll 2010 Budget Revised Roll Budget Revised Roll Residential 1 34,187,822,202 34,725,252,350 39,503,527,953 Utilities 2 143,869, ,580, ,326,500 Supportive Housing Major Industry 4 142,115, ,742, ,950,500 Light Industry 5 714,632, ,755, ,495,800 Business 6 7,534,035,919 7,798,676,429 8,065,615,493 Recreation 8 40,833,800 41,456,500 45,778,200 Farm 9 1,328,773 1,331,414 1,331,350 42,764,637,436 43,682,794,490 48,857,025,800 Tax Rates ( of tax per 1,000 of assessed value) Class Residential Utilities Supportive Housing Major Industry Light Industry Business Recreation Farm Taxes Levied By Class Class Residential 1 84,731,097 89,823,802 93,903,837 Utilities 2 4,658,604 4,877,099 5,023,312 Supportive Housing Major Industry 4 6,298,948 6,883,618 7,081,528 Light Industry 5 7,090,007 8,141,579 9,363,616 Business 6 74,746,677 78,217,605 80,903,760 Recreation 8 69,094 69,203 70,233 Farm 9 13,183 13,354 13, ,607, ,026, ,359,640
55 ANNUAL financial plan City of Burnaby 55 ASsessments, tax Rates & taxes Levied for Other Rate Setting Bodies School Assessment Residential Assessment Non-Residential Assessment Greater Vancouver Transportation Authority Used for GVRD, GVTA, BCAA and MFAA 2010 Revised Roll 34,727,563,300 9,279,539,683 44,007,102,983 43,761,417,615 Revised Roll 39,506,827,553 9,699,451,443 49,206,278,996 48,934,962, Assessments by Property Class Class School GVTA Residential 1 34,727,563,300 34,721,006,400 Utilities 2 370,578, ,115,195 Supportive Housing Major Industry 4 154,742, ,742,300 Light Industry 5 811,755, ,755,100 Business 6 7,900,250,429 7,798,676,429 Recreation 8 41,547,800 41,456,500 Farm , ,689 44,007,102,983 43,761,417,615 Class School GVTA Residential Utilities Supportive Housing Major Industry Light Industry Business Recreation Farm ,506,827, ,420, ,950, ,495,800 8,181,041,343 45,877, ,657 39,497,955, ,501, ,950, ,495,800 8,065,615,493 45,778, ,657 49,206,278,996 48,934,962,607

56 56 City of Burnaby ANNUAL financial plan ASsessments, tax Rates & taxes Levied for Other Rate Setting Bodies 2010 Tax Rates* Class SCHOOL GVRD BCAA MFA GVTA Residential Utilities Supportive Housing Major Industry Light Industry Business Recreation Farm * ( of Tax Per 1000 of Assessed Value) Tax Levied Class SCHOOL GVRD BCAA MFA GVTA Residential 1 62,662,415 2,385,335 2,305,475 6,945 13,200,925 Utilities 2 5,336,330 56, , ,935 Supportive Housing Major Industry 4 526,125 36,145 78, ,760 Light Industry 5 2,759, , , ,618,395 Business 6 53,721,705 1,312,515 1,549,595 3,900 13,108,015 Recreation 8 145,415 2,850 2, ,915 Farm 9 4, ,156,480 3,982,580 4,215,070 11,690 28,920,180 Tax Rates* Class SCHOOL GVRD BCAA MFA GVTA Residential Utilities Supportive Housing Major Industry Light Industry Business Recreation Farm * ( of Tax Per 1000 of Assessed Value) Taxes Levied Class SCHOOL GVRD BCAA MFA GVTA Residential 1 66,051,465 2,468,620 2,452,825 7,900 13,824,285 Utilities 2 5,307,525 50, , ,305 Supportive Housing Major Industry 4 427,550 34,415 82, ,500 Light Industry 5 2,464, , , ,832,080 Business 6 53,994,870 1,234,845 1,529,240 4,035 12,974,350 Recreation 8 155,985 2,860 2, ,005 Farm 9 2, ,404,090 3,989,370 4,362,125 12,870 29,633,760
57 ANNUAL financial plan City of Burnaby 57 Summary of ExpeNDItures and Revenue 2009 Actuals 2010 Actuals 2010 Annual Provisional Annual EXPENDITURES City Council 2,689,288 2,354,498 2,103,845 2,160,436 2,158,695 City Manager 96,332,732 96,566,664 94,305,814 98,917,279 99,133,566 Administrative Services 8,793,679 5,927,421 5,204,087 6,434,943 6,487,309 Fire 33,002,181 34,578,861 33,453,875 33,386,885 33,965,081 Police 43,549,405 44,808,212 44,063,094 47,363,413 47,139,652 Library 10,987,468 11,252,169 11,584,758 11,732,038 11,541,523 Engineering 133,891, ,315, ,172, ,004, ,481,183 Engineering 65,125,895 64,030,875 62,783,689 65,693,547 64,169,930 Utilities 68,765,118 73,284,436 72,389,091 77,311,253 77,311,253 Finance 28,805,914 29,006,669 28,938,229 28,796,327 30,056,124 Planning & Building 9,201,331 9,838,267 10,889,471 11,276,702 11,340,364 Parks, Recreation & Cultural Services 54,907,572 56,466,743 58,319,977 58,496,971 58,864,762 Fiscal Items 13,714,764 7,439,900 9,456,727 12,702,694 13,589,109 Total Expenditures 339,542, ,988, ,186, ,355, ,623,804 REVENUE City Council (333,248) (25,365) (127,185) (127,185) (89,685) City Manager (7,827,545) (5,095,940) (5,043,670) (5,102,317) (5,171,421) Administrative Services (2,265,589) (287,596) (188,965) (196,010) (196,410) Fire (155,043) (158,603) (216,550) (216,550) (216,550) Police (4,108,797) (3,422,149) (3,473,515) (3,529,925) (3,529,925) Library (1,298,117) (1,227,592) (1,164,640) (1,159,832) (1,228,536) Engineering (81,394,881) (84,020,424) (82,864,067) (87,062,438) (88,016,438) Engineering (12,629,763) (10,735,988) (10,474,976) (9,751,185) (10,705,185) Utilities (68,765,118) (73,284,436) (72,389,091) (77,311,253) (77,311,253) Finance (11,595,628) (11,034,109) (11,035,900) (12,171,700) (11,998,700) Planning & Building (6,688,511) (9,141,601) (5,582,298) (6,280,349) (6,280,349) Parks, Recreation & Cultural Services (20,996,492) (20,631,631) (20,832,079) (20,895,844) (21,230,627) Fiscal Items (21,299,319) (19,681,097) (16,507,749) (17,017,571) (18,801,697) Stabilization & Surplus (11,869,715) (1,344,156) (2,167,633) (2,053,628) (5,058,452) Total Departmental & Fiscal Revenue (162,005,335) (150,974,322) (144,160,581) (150,711,032) (156,647,369) Tax Levy for City Services (177,584,269) (188,013,729) (188,026,260) (197,644,175) (196,359,640) Total Revenue (339,589,604) (338,988,051) (332,186,841) (348,355,207) (353,007,009) Non-cash Item (Depreciation Balance) 46,993 - (7,000,000) (7,000,000) (3,616,795) Total Revenue & Non-Cash Item (339,542,611) (338,988,051) (339,186,841) (355,355,207) (356,623,804)
58 58 City of Burnaby ANNUAL financial plan Provision from/(to) General Revenue to/(from) Departments 2009 Actuals 2010 Actuals 2010 Annual Provisional Annual City Council 2,312,168 2,329,133 1,976,660 2,033,251 2,069,010 City Manager 87,619,917 91,063,091 88,854,511 92,846,334 92,759,138 Administrative Services 6,506,368 5,639,825 5,015,122 5,495,305 5,520,628 Fire 32,847,138 34,420,258 33,237,325 33,170,335 33,748,531 Police 39,440,608 41,386,064 40,589,579 43,833,488 43,609,727 Library 8,825,803 9,616,944 10,012,485 10,347,206 9,880,251 Engineering 51,247,255 53,294,887 52,308,713 55,942,362 53,464,745 Finance 14,665,648 17,288,668 17,227,328 16,624,627 18,057,424 Planning & Building 2,359, ,064 5,272,173 4,961,353 5,025,015 Parks, Recreation & Cultural Services 33,404,660 35,835,112 37,487,898 37,601,127 37,249,136 Fiscal Items (14,071,947) (12,493,226) (8,101,022) (5,364,877) (8,648,033) Non-cash Item (Depreciation Balance) 46,993 - (7,000,000) (7,000,000) (3,616,795) Tax Levy For City Services 177,584, ,013, ,026, ,644, ,359,640
59 ANNUAL financial plan City of Burnaby 59 Graphical DistrIBUtion of ExpeNDItures 16.5% Parks, Recreation and Cultural Services 12.2% Waterworks 9.5% Sanitary Sewer 13.2% Police 3.2% Planning and Building 356,623, % Library 3.4% Solid Waste 14.6% Public Works 9.5% Fire 14.7% General Government Services Graphical DistrIBUtion of Sources of Revenue 12.2% Waterworks 1.0% Non-Cash Item 9.5% Sanitary Sewer 1.8% Prior Year s Surplus, Stabilization and Reserves 1.9% Investment Income 2.4% Property Rentals 356,623, % User Fees and Other Revenues 2.5% Donations and Grants 55.1% Tax Levies 3.0% Inspections and Licence Fees
60 60 City of Burnaby ANNUAL financial plan City CoUNCIl 2009 Actuals 2010 Actuals 2010 Annual Provisional Annual EXPENDITURES Mayor & Council 1,000, , , , ,368 Committees & Boards 486, , , , ,850 Administration 182, , , , ,617 Grants 986, , , , ,340 Bus Pass Program 19,114 23,174 38,000 38,000 38,000 Consultants 14,114 51,228 65,520 65,520 65,520 Total Expenditures 2,689,288 2,354,498 2,103,845 2,160,436 2,158,695 REVENUE Mayor & Council (4,533) (2,040) (35,000) (35,000) (2,500) Committees & Boards (1,649) (23,325) (92,185) (92,185) (87,185) Grants (327,066) Stabilization & Surplus (43,872) Total Revenue (377,120) (25,365) (127,185) (127,185) (89,685) FUNDING REQUIRED Provision From General Revenue 2,312,168 2,329,133 1,976,660 2,033,251 2,069,010
61 ANNUAL financial plan City of Burnaby 61 Schedule of Donation and Grant ExpeNDItures 2009 Actual 2009 Annual 2010 Provisional Provisional 115 Place Housing Coop Housing Association Air Cadets Apex Volleyball B.C. Centre for Ability Association Big Brothers of Greater Vancouver Big Sisters of B.C. Lower Mainland Boy Scouts of Canada Burnaby Association for Community Inclusion Burnaby Barracudas Burnaby Christmas Bureau Burnaby Community Connections Burnaby Community Connections Recreation Credit Program Burnaby Family Life Institute Burnaby Fellowship Centre Society Burnaby Firefighters Charitable Society Burnaby Girls Soccer Club Burnaby Hospital Foundation Burnaby Meals On Wheels Society Burnaby Minor Baseball Association Burnaby Minor Lacrosse Association Burnaby Minor Softball Association Burnaby North Secondary School-Viking Marching Band Burnaby Seniors Outreach Services Society Burnaby South Rebels Basketball Team Burnaby Volunteer Citizen Support Services Canadian Mental Health Association Canadian Red Cross - Burnaby Branch Canadian University Sport Central Park Citizen Society Chelsea Terrace Senior Citizen Tenants Association Coastal Sound International Choral Community-Centred College for the Retired Confederation Centre for the Retired Crisis Intervention & Suicide Prevention Centre of B.C. Deaf Children's Society of B.C. Edmonds Town Centre Business and Community Association Fair Haven Super Seniors Fiji Indian Association Festival Focus Volleyball Club Fraser Valley Square and Round Dance Association Hastings Community Little League Immigrant Services Society of BC Kids Help Phone - 20th Anniversary Labour Community Christmas Dinner Maple Leaf Singers Marguerite Dixon Transition Society Metro Vancouver Housing Corporation Michael J. Fox Theatre Golf Tournament Moscrop Sec School - Dry Grad Moscrop Sec School Robotics Team Mountain WFC 13 & Under Boys Soccer Team New Vista Society - Vista Tower New Vista Society - Winch Tower North Burnaby Boxing Club Society North Delta Softball Association Richard Major Art Group Royal Canadian Air Cadets Scouts Canada SFU - Fraser River Journey-200 Years Of Discovery South Burnaby Metro Club South Burnaby Neighbourhood House South Slope Elementary School Special Olympics St. Matthews Day Care Society TB Vets Charitable Foundation Universal Cultural Society Of Canada - Diwalifest Volleyball B.C. Volunteer Burnaby Wildlife Rescue Association of B.C. YMCA of Greater Vancouver Provision for grants and donations ,559 3,000 3,000 6,024 15,655 1,500 6,132 31,761 24,790 46, ,929 1,625 7,680 9, ,252 1, ,592 8, ,500 3,656 1,200 4,000 6,532 2, , ,050 6, , , , , ,728 4,500 10,000 1,000 5,000 1, ,005 1,000 1, ,705 5, , , , , , , ,340
62 62 City of Burnaby ANNUAL financial plan CITY MANAGER DEPARTMENTAL ORGANIZATION CHART EXECUTIVE ASSISTANT (1.08) *CITY MANAGER *DEPUTY CITY MANAGER (28.27) *DEPUTY CITY MANAGER FILMING COORDINATOR (2.03) EXECUTIVE ASSISTANT *DIRECTOR ENGINEERING *DIRECTOR FINANCE *DIRECTOR PLANNING & BUILDING *DIRECTOR PARKS, RECREATION & CULTURAL SERVICES *CHIEF LIBRARIAN (138.71) *FIRE CHIEF (286.00) *O.I.C. R.C.M.P. (422.15) ERP PROJECT PROGRAM MANAGER DIRECTOR HUMAN RESOURCES (20.57) R.C.M.P. Regular Members Regular Temporary Regular Integrated Full Time Full-Time Part-Time Auxiliary Contract Teams Total Manager s Office City Clerk Citizen Support Services Legal Services Fire Department Police Library Human Resources TOTAL * Members of the Management Committee.
63 ANNUAL financial plan City of Burnaby 63 City Manager - summary 2009 Actuals 2010 Actuals 2010 Annual Provisional Annual EXPENDITURES Administrative Services 8,793,679 5,927,421 5,204,087 6,434,943 6,487,309 Manager's Office 3,824,065 1,039, ,379 1,114,109 1,104,108 City Clerk 1,033,892 1,078,899 1,116,202 1,908,995 1,908,999 Human Resources 1,984,306 2,240,493 2,160,346 2,346,796 2,244,087 Legal Services 1,630,126 1,214, , , ,593 Citizen Support Services 321, , , , ,522 Fire 33,002,181 34,578,861 33,453,875 33,386,885 33,965,081 Police 43,549,405 44,808,212 44,063,094 47,363,413 47,139,652 Library 10,987,468 11,252,169 11,584,758 11,732,038 11,541,523 Total Expenditures 96,332,732 96,566,664 94,305,814 98,917,279 99,133,566 REVENUE Administrative Services (2,265,589) (287,596) (188,965) (196,010) (196,410) Manager's Office (2,065,064) (43,056) (50,000) (50,000) (40,000) City Clerk (3,859) (95) (500) (500) (500) Human Resources (17,300) (20,675) (38,500) (38,500) (38,500) Legal Services (135,250) (190,069) (44,305) (44,305) (64,305) Citizen Support Services (44,116) (33,702) (55,660) (62,705) (53,105) Fire (155,043) (158,603) (216,550) (216,550) (216,550) Police (4,108,797) (3,422,149) (3,473,515) (3,529,925) (3,529,925) Library (1,298,117) (1,227,592) (1,164,640) (1,159,832) (1,228,536) Stabilization & Surplus (885,270) (407,633) (407,633) (968,628) (1,203,007) Total Revenue (8,712,815) (5,503,573) (5,451,303) (6,070,945) (6,374,428) FUNDING REQUIRED Provision From General Revenue 87,619,917 91,063,091 88,854,511 92,846,334 92,759,138
64 64 City of Burnaby ANNUAL financial plan CITY MANAGER S OFFICE DEPARTMENTAL ORGANIZATION CHART CITY MANAGER EXECUTIVE ASSISTANT (1.08) DEPUTY CITY MANAGER DEPUTY CITY MANAGER EXECUTIVE ASSISTANT FILMING COORDINATOR (2.03) Regular Temporary Regular Full Time Full-Time Part-Time Auxiliary Total Manager s Office Filming Coordinator TOTAL FTE
65 ANNUAL financial plan City of Burnaby 65 City Manager s office 2009 Actuals 2010 Actuals 2010 Annual Provisional Annual EXPENDITURES City Manager's Office 817, , , , ,716 Filming Coordination 101, , , , ,392 BC 2009 World Police & Fire Games 2,905,058 16, Total Expenditures 3,824,065 1,039, ,379 1,114,109 1,104,108 REVENUE Filming Coordination (14,300) (25,896) (50,000) (50,000) (40,000) BC 2009 World Police & Fire Games (2,050,764) (17,160) Total Revenue (2,065,064) (43,056) (50,000) (50,000) (40,000) FUNDING REQUIRED Provision From General Revenue 1,759, , ,379 1,064,109 1,064,108
66 66 City of Burnaby ANNUAL financial plan CITY CLERK DEPARTMENTAL ORGANIZATION CHART DEPUTY CITY MANAGER CITY CLERK RECORDS & INFORMATION ADMINISTRATOR DEPUTY CITY CLERK (1.77) ARCHIVIST (1.27) ARCHIVAL ASSISTANT ADMINISTRATIVE OFFICER 1 (3.00) CLERK TYPIST 3 (3.20) CLERK 3 (2.00) RECORDS & INFORMATION CLERK ELECTION SUPERVISOR* ADMINISTRATIVE OFFICER 1 ELECTION CLERK TYPIST 3* (.48) Regular Temporary Regular Full Time Full-Time Part-Time Auxiliary Total City Clerk Clerk s Admin City Archive Operations Deputy City Clerk Elections * TOTAL FTE * Election staff are hired only during election years.
67 ANNUAL financial plan City of Burnaby 67 City Clerk 2009 Actuals 2010 Actuals 2010 Annual Provisional Annual EXPENDITURES Clerk's Office 906, ,749 1,001,666 1,042,686 1,016,047 Elections 22,222 6,075 6, , ,201 City Archives Operations 105, , , , ,751 Total Expenditures 1,033,892 1,078,899 1,116,202 1,908,995 1,908,999 REVENUE Clerk's Office (3,359) (95) (500) (500) (500) Elections (500) Stabilization & Surplus (21,722) - - (743,628) (770,271) Total Revenue (25,581) (95) (500) (744,128) (770,771) FUNDING REQUIRED Provision From General Revenue 1,008,310 1,078,804 1,115,702 1,164,867 1,138,228
68 68 City of Burnaby ANNUAL financial plan HUMAN RESOURCES DEPARTMENTAL ORGANIZATION CHART CITY MANAGER BURNABY MUNICIPAL BENEFIT SOCIETY DIRECTORS BMBS SECRETARY (0.66) BMBS ASSISTANT HUMAN RESOURCES DIRECTOR HUMAN RESOURCES CLERK RECEPTION ASSISTANT HUMAN RESOURCES DIRECTOR MANAGER COMPENSATION MANAGER TRAINING & ORGANIZATIONAL DEV. HR ADVISOR RETURN TO WORK MANAGER OCCUPATIONAL HEALTH & RETURN TO WORK MANAGER EMPLOYMENT SERVICES SENIOR HR ADVISOR HR SYSTEMS SPECIALIST HR ASSISTANT TRAINING HR ADVISOR RECRUITMENT (4.50) HR SYSTEMS ANALYST HR CLERK RECRUITMENT (2.41) Regular Temporary Regular Full Time Full-Time Part-Time Auxiliary Total Human Resources Occupational Health & Return to Work Training & Organizational Development Benefits (BMBS) TOTAL
69 ANNUAL financial plan City of Burnaby 69 Human Resources 2009 Actuals 2010 Actuals 2010 Annual Provisional Annual EXPENDITURES Human Resource Services 1,144,027 1,288,261 1,411,061 1,445,031 1,342,322 Occupational Health & Safety 337, , , , ,792 Benefits Administration 105, , , , ,610 Training & Organizational Development 397, , , , ,363 Total Expenditures 1,984,306 2,240,493 2,160,346 2,346,796 2,244,087 REVENUE Human Resource Services (9,216) (18,456) (18,500) (18,500) (18,500) Occupational Health & Safety (290) Training & Organizational Development (7,794) (2,219) (20,000) (20,000) (20,000) Total Revenue (17,300) (20,675) (38,500) (38,500) (38,500) FUNDING REQUIRED Provision From General Revenue 1,967,006 2,219,818 2,121,846 2,308,296 2,205,587
70 70 City of Burnaby ANNUAL financial plan LEGAL SERVICES DEPARTMENTAL ORGANIZATION CHART DEPUTY CITY MANAGER CITY SOLICITOR PROPERTY NEGOTIATORS (2.00) CLERICAL STAFF (0.40) LEGAL ASSISTANTS (1.60) Regular Temporary Regular Full Time Full-Time Part-Time Auxiliary Total Legal Services TOTAL
71 ANNUAL financial plan City of Burnaby 71 Legal Services 2009 Actuals 2010 Actuals 2010 Annual Provisional Annual EXPENDITURES Legal 1,630,126 1,214, , , ,593 Total Expenditures 1,630,126 1,214, , , ,593 REVENUE Legal (135,250) (190,069) (44,305) (44,305) (64,305) Total Revenue (135,250) (190,069) (44,305) (44,305) (64,305) FUNDING REQUIRED Provision From General Revenue 1,494,876 1,024, , , ,288
72 72 City of Burnaby ANNUAL financial plan CITIZEN SUPPORT SERVICES DEPARTMENTAL ORGANIZATION CHART DEPUTY CITY MANAGER ADMINISTRATOR CITIZEN SUPPORT SERVICES ASSISTANT COORDINATORS OF VOLUNTEERS (2.53) CLERICAL STAFF (1.02) Regular Temporary Regular Full Time Full-Time Part-Time Auxiliary Total Citizen Support TOTAL
73 ANNUAL financial plan City of Burnaby 73 Citizen support Services 2009 Actuals 2010 Actuals 2010 Annual Provisional Annual EXPENDITURES Citizen's Support 286, , , , ,677 Citizen's Support Programs 34,330 21,002 40,839 39,445 41,845 Total Expenditures 321, , , , ,522 REVENUE Citizen's Support (645) Citizen's Support Programs (43,471) (33,702) (55,660) (62,705) (53,105) Total Revenue (44,116) (33,702) (55,660) (62,705) (53,105) FUNDING REQUIRED Provision From General Revenue 277, , , , ,417
74 74 City of Burnaby ANNUAL financial plan FIRE DEPARTMENT DEPARTMENTAL ORGANIZATION CHART FIRE CHIEF DEPUTY FIRE CHIEF (ADMINISTRATION) STAFF OFFICER DEPUTY FIRE CHIEF (OPERATIONS) ASSISTANT FIRE CHIEF (ADMINISTRATION) ASSISTANT FIRE CHIEFS (4.00) ASSISTANT FIRE CHIEF PREVENTION OFFICER ASSISTANT CHIEF TRAINING OFFICER CAPTAINS FIRE PREVENTION (3.00) CAPTAINS TRAINING ADMINISTRATIVE ASSISTANT FIRE CAPTAINS (38.00) SENIOR MECHANIC FIRE INSPECTORS (4.00) ADMINISTRATIVE CLERK (3.00) FIRE LIEUTENANTS (33.00) MECHANICS (2.00) DATA ENTRY FIREFIGHTERS (188.00) Regular Temporary Regular Full Time Full-Time Part-Time Auxiliary Total Fire Staff Officer Fire Administration Fire Prevention Firefighting Mechanical Services Fire Training TOTAL
75 ANNUAL financial plan City of Burnaby 75 Fire 2009 Actuals 2010 Actuals 2010 Annual Provisional Annual EXPENDITURES Administration 823, , , , ,982 Prevention 764,346 1,128,715 1,116,659 1,117,578 1,117,578 Training 435, , , , ,820 Fire Fighting 28,229,581 29,032,050 28,349,964 28,470,786 28,776,821 Firehalls Station Operations 1,002, , , , ,872 Mechanical Services 1,746,146 2,033,174 1,470,636 1,469,241 1,736,009 Total Expenditures 33,002,181 34,578,861 33,453,875 33,386,885 33,965,081 REVENUE Administration (60,719) (9,021) (57,450) (57,450) (57,450) Prevention (78,505) (115,324) (130,600) (130,600) (130,600) Training (15,373) (31,510) (28,000) (28,000) (28,000) Fire Fighting - - (500) (500) (500) Firehalls Station Operations - (2,533) Mechanical Services (445) (216) Total Revenue (155,043) (158,603) (216,550) (216,550) (216,550) FUNDING REQUIRED Provision From General Revenue 32,847,138 34,420,258 33,237,325 33,170,335 33,748,531
76 76 City of Burnaby ANNUAL financial plan POLICE DEPARTMENTAL ORGANIZATION CHART OFFICER IN CHARGE BURNABY DETACHMENT (1.00 R/M) IHIT (INTEGRATED HOMICIDE INVESTIGATION TEAM) (6.60 R/M) ERT (EMERGENCY RESPONSE TEAM) (4.10 R/M) EXECUTIVE NCO (1.00 R/M) EXECUTIVE ASSISTANT (1.00 C/E) FORENSIC IDENTIFICATION (7.10 R/M C/E) Strategic Planning Professional Standards Media Relations Crime Analyst (1.00 R/M) (1.00 R/M) (1.00 R/M) (1.00 C/E) POLICE DOG SERVICE (4.60 R/M) ICARS (INTEGRATED COLLISION ANALYST/RECONSTRUCTION) (2.10 R/M) OPERATIONS OFFICER / ASSISTANT OIC (1.00 R/M) ADMIN SERVICES OFFICER (1.00 R/M) ASSISTANT OPERATIONS OFFICER / DUTY OFFICER (1.00 R/M) COMMUNITY PROGRAMS OFFICER (1.00 R/M) INVESTIGATIVE SERVICES OFFICER (1.00 R/M) ADMIN SERVICES ADVISORY NCO (1.00 R/M) A Watch (29.00 R/M, 1.00 C/E) B Watch (29.00 R/M, 1.00 C/E) C Watch (29.00 R/M, 1.00 C/E) D Watch (29.00 R/M, 1.00 C/E) Traffic Services (27.00 R/M, 1.00 C/E) Emergency & Major Event Management (1.00 R/M) O.C.C. (31.85 C/E) COMMUNITY PROGRAMS ADVISORY NCO (1.00 R/M) District CPO Ops NCO (20.00 R/M, 4.96 C/E) Youth/SLO (11.00 R/M) P.O.S.T (13.00 R/M) CP/VS (2.00 R/M, C/E) Crime Analyst (1.00 C/M) INVESTIGATIVE SERVICES ADVISORY NCO (1.00 R/M) Serious Crime (10.00 R/M) Team GIS (11.00 R/M) General GIS (12.00 R/M, 2.30 C/E) Strike Force (17.00 R/M) Drugs (13.00 R/M, 1.00 C/E) Major Case Manager (1.00 C/M, (1.00 C/E) Crime Analyst (1.00 C/M) Client Services Training Member Services Financial Services IT Support (3.00 R/M, C/E) (4.00 R/M) (1.00 R/M) (5.60 C/E) (5.00 C/E) Legend OIC Officer in Charge NCO Non-Commissioned Officer R/M Contract Regular Member C/M Contract Civilian Member C/E City Employee City Employees RCMP Contract Regular Regular Regular Civilian Full Time Part-Time Auxiliary Members Members Total Officer in Charge Executive Operations Officer Assistant Operations Officer Community Programs Officer Investigative Services Officer Administrative Services Officer Integrated Teams TOTAL
77 ANNUAL financial plan City of Burnaby 77 Police 2009 Actuals 2010 Actuals 2010 Annual Provisional Annual EXPENDITURES RCMP Contract 34,651,956 35,411,714 34,516,680 37,305,010 37,062,330 Administration 371, , , , ,745 Business Services 652, , ,394 1,069,917 1,090,826 Brentwood/Hastings CPO 216, , , , ,742 Lougheed CPO 162, , , , ,534 Southeast District CPO 130, , , , ,814 Crystal Square CPO 154, , , , ,156 Support Services 6,022,170 6,266,640 6,141,289 6,205,292 6,232,422 Youth Services 207, , , , ,180 Victim Services 262, , , , ,278 Information Technology 434, , , , ,680 Police Programs 122, , , , ,765 Crime Free Multi-Housing 64,917 71,642 72,146 77,664 77,664 Block Watch Program 95,818 70, , , ,517 Total Expenditures 43,549,405 44,808,212 44,063,094 47,363,413 47,139,652 REVENUE RCMP Contract (551,007) Administration (2,685,019) (2,689,853) (2,699,800) (2,699,800) (2,699,800) Business Services (210,305) (127,845) (150,000) (204,000) (204,000) Brentwood/Hastings CPO - (956) Support Services (485,972) (424,839) (430,090) (432,500) (432,500) Youth Services (17,312) (33,624) (33,625) (33,625) (33,625) Victim Services (90,619) (91,480) (89,000) (89,000) (89,000) Information Technology (67,313) (52,952) (70,000) (70,000) (70,000) Crime Free Multi-Housing (500) (50) (500) (500) (500) Block Watch Program (750) (550) (500) (500) (500) Total Revenue (4,108,797) (3,422,149) (3,473,515) (3,529,925) (3,529,925) FUNDING REQUIRED Provision From General Revenue 39,440,608 41,386,064 40,589,579 43,833,488 43,609,727
78 78 City of Burnaby ANNUAL financial plan LIBRARY DEPARTMENTAL ORGANIZATION CHART LIBRARY BOARD CHIEF LIBRARIAN DEPUTY CHIEF LIBRARIAN METROTOWN (50.41) MCGILL LIBRARIAN (23.82) TOMMY DOUGLAS LIBRARIAN (20.81) CAMERON LIBRARIAN (11.52) REFERENCE LIBRARIAN FICTION / AV LIBRARIAN HOME LIBRARY SERVICE (3.53) LIBRARIAN-TECHNICAL (CATALOGUING) (9.24) LIBRARIAN-TECHNICAL (ACQUISITIONS) (5.60) FINANCE & ADMIN.MANAGER (ADMINISTRATION) (6.65) SYSTEMS LIBRARIAN (3.00) COORDINATOR CHILDREN S SERVICES (2.13) Regular Temporary Regular Full Time Full-Time Part-Time Auxiliary Total Metrotown McGill Tommy Douglas Cameron Home Library Service Cataloguing Acquisitions Administration Systems Children s Services TOTAL
79 ANNUAL financial plan City of Burnaby 79 Library 2009 Actuals 2010 Actuals 2010 Annual Provisional Annual EXPENDITURES Library Administration 1,404,206 1,311,403 1,250,356 1,219,812 1,294,993 Cameron Branch Library 811, , , , ,465 Tommy Douglas Branch Library 1,025,192 1,573,758 1,647,852 1,675,695 1,642,217 McGill Branch Library 1,981,656 1,908,245 1,997,005 1,979,855 1,906,281 Metrotown Branch Library 4,045,116 3,949,158 4,091,908 4,105,351 3,926,842 Home Service 219, , , , ,075 Acquisitions 359, , , , ,084 Automation 307, , , , ,922 Cataloguing 590, , , , ,313 Children's Services 179, , , , ,190 Public Service Automation 40,118 55,678 61,231 64,567 51,139 Burlington Storage Facility 23, Total Expenditures 10,987,468 11,252,169 11,584,758 11,732,038 11,541,523 REVENUE Library Administration (894,435) (829,677) (763,890) (775,022) (831,476) Cameron Branch Library (58,683) (58,732) (56,940) (57,800) (58,700) Tommy Douglas Branch Library (45,215) (60,672) (55,140) (57,500) (60,700) McGill Branch Library (98,581) (98,261) (100,780) (93,900) (98,200) Metrotown Branch Library (168,417) (159,639) (167,280) (155,000) (159,600) Automation (20,610) (20,610) (20,610) (20,610) (19,860) Burlington Storage Facility (12,176) Stabilization & Surplus (863,548) (407,633) (407,633) (225,000) (432,736) Total Revenue (2,161,665) (1,635,225) (1,572,273) (1,384,832) (1,661,272) FUNDING REQUIRED Provision From General Revenue 8,825,803 9,616,944 10,012,485 10,347,206 9,880,251
80 80 City of Burnaby ANNUAL financial plan ENGINEERING DEPARTMENTAL ORGANIZATION CHART DIRECTOR ENGINEERING ENGINEERING ADMINISTRATION (2.00) ENGINEERING BUSINESS MANAGER DEPUTY DIRECTOR ENGINEERING PUBLIC WORKS ADMINISTRATION (11.00) WATER (52.69) ASSISTANT DIRECTOR TRAFFIC & PARKING MANAGEMENT ASSISTANT DIRECTOR DEVELOPMENT SERVICES & INFRASTRUCTURE PLANNING ASSISTANT DIRECTOR ENVIRONMENTAL PROTECTION SANITARY SEWER (49.00) TRAFFIC MANAGEMENT (6.00) DESIGN (9.00) ENVIRONMENTAL SERVICES (6.30) ROADS & DRAINAGE (60.00) PARKING MANAGEMENT & TRAFFIC BYLAW (16.00) SURVEY (10.22) SOLID WASTE & RECYCLING (87.82) GARAGE & EQUIPMENT (37.29) CONTRACTS (16.21) SIGNS & MARKING SHOP (11.65) FACILITIES MANAGEMENT (41.19) SAFETY & SECURITY (2.00) ENGINEERING SYSTEMS (9.80) Regular Temporary Regular Full Time Full-Time Part-Time Auxiliary Total Engineering Administration Public Works Environmental Services Development Services Traffic Sanitary Sewer Waterworks TOTAL
81 ANNUAL financial plan City of Burnaby 81 EngineerINg - summary 2009 Actuals 2010 Actuals 2010 Annual Provisional Annual EXPENDITURES Engineering 65,125,895 64,030,875 62,783,689 65,693,547 64,169,930 Utilities 68,765,118 73,284,436 72,389,091 77,311,253 77,311,253 Total Expenditures 133,891, ,315, ,172, ,004, ,481,183 REVENUE Engineering (12,629,763) (10,735,988) (10,474,976) (9,751,185) (10,705,185) Utilities (68,765,118) (73,284,436) (72,389,091) (77,311,253) (77,311,253) Stabilization & Surplus (1,248,878) Total Revenue (82,643,759) (84,020,424) (82,864,067) (87,062,438) (88,016,438) FUNDING REQUIRED Provision From General Revenue 51,247,255 53,294,887 52,308,713 55,942,362 53,464,745
82 82 City of Burnaby ANNUAL financial plan EngineerINg 2009 Actuals 2010 Actuals 2010 Annual Provisional Annual EEXPENDITURES AAdministration 406, , , , ,741 PPublic Works 34,657,781 35,368,207 35,456,069 38,331,960 36,681,566 DDevelopmt Srvc & Infrastructure Planning 2,884,774 3,032,150 2,913,687 3,017,095 3,063,526 TTraffic & Engineering Systems 10,574,954 11,472,707 10,370,755 10,420,579 11,078,571 EEnvironmental Services 1,004, , , , ,229 SSolid Waste & Sign Shop 15,596,501 12,777,113 12,672,148 12,464,676 12,088,296 Total Expenditures 65,125,895 64,030,875 62,783,689 65,693,547 64,169,930 RREVENUE AAdministration (74,906) (130,880) (82,750) (82,750) (94,050) PPublic Works (4,624,150) (5,041,784) (4,471,688) (4,651,688) (5,369,688) DDevelopmt Srvc & Infrastructure Planning (397,312) (487,814) (388,400) (468,727) (465,727) TTraffic & Engineering Systems (1,953,027) (2,016,388) (2,084,889) (1,981,600) (1,956,300) EEnvironmental Services 14,624 (30,948) (2,270) (2,270) (2,270) SSolid Waste & Sign Shop (5,594,992) (3,028,174) (3,444,979) (2,564,150) (2,817,150) SStabilization & Surplus (1,248,878) Total Revenue (13,878,640) (10,735,988) (10,474,976) (9,751,185) (10,705,185) FUNDING REQUIRED Provision From General Revenue 51,247,255 53,294,887 52,308,713 55,942,362 53,464,745
83 ANNUAL financial plan City of Burnaby 83 Utilities Sanitary Sewer 2009 Actuals 2010 Actuals 2010 Annual Provisional Annual EXPENDITURES Contingency 1,216,715 1,926, , , ,710 Damage Claims 7,822 8,274 15,000 15,000 15,000 Operations, Mtce, & Construction 3,224,135 4,116,624 4,583,625 4,669,625 4,618,712 Pump Controls 313, , , , ,193 Pumpstations 787, , , , ,080 Sanitary Sewer 25,330,910 25,187,343 25,724,731 27,439,057 27,373,639 Sewer Administration 337, ,978 43,136 59,572 59,571 Total Expenditures 31,218,099 32,827,145 32,174,930 33,905,905 33,905,905 REVENUE Sewer Levy & User Charges (28,224,729) (30,710,575) (30,058,360) (32,255,000) (32,255,000) Utility Surplus (2,993,370) (2,116,570) (2,116,570) (1,650,905) (1,650,905) Total Revenue (31,218,099) (32,827,145) (32,174,930) (33,905,905) (33,905,905) Utilities - Waterworks 2009 Actuals 2010 Actuals 2010 Annual Provisional Annual EXPENDITURES Contingency 2,049,822 1,914, , , ,000 Water 27,867,408 31,329,347 32,664,106 35,382,768 35,278,060 Water - Meter & Valves 299, , , , ,115 Water - Operations, Mtce, & Construction 6,297,510 5,801,561 6,050,005 6,271,209 6,369,492 Water - Pumpstations & PVR's 553, , , , ,055 Waterworks Administration 479, , ,626 Total Expenditures 37,547,019 40,457,291 40,214,161 43,405,348 43,405,348 REVENUE Water Levy & User Charges (32,600,284) (36,996,690) (36,753,560) (40,592,880) (40,592,880) Utility Surplus (4,946,735) (3,460,601) (3,460,601) (2,812,468) (2,812,468) Total Revenue (37,547,019) (40,457,291) (40,214,161) (43,405,348) (43,405,348)
84 84 City of Burnaby ANNUAL financial plan FINANCE DEPARTMENTAL ORGANIZATION CHART ADMINISTRATIVE STAFF (1.08) DIRECTOR FINANCE INTERNAL AUDIT (4.00) DEPUTY DIRECTOR FINANCE BUSINESS LICENCE & PROPERTY MANAGEMENT MATERIALS MANAGEMENT FINANCIAL PLANNING & CAPITAL EQUITY FINANCIAL SERVICES REVENUE SERVICES RISK MANAGEMENT INFORMATION SERVICES CHIEF LICENCE INSPECTOR PURCHASING MANAGER ASSISTANT DIRECTOR FINANCIAL PLANNING & CAPITAL EQUITY MANAGER FINANCIAL SERVICES ASSISTANT DIRECTOR REVENUE SERVICES MANAGER RISK, INSURANCE & CLAIMS CHIEF INFORMATION OFFICER ERP PROGRAM MANAGER LICENCE (13.08) PURCHASING ASSETS & FUNDS MANAGEMENT (8.07) ACCOUNTING (12.27) TREASURY OPERATIONS (2.60) RISK MANAGEMENT IS ADMINISTRATION PROPERTY MANAGEMENT (2.00) BUYING GROUP (8.78) STORES (17.27) OPERATING BUDGET, REPORTING & ANALYSIS (3.00) PAYROLL (9.91) MASTER DATA MANAGEMENT PROPERTY TAX & UTILITIES (21.57) EMERGENCY PREPAREDNESS (1.42) SUPPORT SERVICES (16.00) APPLICATION SERVICES (19.00) PRINTSHOP (6.00) ENTERPRISE BUSINESS SYSTEMS (22.00) Regular Temporary Regular Full Time Full-Time Part-Time Auxiliary Total Administration & Internal Control Revenue Services Financial Services Materials Management Licence & Property Management Information Services TOTAL
85 ANNUAL financial plan City of Burnaby 85 Finance 2009 Actuals 2010 Actuals 2010 Annual Provisional Annual EXPENDITURES Administration & Internal Control 2,990,719 2,560,096 2,423,896 2,460,834 2,749,091 Finance Administration 665, , , , ,490 Risk Management 507, , , , ,530 Internal Audit 1,167, , , , ,119 Financial Planning 650, , , ,098 1,192,951 Financial Services 2,136,684 1,887,851 2,223,573 2,315,462 2,125,660 Accounting Services 1,458,482 1,151,554 1,498,388 1,562,761 1,340,715 Payroll Services 678, , , , ,945 Materials Management 2,040,985 2,391,432 2,462,948 2,642,227 2,552,267 Printshop 255, , , , ,238 Purchasing 802,360 1,000, ,724 1,090, ,730 Stores 983,065 1,105,036 1,290,074 1,345,326 1,360,299 Licence & Property Management 6,428,575 6,663,211 7,152,413 6,870,958 6,812,958 Licence 1,249,789 1,277,750 1,383,902 1,437,072 1,429,153 Animal Control 515, , , , ,130 Property Management 4,663,058 4,812,980 5,228,321 4,884,821 4,834,675 Information Services 13,553,332 13,843,525 12,743,877 12,439,867 13,622,644 Administration 486, , , , ,810 Technical Support & Help Desk Services 6,222,052 6,286,939 5,725,990 5,806,008 5,907,002 Application Services 3,327,464 3,484,587 3,158,274 2,580,602 1,770,053 ERP Program Office 3,517,270 3,767,144 3,474,916 3,659,691 5,588,778 Revenue Services 1,655,620 1,660,555 1,931,522 2,066,979 2,193,505 Investment Operations 215, , , , ,382 Tax Office 1,439,996 1,446,092 1,517,571 1,616,963 1,638,008 Revenue Services - Administration , , ,115 Total Expenditures 28,805,914 29,006,669 28,938,229 28,796,327 30,056,124 REVENUE Administration & Internal Control (250,249) (189,677) (242,700) (224,000) (186,000) Materials Management (280,111) (247,762) (235,000) (227,500) (223,500) Licence & Property Management (10,894,259) (10,329,022) (10,393,200) (11,495,200) (11,324,200) Licence (2,508,537) (2,588,965) (2,513,200) (2,716,200) (2,716,200) Animal Control (100,298) (113,509) (114,000) (114,000) (129,000) Property Management (8,285,425) (7,626,548) (7,766,000) (8,665,000) (8,479,000) Revenue Services (171,008) (267,648) (165,000) (225,000) (265,000) Stabilization & Surplus (2,544,639) (683,892) (675,000) - - Total Revenue (14,140,267) (11,718,001) (11,710,900) (12,171,700) (11,998,700) FUNDING REQUIRED Provision From General Revenue 14,665,648 17,288,668 17,227,329 16,624,627 18,057,424
86 86 City of Burnaby ANNUAL financial plan PLANNING & BUILDING DEPARTMENTAL ORGANIZATION CHART DIRECTOR PLANNING & BUILDING DEPUTY DIRECTOR PLANNING & BUILDING ASSISTANT DIRECTOR CURRENT PLANNING CHIEF BUILDING INSPECTOR SECRETARY / CLERKS (10.00) TECHNICAL SUPPORT (7.00) BUILDING (2.00) BUILDING ADMINISTRATION (10.00) POLICY, HERITAGE, ENVIRONMENT, ECONOMIC & HOUSING (6.00) TRANSPORTATION PLANNING (3.00) SOCIAL PLANNING (3.00) COMMUNITY PLANNING, URBAN DESIGN, & TOURISM STRATEGY (7.84) SUBDIVISION, ZONING & DEVELOPMENT APPROVALS (8.00) INSPECTIONS, BUILDING, PLUMBING & ELECTRICAL (25.30) PLAN CHECKING (10.00) CIVIC PROJECTS (4.80) BYLAW / BYLAW SERVICES (8.60) Regular Temporary Regular Full Time Full-Time Part-Time Auxiliary Total Planning Building TOTAL
87 ANNUAL financial plan City of Burnaby 87 Planning & BUIlDINg 2009 Actuals 2010 Actuals 2010 Annual Provisional Annual EXPENDITURES Planning & Building Administration 215, , , , ,068 Planning 4,029,867 4,237,310 4,916,688 5,010,787 5,083,189 Planning Administration 104,785 95, , , ,455 Current Planning Administration 1,937,982 1,937,972 2,211,849 2,336,318 2,340,607 Economic Development 94, ,058 65,000 15,000 15,000 Community Planning 83,427 40, ,161 94,800 94,800 Zoning & Subdivision 25,189 38,676 49,400 49,400 49,400 Long Range Planning 1,747,120 1,840,800 2,116,939 2,180,315 2,248,427 Policy Planning & Implementation 36, , , , ,500 Transportation Planning Building 4,955,482 5,372,826 5,758,251 6,044,148 6,035,107 Building Administration 848, ,283 1,016,223 1,065,425 1,065,702 Project Management 496, , , , ,574 Bylaw Enforcement 704, , , , ,263 Inspection Administration 22,615 45, , , ,027 Building Inspection 897, , ,117 1,001,175 1,001,175 Electrical Inspection 614, , , , ,759 Plumbing & Gas Inspection 742, , , , ,636 Plan Checking 629, , , , ,972 Total Expenditures 9,201,331 9,838,267 10,889,471 11,276,702 11,340,364 REVENUE Planning (770,552) (1,257,600) (617,000) (677,850) (677,850) Current Planning Administration (12,308) (16,897) (10,950) (11,950) (11,950) Economic Development 45,443 (146,648) (50,000) - - Zoning & Subdivision (791,978) (1,044,300) (536,050) (665,900) (665,900) Policy Planning & Implementation (11,708) (49,755) (20,000) - - Building (5,917,959) (7,884,001) (4,965,298) (5,602,499) (5,602,499) Building Administration (40,150) (63,261) (38,510) (39,858) (39,858) Bylaw Enforcement (13,882) (28,482) (20,428) (21,175) (21,175) Building Inspection (3,734,031) (5,181,668) (3,136,150) (3,512,879) (3,512,879) Electrical Inspection (1,099,387) (1,329,617) (811,418) (920,251) (920,251) Plumbing & Gas Inspection (1,030,509) (1,280,973) (958,792) (1,108,336) (1,108,336) Stabilization & Surplus (153,244) (601) (35,000) (35,000) (35,000) Total Revenue (6,841,755) (9,142,203) (5,617,298) (6,315,349) (6,315,349) FUNDING REQUIRED Provision From General Revenue 2,359, ,064 5,272,173 4,961,353 5,025,015
88 88 City of Burnaby ANNUAL financial plan PARKS, RECREATION AND CULTURAL SERVICES DEPARTMENTAL ORGANIZATION CHART DIRECTOR PARKS, RECREATION & CULTURAL SERVICES ASSISTANT DIRECTOR RECREATION ASSISTANT DIRECTOR CULTURAL SERVICES ASSISTANT DIRECTOR GOLF OPERATIONS ASSISTANT DIRECTOR PARKS Recreation Complexes Youth Services Sports & Outdoor Recreation Aquatics Arenas Senior Centres (250.90) Burnaby Art Gallery Shadbolt Centre Events & Festivals Burnaby Village Museum Riverway Burnaby Mountain Central Park Pitch & Putt Kensington Park Pitch & Putt (75.02) (46.09) Parks Development Parks Maintenance Janitorial Horticulture Forestry Park Patrol & Security (195.58) MANAGER BUSINESS OPERATIONS MANAGER MARKETING & COMMUNICATIONS MANAGER PARKS PLANNING, DESIGN & DEVELOPMENT Operating Budget Office Administration Food Services Information Systems Support (38.19) Communications Leisure Guide Promotions & Marketing Banner Program (4.60) Parks Planning Parks Design Eco Sculpture Environmental Stewardship (11.99) Regular Temporary Regular Full Time Full-Time Part-Time Auxiliary Total Administration Services Cultural Services Parks Planning Parks Services Recreation Services Golf Services TOTAL
89 ANNUAL financial plan City of Burnaby 89 Parks, Recreation & Cultural Services 2009 Actuals 2010 Actuals 2010 Annual Provisional Annual EXPENDITURES Cultural Services 7,769,674 7,751,890 7,977,148 8,059,334 8,169,401 Golf Services 4,811,258 5,130,548 5,149,462 5,268,331 5,454,669 Recreation Services 18,805,771 19,518,025 19,924,048 20,569,894 20,451,989 Administration - Business Operations 4,891,021 4,860,719 4,887,986 4,994,392 5,695,531 Parks Services 18,629,847 19,205,562 20,381,333 19,605,020 19,093,173 Total Expenditures 54,907,572 56,466,743 58,319,977 58,496,971 58,864,762 REVENUE Cultural Services (2,741,160) (2,753,490) (2,885,430) (2,915,919) (2,625,567) Golf Services (6,089,133) (6,106,066) (6,068,626) (6,107,387) (6,139,078) Recreation Services (10,223,906) (10,174,671) (10,332,923) (10,429,267) (10,385,381) Administration - Business Operations (1,814,041) (1,539,614) (1,456,100) (1,354,271) (1,991,601) Parks Services (128,251) (57,790) (89,000) (89,000) (89,000) Stabilization & Surplus (506,421) (385,000) Total Revenue (21,502,912) (20,631,631) (20,832,079) (20,895,844) (21,615,627) FUNDING REQUIRED Provision From General Revenue 33,404,660 35,835,112 37,487,898 37,601,127 37,249,136
90 90 City of Burnaby ANNUAL financial plan Fiscal Items 2009 Actuals 2010 Actuals 2010 Annual Provisional Annual EXPENDITURES Contribution to Capital Funds & Reserves 2,542,981 1,333, , , ,695 Contribution to Operating Reserves 7,747, ,385,445 Contingencies 1,063,244 3,118,182 1,408,825 2,318,130 3,354,630 Insurance 642, , , , ,500 Interest on Tax Prepayments & Borrowings 89,670 53, , , ,500 Cafeteria 26,926 14,733 38,000 38,000 38,000 Community School Grant 387, , , , ,990 Bank Charges 102, , , , ,000 Miscellaneous 483,207 1,415,710 1,498,941 1,678,399 1,678,399 Gain/Loss on Asset Disposal - - 3,931,280 5,830,980 3,681,450 Investment Income Assessment Appeals 627, ,032 1,050,000 1,050, ,500 Events Grant , ,000 Total Expenditures 13,714,764 7,439,900 9,456,727 12,702,694 13,589,109 REVENUE Contribution to Capital Funds & Reserves (764,015) (1,107,423) Contingencies - - (200,000) (200,000) (2,012,770) Insurance (267,782) (131,922) (300,000) (300,000) (300,000) Cafeteria (5,425) (3,709) (5,000) (5,000) (5,000) Grants in Lieu (5,427,513) (4,386,452) (4,357,045) (4,598,385) (4,598,385) Local Improvement Levies (721,079) (784,853) (744,075) (745,890) (745,890) Miscellaneous (1,230,364) 117,815 (136,599) (153,266) (153,267) Other Tax Levies (2,909,534) (3,101,034) (3,101,030) (3,101,030) (3,072,385) Penalties and Interest on Overdue Taxes (1,308,983) (1,094,426) (929,000) (929,000) (929,000) Tax Adjustment - Land Sales - (2,315) (35,000) (35,000) (35,000) Gain/Loss on Asset Disposal (1,393,297) (1,888,970) Investment Income (7,271,326) (7,297,807) (6,700,000) (6,700,000) (6,700,000) Events Grant (250,000) (250,000) Stabilization & Surplus (6,487,392) (252,029) (1,050,000) (1,050,000) (3,435,445) Total Revenue (27,786,711) (19,933,126) (17,557,749) (18,067,571) (22,237,142) FUNDING REQUIRED Provision From General Revenue (14,071,947) (12,493,226) (8,101,022) (5,364,877) (8,648,033)
91 ANNUAL financial plan City of Burnaby 91 Tax Levies for Other Taxing Authorities and utilities 2009 Actuals 2010 Actuals 2010 Annual Provisional Annual EXPENDITURES School - Provincial 122,833, ,043, ,582, , ,843,315 Metro Vancouver 3,786,371 4,027,539 4,040,640 58,940 4,038,900 GVTA 28,092,413 28,906,718 29,016, ,720 29,734,480 B C Assessment 4,039,462 4,208,364 4,219,295 4,350 4,051,905 Municipal Finance Authority 11,350 11,671 11,690-12,870 Sewer Utility 22,581,009 24,858,485 22,033,765 22,033,765 26,655,770 Water Utility 21,689,768 25,097,360 21,184,425 21,184,425 27,410,630 Hastings Street BIA 211, , , , ,770 North Road BIA 118, , , ,785 Tourism Burnaby 566, , , , ,000 Total Expenditures 203,930, ,229, ,990,800 44,574, ,677,425 REVENUE School - Provincial (122,833,807) (125,043,592) (125,582,705) (439,225) (128,843,315) Metro Vancouver (3,786,371) (4,027,539) (4,040,640) (58,940) (4,038,900) GVTA (28,092,413) (28,906,718) (29,016,595) (100,720) (29,734,480) B C Assessment (4,039,462) (4,208,364) (4,219,295) (4,350) (4,051,905) Municipal Finance Authority (11,350) (11,671) (11,690) - (12,870) Sewer Utility (22,581,009) (24,858,485) (22,033,765) (22,033,765) (26,655,770) Water Utility (21,689,768) (25,097,360) (21,184,425) (21,184,425) (27,410,630) Hastings Street BIA (211,177) (220,726) (202,900) (202,900) (230,770) North Road BIA (118,784) (148,786) (148,785) - (148,785) Tourism Burnaby (566,128) (706,034) (550,000) (550,000) (550,000) Total Revenue (203,930,270) (213,229,276) (206,990,800) (44,574,325) (221,677,425)
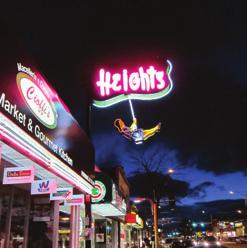
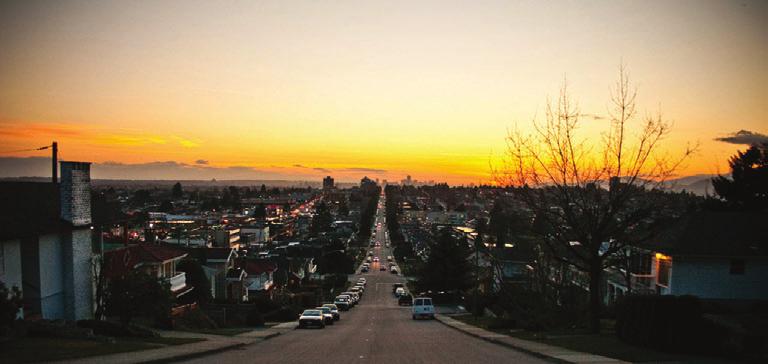
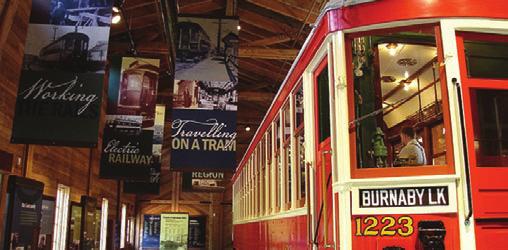
92 Revenue & Expenditure Summary Consolidated financial statements Format
93 ANNUAL financial plan City of Burnaby 93 Summary Actual Actual Annual Provisional Annual REVENUE Taxes (225,730,938) (241,379,576) (240,468,490) (255,570,485) (253,860,805) Grants in Lieu of Taxes (5,427,513) (4,386,452) (4,357,045) (4,598,385) (4,598,385) Sales of Services (38,592,606) (40,135,257) (40,360,910) (41,211,975) (41,733,448) Other Revenue From Own Sources (87,347,525) (71,410,615) (68,995,851) (62,830,253) (61,060,783) Unconditional Transfers From Senior Governments (2,689,853) (2,689,853) (2,820,800) (2,820,800) (2,820,800) Conditional Transfers From Senior Governments (11,573,781) (10,951,058) (10,186,670) (10,162,248) (10,140,398) Conditional Transfers From Regional and Local Government (10,269,113) (4,954,517) (4,487,813) (4,667,813) (5,371,813) Transfers from Restricted Funds (7,892,877) (1,523,256) (3,000,000) (3,000,000) (3,000,000) Total Revenue (389,524,207) (377,430,583) (374,677,579) (384,861,959) (382,586,432) EXPENDITURES General Government Services 44,946,948 42,683,692 49,083,577 53,823,906 53,127,246 Protective Services 81,472,940 85,007,419 83,573,252 87,372,465 87,678,755 Transportation Services 44,890,792 46,758,445 45,560,103 46,356,131 45,194,364 Environmental Health Services 63,792,449 65,486,333 66,041,616 69,364,350 69,561,793 Youth Services 207, , , , ,180 Environmental Development Services 4,264,963 4,501,589 5,169,220 5,270,554 5,343,257 Recreation and Cultural Services 67,529,728 66,524,372 68,933,506 70,806,995 70,928,301 Total Expenditures 307,105, ,209, ,646, ,302, ,139,897 NET CHANGE IN EQUITY BALANCE (82,418,764) (66,221,138) (56,030,631) (51,559,068) (50,446,535) Clockwise from top left: Kingsway by Swangard Stadium Swinging Girl at Burnaby Heights Burnaby Village Museum View from Burnaby Heights
94 94 City of Burnaby ANNUAL financial plan Details Revenue Actual Actual Annual Provisional Annual Code REVENUE TAXES 100 Taxes - Real Property (177,222,250) (187,582,725) (188,026,260) (197,644,175) (195,963,140) 220 Special Assessments - Local Improvements (1,293,234) (681,562) (677,130) (678,945) (678,945) 240/290/940 Utilities (47,180,311) (53,056,878) (51,698,155) (57,180,420) (57,151,775) 990 Special Levies - Other (35,142) (58,411) (66,945) (66,945) (66,945) (225,730,938) (241,379,576) (240,468,490) (255,570,485) (253,860,805) GRANTS IN LIEU OF TAXES 100 Federal Government (1,396,916) (137,775) (137,135) (147,280) (147,280) 200 Federal Government Agencies (58,851) (58,851) (61,795) (61,795) (61,795) 400 Provincial Government Agencies (3,771,746) (3,989,825) (3,958,115) (4,189,310) (4,189,310) 900 Other (200,000) (200,000) (200,000) (200,000) (200,000) (5,427,513) (4,386,452) (4,357,045) (4,598,385) (4,598,385) SALES OF SERVICES 100 General Government Services (178,802) (202,543) (185,000) (185,000) (220,000) 200 Protective Services (544,814) (499,224) (533,190) (534,538) (534,538) 350 Parking (1,250,434) (1,362,078) (1,321,300) (1,321,300) (1,351,000) 410/430 Utilities - Solid Waste (17,874,769) (19,692,767) (19,717,945) (20,521,640) (20,634,640) 700 Recreation and Cultural Services (18,743,788) (18,378,645) (18,603,475) (18,649,497) (18,993,270) (38,592,606) (40,135,257) (40,360,910) (41,211,975) (41,733,448) OTHER REVENUE FROM OWN SERVICES 100 Licences and Permits (9,797,408) (12,239,224) (8,654,688) (9,701,718) (11,553,988) 200 Fines (427,828) (499,514) (539,000) (541,000) (486,000) 300 Rentals (9,036,405) (8,421,193) (8,457,709) (9,387,860) (9,151,501) 500 Return on Investments (34,436,639) (30,283,082) (27,567,743) (29,003,810) (28,730,810) 600 Penalties and Interest on Taxes (1,308,983) (1,094,426) (929,000) (929,000) (929,000) 900 Miscellaneous (32,340,262) (18,873,175) (22,847,711) (13,266,865) (10,209,484) (87,347,525) (71,410,615) (68,995,851) (62,830,253) (61,060,783) UNCONDITIONAL TRANSFERS FROM SENIOR GOVERNMENTS Provincial (2,689,853) (2,689,853) (2,820,800) (2,820,800) (2,820,800) CONDITIONAL TRANSFERS FROM SENIOR GOVERNMENTS 100 Federal (112,149) (130,950) (105,010) (105,010) (100,260) 500 Provincial (11,461,632) (10,820,109) (10,081,660) (10,057,238) (10,040,138) (11,573,781) (10,951,058) (10,186,670) (10,162,248) (10,140,398) CONDITIONAL TRANSFERS FROM REGIONAL AND LOCAL GOVERNMENTS 300 School District (107,982) (111,100) (37,145) (37,145) (37,145) 400 Other Government (26,174) 1,687 (15,500) (15,500) (15,500) 600 Greater Vancouver Transit Authority (10,134,958) (4,845,104) (4,435,168) (4,615,168) (5,319,168) (10,269,113) (4,954,517) (4,487,813) (4,667,813) (5,371,813) TRANSFERS FROM RESTRICTED FUNDS 390 Transfer from Restricted Reserve (7,371,770) (1,523,256) (3,000,000) (3,000,000) (3,000,000) 320 Transfer From Other Reserves (521,107) (7,892,877) (1,523,256) (3,000,000) (3,000,000) (3,000,000) TOTAL REVENUE (389,524,207) (377,430,583) (374,677,579) (384,861,959) (382,586,432)
95 ANNUAL financial plan City of Burnaby 95 Details ExpeNDIture Actual Actual Annual Provisional Annual Code EXPENDITURE GENERAL GOVERNMENT SERVICES 100 Legislative 1,197,853 1,217,762 1,131,555 1,182,246 1,185, General Administration 33,465,913 31,144,823 30,574,966 31,378,681 32,786, Other General Government Services 10,283,147 10,321,069 17,373,555 21,259,480 19,151, Interest on Short Term Borrowings ,500 3,500 3,500 44,946,948 42,683,692 49,083,577 53,823,906 53,127, PROTECTIVE SERVICES 100 Police Protection 42,407,397 43,773,372 43,050,327 46,400,765 46,179, Corrections 428, , , , , Fire Protection 32,916,487 34,578,861 33,453,875 33,621,885 34,200, Flood Control Other Protection 5,721,020 6,222,365 6,688,367 6,975,478 6,925,021 81,472,940 85,007,419 83,573,252 87,372,465 87,678, TRANSPORTATION SERVICES 100 General Engineering Administration 7,985,123 8,528,717 8,954,919 9,391,334 7,818, Roads and Streets 24,618,505 24,768,573 24,624,567 24,669,206 24,426, Boulevards 1,359,211 1,596,432 1,207,870 1,240,493 1,240, Street Lighting 2,762,313 3,610,540 2,741,921 2,741,921 3,270, Traffic Services 6,046,835 6,281,855 6,031,658 6,134,008 6,259, Municipal Road Network/GVTA 2,118,805 1,972,327 1,999,168 2,179,168 2,179,168 44,890,792 46,758,445 45,560,103 46,356,131 45,194, ENVIRONMENTAL HEALTH SERVICES 110/140/190 Waterworks 26,112,066 29,040,195 29,748,507 32,020,395 32,192, Sewage 5,935,781 7,272,089 7,297,707 7,904,054 7,969, /330 Garbage Collection and Disposal 14,959,477 11,923,900 11,724,777 11,504,201 11,464, GVS & DD Levy 16,307,773 16,689,800 16,639,050 17,246,595 17,246, Other Environmental Health 477, , , , ,105 63,792,449 65,486,333 66,041,616 69,364,350 69,561, YOUTH SERVICES 207, , , , , ENVIRONMENT DEVELOPMENT SERVICES 100 Environment Planning and Zoning 4,087,159 4,284,591 5,002,059 5,160,754 5,233, Community Development 177, , , , ,800 4,264,963 4,501,589 5,169,220 5,270,554 5,343, RECREATION AND CULTURAL SERVICES 100/150 Recreation Facilities 53,964,499 52,917,701 54,769,811 56,343,031 56,547, Cultural Buildings and Facilities 13,565,229 13,606,672 14,163,695 14,463,964 14,380,440 67,529,728 66,524,372 68,933,506 70,806,995 70,928,301 TOTAL EXPENDITURE 307,105, ,209, ,646, ,302, ,139,897 NET CHANGE IN EQUITY BALANCE (82,418,764) (66,221,138) (56,030,631) (51,559,068) (50,446,535)

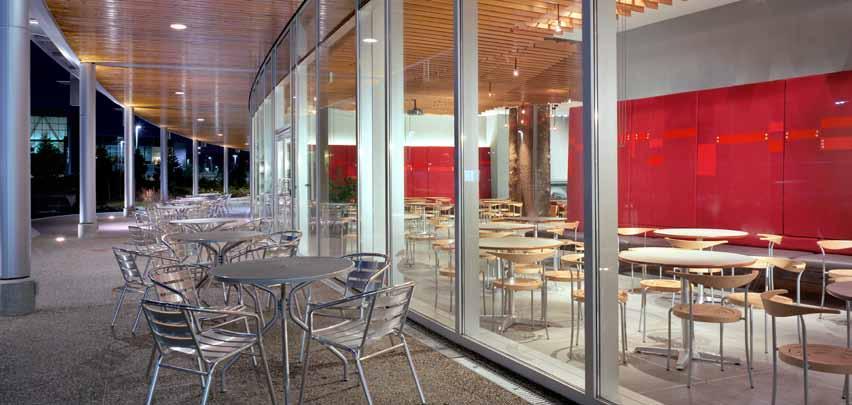
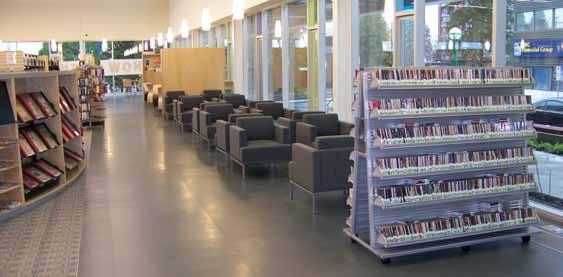
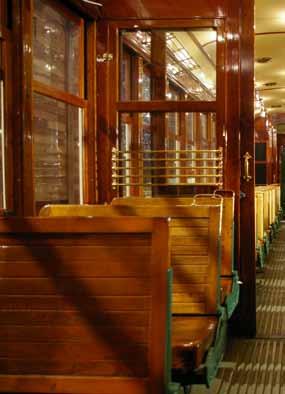
96 Capital Program
CITY OF BURNABY 2007 PROVISIONAL FINANCIAL PLAN TABLE OF CONTENTS
 2007 PROVISIONAL FINANCIAL PLAN TABLE OF CONTENTS Page The Local Setting 5 Demographic Profile 6-8 Organization and Structure 11-13 Executive Summary 17-22 OPERATING PLAN Five Year Summary of Projected
CITY OF BURNABY, BC 2017 Annual Municipal Report Highlights. For the fiscal year ended December 31, 2017
 CITY OF BURNABY, BC 2017 Annual Municipal Report Highlights For the fiscal year ended December 31, 2017 2 CITY OF BURNABY 2017 ANNUAL MUNICIPAL REPORT HIGHLIGHTS INTRODUCTION The 2017 Annual Municipal
REPORT Finance and Information Technology
 REPORT Finance and Information Technology To: Mayor Coté and Members of Council Date: 6/11/2018 From: Colleen Ponzini, CPA, CGA Acting Chief Financial Officer File: Item #: 253/2018 Subject: 2017 Statement
2016 Statement of Financial Information. City of Burnaby. For the fiscal year ended December 31, British Columbia, Canada
 City of Burnaby British Columbia, Canada 2016 Statement of Financial Information For the fiscal year ended December 31, 2016 Contents Statement of Financial Information Approval...4 Management Report...5
District of North Saanich 2019 Dra Budget
 District of North Saanich 2019 Dra Budget Budget in Brief Each year, the District develops an annual budget outlining how tax dollars are invested to support our residents and community. We include a five-year
MINISTRY OF TOURISM, CULTURE AND SPORT
 THE ESTIMATES, 1 The Ministry of Tourism, Culture and Sport provides leadership for these fast-growing sectors of the provincial economy which are fundamental to the prosperity and quality of life of Ontario
Proposed 2015 Budget. Board Budget Workshop October 16, 2014
 Proposed 2015 Budget Board Budget Workshop October 16, 2014 10320532 Introduction 2015 Budget Process Budget process initiated in 2013 with further enhancements for developing 2015 Budget Development of
A (::^rwvnx A VIBRANT URBAN CENTRE
 City of Coqultlam British Columbia Annual Report rot the year ending December 31.2017 - - 2017 A (::^rwvnx Community (7 ^ j-r^ 'I' Mi 5tsei»l coqultlam.ca/annualreport A VIBRANT URBAN CENTRE Coqultlam
WHAT WE HEARD: A REPORT TO THE COMMUNITY. Budget Public Consultation September, 2018
 Budget Public Consultation September, 2018 WHAT WE HEARD: A REPORT TO THE COMMUNITY Prepared by the Public Engagement Budget Working Group: Monica Leatherdale, Sheena Linderman, Kelly Lloyd, Jennifer Lutz
THE CORPORATION OF THE COUNTY OF BRANT CONSOLIDATED FINANCIAL STATEMENTS
 CONSOLIDATED FINANCIAL STATEMENTS Millards Chartered Professional Accountants INDEX Page Management Report INDEPENDENT AUDITORS' REPORT 1 2 FINANCIAL STATEMENTS Consolidated Statement of Financial Position
Adjusted $ % Cumulative Change Change ($000) Actual Actual Budget Budget Budget Budget ' ' '18
 Actual Actual Budget Budget Budget Budget ' ' '18") Corporate Summary Tax-supported Operations Attachment 16-017O Adjusted $ % ($000) Actual Actual Budget Budget Budget Budget 2016 - '18 2015 - '18 2015 -'18 Boards & Commissions Economic Development Corporation
Corporate Summary Tax-supported Operations Attachment 16-017O Adjusted $ % ($000) Actual Actual Budget Budget Budget Budget 2016 - '18 2015 - '18 2015 -'18 Boards & Commissions Economic Development Corporation
CHAPTER 11: Economic Development and Sustainability
 AGLE AREA COMMUNITY Plan CHAPTER 11 CHAPTER 11: Economic Development and Sustainability Economic Development and Sustainability The overall economy of the Town and the Town government s finances are inextricably
FIVE-YEAR FINANCIAL PLAN budget district of west vancouver
 FIVE-YEAR FINANCIAL PLAN 2018 2022 2018 budget district of west vancouver a TABLE OF CONTENTS Award for Financial Reporting............................ 1 CAO s Message....................................
THE CORPORATION OF THE VILLAGE OF LUMBY
 THE CORPORATION OF THE VILLAGE OF LUMBY CONSOLIDATED FINANCIAL STATEMENTS December 31, 2016 December 31, 2016 CONTENTS Page INDEPENDENT AUDITORS' REPORT 3 FINANCIAL STATEMENTS Consolidated Statement of
2018 CAPITAL BUDGET CAPITAL PLAN
 2018 CAPITAL BUDGET 2019-2027 CAPITAL PLAN This is administrations recommended 2018 Capital Budget to Red Deer City Council. Final decisions will be made as a part of Councils review changes may occur.
FIVE-YEAR FINANCIAL PLAN
 FIVE-YEAR FINANCIAL PLAN 2015 2019 TABLE OF CONTENTS Award for Financial Reporting................................1 Chief Administrative Officer Message........................... 2 Chief Financial Officer
City of Coquitlam. Statement of Financial Information 2016
 City of Coquitlam Statement of Financial Information 2016 June 10, 2017 Notice to Reader The Financial Information Act requires municipalities and other Government organizations to prepare annual financial
City of Kamloops Consolidated Financial Statements For the year ended December 31, 2016
 Consolidated Financial Statements For the year ended Tel: 250 372 9505 Fax: 250 374 6323 www.bdo.ca BDO Canada LLP 300 275 Lansdowne Street Kamloops BC V2C 6J3 Independent Auditor's Report To the Members
YEG CITY BUDGET
 2016-2018 YEG CITY BUDGET UNDERSTANDING EDMONTON S BUDGET 2 C O N T E N T S WHO WE ARE AND HOW WE GOT HERE... 3 FINDING BALANCE IN THE BUDGET... 4 VALUE THROUGH IMPROVEMENT & INNOVATION.... 5 BREAKING
Re: Consolidated 5 Year Financial Plan ( ) Bylaw No REPORT CONCURRENCE ROUTED TO: CONCURRENCE CONCURRENCE OF GENERAL MANAGER
 Bylaw No REPORT CONCURRENCE ROUTED TO: CONCURRENCE CONCURRENCE OF GENERAL MANAGER") City of Richmond Report to Committee To: Finance Committee Date: January 5, 2018 From: Andrew Nazareth General Manager, Finance and Corporate Services File: 03-0985-01/2016-Vol 01 Re: Consolidated 5 Year
City of Richmond Report to Committee To: Finance Committee Date: January 5, 2018 From: Andrew Nazareth General Manager, Finance and Corporate Services File: 03-0985-01/2016-Vol 01 Re: Consolidated 5 Year
M E M O R A N D U M June 11, 2013
 OFFICE OF THE GENERAL MANAGER FINANCIAL SERVICES GROUP M E M O R A N D U M June 11, 2013 TO: FROM: CC: Mayor and Council Patrice Impey, General Manager and CFO, Financial Services Corporate Management
2011 Financial Statements
 2011 Financial Statements A Message from the Chief Financial Officer marked the completion of the District of West Kelowna s fourth full year of operation. Taxation is a major revenue source for the General
Committee of the Whole Agenda
 1 Committee of the Whole Agenda The agenda for the Freestanding Committee of the Whole (Corporate Administration & Finance Committee - Budget) meeting to be held in the Council Chambers of the Municipal
MINISTRY OF TOURISM, CULTURE AND SPORT
 THE ESTIMATES, 201314 1 The Ministry of Tourism, Culture and Sport provides leadership for these fastgrowing sectors of the provincial economy which are fundamental to the prosperity and quality of life
REGIONAL EVALUATION FRAMEWORK 1.0 INTRODUCTION 2.0 PURPOSE 3.0 DEFINITIONS. Edmonton Metropolitan Region Planning Toolkit
 Edmonton Metropolitan Region Planning Toolkit Re-imagine. Plan. Build. Edmonton Metropolitan Region Growth Plan 1.0 INTRODUCTION On October 26, 2017, the Government of Alberta approved the Edmonton Metropolitan
1. I N T R O D U C T I O N
 INTRODUCTION The Chico 2030 General Plan is a statement of community priorities to guide public decisionmaking. It provides a comprehensive, long-range, and internally consistent policy framework for the
CITY COUNCIL Council Chamber, Burnaby City Hall 4949 Canada Way, Burnaby, B. C. A G E N D A
 CITY COUNCIL Council Chamber, Burnaby City Hall 4949 Canada Way, Burnaby, B. C. OPEN PUBLIC MEETING AT 7:00 PM Monday, 2015 November 23 A G E N D A 1. CALL TO ORDER PAGE 2. PRESENTATIONS A) 2015 City of
Deputy Mayor K. L. Christian, Councillors D. M. Cavers, D. W. Dudy, T. Lange, A. H. Singh, M. L. Spina, P. A. Wallace, and D. J. Walsh.
 192. MINUTES OF THE BUDGET REVIEW MEETING OF THE MUNICIPAL COUNCIL OF THE CITY OF KAMLOOPS, HELD IN SANDMAN CENTRE PARKSIDE LOUNGE, 300 LORNE STREET, ON TUESDAY, FEBRUARY 23, 2016, AT 7:00 PM PRESENT:
MINISTRY OF TOURISM, CULTURE AND SPORT
 THE ESTIMATES, 201213 1 The Ministry of Tourism, Culture and Sport provides leadership for these fastgrowing sectors of the provincial economy which are fundamental to the prosperity and quality of life
2016 Financial Statements
 2016 Financial Statements The Corporation of the District of Saanich British Columbia Fiscal year ended December 31, 2016 Prepared by: District of Saanich Finance Department saanich.ca June 13, 2017 Mayor
Thriving Leading Budget. Investing in better outcomes for residents and businesses
 Living Thriving Leading Investing in better outcomes for residents and businesses Adaptability and responsiveness to current trends and future needs 2018 Budget 2018 Budget 2018 Budget at a Glance The
ATTACHMENT 1 Table 1- Summary of municipal actions in support of the Regional Growth Strategy
 ATTACHMENT 1 Table 1- Summary of municipal actions in support of the Regional Growth Strategy Goal 1: Create a Compact Urban Area RGS Roles for STRATEGY 1.1: CONTAIN URBAN DEVELOPMENT WITHIN THE URBAN
PERMISSIVE TAX EXEMPTION POLICY
 PERMISSIVE TAX EXEMPTION POLICY BOWEN ISLAND MUNICIPALITY MISSION STATEMENT In carrying out its mandate, Bowen Island Municipality will work towards conducting operations in a way that: 1. Improves the
Tax Supported Preliminary Operating Budget. Book 1. Budget Summary Report FCS17001
 2017 Tax Supported Preliminary Operating Budget Book 1 Budget Summary Report FCS17001 BOOK ONE: 2017 PRELIMINARY TAX SUPPORTED OPERATING BUDGET SUMMARY LIST OF APPENDICES APPENDIX DESCRIPTION PAGE Tax
WELCOME. Resort Municipality of Whistler Budget 2016 Community Information Meeting. February 23, 2016 Agenda
 WELCOME Resort Municipality of Whistler Budget 2016 Community Information Meeting February 23, 2016 Agenda 4 to 5 p.m. Gallery walk and discussions 5 to 5:30 p.m. Presentation Question and answer period
The 2018 Budget Table of Contents
 The Budget Table of Contents General Purposes Budget (approved March 27, ) General Purposes Budget Table of Contents Schedule A General Purposes Budget Expense Summary Schedule B General Purposes Budget
PUBLIC WORKS DIRECTOR
 WASHINGTON PUBLIC WORKS DIRECTOR $109,865 - $129,254 Plus Excellent Benefits Apply by October 22, 2017 (First Review, open until filled) 1 P a g e WHY APPLY? Nestled east of famous Puget Sound and north
THE CITY OF RED DEER HERITAGE MANAGEMENT PLAN
 THE CITY OF RED DEER HERITAGE MANAGEMENT PLAN EXECUTIVE SUMMARY Red Deer City Council adopted the Management Plan as a planning tool on September 11, 2006 Prepared by: BACKGROUND The heritage resources
Summary: BUDGET AND FISCAL PLAN 2005/06 TO 2007/08
 2 Summary Summary: BUDGET AND FISCAL PLAN 2005/06 TO 2007/08 Fiscal Plan Summary 2005/06 to 2007/08 2004/05 Budget Updated Estimate Plan Plan ($ millions) Budget 2005/06 2006/07 2007/08 Revenue 30,640
City of Prince Albert YEAR STRATEGIC PLAN
 5 City of Prince Albert YEAR STRATEGIC PLAN 2015-2020 City of Prince Albert Introduction Members of City Council, along with Senior Administration, attended a two-day Strategic Planning Session for the
City of Apple Valley Popular Annual Financial Report
 City of Apple Valley Popular Annual Financial Report To The Community FOR THE YEAR ENDED DECEMBER 31, 2017 City of Apple Valley 7100 147th Street West Apple Valley, MN 55124 952-953-2500 CityofAppleValley.org
METRO VANCOUVER REGIONAL DISTRICT REGIONAL PLANNING COMMITTEE
 METRO VANCOUVER REGIONAL DISTRICT REGIONAL PLANNING COMMITTEE REGULAR MEETING Friday, October 13, 2017 9:00 a.m. 2nd Floor Boardroom, 4330 Kingsway, Burnaby, British Columbia A G E N D A1 1. ADOPTION OF
Where are your taxes going?
 BUDGET HIGHLIGHTS Building for the Future The City s 2017 proposed Budget continues to build for the future, investing in community priorities essential to Regina s continued growth. The Budget goals were
THE CORPORATION OF THE TOWN OF SPANISH
 THE CORPORATION OF THE TOWN CONSOLIDATED FINANCIAL STATEMENTS FOR THE YEAR ENDED INDEPENDENT AUDITORS' REPORT To the Members of Council, Inhabitants and Ratepayers of the Corporation of the Town of Spanish
A loyal three made stronger in one. Loyalist Township Strategic Plan ( )
") A loyal three made stronger in one Loyalist Township Strategic Plan (2012-2015) Adopted by Council on August 13, 2012 Loyalist Township Strategic Plan I. Community Profile As prescribed by the Ministry
A loyal three made stronger in one Loyalist Township Strategic Plan (2012-2015) Adopted by Council on August 13, 2012 Loyalist Township Strategic Plan I. Community Profile As prescribed by the Ministry
Update to Phase One 2017 Investment Plan. Regional Planning Committee July 14, 2017 DRAFT FOR DISCUSSION
 Update to Phase One 2017 Investment Plan Regional Planning Committee July 14, 2017 DRAFT FOR DISCUSSION SkyTrain Vehicles 2 Phase 1 Fleet Expansion called for 28 cars to provide sufficient capacity for
Policy CIE The following are the minimum acceptable LOS standards to be utilized in planning for capital improvement needs:
 Vision Statement: Provide high quality public facilities that meet and exceed the minimum level of service standards. Goals, Objectives and Policies: Goal CIE-1. The City shall provide for facilities and
Please turn off or place on non-audible all cell phones, PDAs, Blackberrys and pagers during the meeting.
 CITY COUNCIL AGENDA DATE February 14, 2011 6 p.m. Please turn off or place on non-audible all cell phones, PDAs, Blackberrys and pagers during the meeting. PRESENTATIONS RE: 2011 TAX SUPPORTED OPERATING
CITY OF KAMLOOPS. Financial Statements for the Year-Ended 2013 December 31. Page 1 of 66
 CITY OF KAMLOOPS Financial Statements for the Year-Ended 2013 December 31 Page 1 of 66 CONSOLIDATED FINANCIAL STATEMENTS TABLE OF CONTENTS 2 Independent Auditor's Report 3-4 Management's Responsibility
City Council Budget Work Session. City of McKinney August 4, 2017
 City Council Budget Work Session City of McKinney August 4, 2017 Agenda Budget Process & FY18 Overview Property Tax General Fund Revenues & Expenditures Capital Improvements Program Debt Service Water
Town of Claresholm Strategic Plan
 Town of Claresholm Strategic Plan 2016-2019 Approved on March 29, 2016 Town of Claresholm Strategic Plan Centennial Park Vision A thriving community offering quality family living that encourages economic
Council Approved 2019 Budget and Five-Year Financial Plan
 Council Approved 2019 and Five-Year Financial Plan Updated 2019 Summary Balanced 2019 Operating : $1,513 million (amended - tax increase lowered from 4.9% to 4.5%) At the December 18, Council Meeting,
Report to: Council. October 26, Submitted by: Marian Simulik, City Treasurer
 2 Report to: Council October 26, 2011 Submitted by: Marian Simulik, City Treasurer Contact Person: Mona Monkman, Deputy City Treasurer, Corporate Finance Finance Department 613-580-2424 ext. 41723, Mona.Monkman@ottawa.ca
2030 Infrastructure Plan Introduction
 2 nd Draft February 25, 2016 Infrastructure Plan Introduction 1.0 INTRODUCTION The Infrastructure Plan covers the City s infrastructure investment needs for the next 15 years (2016-) and was developed
CITY OF VAUGHAN EXTRACT FROM COUNCIL MEETING MINUTES OF JUNE 19, 2018
 CITY OF VAUGHAN EXTRACT FROM COUNCIL MEETING MINUTES OF JUNE 19, 2018 Item 8, Report No. 6, of the Finance, Administration and Audit Committee, which was adopted without amendment by the Council of the
City of Lawrence Page 1 Strategic Plan Performance Measures
 City of Lawrence Page 1 Strategic Plan s Strategic Plan s Performance measures are specific metrics for each aspect of performance to be monitored. In March 2017, the City of Lawrence s Critical Success
VILLAGE OF NEW MARYLAND 2015 GENERAL OPERATING FUND BUDGET. 1. Total Budget - Total Page 17 $4,466,360
 1. Total Budget - Total Page 17 $4,466,360 2. Less: Non-Tax Revenue - Total Page 7 $311,392 3. Net Budget $4,154,968 4. Less: Community Funding and Equalization Grant $6,108 5. Warrant to be Raised by
THE CORPORATION OF THE CITY OF SAULT STE. MARIE
 Consolidated Financial Statements of THE CORPORATION OF THE CITY OF SAULT STE. MARIE Consolidated Financial Statements Page Management s Responsibility for the Consolidated Financial Statements... 1 Independent
AGENDA REGULAR MEETING OF COUNCIL. Tuesday, September 25, :00 p.m. Council Chamber, Municipal Hall 355 West Queens Road, North Vancouver, BC
 AGENDA REGULAR MEETING OF COUNCIL Tuesday, September 25, 2018 7:00 p.m. Council Chamber, Municipal Hall 355 West Queens Road, North Vancouver, BC Council Members: Mayor Richard Walton Councillor Roger
2013 Budget and Plan Guidelines
 APPENDICES 142 Appendix A: 2013 Budget and 2014-2018 Plan Guidelines 148 Appendix B: 2013 Operating Budget and 2014-2015 Operating Plan Guidelines 154 Appendix C: 2013 Capital Budget and 2014-2018 Capital
Cultural Investment by the City of Saskatoon
 Cultural Investment by the City of Saskatoon 2009 to 2012 Report prepared by Kelly Hill May 2014 Table of Contents Executive Summary... 1 Section 1: Introduction... 7 Section 2: Local structure, plans,
2018 Draft Operating and Capital Budgets Introduction
 2018 Draft Operating and Capital Budgets Introduction 1 COUNCIL PRIORITIES IN 2018 OPERATING AND CAPITAL BUDGETS COUNCIL S PRIORITIES Council Priorities in 2018 Budget Create a smart economy 2017 2018
2008 Tax Supported Fund Balance. ($millions)
") Operating Fund The City of Edmonton s Operating Fund consists of the following: Tax supported operations Civic/Corporate Programs Boards, Authorities, and Commission Non-tax supported operations Mobile
Operating Fund The City of Edmonton s Operating Fund consists of the following: Tax supported operations Civic/Corporate Programs Boards, Authorities, and Commission Non-tax supported operations Mobile
CITY OF VANCOUVER BRITISH COLUMBIA ANNUAL FINANCIAL REPORT
 CITY OF VANCOUVER BRITISH COLUMBIA ANNUAL FINANCIAL REPORT 2016 TABLE OF CONTENTS Mayor and Council... 1 City of Vancouver Organizational Chart... 2 Financial Statements Report of the Director of Finance...
Financial Plan
 2014-2018 Financial Plan Council Priorities Committee Township of Langley September 9, 2013 1 Operating Budget Overview Sustainability Vision, Goals and Guiding Principles 2014-2018 Budget Timeline Providing
GENERAL FUND REVENUES BY SOURCE
 BUDGET DETAIL BUDGET DETAIL The Budget Detail gives more information on the budget, than is shown in the Executive Summary. Detail information is provided on the General Fund, Special Revenue Funds, Enterprise
CITY OF BRAMPTON Budget Highlights. As Approved by City Council on February 23, 2011
 CITY OF BRAMPTON 2011 Budget Highlights As Approved by City Council on February 23, 2011 EXEXCUTIVE SUMMARY The current economic climate, meeting provincial growth targets and other budget drivers places
Executive Summary 1/3/2018
 Executive Summary 1/3/2018 EXECUTIVE SUMMARY This comprehensive plan was prepared by the City of Langley in accordance with Section 36.70A.070 of the Growth Management Act (GMA). The plan guides future
Highlights From The Approved 2013 Budget Budget in Brief
 Highlights From The Approved 2013 Budget 2013 Budget in Brief Preparing for the FUTURE: The City of Brandon is committed to building a sustainable future. Our 2013 budget process was improved in many ways,
City of Port Moody Financial Plan. April 08, 2008
 City of Port Moody 2008 2012 Financial Plan April 08, 2008 Presentation Contents 1. Financial Plan Process 2. Financial Position 3. Financial Plan Drivers 4. General Revenue Fund 5. Capital & Operating
2016 Annual Financial Report
 2016 Annual Financial Report The Corporation of the City of Red Deer Red Deer, Alberta For the Year Ended December 31, 2016 April 2017 ANNUAL FINANCIAL REPORT 2016 REPORT FROM THE CHIEF FINANCIAL OFFICER
General Manager, Finance, Risk and Supply Chain Management
 ADMINISTRATIVE REPORT Report Date: March 19, 2018 Contact: Melanie Kerr Contact No.: 604.871.6281 RTS No.: 12247 VanRIMS No.: 08-2000-20 Meeting Date: April 17, 2018 TO: FROM: SUBJECT: Vancouver City Council
Financial Planning Process at a Glance
 Financial Planning Process at a Glance The following schedule provides the dates for the Financial Plan process. July-September Budget preparation guidelines established. Department managers prepared and
STATEMENT OF FINANCIAL INFORMATION
 INCLUDING BOARDS AND COMMISSIONS BRITISH COLUMBIA STATEMENT OF FINANCIAL INFORMATION DECEMBER 31, 2016 FINANCIAL STATEMENTS SCHEDULE OF DEBTS SCHEDULE OF GUARANTEE AND INDEMNITY AGREEMENTS SCHEDULE OF
Province of Nova Scotia Service Nova Scotia and Municipal Relations
 v214-215.1.1 Province of Nova Scotia Service Nova Scotia and Municipal Relations FINANCIAL INFORMATION RETURN ( as prescribed by the Minister of Service Nova Scotia and Municipal Relations) FOR Municipality
City of Chilliwack 2019 Financial Plan. Glen Savard, CPA, CGA Director of Finance
 City of Chilliwack Glen Savard, CPA, CGA Director of Finance The Community Charter requires all municipalities to adopt a Financial Plan on an annual basis City prepares a 10 year Comprehensive Municipal
R E P O R T Finance and Information Technology
 R E P O R T Finance and Information Technology To: From: Subject: Mayor Coté and Members of Council in Open Council Workshop Gary Holowatiuk, CPA, CA Director of Finance and Information Technology 2015
CORPORATION OF THE CITY OF CORNWALL CONSOLIDATED FINANCIAL STATEMENTS
 CONSOLIDATED FINANCIAL STATEMENTS December 31, 2014 December 31, 2014 CONTENTS Page INDEPENDENT AUDITORS' REPORT 1 FINANCIAL STATEMENTS Consolidated Statement of Financial Position 2 Consolidated Statement
Executive Summary Operating Budget and Forecast
 Executive Summary The 2017 Budget Discussion Document presents the proposed 2017 operating budget, 2018-2019 forecasts and the 2017 Capital Budget for the Town of Oakville. The document represents the
Mayor Christian, Councillors Cavers, Dhaliwal, Dudy, Lange, Sinclair, Singh, and Walsh.
 1. MINUTES of the Budget Review Meeting of the MUNICIPAL COUNCIL OF THE CITY OF KAMLOOPS, held in Council Chambers at 7 Victoria Street West, Kamloops, BC, on Tuesday, February 20, 2018, at 10:00 am PRESENT:
City of Kamloops Provisional Budget including supplemental items
 City of Kamloops 2018-2022 Provisional Budget including supplemental items KEY BUDGET DATES: Nov 14 Initial Council Budget meeting Nov 21 Public Budget meeting 7-9pm Valley First Lounge, Sandman centre
FINANCIAL PLAN. A Path to Sustainability
 2017 2021 FINANCIAL PLAN A Path to Sustainability CONTENTS DISTRICT OF SECHELT... 4 FINANCIAL PLANNING PROCESS AT A GLANCE... 5 2017-2021 FINANCIAL PLAN OVERVIEW... 6 2017 FINANCIAL PLAN GENERAL FUND OPERATIONS...
Message from the Treasurer. Proposed Property Tax Increases. Municipal Service Delivery. Economic Profile. Development Outlook
 Executive Summary Table of Contents Message from the Treasurer Proposed Property Tax Increases Exec-3 Exec-4 About Brampton Brampton Facts Municipal Service Delivery Economic Profile Development Outlook
GENERAL ADMINISTRATION AND CORPORATE SERVICES (Administration/Corporate/Finance Departments)
") This document is provided as a comparison document for reference only. The years noted are based on the assumption that changes were considered for most or all sections of a respective bylaw, although
This document is provided as a comparison document for reference only. The years noted are based on the assumption that changes were considered for most or all sections of a respective bylaw, although
2012 Operating Budget. February 28, 2012
 2012 Operating Budget February 28, 2012 1 Agenda 1. Budget Process Improvements 2. Environment & Trends 3. Budget Pressures 4. Public Consultation 5. Strategy to Resolve Budget Pressures 6. Proposed 2012
Priorities. Vision and Mission Statements
 General Corporate Priorities Vision and Mission Statements Our Vision of Peel s Future Peel will be a healthy, vibrant, and safe community that values its diversity and quality of life. Corporate Mission
Finance Committee Minutes
 Finance Committee Minutes Council Chambers City Hall 13450-104 Avenue Surrey, B.C. TUESDAY, DECEMBER 11, 2018 Time: 4:00 p.m. Present: Mayor McCallum Councillor Annis Councillor Elford Councillor Guerra
2016 Budget Highlights
 During the regular meeting of Leduc City Council on Dec. 8, 2015, council adopted the 2016 operating and capital budgets outlining a 2.26 per cent tax increase; two-year forecasted operating budget (2017-2018)
2018 Spring Pulse Survey Overview
 2018 Spring Pulse Survey Overview Strategic Meeting of Council July 4, 2018 Prepared for The City of Calgary by The Corporate Research Team Contact: Attachment 2 ISC: Unrestricted Krista Ring Manager,
CITIZEN PERSPECTIVE Citizen Survey. Survey conducted by Prairie Research Associates May 2017
 CITIZEN PERSPECTIVE 217 Citizen Survey Survey conducted by Prairie Research Associates May 217 1 What is Market Research? The process of gathering information to learn more about how customers and potential
Bowen Island Municipality Financial Statements For the year ended December 31, 2014
 Financial Statements For the year ended Financial Statements For the year ended Contents Management s Responsibility for the Financial Statements 2 Independent Auditor's Report 3 Financial Statements Statement
That the report from the Director of Finance regarding the Strategic Asset Management Policy, dated June 20, 2018, be received; and
 Staff Report To: From: Mayor and Council Jeff Schmidt, Director of Finance Date: June 20, 2018 Subject: Strategic Asset Management Policy Report Highlights Provincial regulation (O.Reg. 588/17 - Asset
Golf Sustainability Work Plan Update
 2018 June 06 Page 1 of 8 EXECUTIVE SUMMARY For 100 years, municipal golf courses have been part of the recreational and cultural landscape of Calgary. The City of Calgary, through the Golf Course Operations
2017 Citizen Satisfaction Survey Final Report
 2017 Citizen Satisfaction Survey Final Report Survey conducted for the City of Colwood by: DISCOVERY RESEARCH Purpose Apply scientific methods to public consultation. Hear from a broad range of citizens
TOWN OF SMITHS FALLS DRAFT 2018 BUDGET GUIDE. Your town, your money, our future
 TOWN OF SMITHS FALLS DRAFT 2018 BUDGET GUIDE Your town, your money, our future Why a budget guide? This guide was developed to help residents understand how the Town of Smiths Falls operates and manages
That: 1. The 2018 Operating Budget as presented in Option 2 of the staff report titled 2018 Proposed Operating Budget be approved as follows:
 City of Richmond Report to Committee To: From: Re: Finance Committee Jerry Chong, CPA, CA Director, Finance 2018 Proposed Operating Budget Date: November 23, 2017 File: 03-0985-01/2017-Vol 01 Staff Recommendation
City of Kelowna Regular Council Meeting AGENDA
 City of Kelowna Regular Council Meeting AGENDA Monday, November 26, 2018 9:00 am Knox Mountain Meeting Room (#4A) City Hall, 1435 Water Street Pages 1. Call to Order 2. Confirmation of Minutes 3-5 Regular
SUMMARY OF SERVICES BY STRATEGIC PRIORITY
 Public Safety City Attorney's Office Municipal Prosecution $2,287,153 $2,343,199 $2,287,153 $2,343,199 Police Legal Liaison $768,508 $785,703 $768,508 $785,703 Court and Detention Services Adjudication
Strategic Asset Management Policy
 Strategic Asset Management Policy Submission Date: 2018-04-24 Approved by: Council Approval Date: 2018-04-24 Effective Date: 2018-04-24 Resolution Number: Enter policy number. Next Revision Due: Enter
Local Government Land Use and Asset Management Planning in BC: Proposed Sustainable Service Improvements. Kim Fowler, B.Sc., M.Sc.
 Local Government Land Use and Asset Management Planning in BC: Proposed Sustainable Service Improvements Kim Fowler, B.Sc., M.Sc., MCIP Infrastructure challenges are more than a daily inconvenience; they