Budget and Financial Plan GOLD COAST TRANSIT DISTRICT
|
|
|
- Patrick Pearson
- 5 years ago
- Views:
Transcription


1 and Financial Plan GOLD COAST TRANSIT DISTRICT Steven P. Brown General Manager Steve L. Rosenberg Director of Finance and Administration June 7, 2017
2 Final June 7, 2017 Page ii
3 TABLE OF CONTENTS GUIDE TO THE BUDGET AND FINANCIAL PLAN... 1 FY BUDGET AND FINANCIAL PLAN... 2 Mission Statement... 2 Board of Directors... 2 GCTD Senior Management Staff... 2 GCTD Organizational Chart... 3 BUDGET MESSAGE AND EXECUTIVE SUMMARY... 4 ary Guidelines... 4 Introduction... 4 Highlights for FY , the Upcoming Year... 5 Retrospective Highlights for FY , the Current Year Process Summary EXPENDITURES Employees Support Service/Supplies Operational Service/Supplies Support OPERATING REVENUE Passenger Fares Fixed Route Ridership Paratransit Ridership Farebox Recovery Interest and Other Income Advertising Income 22 Medi-Cal Reimbursement Paratransit Energy Credit Revenue State Transit Assistance Funds Federal Grant Funds Local Assistance Debt Service CAPITAL IMPROVEMENTS Capital Project Funding Ten-Year Capital Project Plan Final June 7, 2017 Page iii
4 Proposed Capital Projects Depreciation APPENDIX A. Operational Unit Expenditures B. Glossary TABLES 1. GCTD Operating Summary GCTD Operating Functional Categories GCTD Headcount Operating Revenue Passenger Fare Structure Ridership, Revenue and Farebox Return Federal Grant Funds Included in FY LTF Revenue and Members Transit Services Funding Sources and Uses of FY Revenues Debt Repayment Schedule, FY through FY Ten-Year Capital Project Plan New Facility Funding Program Ten-Year Capital Project Plan Funded Projects Ten-Year Capital Project Plan Programmed Projects (Funding Not Identified) Ten-Year Capital Project Plan Programmed Vehicles Ten-Year Capital Project Plan Summary Tables Depreciation Schedule Fixed Route Operating, FY Maintenance Operating, FY Administration Operating, FY Paratransit/ Planning and Marketing Operating, FY Final June 7, 2017 Page iv
5 GUIDE TO THE BUDGET AND FINANCIAL PLAN The Gold Coast Transit District (GCTD) and Financial Plan for FY presents the agency s financial and program plan in a single document for easy reference. It describes the services provided by GCTD and presents historical and anticipated costs of each function. Message and Summary This section summarizes the budgetary guidelines, highlights, fund structure, significant financial issues, the budget basis and process. Expenditures This section summarizes the expenditures in a historical and anticipated level. Included are the staffing levels of GCTD. Operating Revenue This section summarizes the operating revenue. Included are Local Transportation Funds and other local funds, federal grants, state funds, other revenue and farebox revenue and recovery. Debt Service This section summarizes GCTD s long-term debt obligation and how these expenditures are being addressed. Capital Improvements This section summarizes the approved and proposed capital program. Included is the depreciation for the capital equipment. Appendix Detailed information is provided on the annual expenditures as summarized in the Expenditure section. A glossary of terms is also provided. Final June 7, 2017 Page 1
6 FY BUDGET AND FINANCIAL PLAN GOLD COAST TRANSIT DISTRICT MISSION STATEMENT Gold Coast Transit s Board of Directors in 2009 adopted the following mission statement, providing a clear, concise strategic direction for the organization: GCTD s mission is to provide safe, responsive, convenient, efficient, and environmentally responsible public transportation that serves the diverse needs of our community. BOARD OF DIRECTORS City of Ojai City of Oxnard City of Port Hueneme Councilmember Paul Blatz Councilman Bryan A. Mayor Pro Tem Jim Hensley Director MacDonald - Chair Director Councilmember Randy Haney Mayor Pro Tem Carmen Councilmember Jonathan Alternate Ramirez - Alternate Sharkey - Alternate City of Ventura Councilmember Cheryl Heitmann Director County of Ventura Supervisor John C. Zaragoza Vice-Chair Councilmember James Monahan Alternate SENIOR MANAGEMENT STAFF Steven P. Brown General Manager Steve L. Rosenberg Director of Finance & Administration Vanessa Rauschenberger Director of Planning & Marketing Reed C. Caldwell Andrew Mikkelson Director of Engineering & Construction Director of Transit Operations Debbie L. Williams Director of Human Resources Final June 7, 2017 Page 2
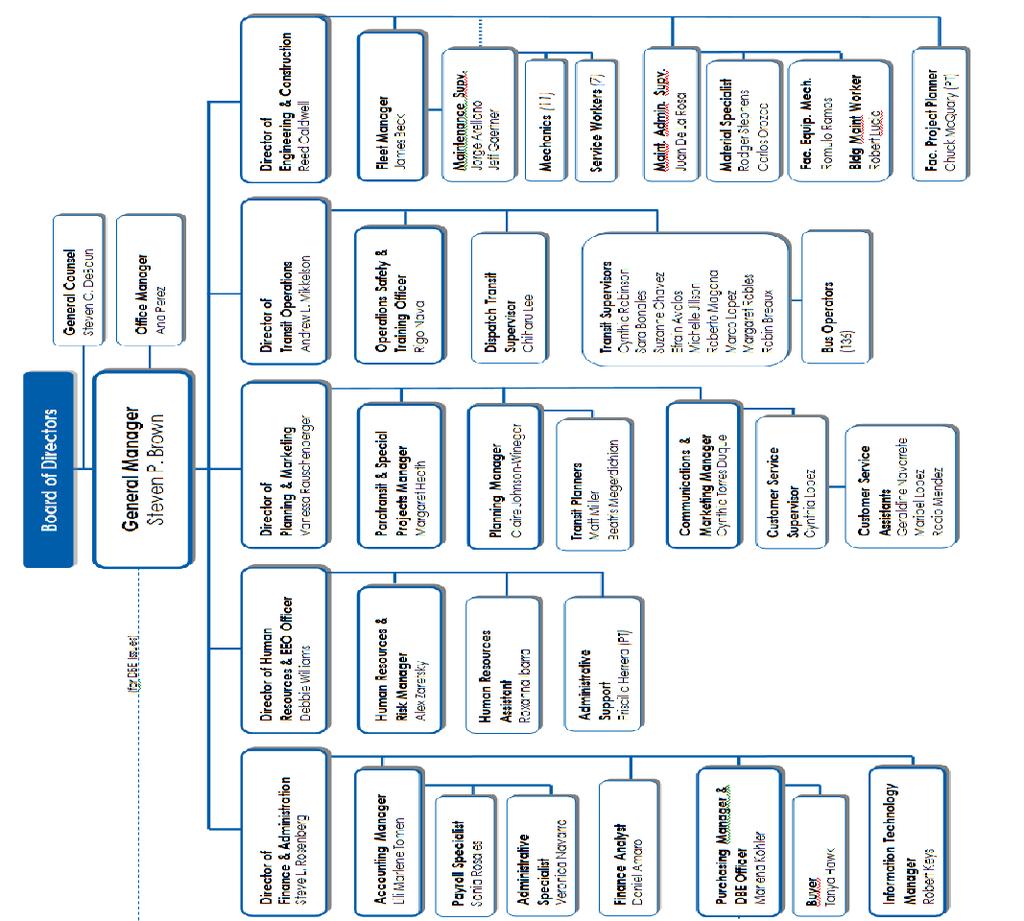
7 Organizational Chart June 2017 Final June 7, 2017 Page 3
8 BUDGET MESSAGE AND EXECUTIVE SUMMARY GCTD is committed to the protection of public investments through sound financial practices. This commitment is reflected throughout the process from budget development to final adoption. Following is a description of the budget process. BUDGETARY GUIDELINES The budget was developed following these guidelines. A. Prudent budgetary control is tied to strategic planning and resource availability. B. Meaningful public and member agency input is solicited during the annual budget review. C. Salary and benefit increases for employees reflect the agreed upon level. Actual wage or benefit increases are subject to existing labor agreements approved by the GCTD Board of Directors. GCTD and Service Employees International Union (SEIU) 721 negotiated a new Memorandum of Understanding (MOU) effective July 2014 through October 2017 that includes a 3% increase in July Non-represented employees typically receive similar increases. D. Appropriate insurance coverage is budgeted to mitigate the risk of material loss. E. Major capital items are specified in the Ten-Year Plan and are anticipated in the capital reserve funding request to the extent feasible. F. versus actual financial information is reported on a monthly basis. INTRODUCTION In March 2017 GCTD raised $22 million from the sale of bond instruments known as certificates of participation (COPs) to complete project funding for the District s new Administration and Operations Facility GCTD held a groundbreaking ceremony for the new facility on May 10, 2017 and construction is underway, with an estimated completion date of September 26, GCTD must replace its current facility, which is functionally obsolete and considerably undersized for a transit agency of its current size. The larger facility will allow GCTD to over time keep up with the growing need for public transportation in Western Ventura County. The District secured commitments for over 50% of the total project cost in Federal and State grants; this includes the cost of a 15-acre parcel in North Oxnard that GCTD acquired in July GCTD approached this undertaking in a strong financial position for an agency of its size in a county without a dedicated transit tax. When the agency transitioned from being a Joint Powers Authority (JPA) to a Transit District in July 2014 as the result of state legislation, GCTD became entitled to claim all of the Local Transportation Funds (LTF) allocated based on the population of its member jurisdictions under Article 4 of California s 1971 Transportation Development Act (TDA). GCTD by-laws then allow District members to claim from GCTD a portion of LTF for transit services or the operation and maintenance of locally supported transit facilities. LTF funding allocated to the district decreased 0.4% in FY compared to FY It has been Final June 7, 2017 Page 4
9 relatively flat since FY , but has increased 39% since the lowest recession year of FY The FY budget has GCTD retaining 86.4% of the full allocated LTF (with members capital and recurring transit requirements being the remaining 13.6%); this has ranged from 83% to 86% since GCTD became a district, as compared to being in the 70% range the last three years before the formation of GCTD. The District anticipates finishing FY with an operating surplus of $1.8 million (less adjustments for GASB 68 pension expense entries) and with approximately $7.7 million in capital reserves. BUDGET HIGHLIGHTS FOR FY , THE UPCOMING BUDGET YEAR The proposed operating budget for FY is $24,036,600, a 1.7% increase from the adopted FY budget. highlights are as follows: Revenues GCTD s primary revenue source continues to be LTF revenues from a.25% state sales tax generated by the 1971 Transportation Development Act (TDA) and allocated based on the population of its member jurisdictions. For FY , the preliminary LTF revenue allocation for GCTD approved by the Ventura County Transportation Commission (VCTC) in February 2017 was $14,979,129. The final amount expected to be approved by VCTC on June 2, 2017 is $15,043,768; this is GCTD s budget premise. In accordance with the process by which members may claim a portion of LTF for other transit requirements such as transit services or the operation and maintenance of locally supported transit facilities, each member has submitted to GCTD its LTF funding requests. Working together through GCTD s Technical Advisory Committee, GCTD and its members established a baseline in FY for recurring expenses; this baseline, adjusted by the CPI, will serve as the baseline for future years claim requests. Funding requests for non-recurring projects will be assessed and either funded in the current year or incorporated into the capital planning process. The FY the premised LTF allocation to GCTD is $15,043,768 and members claims for recurring transit services costs total $2,046,387, however the District will reclaim as a carryover credit $269,446 in FY operating funds not spent by the members. For FY the District proposes to fund $270,334 in discretionary non-recurring projects. That leaves $12,996,493 for GCTD s use. GCTD is budgeting $159,000 in State Transit Assistance (STA) for FY In 2016 the State Controller s Office (SCO) changed the long-standing allocation formula in a way that would have provided GCTD with a lower allocation than the $180,000 to $210,000 annually that the District previously received. The California Final June 7, 2017 Page 5
10 Transit Association (CTA) led an effort to enact a temporary roll-back to the previous process, and AB 1113 currently before the State legislature would provide a permanent resolution for this issue. In addition, the Governor recently signed into law SB 1, increasing a variety of taxes and fees to fund transportation infrastructure projects; among the transit uses included in this bill is increased STA funding. While we do have some early estimates, it is not clear when recipients will begin to receive this additional funding, so these additional funds are not included in this budget. GCTD s primary source of federal funding is FTA Section 5307 grant funding. On December 4, 2015, President Obama signed into law the Fixing America s Surface Transportation Act, or FAST Act. In FY , GCTD is projected to receive $4.78 million in Section 5307 and Section 5339 (Bus and Bus Facilities) formula funding, an 11% increase from GCTD s FY allocation. The increase is primarily the result of a non-recurring reduction in countywide planning funding the Ventura County Transportation Commission (VCTC) takes off the top. GCTD s FY operating budget includes $600,000 in funds from a Federal Congestion Mitigation and Air Quality (CMAQ) grant that supports the provision of new service; a three-year grant commencing in FY for Route 22 serving the Wells Center (Saticoy)-Nyeland Acres corridor. Passenger fares revenues for fixed route service are budgeted at $3.05M, a decrease of 5% from the FY budget. Fare revenues for FY as of March 2017 are tracking 5% below FY revenues and 10% below the FY budget. It is anticipated that FY will see a 4-5% increase from this year s level. Passenger fare revenues for paratransit service are budgeted for $262K in FY , an 8% increase above the FY budget and close to the projected paratransit fare revenue for FY Working in conjunction with Ventura County Public Health, GCTD receives revenue claimed by VCPH under the Medi-Cal Administrative Activities (MAA) program to partially reimburse GCTD for providing Medi-Cal eligible trips on the GCTD ACCESS service. FY marks the fifth year GCTD has received these funds. The District has budgeted $195,000 in revenue for these trip-related reimbursements. GCTD generates revenue through the sale of exterior and interior bus advertising. This program had grown from $7,000 in FY to $220,000 in FY As the result of losing our largest advertising customer, FY revenue was down to $153,000 and FY is tracking to approximately $150,000. GCTD anticipates some improvement and is budgeting $160,000 in FY Since FY GCTD has been receiving revenue related to dispensing compressed natural gas (CNG) as a vehicle fuel, generating and selling both Low Carbon Fuel Standard (LCFS) credits from the State of California cap-and-trade program and Renewable Identification Number (RIN) credits from U.S. EPA. The Final June 7, 2017 Page 6
11 District budgeted $354,200 in revenue for FY and is presently tracking to approximately that amount. For FY , GCTD is budgeting for $353,500 in energy credit revenue. GCTD has been claiming the Federal Alternative Fuel Excise Tax Credit for its use of CNG as a vehicle fuel since Recently this credit has generated approximately $500,000 per year for the District. This tax incentive expired and was retroactively extended by Congress multiple times, the last time in December The most recent extension expired on December 31, 2016, and no extension appears to be forthcoming. GCTD is not budgeting for this credit in FY Operating Expense The proposed operating budget for FY is $24,036,600, a 1.7% increase from the adopted FY budget of $23,630,600. Following is a description of the major cost areas. Labor Expense Labor and fringe benefit costs for the FY budget are projected to increase 0.6% as compared to the FY budget. GCTD contract employees will receive a 3% contractual wage increase in July 2017 and a similar increase is anticipated for other GCTD employees. Mitigating factors include the FY labor and fringe benefit costs tracking 4.5% under budget, one new staff position budgeted but not filled in FY will remain unfilled, and some efficiency adjustments to GCTD s service schedules resulted in the reduction of 1,137 revenue service hours (RSH). CalPERS methodology for calculating GCTD s employer-paid pension costs (included in fringe benefit costs above) has changed for FY This entire amount was previously a percentage of eligible wages; last year this was %. For FY the Employer Normal Cost portion is a percentage (9.855%) but the Employer Payment of Unfunded Liability portion is a fixed amount. While this will undoubtedly increase GCTD s costs in the long-term, for FY costs are close to or slightly lower than staff would have anticipated under the old formula. Boardings The budget premise for FY fixed route service is 3.78 million boardings, a 3.7 % decrease from the FY budget premise of 3.92 million boardings. The current forecast for actual boardings at FY year end is 7.8% under the budget premise. The budget premise for FY ACCESS paratransit service is for 106,600 boardings, a 10% increase from the FY budget premise of 97,000 boardings. The current forecast for actual boardings at FY year end is 6% above the budget premise; at the forecasted level, boardings on GCTD s ACCESS service will have increased by 50% in the five years from the recession low point in FY Final June 7, 2017 Page 7
12 Service Adjustments GCTD will be implementing slightly fewer (-0.6%) RSH in FY , with revenue service hours (RSH) decreasing from 203,488 in FY to 202,351 in FY Revenue service miles (RSM) will also decrease slightly (-0.8%), from 2,192,544 in FY to 2,175,715 in FY Minor schedule revisions were made to improve overall system efficiency, frequency on routes and on-time performance as well as reducing travel time for passengers in some cases. Additionally, a small number of late-night trips with very low ridership were eliminated. GCTD s budgeted fixed route cost per revenue hour for FY is $102.04, a 1% increase from the budgeted cost of $ in FY , and the budgeted fixed route cost per revenue mile is $9.49, a 1.2% increase from the budgeted cost of $9.38 in FY Insurance GCTD s FY budget includes modest increases across most insurance lines, with significant increases to the liability insurance program. For liability insurance GCTD belongs to the California Transit Indemnity Pool (CalTIP), a 34-member Joint Powers Authority formed in 1987 for the purpose of creating a self-funded insurance pool. Public sector insurance pools allow members to take advantage of being part of a much larger entity to obtain better coverage, rates and stability and remain protected from the vagaries of the commercial insurance market. CalTIP self-insures all claims against pool members up to $1.25 million (in FY ), with excess and reinsurance covering claims in excess of that amount. GCTD carries coverage up to $25 million. Being in CalTIP also afforded GCTD the opportunity to carry liability insurance with a zero self-insured retention (SIR, like a deductible), with any excess contributions being returned to GCTD in the form of a retrospective adjustment (like a dividend) in a future year. The past few years have been increasingly challenging for CalTIP, with the pool experiencing numerous large claims. This has significantly increased members rates and reduced the likelihood of retrospective adjustments in the near-term. To keep costs down, CalTIP has increased its SIR to $1.5 million and GCTD has increased its SIR to $25,000. This has allowed GCTD s liability insurance budget line item to drop from $801,000 in FY to $720,000 in FY This does require the District to establish a claims expense budget for costs under the SIR. GCTD s claims expense budget for FY is $230,000. The total of these two line items is slightly less than our liability costs would have been under the previous deductible. GCTD s workers compensation insurance (WCI) budget for FY was $1,132,400, which was based on a preliminary proposal from GCTD s WCI pool, the California State Association of Counties Excess Insurance Authority (CSAC-EIA). The final cost for FY was substantially lower than the preliminary proposal, just over $936,000. This year s budget of $1,019,800 is an estimate that includes an Final June 7, 2017 Page 8
13 increase from this year s cost as well as a factor to reduce this year s preliminary estimate. Fuel & Lubricants - The FY budget for fuel and lubricants is $785,100, a 0.4% increase from the FY budget of $781,700. GCTD continues to benefit from the continued low commodity price for natural gas, combined with GCTD s supplier agreement providing an additional 4% discount off the published market price. This discount will increase to 6% in October 2017 if GCTD exercises its contract option. GCTD has transitioned to a more fuel-efficient paratransit fleet vehicle composition, which also contributes to keeping fuel costs under control. The unit price used to calculate the FY budget is 10% above the twelve month average price as of March 2017; this unit price is also approximately 10% above the May 2017 price. Paratransit operations - The budget for contracted paratransit services in FY is $3,083,200, a 12.2% increase from the FY budget of $2,748,300. Current year costs are trending 4% higher than budget. The budget premise for service demand in FY is a 10% increase from the FY budget premise, with current year demand trending 6% higher than premised. Cost increases are moderated by exercise of the final option year of a long-term service contract. Farebox Recovery Ratio California TDA regulations require that a transit service claimant for TDA funds realize a system wide farebox recovery ratio (FBRR), the ratio of fares plus local revenues to operating cost, of at least 20%; or that the claimant realize a FBRR of 20% for fixed route service and 10% for paratransit service. GCTD has not failed to meet this benchmark, but it has been and will continue to be an ongoing challenge. Many California transit agencies meet this requirement using local revenue from dedicated transit sales taxes; Ventura County is the most populous county in California that does not have a dedicated transit tax. Recent legislation clarified how local revenues may be included in the farebox recovery ratio calculation and how certain cost increases can be adjusted with regard to the calculation. This provides a small measure of relief for transit agencies like GCTD that operate without a county sales tax dedicated to transit. It allows agencies to supplement fare revenues with any nonfederal or nonstate grant funds or other revenues generated by, earned by, or distributed to an operator for purposes of calculating the ratio. GCTD will include in the calculation its other revenue sources such as advertising sales, energy credit sales and the Medi-Cal paratransit trip reimbursements. SB 508 also allows for an adjustment to costs, allowing agencies to reduce expenses for purposes of the farebox calculation by cost increases beyond the change in the Consumer Price Index for fuel, alternative fuel programs, power, including electricity, insurance premiums and payments in settlement of claims arising out of the operator s liability, state and federal mandates, startup costs for Final June 7, 2017 Page 9
14 new services for a period of not more than two years, as well as additional operating costs required to provide comparable complementary paratransit service that exceed(s) the operator s costs required to provide comparable complementary paratransit service in the prior year as adjusted by the Consumer Price Index. Additionally, GCTD has a modest reserve of local deferred revenue from a prior year. The FY budget premise includes using a portion of that deferred revenue to supplement current year revenues for FBRR purposes. Including that revenue, the farebox recovery ratio in GCTD s FY budget is 20% for fixed route and 14.6% for paratransit. Capital Reserve Contribution With the addition of COP payments commencing in FY , this budget does not include a capital reserve contribution for FY GCTD anticipates finishing FY with approximately $7.8 million in capital reserves. Debt Service On March 2, 2017 GCTD closed the sale of $22,000,000 in 30-year certificates of participation (COPs) to complete the financing of GCTD s new Administration and Operations Facility. Construction officially started on March 27, 2017 and the estimated completion date is September 26, FY is the first year of GCTD s long-term debt obligation. For the first year, GCTD has two interest-only payments due: a payment of $348, is due on July 1, 2017 and a payment of $527, is due on January 1, In future years, GCTD s semi-annual payments for principal and interest will total approximately $1.38M annually. In FY GCTD budgeted $515,047 in Federal funds and $609,953 in LTF funds for a total of $1,125,000 for debt repayment; these funds will be used toward the FY interest payments. In FY GCTD is budgeting $1,100,000 in Federal funds and $36,250 in LTF Funds for debt repayment. These funds will be used toward the FY principal and interest payments. RETROSPECTIVE REVIEW OF BUDGET HIGHLIGHTS FOR FY THE CURRENT BUDGET YEAR Revenues For FY , GCTD received $15,100,317 from LTF revenue allocation approved by the VCTC on June 3, In accordance with the process by which members may claim a portion of LTF for transit services or the operation and maintenance of locally supported transit facilities, members claims for recurring transit services costs totaled $2,219,385, Final June 7, 2017 Page 10
15 however the District will reclaim as a carryover credit $603,636 in FY operating funds not spent by the members. The District approved $400,000 in discretionary non-recurring capital projects, leaving $13,084,568 for GCTD s use. GCTD is budgeted $150,000 in State Transit Assistance (STA) for FY Because pending STA legislation previously discussed remains unresolved, state STA payments have been delayed and it remains to be seen when this funding will be remitted. GCTD s primary sources of federal funding are FTA Section 5307 and Section 5339 formula grant funding. In FY , GCTD was allocated $4.3 million in Section 5307 and Section 5339 (Bus and Bus Facilities) funding. GCTD typically does not have access to these funds until the end of its fiscal year, and this year is no exception as we expect to receive funds either in June or possibly later. GCTD s FY operating budget included $560,000 in funds from a Federal Congestion Mitigation and Air Quality (CMAQ) grant that supports the provision of new service; a three-year grant commencing August 2015 for Route 22 serving the Wells Center (Saticoy)-Nyeland Acres corridor. GCTD draws down these funds periodically throughout the year. Passenger fare revenues for fixed route service in FY were budgeted at $3.21M, but are trending approximately 9% under budget. Passenger fare revenues for paratransit service in FY were budgeted for $242K in FY , and are trending approximately 12% over the projected budget. The District conservatively budgeted $125,000 for FY Medi-Cal Administrative Activities (MAA) trip-related reimbursements. These payments typically are received one-to-two years after the costs are incurred. GCTD has received more funds than it anticipated during this fiscal year. GCTD generates revenue through the sale of exterior and interior bus advertising. This program experienced a steep reduction in revenue in FY as the result of losing the largest advertiser, and was anticipating improving from $150,000 to $ in FY We have seen an uptick late in the year, but FY revenues will be in the $150,000 range. The District budgeted $354,200 in FY revenue from the sale of both Low Carbon Fuel Standard (LCFS) credits from the State of California and Renewable Identification Number (RIN) credits from U.S. EPA. Revenues are on target to meet that budget. GCTD has been claiming the Federal Alternative Fuel Excise Tax Credit since 2007, This tax incentive expired and was retroactively extended by Congress multiple times, most recently in December 2015, to be in effect through December 31, GCTD is budgeted $251,000 for the first two quarters of FY and received just under $250,000. Final June 7, 2017 Page 11
16 Operating Expense The proposed operating budget for FY was $23,630,600, a 6.9% increase from the adopted FY budget of $22,096,000. Following is a description of the major cost areas. GCTD s budgeted fixed route cost per revenue hour for FY was $ and the budgeted fixed route cost per revenue mile was $9.38. The costs are trending at $94.86 per revenue hour and $8.80 per revenue mile. Labor Expense Labor and fringe benefit costs for the FY were budgeted to increase 5.5% as compared to the prior year budget. These costs are trending 4.5% under budget. Boardings The budget premise for FY fixed route service was 3.92 million boardings, a.9% decrease from the prior year budget premise of 3.96 million boardings. Actual boardings are trending 7.5 8% under the budgeted level. The budget premise for FY ACCESS paratransit service was for 97,000 boardings, a 7.8% increase from the prior year budget premise of 90,000 boardings. Actual boardings are trending 6% above the budgeted level. Insurance GCTD s two major insurance programs, liability insurance and workers compensation insurance, experienced substantial budget increases in FY GCTD s liability insurance budget was $801,000, a 54% increase from the FY budget of $519,000. As the budget was based on a firm quote for the period through April 30 th, actual costs will be very close to this amount. GCTD s workers compensation insurance budget for FY was $1,132,400, a 24% increase from the FY budget. The budget was based on a preliminary estimate from our WCI insurance pool, the California State Association of Counties Excess Insurance Authority (CSAC-EIA). As the final quote issued after the budget was adopted was for $936,523, actual costs will be substantially under budget. Fuel & Lubricants - The FY budget for fuel and lubricants was $781,700, a 6.9% decrease from the FY budget of $839,400. Actual costs are trending at or slightly above the budgeted amount. Paratransit operations - The budget for contracted paratransit services in FY was $2,748,300, a 4.7% increase from the FY budget of $2,625,500. Actual costs are trending 6% above the budgeted amount. Farebox Recovery Ratio California TDA regulations require that a transit service claimant for TDA funds realize a system wide farebox recovery ratio (FBRR), the ratio of fare and local revenues to operating cost, of at least 20%; or that the claimant realize a FBRR of 20% for fixed route service and 10% for paratransit Final June 7, 2017 Page 12
17 service. Year-to-date through March 2017, GCTD s FBRR was 20.6% for fixed route and 17% for paratransit, with an overall FBRR of 20.1% Capital Reserve Contribution For FY , GCTD budgeted to contribute $250,000 to the capital reserve fund. Contributions are typically made at year end for cash flow purposes. Debt Service In the FY budget GCTD allocated $1,125,000 for debt repayment. As a result of delay in selling the COPs, GCTD s first payments are due in FY The FY funds will be used toward the FY payments. BUDGET PROCESS The proposed budget was developed by the Finance and Administration Department in consultation with the GCTD General Manager and Management team. Preliminary budget premises were discussed with the GCTD Technical Advisory Committee (TAC) on April 19, 2017 and in a separate meeting with the Board of Directors Fiscal Policy Committee on April 19, A full report on the proposed FY budget was presented for review and comment to the Board of Directors on May 3, The final version of the operating budget, with no changes from the May 3, 2017 version, was recommended for approval by the TAC on May 17, BUDGET SUMMARY The budget summary is displayed in Table 1, Operating Summary, Revenues and Expenses, and Table 2, Operating Functional Categories. Table 1 provides a summary of both revenue and expense, categorized by both expenditure type and department, Table 2 provides a major line item breakout of the expenses by type. The budget document provides details for the operating budget in the Expenditures (page 16) section and the revenue sources in the Operating Revenue (page 18), These sections include tables reflecting the operating expense budgets by line item breakouts, and are accompanied by a discussion of significant cost categories. A discussion of the capital projects budget appears in the Capital Improvements (page 29) section, and a summary of the debt service budget appears in Debt Service (page 27). In the appendix are detailed tables of the line items by each of GCTD s departments and a glossary of terms. Final June 7, 2017 Page 13
18 TABLE 1 Gold Coast Transit District Operating Summary July 1, 2017 to June 30, 2018 Operating Revenues FY15-16 FY15-16 Actuals FY16-17 Proposed FY17-18 % +/(-) FY18 vs. FY17 Passenger Fares-Fixed Route $3,285,400 $3,068,465 $3,209,400 $3,050,500 (5.0%) Passenger Fares-Paratransit $213,500 $255,046 $242,500 $262, % Special Transit Fares (FR) - Member Gov'ts $165,000 $0 $0 $352,000 N/A Interest $12,000 $14,997 $13,000 $20, % Advertising Income $245,000 $153,164 $180,000 $160,000 (11.1%) Energy Credit Revenue $121,200 $292,366 $354,200 $353,500 N/A Alternative Fuel Excise Tax Credit $0 $743,034 $251,000 $0 N/A Other $1,000 $53,548 $1,000 $1, % Operating Assistance-State $210,000 $184,928 $150,000 $159, % Operating Assistance-Local (LTF) $12,682,800 $10,601,709 $14,790,710 $14,968, % Other Local/State Assistance $0 $23,045 $0 $0 N/A Demo Project - Victoria Route $500,000 $589,384 $0 $0 N/A Demo Project - Wells Center/Nyeland Acres $684,000 $435,689 $560,000 $600,000 N/A JARC Funding For Route 20 $133,400 $133,400 $0 $0 N/A Operating Assistance-Federal $1,050,000 $1,050,000 $1,050,000 $1,050, % Preventive Maintenance-Federal $1,632,700 $1,632,700 $1,607,177 $1,719, % Paratransit Assistance-Federal $840,000 $840,000 $896,613 $944, % Planning Assistance-Federal $200,000 $200,000 $200,000 $200, % Medi-Cal Reimbursement / Paratransit $120,000 $46,258 $125,000 $195, % Other Fed Grants and Reimbursements $0 $49,547 $0 $0 N/A TOTAL $22,096,000 $20,367,279 $23,630,600 $24,036, % Operating Expenses FY15-16 FY15-16 Actuals FY16-17 Proposed FY17-18 % +/(-) FY18 vs. FY17 FUNCTIONAL CATEGORIES Employee Support 15,704,200 14,559,161 16,763,700 16,778, % Service/Supplies - Operational 5,254,100 4,872,630 5,435,000 5,691, % Service/Supplies - Support 1,137,700 1,116,090 1,431,900 1,566, % TOTAL $22,096,000 $20,547,881 $23,630,600 $24,036, % DEPARTMENT CATEGORIES Fixed Route 11,895,000 11,135,177 12,527,600 12,561, % Paratransit 2,924,600 2,847,427 3,074,400 3,388, % Maintenance 3,479,600 3,135,045 3,638,300 3,629,500 (0.2%) Administration 2,713,400 2,512,072 3,184,900 3,401, % Planning and Marketing 1,083, ,160 1,205,400 1,056,000 (12.4%) TOTAL $22,096,000 $20,547,881 $23,630,600 $24,036, % Total Fixed Route $19,171,400 $17,700,454 $20,556,200 $20,648, % Total Paratransit $2,924,600 $2,847,427 $3,074,400 $3,388, % Farebox Recovery Ratio 19% 21% 19% 19.3% FRR Fixed Route 20% 23% 20% 20.0% FRR Paratransit 10% 13% 11% 14.6% Final June 7, 2017 Page 14
19 TABLE 2 Gold Coast Transit District Operating Functional Categories July 1, 2017 to June 30, 2018 Proposed FY17-18 % +/(-) FY18 vs. FY17 FY15-16 FY15-16 FY16-17 Employee Support Actuals Salaries 10,509,400 10,387,051 11,192,900 11,271, % Health Benefits 1,806,000 1,683,040 1,843,200 1,851, % WCI 911, ,835 1,132,400 1,019,800 (9.9%) Retirement 1,935,800 1,105,983 1,973,000 1,973, % Other Benefits 247, , , ,400 (1.0%) Uniforms 77,400 60,271 79,400 81, % Medical Exams 44,800 45,272 45,500 45, % Safety & Training 102,500 88, , ,500 (7.5%) Employee Events ,200 N/A Contract Support 69,000 40,093 85,000 89, % TOTAL $15,704,200 $14,559,161 $16,763,700 $16,778, % Proposed FY17-18 % +/(-) FY18 vs. FY17 Service/Supplies - Operational FY15-16 FY15-16 Actuals FY16-17 Fuel/Lubricants 839, , , , % Tires 175, , , ,000 (11.4%) Repair Parts 662, , , ,000 (0.9%) CNG Fuel Station 100,000 58,738 90, , % Paratransit Service Contract 2,625,500 2,539,728 2,748,300 3,083, % Contract Repair 270, , , ,500 (2.4%) Contract Services 191, , , ,500 (13.2%) Supplies 153, , , ,300 (2.8%) Tickets/Schedules 86,000 69,747 71,000 70,000 (1.4%) Marketing 130,600 49, , ,000 (23.7%) Interest Expense 3,000 4,767 5,000 6, % OTC Facilities 11,600 15,507 15,000 14,000 (6.7%) Maintenance Agreements 6,200 7,835 7,400 18, % Warranty Recovery % TOTAL $5,254,100 $4,880,015 $5,435,000 $5,691, % Proposed FY17-18 % +/(-) FY18 vs. FY17 Service/Supplies - Support FY15-16 FY15-16 Actuals FY16-17 Telephones/Utilities 192, , , ,000 (5.4%) Insurance 582, , ,800 1,022, % Contract Services 70,000 49,951 51,000 63, % Supplies 95, , , , % Legal 72,000 27,764 57,000 55,000 (3.5%) Audit 40,000 31,250 32,000 32, % Officers & Directors 40,000 45,397 55,000 24,500 (55.5%) Dues 45,500 36,203 47,700 47,100 (1.3%) TOTAL $1,137,700 $1,116,090 $1,431,900 $1,566, % GRAND TOTAL $22,096,000 $20,555,267 $23,630,600 $24,036, % Final June 7, 2017 Page 15
20 EXPENDITURES Employees Support The proposed budget for employee support shows an increase of $15,200 (0.1%). Actual costs will increase from FY costs as discussed below, however these increases are offset in the budget comparison because FY costs are tracking 5.5% to 6% under budget. GCTD represented personnel will receive 3% wage increases in July 2017 in accordance with the District s MOUs with SEIU Local 721; non-represented personnel have historically received adjustments commensurate with contractual increases. GCTD s MOUs expire on October 31, 2017 and negotiations for new agreements will begin soon. GCTD estimates that premised service levels will require approximately 135 bus operators for FY Operator headcount is driven by service planning and other variables, and actual headcount will typically vary throughout the year. Nonoperator headcount is projected to be 63, slightly below the FY budget level of GCTD s headcount budget is shown in Table 3. Health benefit contribution increases have historically taken effect in January, and future increases will be determined during negotiations. GCTD s employer pension contribution changed in FY from % of applicable earnings in FY to 9.855% of applicable earning plus a fixed contribution of $699,710 this new structure does not project as a substantial increase in FY but will likely increase GCTD s costs in future years. GCTD s workers compensation insurance (WCI) budget line item will decrease $112,600 (10%) in FY Last year s budget was established using a preliminary estimate that was higher than the final quote, which was not received until after the budget was approved and published. This year the budget includes an adjustment for this dynamic, however it is expected that actual WCI costs will increase 8-10%. While GCTD has added a new budget line item this year, Employee Events, the costs contained in this line item are not additions to the budget. These activities have in prior years been included in other line items such as Safety Program and Officers and Directors expense; these line items show a reduced budget. Final June 7, 2017 Page 16
21 TABLE 3 Gold Coast Transit District GCTD Headcount July 1, 2017 to June 30, 2018 FY16-17 Approved FY17-18 Proposed Changes FY17-18 Proposed Position Operations Bus Operator Operations Mgmt. Director of Operations 1 1 Operations Safety & Training Officer 1 1 Transit Supervisor Road 9 9 Transit Supervisor Dispatch 1 1 Dispatch & Revenue Control Specialist Paratransit Paratransit & Special Projects Mgr Maintenance Director of Engineering & Construction 1 1 Facility Project Planner Director of Fleet and Facilities Fleet Manager Maintenance Supervisor 2 2 Maintenance Supervisor (Administration) 1 1 Facility & Equipment Mechanic II 1 1 Maintenance Material Specialist 2 2 Mechanic Bldg, Maintenance Worker/Bus Stop Support 1 1 Service Worker Administration General Manager 1 1 Office Manager 1 1 Director of Finance & Administration 1 1 Accounting Manager 1 1 Payroll Specialist 1 1 Finance Analyst 1 1 Administrative Specialist 1 1 Accounting Intern I.T. Manager 1 1 Purchasing Manager/DBE Officer 1 1 Buyer 1 1 Safety & Compliance Manager Human Resources Director of Human Resources 1 1 Human Resources & Risk Manager 1 1 Human Resources Administrator Planning & Marketing Director of Planning & Marketing 1 1 Communications & Marketing Manager 1 1 Customer Service Supervisor 1 1 Customer Service Asst 3 3 Transit Planning Manager 1 1 Transit Planner 2 2 Planning Intern Total Final June 7, 2017 Page 17
22 Service/Supplies Operational The proposed FY budget for Service/Supplies - Operational shows an increase of $256,300 (4.7%) from FY The increase is entirely attributable to higher costs associated with increased ridership demand for GCTD s contracted ACCESS paratransit service. The FY budget for the Paratransit Service Contract line item is 12% higher than the FY budget, primarily as the result of a 10% increase in projected ridership and Vehicle Revenue Hours (VRH). ed boardings increase from 97,000 in the FY budget to 106,600, while VRHs increase from 40,442 to 44,400. Note that demand for this service in FY is currently running 6% over the budgeted level. Three line items show a budget reduction for FY ed expense for tires is reduced as the result of a recent change in GCTD s tire supplier. The contract services budget is lower in FY as the result of having made several nonrecurring technology changes in FY , and marketing costs are down as the result of not including a project budgeted for and completed in FY The FY budget for fuel and lubricants is $785,100, a 0.4% increase from the FY budget of $781,700. As discussed in an earlier section, GCTD continues to benefit from the continued historic low commodity price for natural gas, combined with GCTD s discounted third-party supplier agreement. In the FY Contract Repair budget GCTD noted a non-recurring expense for updating the exterior of 25 buses with GCTD s new exterior bus design (colors and logo). That project is complete, however the District is experiencing an increase in major engine repairs as our fleet ages; as a result the contract repair budget remains only slightly lower than its FY level. Service/Supplies Support The proposed budget for service/supplies support in FY shows an increase of $134,500 (9.4%) from FY , directly related to a $154,800 (17.8%) increase in GCTD s costs for liability insurance and claims expense. This issue is addressed in detail on Page 8 of this document. The decrease in officers and directors expense is the result of realigning some cost items into a new line item, employee events. OPERATING REVENUE Funding for GCTD operating activities is derived from several sources, including passenger fares; local, state and federal funds; bus advertising sales, other local revenues and interest income. Table 4 reflects the revenue for operating activities in FY Final June 7, 2017 Page 18
23 TABLE 4 Gold Coast Transit District Operating Revenue July 1, 2017 to June 30, 2018 Operating Revenues FY15-16 FY15-16 Actuals FY16-17 Proposed FY17-18 % +/(-) FY18 vs. FY17 Passenger Fares-Fixed Route $3,285,400 $3,068,465 $3,209,400 $3,050,500 (5.0%) Passenger Fares-Paratransit $213,500 $255,046 $242,500 $262, % Interest $12,000 $14,997 $13,000 $20, % Advertising Income $245,000 $153,164 $180,000 $160,000 (11.1%) Energy Credit Revenue $121,200 $292,366 $354,200 $353,500 N/A Alternative Fuel Excise Tax Credit $0 $743,034 $251,000 $0 N/A Other $1,000 $53,548 $1,000 $1, % Operating Assistance-State $210,000 $184,928 $150,000 $159, % Operating Assistance-Local (LTF) $12,682,800 $10,601,709 $14,790,710 $14,968, % Other Local/State Assistance $0 $23,045 $0 $0 N/A Demo Project - Victoria Route $500,000 $589,384 $0 $0 N/A Demo Project - Wells Center/Nyeland Acres $684,000 $435,689 $560,000 $600,000 N/A JARC Funding For Route 20 $133,400 $133,400 $0 $0 N/A Operating Assistance-Federal $1,050,000 $1,050,000 $1,050,000 $1,050, % Preventive Maintenance-Federal $1,632,700 $1,632,700 $1,607,177 $1,719, % Paratransit Assistance-Federal $840,000 $840,000 $896,613 $944, % Planning Assistance-Federal $200,000 $200,000 $200,000 $200, % Medi-Cal Reimbursement / Paratransit $120,000 $46,258 $125,000 $195, % Other Fed Grants and Reimbursements $0 $49,547 $0 $0 N/A TOTAL $22,096,000 $20,367,279 $23,630,600 $24,036, % Following is a brief discussion of each major revenue area. Passenger Fares Passenger fare revenues are projected to finish FY at approximately $3.17 million; that would be 8% lower than budgeted. Fixed route passenger fares are projected to end the year 9% under the FY budgeted amount at approximately $2.9 million, attributable to lower-than expected passenger boardings, and paratransit fares are forecast to be 13% higher than the FY budgeted amount at approximately $ , attributable to higher-than-anticipated boardings and fare revenue per boarding. The budget premise for FY fixed route fare revenue is $3.05 million, a 5% decrease from the FY budget but a 5% increase from the current FY year-end forecast. The budget premise for FY paratransit fare revenue is $262,200, an 8% increase from the FY budget and slightly lower than the current FY year-end forecast. Final June 7, 2017 Page 19
24 Table 5 shows the current GCTD passenger fare structure. The most recent changes were in FY , when GCTD changed the multi-ride ticket and monthly pass structure, replacing 10-ride, 20-ride and 30-ride passes with a 15-ride pass and replacing the monthly pass, which was valid for one calendar month, with a 31-day pass that is valid from the date of first use on any day of any month. This change was in conjunction with the new fare collection system installed in GCTD fixed route bus fleet in May The base cash fare amount has not changed since GCTD FIXED ROUTE FARES TABLE 5 Gold Coast Transit District Passenger Fare Structure Cash Fares (One Way) Fare Amount Multi-Ride Ticket or Monthly Pass Fare Amount Adult $1.50 Adult Youth (through age 18) $ Ride $20.00 Seniors (65-74 years of age with GCTD I.D or proof of age) $ Day Pass $50.00 Medicare (with Medicare Card) $0.75 Youth Disabled (ADA card or GCTD I.D.) $ Ride $15.00 Seniors 75+ (with GCTD I.D or proof of age) Free 31-Day Pass $40.00 Children under 45 tall (when accompanied by paid fare) Free Reduced Fare (Senior/Disabled) Day Pass (One-Day/Unlimited Boardings) $ Ride $10.00 Day Pass for Seniors/Medicare/Disabled $ Day Pass $25.00 GCTD ACCESS (Paratransit) FARES Cash Fares (One Way) Multi-Ride Ticket or Monthly Pass ADA Certified or Senior $3.00 Book of Ten Tickets - ADA Certified or Senior $30.00 Senior Nutrition (registered with County program) Donation * Senior is 65 years of age and older w/proof of age Fixed Route Ridership Boardings in FY are trending 7.8% behind FY and project to 3.62 million. For FY , the budget premise is that ridership will be 3.78 million boardings, 4.5% higher than the current FY year-end projection. Paratransit Ridership Paratransit ridership is running 6% higher than the FY budgeted level, which would mean that ridership for GCTD s ACCESS service has increased by 50% since FY The premise for the FY budget is 106,600 boardings, an increase from the 102,800 boardings forecast for FY year end. Farebox Recovery As discussed on Page 9-10, the California Code of Regulations, requires that a transit service claimant in an urbanized area, to qualify for allocation of TDA funds, Final June 7, 2017 Page 20
25 must have a systemwide ratio of fare revenues to operating cost of at least twenty percent (20%), or that the claimant realize a farebox recovery ratio (FBRR) of 20% for fixed route service and 10% for paratransit service. California SB 508, signed by Governor Brown in 2015, took effect for FY and modified the TDA farebox recovery ratio statute by allowing the following revenue and cost adjustments for purposes of calculating the ratio: For Revenue: Section If fare revenues are insufficient to meet the applicable ratio of fare revenues to operating cost required by this article, an operator may satisfy that requirement by supplementing its fare revenues with local funds. As used in this section, "local funds" means any nonfederal or nonstate grant funds or other revenues generated by, earned by, or distributed to an operator. For Costs: Section (a) Notwithstanding subdivision (a) of Section 99247, the following costs shall be excluded from the definition of "operating cost" for the purposes of calculating any required ratios of fare revenues to operating cost specified in this article: (1) The additional operating costs required to provide comparable complementary paratransit service as required by Section of Title 49 of the Code of Federal Regulations, pursuant to the federal Americans with Disabilities Act of 1990 (42 U.S.C. Sec et seq.), as identified in the operator's paratransit plan pursuant to Section of Title 49 of the Code of Federal Regulations that exceed the operator's costs required to provide comparable complementary paratransit service in the prior year as adjusted by the Consumer Price Index. (2) Cost increases beyond the change in the Consumer Price Index for all of the following: (A) Fuel. (B) Alternative fuel programs. (C) Power, including electricity. (D) Insurance premiums and payments in settlement of claims arising out of the operator's liability. (E) State and federal mandates. (3) Startup costs for new services for a period of not more than two years. Section (a) Operating cost excludes principal and interest payments on capital projects funded with certificates of participation. The revenue calculation change clarified previously held but unwritten interpretations of what revenues could be used to supplement fares, and are beneficial for agencies such as GCTD that operate without the benefit of a local transit-specific sales tax. The cost adjustments also provide some relief by eliminating some cost increases from the calculation as well as excluding COP payments. With the allowable adjustments and the addition of a portion of GCTD s modest reserve of local deferred revenue from a prior year, the farebox recovery ratio in GCTD s FY budget is 20% for fixed route and 14.6% for paratransit. Table 6 shows for the past five years, as well as for the current year and the budgeted year, (1) the unlinked passenger trips, fare revenue and FBRR for fixed route service, (2) the one-way trips, fare revenue and FBRR for paratransit service and (3) the systemwide ratio of fare revenues to operating cost. Final June 7, 2017 Page 21
Review and Discuss Staff Presentation on Draft GCTD Operating Budget for FY
 May 3, 2017 Item #15 TO: FROM: SUBJECT: Board of Directors Steve L. Rosenberg Director of Finance and Administration Review and Discuss Staff Presentation on Draft GCTD Operating for FY 2017-18 I. EXECUTIVE
Gold Coast Transit District. Comprehensive Annual Financial Report For the Fiscal Year Ended June 30, 2015
 Comprehensive Annual Financial Report For the Fiscal Year Ended June 30, 2015 Board of Directors 2015 Paul Blatz, Chair Mayor Pro Tem, City of Ojai Alternate Director, Councilmember Betsy Clapp Bryan
BUDGET AND FINANCIAL PLAN FISCAL YEAR
 BUDGET AND FINANCIAL PLAN 2013-14 FISCAL YEAR Steven P. Brown General Manager Steve L. Rosenberg Director of Administrative Services June 5, 2013 Final June 5 2013 Page ii TABLE OF CONTENTS GUIDE TO THE
Comprehensive Annual Financial Report. For the Fiscal Years Ended June 30, 2016 and 2015
 Comprehensive Annual Financial Report For the Fiscal Years Ended June 30, 2016 and 2015 Oxnard, California Comprehensive Annual Financial Report For the Fiscal Years Ended June 30, 2016 and 2015 Board
MINUTES OF THE REGULAR BOARD OF DIRECTORS MEETING WEDNESDAY, OCTOBER 4, :00 A.M.
 Item #1 MINUTES OF THE REGULAR BOARD OF DIRECTORS MEETING WEDNESDAY, OCTOBER 4, 2017 10:00 A.M. Call to Order Chair Bryan MacDonald called the regular meeting of the Board of Directors of Gold Coast Transit
Comprehensive Annual Financial Report. FISCAL YEARS ENDING JUNE 30, 2017 and 2016
 Comprehensive Annual Financial Report FISCAL YEARS ENDING JUNE 30, 2017 and 2016 Board of Directors November 2017 Bryan MacDonald, Chair Councilman, City of Oxnard Alternate Director, Mayor Pro Tem Carmen
MINUTES OF THE REGULAR BOARD OF DIRECTORS MEETING WEDNESDAY, MAY 3, :00 A.M.
 Item #1 MINUTES OF THE REGULAR BOARD OF DIRECTORS MEETING WEDNESDAY, MAY 3, 2017 10:00 A.M. Call to Order Chair Bryan MacDonald called the regular meeting of the Board of Directors of Gold Coast Transit
MINUTES OF THE REGULAR BOARD OF DIRECTORS MEETING WEDNESDAY, APRIL 4, :00 AM
 Item #1 MINUTES OF THE REGULAR BOARD OF DIRECTORS MEETING WEDNESDAY, APRIL 4, 2018 10:00 AM Call to Order Chair Zaragoza called the regular meeting of the Board of Directors of Gold Coast Transit District
Comprehensive Annual Financial Report. For the Fiscal Year Ending June 30, 2016 and 2015
 Comprehensive Annual Financial Report For the Fiscal Year Ending June 30, 2016 and 2015 Board of Directors June 30, 2016 Douglas A. Breeze, Chair Mayor, City of Port Hueneme Alternate Director, Councilmember
FIVE-YEAR BASELINE SERVICE PLAN & FINANCIAL FORECAST
 CHAPTER 7 FIVE-YEAR BASELINE SERVICE PLAN & FINANCIAL FORECAST This plan is financially constrained based on a status quo service level for the following elements over the five year planning period of
CITY OF SIMI VALLEY MEMORANDUM
 CITY OF SIMI VALLEY MEMORANDUM AGENDA ITEM NO. Consent (7) September 26, 216 TO: FROM: City Council Department of Community Services SUBJECT: ADOPTION OF A RESOLUTION AUTHORIZING THE CITY MANAGER TO EXECUTE
Receive and File FY TDA Compliance Audit Reports for GCTD and Each of its Five (5) Members, as Prepared by The Pun Group
 Members, as Prepared by The Pun Group") December 7, 2016 Item #10 TO: Gold Coast Transit District Board of Directors From: Steve L. Rosenberg Director of Finance and Administration RE: Receive and File FY 2015-16 TDA Compliance Audit Reports
December 7, 2016 Item #10 TO: Gold Coast Transit District Board of Directors From: Steve L. Rosenberg Director of Finance and Administration RE: Receive and File FY 2015-16 TDA Compliance Audit Reports
Birmingham-Jefferson County Transit Authority P.O. Box Birmingham, AL Phone: (205) Fax: (205)
 Fax: (205)") Birmingham-Jefferson County Transit Authority P.O. Box 10212 Birmingham, AL 35202-0212 Phone: (205) 521-0161 - Fax: (205) 521-0154 Program of Projects For Federal Fiscal Year 2018 (Utilizing FFY 2017 Apportionments)
Birmingham-Jefferson County Transit Authority P.O. Box 10212 Birmingham, AL 35202-0212 Phone: (205) 521-0161 - Fax: (205) 521-0154 Program of Projects For Federal Fiscal Year 2018 (Utilizing FFY 2017 Apportionments)
VALLEY METRO RPTA FY18 Budget EXECUTIVE SUMMARY
 VALLEY METRO RPTA FY18 Budget EXECUTIVE SUMMARY FY18 ADOPTED ANNUAL OPERATING AND CAPITAL BUDGET Valley Metro Regional Public Transportation Authority (RPTA) provides public transportation services for
PINELLAS SUNCOAST TRANSIT AUTHORITY KEY BUDGET ASSUMPTIONS FOR FISCAL YEAR 2016
 PINELLAS SUNCOAST TRANSIT AUTHORITY KEY BUDGET ASSUMPTIONS FOR FISCAL YEAR 2016 PSTA Budget Forecasting Summary Item Assumption Amount Source 3 Yr. Avg. FY2016 FY2017 FY2018 FY2019 FY2020 Revenues FY15
Solano County Transit
 AGENDA ITEM 13 - REVISED BOARD MEETING DATE: APRIL 18, 2013 Solano County Transit TO: BOARD OF DIRECTORS PRESENTER: KRISTINA BOTSFORD, BUDGET & ACCOUNTING MANAGER MONA BABAUTA, EXECUTIVE DIRECTOR SUBJECT:
Federal Transit Funding Crisis: A Message to Congress Presented by Alex Clifford, CEO Santa Cruz Metropolitan Transit District (METRO) 2017
 2017") Federal Transit Funding Crisis: A Message to Congress Presented by Alex Clifford, CEO Santa Cruz Metropolitan Transit District (METRO) 2017 HOW CAN CONGRESS HELP? Santa Cruz Metropolitan Transit District
Federal Transit Funding Crisis: A Message to Congress Presented by Alex Clifford, CEO Santa Cruz Metropolitan Transit District (METRO) 2017 HOW CAN CONGRESS HELP? Santa Cruz Metropolitan Transit District
COOPERATIVE AGREEMENT FY 2004/05 VENTURA INTERCITY SERVICE TRANSIT AUTHORITY (VISTA) CONEJO CONNECTION
 CONEJO CONNECTION") COOPERATIVE AGREEMENT FY 2004/05 VENTURA INTERCITY SERVICE TRANSIT AUTHORITY (VISTA) CONEJO CONNECTION This Agreement is made and entered into by the City of Calabasas (Calabasas) and the Ventura County
COOPERATIVE AGREEMENT FY 2004/05 VENTURA INTERCITY SERVICE TRANSIT AUTHORITY (VISTA) CONEJO CONNECTION This Agreement is made and entered into by the City of Calabasas (Calabasas) and the Ventura County
May 31, 2016 Financial Report
 2016 May 31, 2016 Financial Report Capital Metropolitan Transportation Authority 7/13/2016 Table of Contents SUMMARY REPORTS Budgetary Performance - Revenue 2 - Sales Tax Revenue 6 - Operating Expenses
EASTERN SIERRA TRANSIT AUTHORITY ANNUAL FINANCIAL REPORT WITH INDEPENDENT AUDITOR S THEREON. June 30, 2016
 EASTERN SIERRA TRANSIT AUTHORITY ANNUAL FINANCIAL REPORT WITH INDEPENDENT AUDITOR S THEREON June 30, 2016 Annual Financial Report For the Year Ended June 30, 2016 TABLE OF CONTENTS FINANCIAL SECTION Independent
South County Transit -Projected Fiscal Year 2016/2017 Budget -Projected Five Year Capital Budget
 South County Transit -Projected Fiscal Year 2016/2017 Budget -Projected Five Year Capital Budget Fiscal Year 2016/2017 Budget May 5, 2016 Vision Statement The SCT of the future will help meet residents
2016 Budget. Lakewood, Washington
 2016 Budget Lakewood, Washington Mission Statement Pierce Transit improves people s quality of life by providing safe, reliable, innovative and useful transportation services that are locally based and
CHICAGO TRANSIT AUTHORITY. FINANCIAL STATEMENTS AND SUPPLEMENTARY INFORMATION December 31, 2011 and 2010 (With Independent Auditors Report Thereon)
") FINANCIAL STATEMENTS AND SUPPLEMENTARY INFORMATION (With Independent Auditors Report Thereon) Chicago, Illinois FINANCIAL STATEMENTS CONTENTS Independent Auditors Report... 1 Management s Discussion and
FINANCIAL STATEMENTS AND SUPPLEMENTARY INFORMATION (With Independent Auditors Report Thereon) Chicago, Illinois FINANCIAL STATEMENTS CONTENTS Independent Auditors Report... 1 Management s Discussion and
Chapter 8. Financial Plan
 Chapter 8. Financial Plan This chapter presents a capital and operating plan for YCTD during the SRTP period of 2006/7 to 2012/13. Financial Plan Scenarios This financial plan presents a base scenario
Transportation Development Act. Local Transportation Fund CLAIM MANUAL FY 2017/18
 Transportation Development Act Local Transportation Fund CLAIM MANUAL FY 2017/18 Contents Chapter 1. Overview of the Transportation Development Act... 1-1 Local Transportation Fund (LTF)... 1-2 Where Does
Federal Assistance 13% Charges for Services 5% Appropriated Fund Balance.5% Other 3% Administration 6% Building Maintenance 3% Other 2%
 TRANSIT FUND The Transit Fund is used to account for the operations of the Town s public transit system. Federal Assistance 13% Transit Revenues State Assistance 12% Charges for Services 5% Appropriated
2019 MANAGEMENT & FINANCIAL PLAN
 INDIANAPOLIS PUBLIC TRANSPORTATION CORPORATION 2019 MANAGEMENT & FINANCIAL PLAN FISCAL YEAR JANUARY 1, 2019 THROUGH DECEMBER 31, 2019 INTRODUCED TO INDYGO BOARD: JULY 30, 2018 IndyGo Year 2019 INDIANAPOLIS
8. FINANCIAL ANALYSIS
 8. FINANCIAL ANALYSIS This chapter presents the financial analysis conducted for the Locally Preferred Alternative (LPA) selected by the Metropolitan Transit Authority of Harris County (METRO) for the.
FY17 FY16 Valley Metro RPTA Sources of Funds FY17 vs FY16
 FY17 ADOPTED ANNUAL OPERATING AND CAPITAL BUDGET Valley Metro Regional Public Transportation Authority (RPTA) provides public transportation services for Maricopa County located in the metro Phoenix, Arizona.
Governor s FY 2016 Revised, FY 2017 and Capital Budget Recommendations House Finance Committee April 13, 2016
 Governor s FY 2016 Revised, FY 2017 and Capital Budget Recommendations House Finance Committee April 13, 2016 Quasi-public agency Established in 1964 Responsible: Fixed route bus service and Americans
TABLE OF CONTENTS. Page. Page
 TABLE OF CONTENTS Page Overview Board of Directors... Overview-1 TriMet Officials... Overview-1 Budget Message... Overview-2 2017-2018 TriMet Organization Chart... Overview-10 Financial Summary General
CHAPTER 9 FINANCIAL CONSIDERATIONS
 CHAPTER 9 FINANCIAL CONSIDERATIONS 9.1 INTRODUCTION This chapter presents anticipated costs, revenues, and funding for the Berryessa Extension Project (BEP) Alternative and the Silicon Valley Rapid Transit
To: Board of Directors Date: December 21, 2017
 To: Board of Directors Date: December 21, 2017 From: Erick Cheung, Director of Finance Reviewed by: SUBJECT: FY 2017 Financial Audit Summary of Issues: The audit for FY 2017 has been completed and enclosed
August 31, 2016 Financial Report
 August 31, 2016 Financial Report Capital Metropolitan Transportation Authority 10/14/2016 Table of Contents SUMMARY REPORTS Budgetary Performance - Revenue 2 - Sales Tax Revenue 6 - Operating Expenses
New York City Transit
 New York City Transit MTA New York City Transit 2008 Preliminary Budget July Financial Plan 2008 2011 MISSION STATEMENT The mission of MTA New York City Transit is to provide customers with safe, reliable
FORT WORTH TRANSPORTATION AUTHORITY
 FINANCIAL REPORT SEPTEMBER 30, 2010 C O N T E N T S INDEPENDENT AUDITOR'S REPORT... 1 MANAGEMENT'S DISCUSSION AND ANALYSIS... 3 Page BASIC FINANCIAL STATEMENTS Statements of Net Assets... 8 Statements
CHAPTER 9 FINANCIAL CONSIDERATIONS
 CHAPTER 9 FINANCIAL CONSIDERATIONS 9.1 INTRODUCTION This chapter presents anticipated costs, revenues, and funding for the BEP and the SVRTP. A summary evaluation of VTA s financial plan for the proposed
Whatcom Transportation Authority
 Whatcom Transportation Authority Annual Budget 12/14/2017 This Page Intentionally Left Blank Whatcom Transportation Authority (WTA) Annual Budget Table of Contents General Manager s Budget Message... 2
Total Operating Activities for FY17 are $56.9 million, an increase of $5.1M or 9.8% from FY16.
 FY17 ADOPTED ANNUAL OPERATING AND CAPITAL BUDGET Valley Metro Rail, Inc. (VMR) is a public non-profit corporation whose members are the cities of Chandler, Glendale, Mesa, Phoenix, and Tempe. VMR plans,
8.0 FINANCIAL ANALYSIS
 Chapter 8 Financial Analysis 8.0 FINANCIAL ANALYSIS This chapter presents a summary of the financial analysis for the Central Corridor Light Rail Transit (LRT) Project, a description of the Project Sponsor
AGENDA CITIZEN S TRANSPORTATION ADVISORY COMMITTEE/ SOCIAL SERVICES TRANSPORTATION ADVISORY COUNCIL (CTAC/SSTAC)
") AGENDA CITIZEN S TRANSPORTATION ADVISORY COMMITTEE/ SOCIAL SERVICES TRANSPORTATION ADVISORY COUNCIL (CTAC/SSTAC) TUESDAY, OCTOBER 16, 2018 -- 1:30 PM 3:30 PM County Government Center Hall of Administration
AGENDA CITIZEN S TRANSPORTATION ADVISORY COMMITTEE/ SOCIAL SERVICES TRANSPORTATION ADVISORY COUNCIL (CTAC/SSTAC) TUESDAY, OCTOBER 16, 2018 -- 1:30 PM 3:30 PM County Government Center Hall of Administration
April 30, 2016 Financial Report
 2016 April 30, 2016 Financial Report Capital Metropolitan Transportation Authority 6/15/2016 Table of Contents SUMMARY REPORT Budgetary Performance - Revenue 2 - Sales Tax Revenue 6 - Operating Expenses
POLICY AND PROCEDURES MANUAL
 NUMBER EFF. DATE POLICY AND PROCEDURES MANUAL RESPONSIBLE DEPARTMENT Finance/Service Planning TITLE Fare Policy (DRAFT as of 11-13-13) APPLIES TO Development of Fare Structure, General Public SUPERSEDED
Chapter 9 Financial Considerations. 9.1 Introduction
 9.1 Introduction Chapter 9 This chapter presents anticipated costs, revenues, and funding for the NEPA BART Extension Alternative. A summary of VTA s financial plan for the BART Extension Alternative is
TRANSPORTATION DEVELOPMENT ACT Guidelines
 TRANSPORTATION DEVELOPMENT ACT Guidelines Amended March 2016 Transportation Agency for Monterey County 55-B Plaza Circle Salinas, CA 93901-2902 1 Table of Contents Overview of the Transportation Development
SAN MATEO COUNTY TRANSIT DISTRICT FY2019 PROPOSED OPERATING BUDGET FY19
 FY2019 OPERATING FORECAST SOURCES OF FUNDS: Operating Revenues 1 Passenger Fares 17,040,333 16,977,116 15,917,012 16,457,750 540,738 3.4% 1 2 Local TDA and STA Funds 41,352,423 42,013,473 42,013,473 47,485,688
Transit Subsidy. Mission Statement. Mandates
 Mission Statement The Potomac and Rappahannock Transportation Commission (PRTC) is a multi-jurisdictional agency representing Prince William, Stafford, and Spotsylvania Counties and the Cities of Manassas,
CHICAGO TRANSIT AUTHORITY. FINANCIAL STATEMENTS AND SUPPLEMENTARY INFORMATION December 31, 2010 and 2009 (With Independent Auditors Report Thereon)
") FINANCIAL STATEMENTS AND SUPPLEMENTARY INFORMATION (With Independent Auditors Report Thereon) Chicago, Illinois FINANCIAL STATEMENTS CONTENTS Independent Auditors Report... 1 Management s Discussion and
FINANCIAL STATEMENTS AND SUPPLEMENTARY INFORMATION (With Independent Auditors Report Thereon) Chicago, Illinois FINANCIAL STATEMENTS CONTENTS Independent Auditors Report... 1 Management s Discussion and
Transit Subsidy. Mission Statement. Mandates
 Mission Statement The Potomac and Rappahannock Transportation Commission (PRTC) is a multi-jurisdictional agency representing Prince William, Stafford, and Spotsylvania Counties and the Cities of Manassas,
Jefferson Transit Authority Annual Budget. November 1, 2016 PROPOSED
 Jefferson Transit Authority 2017 Annual Budget November 1, 2016 PROPOSED 1 Table of Contents General Manager s Message... 3 Jefferson Transit Authority Mission Statement... 4 Overall Economic Outlook...
Balancing the Transportation Needs of a Growing City
 Balancing the Transportation Needs of a Growing City FY 2019 and FY 2020 Operating Budget SFMTA Board Meeting Ed Reiskin, Director of Transportation March 20, 2018 1 Revises Baselines: FY 2019-2020 ($
CAPITAL TRANSIT MISSION STATEMENT FY13 PROPOSED BUDGET $6,707,900 PUBLIC WORKS DEPARTMENT CORE SERVICES FUNDING SOURCES FOR CAPITAL TRANSIT
 MISSION STATEMENT Capital Transit is a service program of the Public Works Department. The Public Works Department s mission is to ensure water and wastewater utilities, waste management, public transportation,
Item #4 FEBRUARY 10, 2015 MEETING MINUTES PG. 2 Approve the February 10, 2015 meeting minutes.
 AGENDA HERITAGE VALLEY TECHNICAL ADVISORY COMMITTEE (HVTAC) Thursday, March 19, 2015, 1:30 p.m. Santa Paula City Hall, Council Chambers 970 Ventura Street, Santa Paula, CA 93060 Item #1 Item #2 Item #3
Berks Area Regional Transportation Authority. Financial Statements and Supplementary Information. June 30, 2014 and 2013
 Financial Statements and Supplementary Information Table of Contents Page INDEPENDENT AUDITOR'S REPORT 1 to 3 MANAGEMENT'S DISCUSSION AND ANALYSIS 4 to 14 FINANCIAL STATEMENTS Statement of Net Position
Governor s FY 2017 Revised, FY 2018 and Capital Budget Recommendations House Finance Committee April 12, 2017
 Governor s FY 2017 Revised, FY 2018 and Capital Budget Recommendations House Finance Committee April 12, 2017 Quasi-public agency Established in 1964 Responsible: Fixed route bus service and Americans
Regional Transit Authority
 Regional Transit Authority Fiscal Year 2017/2018 Budget Projected Fiscal Year 2018/2019 Budget Projected Five Year Capital Budget May 3, 2017 SAN LUIS OBISPO REGIONAL TRANSIT AUTHORITY VISION STATEMENT,
INVESTING STRATEGICALLY
 11 INVESTING STRATEGICALLY Federal transportation legislation (Fixing America s Surface Transportation Act FAST Act) requires that the 2040 RTP be based on a financial plan that demonstrates how the program
CENTRAL CONTRA COSTA TRANSIT AUTHORITY CONCORD, CALIFORNIA BASIC FINANCIAL STATEMENTS WITH INDEPENDENT AUDITOR S REPORT JUNE 30, 2015
 CENTRAL CONTRA COSTA TRANSIT AUTHORITY CONCORD, CALIFORNIA BASIC FINANCIAL STATEMENTS WITH INDEPENDENT AUDITOR S REPORT JUNE 30, 2015 CENTRAL CONTRA COSTA TRANSIT AUTHORITY JUNE 30, 2015 TABLE OF CONTENTS
MEMORANDUM. Santa Clara Valley Transportation Authority Board of Directors. Michael T. Burns General Manager. DATE: August 4, 2008
 MEMORANDUM TO: FROM: Santa Clara Valley Transportation Authority Board of Directors Michael T. Burns General Manager DATE: August 4, 2008 SUBJECT: BART Operating Subsidy This memorandum summarizes and
CHAPTER 7: Financial Plan
 CHAPTER 7: Financial Plan Report Prepared by: Contents 7 FINANCIAL PLAN... 7-1 7.1 Introduction... 7-1 7.2 Assumptions... 7-1 7.2.1 Operating Revenue Assumptions... 7-2 7.2.2 Operating Cost Assumptions...
Financial Plan. Section 8 STATUS QUO PLAN STATUS QUO PLAN ASSUMPTIONS STATUS QUO PLAN BUDGET ITEMS
 Section 8 Financial Plan This final section of the TDP contains the financial information with regard to the improvements described in Section 7, Alternatives. The financial information is divided into
Whatcom Transportation Authority
 Financial Statements Audit Report Whatcom Transportation Authority Whatcom County For the period January 1, 2016 through December 31, 2017 Published April 30, 2018 Report No. 1021200 April 30, 2018 Office
ANNUAL OPERATING AND CAPITAL BUDGET FISCAL YEAR (SUMMARY) (as approved by the Board of Directors, July 16,2018)
 (as approved by the Board of Directors, July 16,2018)") ANNUAL OPERATING AND CAPITAL BUDGET FISCAL YEAR 2018 2019 (SUMMARY) (as approved by the Board of Directors, July 16,2018) FY 2019 Budget BUDGET NOTES & ASSUMPTIONS : Listed below are some notes and assumptions
ANNUAL OPERATING AND CAPITAL BUDGET FISCAL YEAR 2018 2019 (SUMMARY) (as approved by the Board of Directors, July 16,2018) FY 2019 Budget BUDGET NOTES & ASSUMPTIONS : Listed below are some notes and assumptions
Whatcom Transportation Authority
 Whatcom Transportation Authority Annual Budget 2011 Table of Contents Executive Memorandum... 1 WTA Mission... 2 WTA Vision Destination 2020... 3 Key Objectives... 4 Budget Initiatives... 5 Budget Assumptions...
Item #4 JANUARY 30, 2015 MEETING MINUTES PG. 2 Approve the January 30, 2015 meeting minutes.
 AGENDA COASTAL EXPRESS POLICY ADVISORY COMMITTEE Wednesday, March 25, 2015, 11:00 a.m. Ventura City Hall, Second Floor Community Room 501 Poli Street, Ventura, CA 93002 Item #1 Item #2 Item #3 CALL TO
VICTOR VALLEY TRANSIT AUTHORITY (A JOINT POWERS AUTHORITY) BASIC FINANCIAL STATEMENTS WITH INDEPENDENT AUDITORS REPORT
 BASIC FINANCIAL STATEMENTS WITH INDEPENDENT AUDITORS REPORT") VICTOR VALLEY TRANSIT AUTHORITY BASIC FINANCIAL STATEMENTS WITH INDEPENDENT AUDITORS REPORT FOR THE FISCAL FOR THE FISCAL TABLE OF CONTENTS INDEPENDENT AUDITORS REPORT... 1 MANAGEMENT S DISCUSSION AND
VICTOR VALLEY TRANSIT AUTHORITY BASIC FINANCIAL STATEMENTS WITH INDEPENDENT AUDITORS REPORT FOR THE FISCAL FOR THE FISCAL TABLE OF CONTENTS INDEPENDENT AUDITORS REPORT... 1 MANAGEMENT S DISCUSSION AND
Victor Valley Transit Authority
 ANNUAL OPERATING AND CAPITAL BUDGET FISCAL YEAR 2014 2015 As approved by the Board of Directors June 16, 2014 ADA PARATRANSIT EXPENSES FY14 HRS HRS Incr/(Decr) % FY14 $ $ Incr/(Decr) % NOTES Purchased
Title VI Fare Equity Analysis
 Pioneer Valley Transit Authority Title VI Fare Equity Analysis Prepared by the Pioneer Valley Planning Commission April 12, 2012 PVTA TITLE VI FARE EQUITY ANALYSIS APRIL 12, 2012 1. CONFORMANCE WITH REGULATORY
Northern Virginia Transportation Commission: 2018 Legislative and Policy Agenda
 Northern Virginia Transportation Commission: 2018 Legislative and Policy Agenda Northern Virginia s economic growth and global competitiveness are directly tied to the region s transit network. Transit
TABLE OF CONTENTS. Page. Page
 TABLE OF CONTENTS Page Overview Board of Directors... Overview-1 TriMet Officials... Overview-1 Budget Message... Overview-2 2016-2017 TriMet Organization Chart... Overview-9 Financial Summary General
GREATER DAYTON REGIONAL TRANSIT AUTHORITY MONTGOMERY COUNTY DECEMBER 31, 2016 TABLE OF CONTENTS. Independent Auditor s Report... 1
 GREATER DAYTON REGIONAL TRANSIT AUTHORITY MONTGOMERY COUNTY DECEMBER 31, 2016 TABLE OF CONTENTS TITLE PAGE Independent Auditor s Report... 1 Prepared by Management: Management s Discussion and Analysis...
Board of Directors. John J. Case, Chairman. Terrance M. Carr, Director West Central Suburban Cook County
 Final Program November 2003 Board of Directors John J. Case, Chairman Terrance M. Carr, Director West Central Suburban Cook County James C. Harris, Director South Suburban Cook County Richard A. Kwasneski,
CITY OF SANTA MONICA, CALIFORNIA
 Financial Statements and Required and Other Supplementary Information (with Independent Auditor s Reports Thereon) Table of Contents Independent Auditor s Report... 1 Management s Discussion and Analysis
FY2020 Budget Outlook
 Finance and Capital Committee Information Item IV-A October 11, 2018 FY2020 Budget Outlook 35 of 60 Washington Metropolitan Area Transit Authority Board Action/Information Summary Action Information MEAD
2004 Operating and Capital Program Financial Plan for Operations, and Capital Plan
 PAST AND FUTURE RESPONSIBLE PUBLIC SERVICE 2004 Operating and Capital Program 2004 2006 2006 Financial Plan for Operations, and 2004 2008 2008 Capital Plan A Fresh Approach To Public Transportation Final
APPENDIX I REVENUE PROJECTION AND ASSUMPTIONS
 APPENDIX I REVENUE PROJECTION AND ASSUMPTIONS The 2018 StanCOG Regional Transportation Plan/Sustainable Communities Strategy (RTP/SCS) financial forecasts provide revenue projections for StanCOG member
Financial Analysis Working Paper 1 Existing Funding Sources Draft: April 2007
 Financial Analysis Working Paper 1 Existing Funding Sources Draft: April 2007 Prepared for: By: TABLE OF CONTENTS INTRODUCTION... 1 REVIEW OF FRED AND VRE EXISTING FUNDING SOURCES... 1 Federal Funding...
TAXICAB INDUSTRY REPORT
 DRAFT TAXICAB INDUSTRY REPORT RATES OF FARE & GATE FEES City and County of San Francisco Office of the Controller December 2005 TABLE OF CONTENTS I - EXECUTIVE SUMMARY...2 Key Industry Findings Summary...
RIVERSIDE TRANSIT AGENCY 1825 Third Street Riverside, CA November 17, 2005
 RIVERSIDE TRANSIT AGENCY 1825 Third Street Riverside, CA 92507 November 17, 2005 TO: THRU: FROM: SUBJECT: Summary: BOARD OF DIRECTORS Larry Rubio, Chief Executive Officer Chris Gallanes, Chief Financial
MTA 2010 Preliminary Budget
 MTA 2010 Preliminary Budget July Financial Plan 2010 2013 DJC Volume 1 July 2009 Metropolitan Transportation Authority MTA 2010 PRELIMINARY BUDGET JULY FINANCIAL PLAN 2010-2013 VOLUME 1 The MTA s July
INVESTMENT STRATEGIES
 3 INVESTMENT STRATEGIES 70 INVESTMENT STRATEGIES 71 A key role of Mobilizing Tomorrow is to outline a strategy for how the region will invest in transportation infrastructure over the next 35 years. This
Victor Valley Transit Authority
 ANNUAL OPERATING AND CAPITAL BUDGET FISCAL YEAR 2017 2018 (As approved by the Board of Directors) June 19, 2017 FY 2018 Budget BUDGET NOTES & ASSUMPTIONS Line no. Department Note/Assumption 1 ADA, Fxd
Jefferson Transit Authority Annual Budget. November 14, 2017 PROPOSED
 Jefferson Transit Authority 218 Annual Budget November 14, 217 PROPOSED 1 Table of Contents General Manager s Message... 3 Jefferson Transit Authority Mission Statement... 4 Overall Economic Outlook...
Transit Subsidy. Mission Statement. Mandates
 Mission Statement The Potomac and Rappahannock Transportation Commission (PRTC) is a multi-jurisdictional agency representing Prince William, Stafford, and Spotsylvania Counties and the Cities of Manassas,
Santa Cruz METRO Board of Directors September 12, 2014 Alex Clifford, CEO
 Santa Cruz METRO Board of Directors September 12, 2014 Alex Clifford, CEO Overview of Today s Presentation Recap Slides from August 8, 2014 BOD Meeting Definition of a Structural Deficit Estimated Sales
FINANCE/AUDIT COMMITTEE AGENDA October 25, :00 a.m. 12:00 a.m. Wellness Center SunLine Transit Agency Thousand Palms, CA
 FINANCE/AUDIT COMMITTEE AGENDA October 25, 2017 11:00 a.m. 12:00 a.m. Wellness Center SunLine Transit Agency Thousand Palms, CA Public Comments will be accepted on each Agenda item upon the conclusion
A. LOCAL TRANSPORTATION FUND (LTF)
") A. LOCAL TRANSPORTATION FUND (LTF) Table 3, below, shows the order in which LTF moneys are allocated. Following the table, we describe what services and/or equipment is eligible for funding under each
A. LOCAL TRANSPORTATION FUND (LTF) Table 3, below, shows the order in which LTF moneys are allocated. Following the table, we describe what services and/or equipment is eligible for funding under each
Jefferson County Public Transportation Benefit Area (Jefferson Transit Authority)
") Financial Statements and Federal Single Audit Report Jefferson County Public Transportation Benefit Area (Jefferson Transit Authority) For the period January 1, 2015 through December 31, 2015 Published
Financial Statements and Federal Single Audit Report Jefferson County Public Transportation Benefit Area (Jefferson Transit Authority) For the period January 1, 2015 through December 31, 2015 Published
MTA Long Island Rail Road
 MTA Long Island Rail Road Budget July Financial Plan -2008 MISSION STATEMENT The mission of the MTA Long Island Rail Road is to provide a safe, accessible, clean, cost-effective, customer-focused rail
Impact of the Living Wage on Paratransit Services
 Impact of the Living Wage on Paratransit Services January 25, 2008 Report No. 08-06 Office of the County Auditor Evan A. Lukic, CPA County Auditor Table of Contents Topic Page Executive Summary... 3 Purpose
Financial Snapshot October 2014
 Financial Snapshot October 2014 Financial Snapshot About the Financial Snapshot The Financial Snapshot provides answers to frequently asked questions regarding MoDOT s finances. This document provides
CENTRAL CONTRA COSTA TRANSIT AUTHORITY CONCORD, CALIFORNIA BASIC FINANCIAL STATEMENTS WITH INDEPENDENT AUDITOR S REPORT JUNE 30, 2016
 CENTRAL CONTRA COSTA TRANSIT AUTHORITY CONCORD, CALIFORNIA BASIC FINANCIAL STATEMENTS WITH INDEPENDENT AUDITOR S REPORT JUNE 30, 2016 CENTRAL CONTRA COSTA TRANSIT AUTHORITY JUNE 30, 2016 TABLE OF CONTENTS
METROPOLITAN TRANSIT AUTHORITY NASHVILLE, TENNESSEE AUDITED FINANCIAL STATEMENTS AND OTHER FINANCIAL INFORMATION JUNE 30, 2017 AND 2016
 NASHVILLE, TENNESSEE AUDITED FINANCIAL STATEMENTS AND OTHER FINANCIAL INFORMATION JUNE 30, 2017 AND 2016 Table of Contents Page INTRODUCTION... 1-2 INDEPENDENT AUDITOR S REPORT... 3-5 MANAGEMENT S DISCUSSION
Chapel Hill Transit Strategic and Financial Sustainability Plan Update
 Chapel Hill Transit Strategic and Financial Sustainability Plan Update ACT January 21, 2015 Today s Agenda Overview of Chapel Hill Transit Performance Overview Funding Overview Key Challenges Overview
To: Board of Directors Date: December 7, 2015
 To: Board of Directors Date: December 7, 2015 From: Kathy Casenave, Director of Finance Reviewed by: SUBJECT: FY 2015 Financial Audit Summary of Issues: The audit for FY 2015 has been completed and enclosed
Victor Valley Transit Authority
 ANNUAL OPERATING AND CAPITAL BUDGET FISCAL YEAR 2016 2017 (As approved by the Board of Directors) June 20, 2016 VICTOR VALLEY TRANSIT AUTHORITY FY 2017 BUDGET OPERATING EXPENSE SUMMARY System FY 2016/17
Public Transportation
 Municipal Manager Marketing & Customer Service Program Planning Transit Planning Para Transit Services Transit Operations & Maintenance Transit Operations Vehicle Maintenance Non-Vehicle Maintenance PT
Valley Metro Fiscal Year 2014 Financial Results. Budget and Finance Subcommittee October 9, 2014
 Valley Metro Fiscal Year 2014 Financial Results Budget and Finance Subcommittee October 9, 2014 Regional Fixed Route Bus Ridership 3-Year Comparison Regional Fixed Route Bus Average Daily Ridership Light
VALLEY METRO RAIL FY18 Budget EXECUTIVE SUMMARY
 VALLEY METRO RAIL FY18 Budget EXECUTIVE SUMMARY FY18 ADOPTED ANNUAL OPERATING AND CAPITAL BUDGET Valley Metro Rail, Inc. (VMR) is a public non-profit corporation whose members are the cities of Chandler,
Executive Summary - Fiscal Year 2016 Valley Metro Rail Preliminary Annual Operating and Capital Budget
 Executive Summary - Fiscal Year 2016 Valley Metro Rail Preliminary Annual Operating and Capital Budget Valley Metro Rail, Inc. (VMR) is a public non-profit corporation whose members are the cities of Chandler,