Comprehensive Annual Financial Report. For the Fiscal Years Ended June 30, 2016 and 2015
|
|
|
- Sophia Goodwin
- 6 years ago
- Views:
Transcription


1 Comprehensive Annual Financial Report For the Fiscal Years Ended June 30, 2016 and 2015
2
3 Oxnard, California Comprehensive Annual Financial Report For the Fiscal Years Ended June 30, 2016 and 2015
4


5 Board of Directors June 30, 2016 Douglas A. Breeze, Chair Mayor, City of Port Hueneme Alternate Director, Councilmember Sylvia Munoz Schnopp Bryan A. MacDonald, Vice-Chair Councilman, City of Oxnard Alternate Director, Mayor Pro Tem Carmen Ramirez, Esq. Paul Blatz, Director Mayor, City of Ojai Alternate Director, Councilmember Betsy Clapp Carl E. Morehouse, Director Councilmember, City of Ventura Alternate Director, Councilmember James L. Monahan John C. Zaragoza, Director Supervisor, 5 th District, County of Ventura
6 This page intentionally left blank
7 Comprehensive Annual Financial Report For the Fiscal Years Ended June 30, 2016 and 2015
8 This page intentionally left blank
9 Comprehensive Annual Financial Report For the Fiscal Years Ended June 30, 2016 and 2015 Table of Contents Board of Directors June 30, 2016 Page Table of Contents... i INTRODUCTORY SECTION (Unaudited) Letter of Transmittal General Manager... v Letter of Transmittal Director of Finance and Administration... vii Organizational Information... ix Organizational Chart... xi Bus System Map... xii FINANCIAL SECTION Independent Auditors' Report on the Financial Statements... 1 Report on Internal Control over Financial Reporting and on Compliance and Other Matters Based on an Audit of Financial Statements Performed in Accordance with Government Auditing Standards... 5 Management s Discussion and Analysis Required Supplementary Information (Unaudited)... 7 Basic Financial Statements: Statements of Net Position Statements of Revenues, Expenses and Changes in Net Position Statements of Cash Flows Statements of Fiduciary Net Position Statements of Changes in Fiduciary Net Position Notes to the Basic Financial Statements Required Supplementary Information (Unaudited): Schedule of Changes in Net Pension Liability and Related Ratios Schedule of Contributions Pension Plan Schedule of Funding Progress Other Post-Employment Benefits Plan Supplementary Information: Schedule of Changes in Local Transportation Funding Activity of the District STATISTICAL SECTION (Unaudited) Financial Ratios Revenues and Expenses Ten Year Comparison Operational Statistics: Passenger Cost By Mode Ten Year Comparison Service Cost By Mode Ten Year Comparison Ridership and Service Ten Year Comparison i
10 This page intentionally left blank ii
11 INTRODUCTORY SECTION iii
12 This page intentionally left blank iv
13 December 31, 2016 The Board of Directors Gold Coast Transit District Oxnard, California Members of the Board: It continues to be my pleasure to serve as Gold Coast Transit s General Manager. In FY , Gold Coast Transit District delivered over 3.8 million passenger trips and operated 2.6 million miles of revenue service in western Ventura County. In addition, our ACCESS paratransit service provided over 93,000 trips to seniors and people with disabilities, a 10% increase over the previous year. Over the past year we have continued to focus on providing high quality bus service to the community, all the while continuing to prepare for the future. Key developments at GCTD during the FY include: Received eight new Gillig buses complete with the new GO branding, and made significant progress toward rebranding the entire fleet. Board Approval of the Short Range Transit Plan, which guides service improvements over the next five years. Implementation of a new demonstration service from east Ventura/Wells Center to north Oxnard/St. John s Hospital began. While new routes typically take about 3 years to fully mature, we are seeing steady increases each month. Completion of the Customer Service Center Remodel. The improvements made as part of this project included security measures as well as necessary ADA improvements. A successful triennial review was conducted and GCTD did very well, receiving a very limited number of findings that were well below the national average. Title VI Civil Rights Program Update was approved and later accepted by the FTA. Improved on-time performance on both fixed-route and access paratransit services. Continued to make progress on the new facility project, including finalizing the prequalification list for potential contractors. Applied for and received funds through the Low Carbon Transportation Operations Program (LCTOP) for ticket vending machines. Increased our IT efficiency by implementing a virtualized server and storage environment.
14 Initiated an annual Wellness Fair to help foster a more healthy work force In the next year, staff will continue working on projects including updating bus stop signage upgrades, installing Automatic Voice Annunciators, conducting preliminary planning for the new Route 23 identified in the SRTP and applying for grant funding. We will also be expanding our work with the cities to identify areas for bus stop improvement and increased coordination for transit friendly development. As we prepare to break ground on our agency s most critically important project, the new Administration, Operations and Maintenance facility, we will be working at all levels of the organization to prepare for the move. Led by our Director of Engineering and Construction, staff will be working on a comprehensive review of our organizational procedures to ensure we meet the challenges and opportunities that the new facility will provide. The Gold Coast Transit District team is very proud of its accomplishments to date and we remain committed to upholding the organization s mission: to provide safe, responsive, convenient, efficient, and environmentally responsible public transportation that serves the diverse needs of our community. Sincerely, vi
 covering the fiscal years ended June 30, 2016 and 2015.")
15 December 31, 2016 Board of Directors Gold Coast Transit District 301 E. Third St. Oxnard, California Members of the Board: This is Gold Coast Transit District s Comprehensive Annual Financial Report (CAFR) covering the fiscal years ended June 30, 2016 and This completes the District s second year as the successor agency to the GCT Joint Powers Authority. The CAFR has been prepared by the Office of the Director of Finance and Administration, working with our independent auditors, The Pun Group, LLP, in conformance with the principles and standards for financial reporting set forth by the Governmental Accounting Standards Board (GASB). As this completes the second year incorporating the District s net pension liability into the financial statements as required by GASB 68 and 71, the District is able to resume providing relevant year-to-year comparisons in the financial section of this document. This Office is responsible for both the accuracy of the presented data and the completeness and fairness of the presentation, including all disclosures. We believe that the data, as presented, is accurate in all material respects and presented in a manner designed to fairly set forth the financial position and results of operations of the District as of June 30, 2016 and All disclosures necessary to enable the reader to gain the maximum understanding of the District s financial affairs have been included. The CAFR represents the culmination of all budgeting, financial and accounting activities engaged in by the District during the fiscal year. The CAFR is organized into three sections: 1. The Introductory Section is intended to familiarize the reader with the organizational structure of the District and the nature and scope of the provided services. 2. The Financial Section includes a Management s Discussion and Analysis narrative to introduce the financial statements and analyze the financial activities during the fiscal year. This section also includes the Independent Auditor s Report, audited financial statements, disclosure notes, supplementary budget information, supporting statements and schedules necessary to fairly present the financial position and the results of the operations of the District in conformity with generally accepted accounting principles. 3. The Statistical Section contains comparative statistical data on the District s financial, physical, economic and social characteristics.

16 The preparation of this Comprehensive Annual Financial Report required the cooperation of the District management, staff and our independent auditors, The Pun Group, LLP, led by the audit engagement partner, Paul J. Kaymark, CPA. I wish to express my thanks and appreciation to the GCTD Accounting and Finance staff; Finance Analyst Daniel Amaro, Administrative Specialist Gerry Sta. Ana, Payroll Specialist Sonia Rosales, and especially Accounting Manager Lili Marlene T. Tomen. Ms. Tomen s hard work and expertise is most responsible for the Accounting Department s continued success as the growth and evolution of GCTD as a District has made the administration function larger and more complex. This skilled and dedicated group continues to work diligently to keep the agency compliant and moving forward. viii
17 About Gold Coast Transit District - Organizational Information About Us Gold Coast Transit District (District) provides public fixed-route and paratransit service in the cities of Ojai, Oxnard, Port Hueneme, Ventura and the unincorporated areas of Ventura County. With nearly 4 million passenger trips provided each year, the District is the largest public transportation operator in Ventura County. The fleet includes 56 buses and 24 paratransit vehicles all powered by clean natural gas supplied by an on-site CNG fueling station. Our Mission The District's mission is to provide safe, responsive, convenient, efficient, and environmentally responsible public transportation that serves the diverse needs of our community. History The District was founded in 1973 as the "South Coast Area Transit" when the cities of Ojai, Oxnard, Port Hueneme and San Buenaventura executed a Joint Powers Agreement that created "SCAT" to develop and operate local and intercity public transportation in western Ventura County. Prior to 1973, Ventura Transit City Lines operated local service in Ventura and Ojai, and Oxnard Municipal Bus Lines served Oxnard and Port Hueneme. Following a national trend, the bus systems that flourished through the mid-century began to decline in the 1960's. The outlook for public transit systems in California brightened in 1971 when the State Legislature created a source of dedicated transportation funding through passage of the Transportation Development Act (TDA). The availability of TDA funds to local governments provided an impetus for forming a single regional transit entity to operate coordinated transit services across municipal boundaries and in some unincorporated areas of western Ventura County. The County of Ventura joined SCAT in October of By February of 1980 the transit functions in western Ventura County were consolidated into a single administrative, operating and maintenance facility on a three-acre site at 301 East Third Street in Downtown Oxnard. In the 1990's SCAT began operation of ACCESS, a regional paratransit service providing curb-to-curb transportation for people with disabilities and senior citizens. In June 2007, SCAT's Joint Powers Agreement was amended to rename the agency from South Coast Area Transit to Gold Coast Transit. The change in name was intended to help distinguish the agency from the 11 other agencies named SCAT around the nation and to better connect the service to the community it served. In October 2013, Governor Brown signed into law Assembly Bill AB 664, which formed the Gold Coast Transit District. The district legislation was initiated in response to Senate Bill SB 716, which required that all TDA funds in Ventura County be used solely for public transit purposes. Formation of a transit district allows the District s Board of Directors and staff to have greater flexibility in implementing service improvements by looking beyond jurisdictional borders in order to efficiently and effectively meet the public s transit needs. In 2014, the District was named Small Agency of the Year by the California Transit Association. In 2015, the District unveiled a new logo and bus paint scheme to coincide with the purchase of replacement buses. The new colors reflect the District s commitment to quality public transportation, and evokes the agency s vision of a more modern, clean and efficient future. ix
18 In FY the District plans to break ground on a New Administration and Operations Facility that will allow the District to continue to meet the growing transit needs of the community. Statistics Service Area: Ojai, Oxnard, Port Hueneme, Ventura & County of Ventura Population Served: 375,000 Average Weekday Passengers: (FY 15-16) 11,659 Fixed-Route Annual Passengers: (FY 15-16) 3.8 million Fixed-Route Annual Revenue Miles: (approx.) 2.1 million ACCESS Paratransit Annual Passengers: 93, fixed-route buses 24 - paratransit buses and vans Fuel Type: 100% Clean Natural Gas Board of Directors The District is governed by a Board of Directors. Each of the District s five member agencies appoints one elected official from its governing body to serve on the Board of Directors and a second to serve as an alternate member. The Board of Directors regular monthly meetings are held on the first Wednesday of each month at 10 a.m. GCTD's Leadership The District s General Manager is appointed by, and reports to, the Board of Directors. The General Manager is charged with carrying out the Board s policies and directives, and has full charge of the operation of the District s services, facilities, and administration of business affairs. The District's Management Team is comprised of: (Listed in alphabetical order by Department) General Manager - Steven P. Brown Director of Engineering and Construction - Reed Caldwell Director of Finance and Administration - Steve L. Rosenberg Director of Fleet and Facilities - Robert Lurie Director of Human Resources - Debbie Williams Director of Planning and Marketing - Vanessa Rauschenberger Director of Transit Operations - Andrew Mikkelson Employees The District has nearly 200 employees, the majority of whom operate or maintain buses. Service Employees International Union Local 721 represents all bus operators, most maintenance employees and five administrative staff members. GCTD contracts with MV Transportation for the operation of ACCESS Paratransit. x
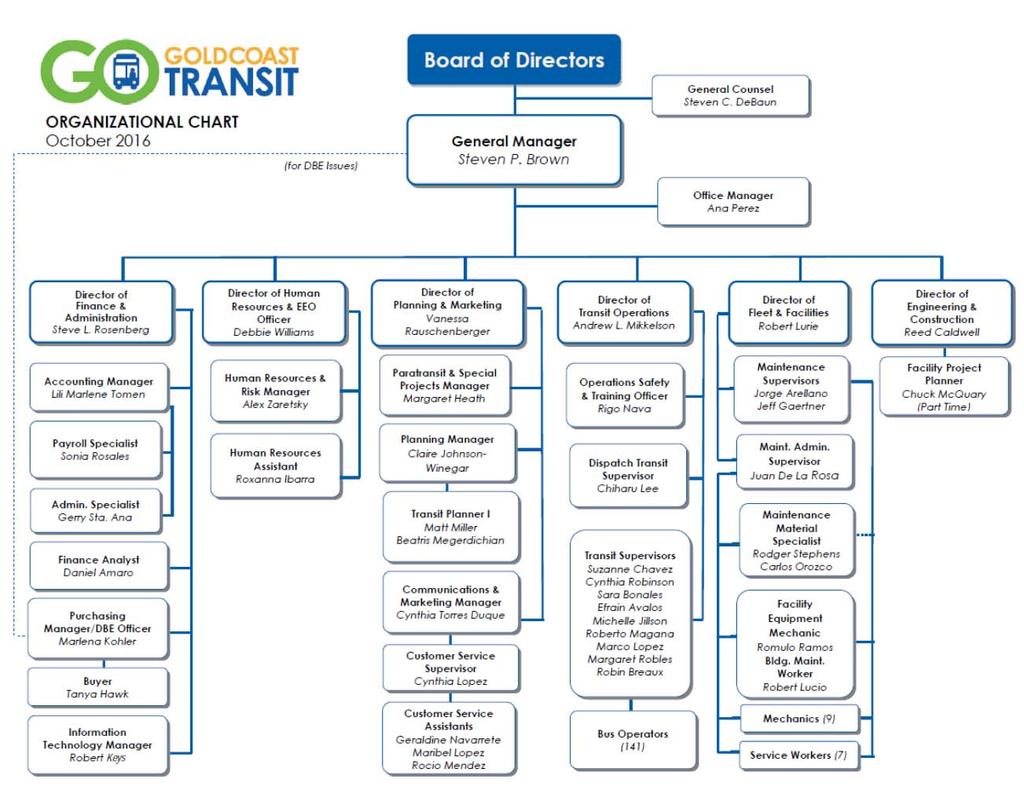
19 Organizational Chart xi

20 Bus System Map xii
21 FINANCIAL SECTION
22 This page intentionally left blank
23 To the Board of Directors of the Gold Coast Transit District Oxnard, California Report on the Financial Statements INDEPENDENT AUDITORS REPORT We have audited the accompanying financial statements of the business-type activities, each major fund and the aggregate remaining fund information of the Gold Coast Transit District (District), as of and for the years ended June 30, 2016 and 2015, and the related notes to the financial statements, which collectively comprise the District s basic financial statements as listed in the table of contents. Management s Responsibility for the Financial Statements Management is responsible for the preparation and fair presentation of these financial statements in accordance with accounting principles generally accepted in the United States of America; this includes the design, implementation, and maintenance of internal control relevant to the preparation and fair presentation of financial statements that are free from material misstatement, whether due to fraud or error. Auditor s Responsibility Our responsibility is to express opinions on these financial statements based on our audits. We conducted our audits in accordance with auditing standards generally accepted in the United States of America and the standards applicable to financial audits contained in Government Auditing Standards, issued by the Comptroller General of the United States. Those standards require that we plan and perform the audits to obtain reasonable assurance about whether the financial statements are free from material misstatement. An audit involves performing procedures to obtain audit evidence about the amounts and disclosures in the financial statements. The procedures selected depend on the auditor s judgment, including the assessment of the risks of material misstatement of the financial statements, whether due to fraud or error. In making those risk assessments, the auditor considers internal control relevant to the entity s preparation and fair presentation of the financial statements in order to design audit procedures that are appropriate in the circumstances, but not for the purpose of expressing an opinion on the effectiveness of the entity s internal control. Accordingly, we express no such opinion. An audit also includes evaluating the appropriateness of accounting policies used and the reasonableness of significant accounting estimates made by management, as well as evaluating the overall presentation of the financial statements. We believe that the audit evidence we have obtained is sufficient and appropriate to provide a basis for our audit opinions. Opinions In our opinion, the financial statements referred to above present fairly, in all material respects, the respective financial position of the business-type activities, each major fund and the aggregate remaining fund information of the District, as of June 30, 2016 and 2015, and the respective changes in financial position and, where applicable, cash flows thereof for the years then ended in accordance with accounting principles generally accepted in the United States of America. 200 East Sandpointe Avenue, Suite 600, Santa Ana, California Tel: Toll Free: Fax:
24 To the Board of Directors of the Gold Coast Transit District Oxnard, California Page 2 Emphasis of Matter Net Pension Liability The deficit unrestricted net position in the amount of $(7,585,661) and $(7,536,089) as of June 30, 2016 and 2015, respectively, resulted from the reporting of the net pension lability as discussed in Note 8. As of June 30, 2016 and 2015, the net pension liabilities are in the amounts of $8,385,297 and $7,776,333, respectively. Our opinion is not modified with respect to this matter. Other Matters Required Supplementary Information Accounting principles generally accepted in the United States of America require that the management s discussion and analysis on pages 7 through 20 and the Schedule of Changes in Net Pension Liability and Related Rations, the Schedule of Contributions Pension Plan and the Schedule of Funding Progress Other Post-Employment Benefits Plan on pages 63 through 65, respectively, be presented to supplement the basic financial statements. Such information, although not a part of the basic financial statements, is required by the Governmental Accounting Standards Board, who considers it to be an essential part of financial reporting for placing the basic financial statements in an appropriate operational, economic, or historical context. We have applied certain limited procedures to the required supplementary information in accordance with auditing standards generally accepted in the United States of America, which consisted of inquiries of management about the methods of preparing the information and comparing the information for consistency with management s responses to our inquiries, the basic financial statements, and other knowledge we obtained during our audit of the basic financial statements. We do not express an opinion or provide any assurance on the information because the limited procedures do not provide us with sufficient evidence to express an opinion or provide any assurance. Supplementary Information Our audits were conducted for the purpose of forming opinions on the financial statements taken as a whole. The accompanying supplementary information on pages 69 and 70 is the responsibility of management and was derived from and relates directly to the underlying accounting and other records used to prepare the financial statements. The information has been subjected to the auditing procedures applied in the audit of the financial statements and certain additional procedures, including comparing and reconciling such information directly to the underlying accounting and other records used to prepare the financial statements or to the financial statements themselves, and other additional procedures in accordance with auditing standards generally accepted in the United States of America. In our opinion, the information is fairly stated in all material respects in relation to the financial statements taken as a whole. 2
25 To the Board of Directors of the Gold Coast Transit District Oxnard, California Page 3 Other Information Our audits were conducted for the purpose of forming opinions on the financial statements that collectively comprise the District s basic financial statements as a whole. The introductory and statistical sections are presented for purposes of additional analysis and are not required parts of the basic financial statements. The introductory and statistical sections have not been subjected to the auditing procedures applied in the audit of the basic financial statements and, accordingly, we do not express an opinion or provide any assurance on them. Management has not presented certain accrual-based information that accounting principles generally accepted in the United States of America require to be presented in the statistical section of the basic financial statements. Such missing information, although not part of the basic financial statements, is required by the Governmental Accounting Standards Board, who considers it to improve consistency and comparability in reporting and provide clearer guidance regarding the applicability of the standards for the statistical section to all types of governmental entities. Our opinion on the basic financial statements is not affected by this missing information. Other Reporting Required by Government Auditing Standards In accordance with Government Auditing Standards, we have also issued our report dated December 31, 2016, on our consideration of the District s internal control over financial reporting and on our tests of its compliance with certain provisions of laws, regulations, contracts, and grant agreements and other matters. The purpose of that report is to describe the scope of our testing of internal control over financial reporting and compliance and the results of that testing, and not to provide an opinion on internal control over financial reporting or on compliance. That report is an integral part of an audit performed in accordance with Government Auditing Standards in considering the District s internal control over financial reporting and compliance. This report can be found on pages 5 and 6. Santa Ana, California December 31,
26 This page intentionally left blank 4
27 REPORT ON INTERNAL CONTROL OVER FINANCIAL REPORTING AND ON COMPLIANCE AND OTHER MATTERS BASED ON AN AUDIT OF FINANCIAL STATEMENTS PERFORMED IN ACCORDANCE WITH GOVERNMENT AUDITING STANDARDS To the Board of Directors of the Gold Coast Transit District Oxnard, California Independent Auditors Report We have audited, in accordance with the auditing standards generally accepted in the United States of America and the standards applicable to financial audits contained in Government Auditing Standards issued by the Comptroller General of the United States, the financial statements of the Gold Coast Transit District (District) as of and for the year ended June 30, 2016, and the related notes to the financial statements, which collectively comprises the District s basic financial statements, and have issued our report thereon dated December 31, Internal Control Over Financial Reporting In planning and performing our audit of the financial statements, we considered the District s internal control over financial reporting (internal control) to determine the audit procedures that are appropriate in the circumstances for the purpose of expressing our opinions on the financial statements, but not for the purpose of expressing an opinion on the effectiveness of the District s internal control. Accordingly, we do not express an opinion on the effectiveness of the District s internal control. A deficiency in internal control exists when the design or operation of a control does not allow management or employees, in the normal course of performing their assigned functions, to prevent, or detect and correct, misstatements on a timely basis. A material weakness is a deficiency, or a combination of deficiencies, in internal control, such that there is a reasonable possibility that a material misstatement of the entity s financial statements will not be prevented, or detected and corrected on a timely basis. A significant deficiency is a deficiency, or a combination of deficiencies, in internal control that is less severe than a material weakness, yet important enough to merit attention by those charged with governance. Our consideration of internal control was for the limited purpose described in the first paragraph of this section and was not designed to identify all deficiencies in internal control that might be material weaknesses or, significant deficiencies. Given these limitations, during our audit we did not identify any deficiencies in internal control that we consider to be material weaknesses. However, material weaknesses may exist that have not been identified. Compliance and Other Matters As part of obtaining reasonable assurance about whether the District s financial statements are free from material misstatement, we performed tests of its compliance with certain provisions of laws, regulations, contracts, and grant agreements, noncompliance with which could have a direct and material effect on the determination of financial statement amounts. However, providing an opinion on compliance with those provisions was not an objective of our audit, and accordingly, we do not express such an opinion. The results of our tests disclosed no instances of noncompliance or other matters that are required to be reported under Government Auditing Standards. 200 East Sandpointe Avenue, Suite 600, Santa Ana, California Tel: Toll Free: Fax:
28 To the Board of Directors of the Gold Coast Transit District Oxnard, California Page 2 Purpose of this Report The purpose of this report is solely to describe the scope of our testing of internal control and compliance and the results of that testing, and not to provide an opinion on the effectiveness of the entity s internal control or on compliance. This report is an integral part of an audit performed in accordance with Government Auditing Standards in considering the entity s internal control and compliance. Accordingly, this communication is not suitable for any other purpose. Santa Ana, California December 31,
 provides an introduction to the financial statements of GCTD for the fiscal year ended June 30, 2016.")
29 Management s Discussion and Analysis (Unaudited) For the Year Ended June 30, 2016 The following Management Discussion and Analysis (MD&A) of activities and financial performance of Gold Coast Transit District (GCTD) provides an introduction to the financial statements of GCTD for the fiscal year ended June 30, We encourage readers to consider the information presented here in conjunction with the transmittal letter contained in the Introductory Section and with the statements and related notes contained in the Statistical Section. On July 1, 2014, state legislation established Gold Coast Transit District (GCTD), replacing GCT s previous structure as a Joint Powers Authority (JPA). FY was the second year of operation for Gold Coast Transit District, so two-year comparisons include both years as the District Activities and Highlights GCTD provides bus and paratransit services in the cities of Ojai, Oxnard, Port Hueneme and Ventura, and in the unincorporated County areas between the cities. The service area is approximately 91 square miles with a population of approximately 375,000. GCTD owns 80 revenue vehicles which are 100% fueled with clean burning compressed natural gas (CNG), primarily from GCTD s owned and operated CNG fueling station. In FY , GCTD vehicles carried nearly 3.9 million passengers while traveling over 2.8 million revenue miles. GCTD operates a fleet of 56 fixed-route buses. In FY , GCTD fixed-route buses operated 2.17 million miles of revenue service and served 3.8 million passenger boardings, a decrease of 2.8% from the previous year, which was the highest ridership ever for GCTD or its predecessor agencies. In FY , the ACCESS paratransit system transported 93,274 passengers, an increase of 10.3% from the previous year. GCTD owns the paratransit fleet consisting of 24 vans, which are operated under contract by MV Transportation, Inc. Increase/ (Decrease) Fixed-Route Passenger Trips 3,800,673 3,908, % ACCESS Paratransit One-Way Trips 93,274 84, % Total Boardings 3,839,947 3,993, % Fixed Route Bus Ridership Unlinked Passenger Trips from 2007 to

30 Management s Discussion and Analysis (Unaudited) (Continued) For the Year Ended June 30, 2016 ACCESS Paratransit Ridership One-way Trips from 2007 to 2016 GCTD is different than the majority of transit operations in Southern California in that it provides transit service without support from direct local sales tax measures, tax levies or dedicated general funds. The use of Local Transportation Funds (LTF) from a quarter-cent state sales tax provided by the Transportation Development Act (TDA) of 1974 has historically been the primary local means available to GCTD to support transit services. LTF increased substantially through the early 2000s, peaked in FY , and was highly impacted by the recession that followed. After decreasing 35% from FY to FY , LTF funding allocated to GCTD member jurisdiction (by population) is approaching a return to its pre-recession level. In FY GCTD received nearly $15.5 million in LTF funding. LTF Funding Allocated to District Members to
31 Management s Discussion and Analysis (Unaudited) (Continued) For the Year Ended June 30, 2016 In FY 2015, Gold Coast Transit, a joint powers authority (JPA), became Gold Coast Transit District as the result of state legislation. As a district, GCTD directly receives all LTF funds allocated to its members jurisdictions; previously GCT was allocated a portion of the LTF by its members based on budget requirements. The legislation also allows GCTD members to claim from the district a portion of its LTF funds for transit services (not provided by the District) that the member funds or operates. GCTD s second largest source of operating revenue is the Federal Transit Administration (FTA). Federal Section 5307 grants, the program that provide funds for some GCTD operating activities, are based on a federal formula and have remained relatively stable over the past ten years. GCTD expended $3.77M in Section 5307 grant funds for operating revenue service in FY GCTD also uses Federal Congestion Mitigation and Air Quality Improvement (CMAQ) funds to help pay for new routes, called demonstration projects. GCTD expended $1.16M in CMAQ funds supporting three routes in FY Another revenue source for GCTD is State Transportation Assistance (STA). While STA accounts for a small percentage of GCTD revenues (0.9% in FY ), STA does provide significant funding for competing Ventura County transit priorities such as Metrolink and VISTA. GCTD expended $184,928 in STA in FY GASB 68 & 71 The Governmental Accounting Standards Board (GASB) is an independent, nonprofit, non-governmental regulatory body charged with setting accounting and financial reporting standards for state and local governments. Beginning with Fiscal Year , GASB Statements 68 & 71 required agencies to report their net pension liability in accrual-based financial statements. This is distinctly different than previous methods in which funding and accounting were aligned. Please note that these standards only impact the accounting and financial reporting of pension obligations for governmental employers; pension contribution rates and funding requirements are not impacted by GASB 68. GCTD employees are covered by a CalPERS pension plan. As a result of these accounting changes and CalPERS policy decision to value net pension liability based on value on June 30 th of the prior year (in this case, June 30, 2015) as opposed to the current year, our auditors calculated an adjustment that decreased our FY pension expense by $705,084. This adjustment is reflected in the information discussed herein. We anticipate that in FY this adjustment will result in a pension expense increase. In total, the GASB 68 & 71 requirement adds a net pension liability of $8,385,297 to GCTD s statement of net position. Note 8 of the Audit Report addresses the GASB 68 & 71 requirement in substantially greater detail. Financial Position Summary GCTD s total net position for FY is $25,440,841, a 19% increase from $21,401,559 at year end FY The growth in GCTD s current and other assets is the result of a $1.6M presently held in cash but committed to a capital reserve payment in FY and $4.4M in receivables from Federal grant funding, the result of delayed grant reimbursements. It is anticipated that the Federal funds will be received and the capital reserve payment made in the first quarter of FY Deferred inflows and outflows and the non-current liability are GASB 68 & 71 adjustments. 9
32 Management s Discussion and Analysis (Unaudited) (Continued) For the Year Ended June 30, 2016 Financial Position Summary, continued Condensed Statement of Net Position Change Assets: Current assets $ 19,423,635 $ 15,531,471 $ 3,892,164 Non-current assets - 33,964 (33,964) Capital assets, net 24,938,691 22,375,098 2,563,593 Total assets 44,362,326 37,940,533 6,421,793 Deferred outflows of resources 3,062,166 1,301,199 1,760,967 Liabilities: Current liabilities 10,432,628 7,406,526 3,026,102 Non-current liabilities 8,765,770 8,095, ,457 Total liabilities 19,198,398 15,501,839 3,696,559 Deferred inflows of resources 2,785,253 2,338, ,919 Net position: Net investment in capital assets 24,938,691 22,375,098 2,563,593 Restricted for capital projects 8,087,811 6,562,550 1,525,261 Unrestricted (7,585,661) (7,536,089) (49,572) Total net position $ 25,440,841 $ 21,401,559 $ 4,039,282 The largest portion of GCTD s net position is its net investment in capital assets, such as buses, buildings, improvements, and equipment. GCTD uses these capital assets to provide services to its passengers; consequently, these assets are not available for future spending. The increase in capital assets is primarily due to the acquisition of eight (8) Gillig 40-foot fixed route buses. Restricted net position are those funds set aside or specifically awarded to fund the purchase of future capital projects and transit vehicle acquisitions. The remaining unrestricted net position may be used to meet GCT s capital and ongoing obligations. The increase in restricted net position is primarily due to the receipt of $1.7 million in LTF funding for GCTD capital projects, less $183,248 funds expended for capital projects in FY GCTD also holds as of June 30, 2016, $10.8 million from California Proposition 1B bonds, to be used for pending capital improvement projects in its expendable trust funds. 10

33 Management s Discussion and Analysis (Unaudited) (Continued) For the Year Ended June 30, 2016 The following chart shows GCT s total assets by percentage. Passenger Fares Passenger fares are set by the Board of Directors and changed when determined necessary by the Board. The most recent fare increase was approved during FY , when the Board of Directors approved a two-phase fare increase. The first phase took effect on January 24, 2010, and the second phase took effect on August 21, The base cash fare for GCTD fixed route buses is $1.50, and by policy the paratransit fare is automatically set at twice the amount of the fixed route fare, or $3.00. GCTD last restructured its multi-ride ticket and monthly pass program in October GCTD s current fare structure is as follows: GCTD FIXED ROUTE FARES Cash Fares (One Way) Fare Amount Multi-Ride Ticket or Monthly Pass Fare Amount Adult $1.50 Adult Youth (through age 18) $ Ride $20.00 Seniors (65-74 years of age with GCTD I.D or proof of age) $ Day Pass $50.00 Medicare (with Medicare Card) $0.75 Youth Disabled (ADA card or GCTD I.D.) $ Ride $15.00 Seniors 75+ (with GCTD I.D or proof of age) Free 31-Day Pass $40.00 Children under 45 tall (when accompanied by paid fare) Free Reduced Fare (Senior/Disabled) Day Pass (One-Day/Unlimited Boardings) $ Ride $10.00 Day Pass for Seniors/Medicare/Disabled $ Day Pass $25.00 GCTD ACCESS (Paratransit) FARES Cash Fares (One Way) Multi-Ride Ticket or Monthly Pass ADA Certified or Senior $3.00 Book of Ten Tickets - ADA Certified or Senior $30.00 Senior Nutrition (registered with County program) Donation 11
34 Management s Discussion and Analysis (Unaudited) (Continued) For the Year Ended June 30, 2016 Financial Operations Highlights Operating revenues decreased 16%, from $4,022,983 in FY to $3,369,769 in FY Fixed route revenues decreased 13.8% as the result of having ceased a program whereby GCTD member jurisdictions provided local fare support ($350,000 in FY 14-15) in exchange or Local Transportation Funds (LTF). Actual fare media sales revenue decreased 4.4%, in line with a 2.8% decrease in boardings. Paratransit revenues decreased 35% as the result of having booked some additional prior year revenue from the Medi-Cal Administrative Activities (MAA) program into FY Actual paratransit fare media sales revenue increased 23%, from a 10.3% increase in boardings and some large year-end fare media orders. GCTD achieved its TDA-mandated minimum fare box recovery ratio of 20% overall or 20% for fixed route and 10% for paratransit. Operating expenses before depreciation increased 6.3% from $19,381,448 to $20,547,884. If we exclude the GASB 68 & 71 adjustments then operating expenditures increased 7.9% from $19,695,493 to $21,252,965. FY operating expenditures were still considerably lower than the approved budget of $22,096,000. The year-to-year increase was driven by: 1. A 10.8% increase in salaries and wages, driven by staffing additions to accommodate the growth of the agency and a 4% wage increase in July 2015 for the second year of a four-year Memorandum of Understanding (MOU) between GCTD and SEIU Local 721. The MOU also included increasing employee pension contributions and decreasing employer pension contributions from (pre-2013) employees by 2% per year for each of the first three years of the contract. GCTD increased the fixed route Revenue Service Hours (RSH) it provides to the public by 1.25%, from 199,418 in FY to 201,905 in FY Operator labor is GCTD s largest single cost driver, and GCTD s Operator labor costs increased 7.4% from FY to FY A 3.9% increase in medical benefit contribution costs, resulting from additions to staff as well as a 4% increase in GCTD s medical benefit contribution on January 1, 2016 as negotiated in the referenced MOU. 3. A 24% decrease in pension expense, primarily as the result of required GASB 68 & 71 adjustments. It is anticipated that next year these non-cash adjustments will increase GCTD s pension expense. Excluding these adjustments for both FY and FY , pension expense decreased 0.6% in FY , the result of increased wages offset by reductions as the result of moving a portion of pension costs from the employer to the employees and an increase in the number of new employees hired into the lower-cost PEPRA CalPERS retirement tier. 4. A 58% increase in insurance costs, primarily the result of substantially increased costs for liability insurance to cover GCTD s fleet operations. The transit liability insurance market became much harder over the past two years, and GCTD s costs as part of the California Transit Indemnity Pool (CalTIP) increased substantially in FY and will do so again in FY A 7.9% increase in the cost for contracted ADA Paratransit service, driven primarily by a 10.2% increase in ridership. 6. A 79% increase in contracted maintenance repairs and services, primarily the result of increased bus engine overhaul activity and a program to paint and update the graphics on our bus and service vehicle fleet to reflect GCTD s new colors and logo. 7. An 8.9% increase in repair parts expense, resulting from increased repair activity as our largest fleet, the 26-bus New Flyer fleet, passes its midlife stage. 8. A 75% decrease in legal expenses resulting from an exceptionally light year in terms of legal activity. 9. GCTD s fleet operates exclusively on compressed natural gas (CNG). Natural gas continue to experience 12
35 Management s Discussion and Analysis (Unaudited) (Continued) For the Year Ended June 30, 2016 historic low pricing, with GCTD s fuel costs for FY down 4.9% from FY , which also featured historically low prices. GCTD procures gas on a third-party contract that offers a 4% discount from the published SoCal Gas price. GCTD s vehicles drove 3.3 million miles in FY , 70% of those miles by full-size buses. Our average fuel cost across all fleets was $.206 per mile; the equivalent of getting 12 miles per gallon at $2.47 per gallon - better than some cars or pick-up trucks. This excludes revenue GCTD receives as the result of operating a CNG fleet - generating and selling Federal RIN credits and State LCFS credits and receiving the Federal alternative fuels excise tax rebate. Condensed Statements of Revenues, Expenses and Changes in Net Position Change Operating revenues $ 3,369,769 $ 4,022,983 $ (653,214) Operating expenses (20,547,884) (19,381,448) (1,166,436) Operating (loss) before depreciation (17,178,115) (15,358,465) (1,819,650) Depreciation (2,843,634) (2,405,787) (437,847) Operating (loss) (20,021,749) (17,764,252) (2,257,497) Non-operating revenues, net 17,178,115 15,326,887 1,851,228 (Loss) before capital contributions (2,843,634) (2,437,365) (406,269) Capital contributions 6,882,916 14,047,283 (7,164,367) Change in net position 4,039,282 11,609,918 (7,570,636) Net position: Beginning of year 21,401,559 18,919,154 2,482,405 Revenues Prior period adjustment - (9,127,513) 9,127,513 End of year $ 25,440,841 $ 21,401,559 $ 4,039,282 A summary of revenues for the year ended June 30, 2016 including the amount and percentage of change in relation to prior year amounts is as follows: Percentage Increase % Increase 2016 of Total 2015 (Decrease) (Decrease) Operating revenues: Fixed-route passenger fares $ 3,068, % $ 3,561,258 $ (492,793) -13.8% ACCESS paratransit fares 301, % 461,725 (160,421) -34.7% Total operating 3,369, % 4,022,983 (653,214) -16.2% Non-operating: Local assistance 10,601, % 8,869,456 1,732, % Federal funding 4,930, % 5,469,611 (538,891) -9.9% State funding 207, % 174,425 33, % Other 1,437, % 813, , % Total non-operating 17,178, % 15,326,887 1,851, % Total revenues $ 20,547, % $ 19,349,870 $ 1,198, % In FY , fixed route fare revenues decreased 4.4%, while local fare support received (in exchange for LTF funds) was deferred in FY and will no longer be available. Paratransit fares increased 23%, while local fare support for paratransit (MAA service reimbursements from Ventura County) are lower as the result of having booked additional prior year revenue in FY Fare revenue followed passenger boarding trends, somewhat 13

36 Management s Discussion and Analysis (Unaudited) (Continued) For the Year Ended June 30, 2016 lower for fixed route and higher for paratransit. The following chart shows GCTD s passenger farebox revenues over the past ten years: California regulations require that a transit service claimant for TDA funds have a system wide ratio of fare and local revenues to operating cost of at least 20%, or that the claimant realize a farebox recovery ratio (FBRR) of 20% for fixed route service and 10% for paratransit service. The revenue calculation for the ratio may include local funds, defined as any nonfederal or nonstate grant funds or other revenues generated by, earned by, or distributed to an operator. GCTD includes funds from local jurisdictions and Medi-cal trip reimbursements, as well as agency-generated funds such as revenue from on-board advertising and credits associated with GCTD s use of alternative fuels. The expense calculation may exclude startup costs to provide new services, as well as annual cost increases in excess of the CPI for costs including provision of paratransit services, fuel, alternative fuel programs, power (including electricity), insurance premiums and payments in settlement of claims arising out of the operator s liability and state and federal mandates. GCTD s fare box recovery ratio (FBRR) for FY was 24.8% for fixed route and 16.9% for paratransit, with a combined FBRR of 23.7%. The following chart details GCTD s fare box recovery ratio calculation. GCTD Fare Box Ratio Calculation - FY Fixed Route $ in millions Paratransit $ in millions GCTD Operating Expenses $ GCT Operating Expenses $ 2.85 Less Excluded Costs $ (1.26) Less Excluded Costs $ (0.10) GCTD Operating Expenses Less Excluded Costs $ GCTD Operating Expenses Less Excluded Costs $ 2.75 Revenue Applicable to FBRR Revenue Applicable to FBRR Fixed Route Passenger Fares $ 3.07 Paratransit Passenger Fares $ 0.26 Less Excluded Fare Revenue $ (0.08) Local Transit Fares $ - Local Transit Fares (MAA) $ 0.05 Advertising Revenue $ 0.15 Energy Credit Revenue $ 0.40 Energy Credit Revenue $ 0.05 Alternative Fuel Excise Tax Credit $ 0.63 Alternative Fuel Excise Tax Credit $ 0.12 Interest Income $ 0.02 Other Revenues $ 0.05 Revenue Applicable to FBRR $ 4.08 Revenue Applicable to FBRR $ 0.47 Fixed Route FBRR 24.8% Paratransit FBRR 16.9% COMBINED FAREBOX RATIO 23.7% Local Transportation Funds (LTF) Prior to July 1, 2014 Gold Coast Transit was a Joint Powers Authority (JPA). As a JPA, Gold Coast Transit was only entitled to request from its members the amount needed to fund current year operations and a discretionary capital reserve contribution. On July 1, 2014 GCT became Gold Coast Transit District (GCTD) as the result of state 14
37 Management s Discussion and Analysis (Unaudited) (Continued) For the Year Ended June 30, 2016 legislation signed by Governor Brown in October As a District, GCTD is entitled to claim the entire amount of state Local Transportation Funds (LTF) apportioned by population to its member jurisdictions. GCTD s enabling legislation also allows GCTD members to claim from the district a portion of its LTF funds for transit services (not provided by the District) that the member funds or operates. For FY GCTD claimed $15,472,479 in LTF funds; of that amount, $10,601,709 was used for current year operations, $2,791,498 was claimed by GCTD s members for their transit service requirements, $1,657,000 was retained for a deferred contribution to GCTD s Capital Reserve in FY and the remaining $422,272 was deferred for future operating requirements. Federal and State Funds GCTD s second largest source of operating revenue is the Federal Transit Administration (FTA). In FY , GCTD expended $3,742,700 in Section 5307 grant funds for operating revenue purposes and $1,188,020 in CMAQ and JARC funds to defray the cost of adding new service and spare parts for our new CMAQ-funded bus fleet. In FY GCTD s new federal grants were delayed by a combination of FTA s computer system conversion and the conflict between the State of California and the U.S. Department of Labor of the applicability of California s PEPRA pension reform to transit employees. These issues have been resolved and GCTD executed the largest of these long-delayed grants before the October 1 st Federal year-end system shutdown. GCTD also receives State Transportation Assistance (STA). In FY GCTD received $184,928 in STA funds. Allocation of remaining FY STA funds was frozen during much of FY by an action initiated by the State Controller s Office (SCO) that proposed to change the methodology of the STA funding formula. This was recently resolved when Governor Brown signed SB 838, which directed the SCO to temporarily return to the long-understood methodology for allocating any unallocated STA funding in FY , and for all funds to be allocated in FY and FY Other Revenue Advertising Income - GCTD has been selling commercial bus advertising since FY , and continues to attract advertising contracts from both local and national entities. In FY , GCTD generated $153,164 in advertising revenues; this is the lowest advertising revenue level in six years as a result of having lost our largest advertising customer at the beginning of the fiscal year. GCTD anticipates a gradual recovery to previous revenue levels. Medi-Cal Reimbursement - GCTD receives through Ventura County Public Health partial reimbursement under the Medi-Cal Administrative Activities (MAA) program for providing Medi-Cal eligible trips on the GCTD ACCESS service. Funding is based on establishing eligibility on a trip-by-trip basis and is received in arrears. In FY GCTD realized $46,547 from this program; this is lower than in FY because additional prior year funds were booked in FY GCTD anticipates reimbursements from this program will typically exceed $100,000 per year. Energy Credit Revenue - Commencing in FY GCTD generates and sells both Low Carbon Fuel Standard (LCFS) credits (State of California) and Renewable Identification Number (RIN) credits (U.S. EPA) from its use of natural gas to fuel the fleet. In FY GCTD realized $292,366 from the first full year of this program. This was considerably higher than our forecast. GCTD budgeted for additional modest growth in the value of LCFS credits, however this market is volatile and we have seen some pullback during the first quarter of FY To this point the value of Federal RIN credits have remained high. Interest and Other Income - Interest is earned on temporary investments with the State of California Local Agency Investment Fund (LAIF) and on money market funds held at Union Bank. GCTD earned $15,815 in interest in FY Other income consists primarily of the sale of miscellaneous surplus property and is largely unanticipated activity. GCTD earned $54,938 in other income in FY The following chart shows the major sources of operating and non-operating revenues for the year ended June 30, 2016, as a percentage of total revenues. 15
 (Decrease) Operating expenses: Vehicle operation $ 11,135,179 47.")
38 Management s Discussion and Analysis (Unaudited) (Continued) For the Year Ended June 30, 2016 Expenses A summary of expenses for the year ended June 30, 2016, including the amount and percentage of change in relation to prior year amounts, is as follows: Percentage Increase % Increase 2016 of Total 2015 (Decrease) (Decrease) Operating expenses: Vehicle operation $ 11,135, % $ 10,801,217 $ 333, % Vehicle maintenance 3,135, % 2,910, , % Planning and marketing 918, % 823,896 94, % Operations and administration 2,512, % 2,187, , % Paratransit 2,847, % 2,657, , % Operating expenses before depreciation 20,547, % 19,381,448 1,166, % Depreciation 2,843, % 2,405, , % Total operating expenses $ 23,391, % $ 21,787,235 $ 1,604, % Fixed Route costs for FY were 3.1% higher than in FY The primary cost driver was increased bus operator wages; GCTD s union MOU included a 4% wage increase (4.6% including seniority-based step increases), service hours increased 1.25% and increased absenteeism impacted both sick time and overtime costs. Higher labor costs were offset by lower fuel costs. Excluding the previously discussed GASB 68 adjustment, the cost increase for fixed route service would have been 5.4%. Maintenance costs for FY were 7.7% higher than in FY Cost drivers were a 79% increase in contracted maintenance repairs and services, primarily the result of increased bus engine overhaul activity and a program to paint and update the graphics on our fleets, and an 8.9% increase in repair parts expense. In the prior year (FY ) GCTD s year-to-year Maintenance costs were actually 0.4% lower, with a two-year average annual cost increase of 3.7%. Administration Department costs for FY were 14.8% higher than in FY , primarily driven by a 58% increase in insurance costs resulting from substantially increased liability insurance costs. Increased labor costs resulted from wage increases plus the new positions added during FY being on payroll for the full year in FY

39 Management s Discussion and Analysis (Unaudited) (Continued) For the Year Ended June 30, 2016 Planning and Marketing department costs for FY were 11.4% higher than in FY , primarily driven by higher labor costs. A new position, Customer Service Supervisor, was added to Planning & Marketing in FY The primary reason is that for the first time in several years this department was fully-staffed throughout the full year; to illustrate, despite general salary increases and having added several positions to properly staff this function, departmental salary expense was actually lower in FY and FY than in either FY or FY Paratransit operations costs for FY were 7.1% higher than in FY , primarily driven by increased contracted operations costs as the result of higher demand driving the provision of additional service. The 18.2% increase in depreciation expense is primarily the result of having added eight new buses to replace buses that were fully depreciated several years ago. Total operating expenses before depreciation were 6% higher than the previous year. The following chart shows operating expense trends over a ten-year period. District Operating Expense - from 2007 to

40 Management s Discussion and Analysis (Unaudited) (Continued) For the Year Ended June 30, 2016 The following chart shows major cost categories and the percentage of operating expenses for the year ended June 30, 2016: Financial Statements GCTD s basic financial statements are prepared on an accrual basis in accordance with generally accepted accounting principles promulgated by the Government Accounting Standards Board. GCTD is structured as an enterprise fund with revenues recognized when earned, not when received. Expenses are recognized when incurred, not when paid. Capital assets are capitalized and (except for land and construction in progress) depreciated over their estimated useful lives. See the notes to the financial statements for a summary of GCTD s significant accounting policies. Capital Asset Acquisition During FY , GCTD added $5,407,227 in capital additions. The most notable capital addition was $4,183,160 for eight (8) Gillig 40-foot CNG fixed route transit buses. Other capital additions include $319,731 for five (5) new MV-1 Paratransit vehicles, $234,058 to renovate GCTD s Customer Service Center (CSC) at the Oxnard Transit Center, $103,006 to augment GCTD s business systems, including several new modules for the Fleet-Net ERP system and a new point-of-sale system for the CSC, and $54,142 for two (2) new CNG Honda Civics for GCTD s service vehicle fleet. Capital asset acquisitions are capitalized at cost. Acquisitions are typically funded primarily using federal grants with matching local funds. GCTD also receives state grants from the Proposition 1B Public Transportation Modernization, Improvement, and Service Enhancement Account (PTMISEA) and Safety and Security programs, both of which may be used to match federal funds but neither of which require matching funds. With several capital projects currently underway, primarily the design of the new Operations and Administration Facility, GCTD closed the year with $3,555,785 in Work in Process Additional information on GCTD s capital assets can be found in the notes to the financial statements. 18
Gold Coast Transit District. Comprehensive Annual Financial Report For the Fiscal Year Ended June 30, 2015
 Comprehensive Annual Financial Report For the Fiscal Year Ended June 30, 2015 Board of Directors 2015 Paul Blatz, Chair Mayor Pro Tem, City of Ojai Alternate Director, Councilmember Betsy Clapp Bryan
Comprehensive Annual Financial Report. FISCAL YEARS ENDING JUNE 30, 2017 and 2016
 Comprehensive Annual Financial Report FISCAL YEARS ENDING JUNE 30, 2017 and 2016 Board of Directors November 2017 Bryan MacDonald, Chair Councilman, City of Oxnard Alternate Director, Mayor Pro Tem Carmen
Comprehensive Annual Financial Report. For the Fiscal Year Ending June 30, 2016 and 2015
 Comprehensive Annual Financial Report For the Fiscal Year Ending June 30, 2016 and 2015 Board of Directors June 30, 2016 Douglas A. Breeze, Chair Mayor, City of Port Hueneme Alternate Director, Councilmember
Budget and Financial Plan GOLD COAST TRANSIT DISTRICT
 and Financial Plan GOLD COAST TRANSIT DISTRICT 2017-2018 Steven P. Brown General Manager Steve L. Rosenberg Director of Finance and Administration June 7, 2017 Final June 7, 2017 Page ii TABLE OF CONTENTS
Review and Discuss Staff Presentation on Draft GCTD Operating Budget for FY
 May 3, 2017 Item #15 TO: FROM: SUBJECT: Board of Directors Steve L. Rosenberg Director of Finance and Administration Review and Discuss Staff Presentation on Draft GCTD Operating for FY 2017-18 I. EXECUTIVE
MINUTES OF THE REGULAR BOARD OF DIRECTORS MEETING WEDNESDAY, OCTOBER 4, :00 A.M.
 Item #1 MINUTES OF THE REGULAR BOARD OF DIRECTORS MEETING WEDNESDAY, OCTOBER 4, 2017 10:00 A.M. Call to Order Chair Bryan MacDonald called the regular meeting of the Board of Directors of Gold Coast Transit
Receive and File FY TDA Compliance Audit Reports for GCTD and Each of its Five (5) Members, as Prepared by The Pun Group
 Members, as Prepared by The Pun Group") December 7, 2016 Item #10 TO: Gold Coast Transit District Board of Directors From: Steve L. Rosenberg Director of Finance and Administration RE: Receive and File FY 2015-16 TDA Compliance Audit Reports
December 7, 2016 Item #10 TO: Gold Coast Transit District Board of Directors From: Steve L. Rosenberg Director of Finance and Administration RE: Receive and File FY 2015-16 TDA Compliance Audit Reports
MINUTES OF THE REGULAR BOARD OF DIRECTORS MEETING WEDNESDAY, APRIL 4, :00 AM
 Item #1 MINUTES OF THE REGULAR BOARD OF DIRECTORS MEETING WEDNESDAY, APRIL 4, 2018 10:00 AM Call to Order Chair Zaragoza called the regular meeting of the Board of Directors of Gold Coast Transit District
BUDGET AND FINANCIAL PLAN FISCAL YEAR
 BUDGET AND FINANCIAL PLAN 2013-14 FISCAL YEAR Steven P. Brown General Manager Steve L. Rosenberg Director of Administrative Services June 5, 2013 Final June 5 2013 Page ii TABLE OF CONTENTS GUIDE TO THE
City of Ojai, California Transportation Development Act Fund Article 4, Section 99260(a) of the Public Utilities Code
 of the Public Utilities Code") City of Ojai, California Transportation Development Act Fund Article 4, Section 99260(a) of the Public Utilities Code Financial Statements And Independent Auditors Reports For the Year Ended June 30, 2015
City of Ojai, California Transportation Development Act Fund Article 4, Section 99260(a) of the Public Utilities Code Financial Statements And Independent Auditors Reports For the Year Ended June 30, 2015
EASTERN SIERRA TRANSIT AUTHORITY ANNUAL FINANCIAL REPORT WITH INDEPENDENT AUDITOR S THEREON. June 30, 2016
 EASTERN SIERRA TRANSIT AUTHORITY ANNUAL FINANCIAL REPORT WITH INDEPENDENT AUDITOR S THEREON June 30, 2016 Annual Financial Report For the Year Ended June 30, 2016 TABLE OF CONTENTS FINANCIAL SECTION Independent
CITY OF SANTA MONICA, CALIFORNIA
 Financial Statements and Required and Other Supplementary Information (with Independent Auditor s Reports Thereon) Table of Contents Independent Auditor s Report... 1 Management s Discussion and Analysis
City of Ojai, California Transportation Development Act Fund Article 4, Section 99260(a) of the Public Utilities Code
 of the Public Utilities Code") City of Ojai, California Transportation Developm ment Act Fund Article 4, Section 99260( (a) of thee Public Utilities Code Financial Statem ents and Independent Audito ors Reports For the Years Endedd
City of Ojai, California Transportation Developm ment Act Fund Article 4, Section 99260( (a) of thee Public Utilities Code Financial Statem ents and Independent Audito ors Reports For the Years Endedd
CITY OF PORTERVILLE. Transportation and Transit Funds Audited Financial Statements. Years Ended June 30, 2016 and 2015
 CITY OF PORTERVILLE Transportation and Transit Funds Audited Financial Statements Years Ended June 30, 2016 and 2015 THIS PAGE INTENTIONALLY LEFT BLANK CITY OF PORTERVILLE Transportation and Transit Funds
CITY OF PORTERVILLE. Transportation and Transit Funds Audited Financial Statements. Years Ended June 30, 2014 and 2013
 Transportation and Transit Funds Audited Financial Statements Years Ended June 30, 2014 and 2013 THIS PAGE INTENTIONALLY LEFT BLANK Transportation and Transit Funds Audited Financial Statements June 30,
Whatcom Transportation Authority
 Financial Statements Audit Report Whatcom Transportation Authority Whatcom County For the period January 1, 2016 through December 31, 2017 Published April 30, 2018 Report No. 1021200 April 30, 2018 Office
Jefferson County Public Transportation Benefit Area (Jefferson Transit Authority)
") Financial Statements and Federal Single Audit Report Jefferson County Public Transportation Benefit Area (Jefferson Transit Authority) For the period January 1, 2015 through December 31, 2015 Published
Financial Statements and Federal Single Audit Report Jefferson County Public Transportation Benefit Area (Jefferson Transit Authority) For the period January 1, 2015 through December 31, 2015 Published
To: Board of Directors Date: December 21, 2017
 To: Board of Directors Date: December 21, 2017 From: Erick Cheung, Director of Finance Reviewed by: SUBJECT: FY 2017 Financial Audit Summary of Issues: The audit for FY 2017 has been completed and enclosed
CITY OF DIXON TRANSIT FUND FINANCIAL STATEMENTS WITH INDEPENDENT AUDITOR S REPORT FOR THE FISCAL YEAR ENDED JUNE 30, 2015
 FINANCIAL STATEMENTS WITH INDEPENDENT AUDITOR S REPORT FOR THE FISCAL YEAR ENDED FINANCIAL STATEMENTS WITH INDEPENDENT AUDITOR S REPORT FOR THE FISCAL YEAR ENDED Financial Section CITY OF DIXON TRANSIT
South Central Transit Authority. Financial Statements June 30, 2015
 Financial Statements Table of Contents Page INDEPENDENT AUDITOR'S REPORT 1 and 2 MANAGEMENT'S DISCUSSION AND ANALYSIS 3 to 6 FINANCIAL STATEMENTS Statement of Net Position 7 Statement of Revenues, Expenses,
CITY OF SIMI VALLEY MEMORANDUM
 CITY OF SIMI VALLEY MEMORANDUM AGENDA ITEM NO. Consent (7) September 26, 216 TO: FROM: City Council Department of Community Services SUBJECT: ADOPTION OF A RESOLUTION AUTHORIZING THE CITY MANAGER TO EXECUTE
YOSEMITE AREA REGIONAL TRANSPORTATION SYSTEM FINANCIAL STATEMENTS AND INDEPENDENT AUDITOR S REPORT FOR THE YEAR ENDED JUNE 30, 2016
 YOSEMITE AREA REGIONAL TRANSPORTATION SYSTEM FINANCIAL STATEMENTS AND INDEPENDENT AUDITOR S REPORT FOR THE YEAR ENDED JUNE 30, 2016 JUNE 30, 2016 TABLE OF CONTENTS Page FINANCIAL SECTION Independent Auditor
City of. ents and. For
 City of San Buen aventura, California Transportation Developm ment Act Fund Article 4, Section 99260( (a) of thee Public Utilities Code Financial Statem ents and Independent Audito ors Reports For the
HARBOR TRANSIT MULTI-MODAL TRANSPORTATION SYSTEM
 HARBOR TRANSIT MULTI-MODAL TRANSPORTATION SYSTEM FINANCIAL STATEMENTS FOR THE YEAR ENDED JUNE 30, 2018 Vredeveld Haefner LLC CPAs and Consultants TABLE OF CONTENTS FINANCIAL SECTION PAGE Independent Auditors
COUNTY OF BUTTE TRANSPORTATION DEVELOPMENT ACT FUND. Audited Financial Statements and Compliance Report. June 30, 2013
 Audited Financial Statements and Compliance Report June 30, 2013 Audited Financial Statements and Compliance Report June 30, 2013 and 2012 Audited Financial Statements Independent Auditor s Report... 1
CENTRAL CONTRA COSTA TRANSIT AUTHORITY CONCORD, CALIFORNIA BASIC FINANCIAL STATEMENTS WITH INDEPENDENT AUDITOR S REPORT JUNE 30, 2015
 CENTRAL CONTRA COSTA TRANSIT AUTHORITY CONCORD, CALIFORNIA BASIC FINANCIAL STATEMENTS WITH INDEPENDENT AUDITOR S REPORT JUNE 30, 2015 CENTRAL CONTRA COSTA TRANSIT AUTHORITY JUNE 30, 2015 TABLE OF CONTENTS
CENTRAL CONTRA COSTA TRANSIT AUTHORITY CONCORD, CALIFORNIA BASIC FINANCIAL STATEMENTS WITH INDEPENDENT AUDITOR S REPORT JUNE 30, 2016
 CENTRAL CONTRA COSTA TRANSIT AUTHORITY CONCORD, CALIFORNIA BASIC FINANCIAL STATEMENTS WITH INDEPENDENT AUDITOR S REPORT JUNE 30, 2016 CENTRAL CONTRA COSTA TRANSIT AUTHORITY JUNE 30, 2016 TABLE OF CONTENTS
MINUTES OF THE REGULAR BOARD OF DIRECTORS MEETING WEDNESDAY, MAY 3, :00 A.M.
 Item #1 MINUTES OF THE REGULAR BOARD OF DIRECTORS MEETING WEDNESDAY, MAY 3, 2017 10:00 A.M. Call to Order Chair Bryan MacDonald called the regular meeting of the Board of Directors of Gold Coast Transit
IMPERIAL COUNTY TRANSPORTATION COMMISSION. Financial Report of the Transit Planning and Programs Management Fund June 30, 2017 and 2016
 IMPERIAL COUNTY TRANSPORTATION COMMISSION Financial Report of the Transit Planning and Programs Management Fund June 30, 2017 and 2016 TABLE OF CONTENTS INDEPENDENT AUDITORS' REPORT 3-4 FINANCIAL STATEMENTS
East Orange County Water District
 Orange, California Annual Financial Report For the Years Ended June 30, 2016 and 2015 Our Mission Statement To provide the most cost effective, reliable, and highest quality water services for the present
Skagit County Public Transportation Benefit Area (Skagit Transit)
") Financial Statements and Federal Single Audit Report Skagit County Public Transportation Benefit Area (Skagit Transit) For the period January 1, 2014 through December 31, 2014 Published September 24, 2015
Financial Statements and Federal Single Audit Report Skagit County Public Transportation Benefit Area (Skagit Transit) For the period January 1, 2014 through December 31, 2014 Published September 24, 2015
Jefferson County Public Transportation Benefit Area (Jefferson Transit Authority)
") Financial Statements Audit Report Jefferson County Public Transportation Benefit Area (Jefferson Transit Authority) For the period January 1, 2016 through December 31, 2016 Published August 3, 2017 Report
Financial Statements Audit Report Jefferson County Public Transportation Benefit Area (Jefferson Transit Authority) For the period January 1, 2016 through December 31, 2016 Published August 3, 2017 Report
To: Board of Directors Date: December 7, 2015
 To: Board of Directors Date: December 7, 2015 From: Kathy Casenave, Director of Finance Reviewed by: SUBJECT: FY 2015 Financial Audit Summary of Issues: The audit for FY 2015 has been completed and enclosed
FIVE-YEAR BASELINE SERVICE PLAN & FINANCIAL FORECAST
 CHAPTER 7 FIVE-YEAR BASELINE SERVICE PLAN & FINANCIAL FORECAST This plan is financially constrained based on a status quo service level for the following elements over the five year planning period of
FY COMPREHENSIVE ANNUAL FINANCIAL REPORT
 FY 2017-18 COMPREHENSIVE ANNUAL FINANCIAL REPORT COMPREHENSIVE ANNUAL FINANCIAL REPORT FOR THE FISCAL YEAR ENDED JUNE 30, 2018 CITY OF STOCKTON, CALIFORNIA Prepared and Issued by Administrative Services
VICTOR VALLEY TRANSIT AUTHORITY (A JOINT POWERS AUTHORITY) BASIC FINANCIAL STATEMENTS WITH INDEPENDENT AUDITORS REPORT
 BASIC FINANCIAL STATEMENTS WITH INDEPENDENT AUDITORS REPORT") VICTOR VALLEY TRANSIT AUTHORITY BASIC FINANCIAL STATEMENTS WITH INDEPENDENT AUDITORS REPORT FOR THE FISCAL FOR THE FISCAL TABLE OF CONTENTS INDEPENDENT AUDITORS REPORT... 1 MANAGEMENT S DISCUSSION AND
VICTOR VALLEY TRANSIT AUTHORITY BASIC FINANCIAL STATEMENTS WITH INDEPENDENT AUDITORS REPORT FOR THE FISCAL FOR THE FISCAL TABLE OF CONTENTS INDEPENDENT AUDITORS REPORT... 1 MANAGEMENT S DISCUSSION AND
HARBOR TRANSIT MULTI-MODAL TRANSPORTATION SYSTEM
 HARBOR TRANSIT MULTI-MODAL TRANSPORTATION SYSTEM FINANCIAL STATEMENTS FOR THE YEAR ENDED JUNE 30, 2015 Vredeveld Haefner LLC TABLE OF CONTENTS FINANCIAL SECTION PAGE Independent Auditors Report 1-2 Management
HARBOR TRANSIT MULTI-MODAL TRANSPORTATION SYSTEM
 HARBOR TRANSIT MULTI-MODAL TRANSPORTATION SYSTEM FINANCIAL STATEMENTS FOR THE YEAR ENDED JUNE 30, 2017 Vredeveld Haefner LLC CPAs and Consultants TABLE OF CONTENTS FINANCIAL SECTION PAGE Independent Auditors
Dunthorpe-Riverdale Service District No. 1 A Component Unit of Multnomah County, Oregon. Financial Statements and Reports of Independent Auditors
 Dunthorpe-Riverdale Service District No. 1 A Component Unit of Multnomah County, Oregon Financial Statements and Reports of Independent Auditors For the Fiscal Years Ended June 30, 2017 and 2016 Prepared
CHICAGO TRANSIT AUTHORITY. FINANCIAL STATEMENTS AND SUPPLEMENTARY INFORMATION December 31, 2010 and 2009 (With Independent Auditors Report Thereon)
") FINANCIAL STATEMENTS AND SUPPLEMENTARY INFORMATION (With Independent Auditors Report Thereon) Chicago, Illinois FINANCIAL STATEMENTS CONTENTS Independent Auditors Report... 1 Management s Discussion and
FINANCIAL STATEMENTS AND SUPPLEMENTARY INFORMATION (With Independent Auditors Report Thereon) Chicago, Illinois FINANCIAL STATEMENTS CONTENTS Independent Auditors Report... 1 Management s Discussion and
CITY OF ATWATER, CALIFORNIA ANNUAL FINANCIAL REPORT FOR THE FISCAL YEAR ENDED JUNE 30, 2016
 CITY OF ATWATER, CALIFORNIA ANNUAL FINANCIAL REPORT FOR THE FISCAL YEAR ENDED JUNE 30, 2016 Prepared by: Finance Department This page intentionally left blank. Basic Financial Statements Table of Contents
CHICAGO TRANSIT AUTHORITY. FINANCIAL STATEMENTS AND SUPPLEMENTARY INFORMATION December 31, 2011 and 2010 (With Independent Auditors Report Thereon)
") FINANCIAL STATEMENTS AND SUPPLEMENTARY INFORMATION (With Independent Auditors Report Thereon) Chicago, Illinois FINANCIAL STATEMENTS CONTENTS Independent Auditors Report... 1 Management s Discussion and
FINANCIAL STATEMENTS AND SUPPLEMENTARY INFORMATION (With Independent Auditors Report Thereon) Chicago, Illinois FINANCIAL STATEMENTS CONTENTS Independent Auditors Report... 1 Management s Discussion and
CITY OF ORANGE, CALIFORNIA AIR POLLUTION REDUCTION FUND FINANCIAL STATEMENTS WITH REPORT ON AUDIT BY INDEPENDENT CERTIFIED PUBLIC ACCOUNTANTS
 , CALIFORNIA FINANCIAL STATEMENTS WITH REPORT ON AUDIT BY INDEPENDENT CERTIFIED PUBLIC ACCOUNTANTS JUNE 30, 2017 TABLE OF CONTENTS Page Number Independent Auditors Report 1-3 Basic Financial Statements:
CHILDREN AND FAMILIES COMMISSION OF ORANGE COUNTY (a Component Unit of the County of Orange, California) COMPREHENSIVE ANNUAL FINANCIAL REPORT
 COMPREHENSIVE ANNUAL FINANCIAL REPORT") CHILDREN AND FAMILIES COMMISSION OF ORANGE COUNTY (a Component Unit of the County of Orange, California) COMPREHENSIVE ANNUAL FINANCIAL REPORT For the Year Ended June 30, 2017 Prepared by: Michael Garcell,
CHILDREN AND FAMILIES COMMISSION OF ORANGE COUNTY (a Component Unit of the County of Orange, California) COMPREHENSIVE ANNUAL FINANCIAL REPORT For the Year Ended June 30, 2017 Prepared by: Michael Garcell,
City of La Palma Agenda Item No. 6
 City of La Palma Agenda Item No. 6 MEETING DATE: December 20, 2016 TO: FROM: SUBMITTED BY: CITY COUNCIL CITY MANAGER Sea Shelton, Administrative Services Director AGENDA TITLE: Comprehensive Annual Financial
Skagit County Public Transportation Benefit Area (Skagit Transit)
") Financial Statements and Federal Single Audit Report Skagit County Public Transportation Benefit Area (Skagit Transit) For the period January 1, 2015 through December 31, 2015 Published September 15, 2016
Financial Statements and Federal Single Audit Report Skagit County Public Transportation Benefit Area (Skagit Transit) For the period January 1, 2015 through December 31, 2015 Published September 15, 2016
AGENDA CITIZEN S TRANSPORTATION ADVISORY COMMITTEE/ SOCIAL SERVICES TRANSPORTATION ADVISORY COUNCIL (CTAC/SSTAC)
") AGENDA CITIZEN S TRANSPORTATION ADVISORY COMMITTEE/ SOCIAL SERVICES TRANSPORTATION ADVISORY COUNCIL (CTAC/SSTAC) TUESDAY, OCTOBER 16, 2018 -- 1:30 PM 3:30 PM County Government Center Hall of Administration
AGENDA CITIZEN S TRANSPORTATION ADVISORY COMMITTEE/ SOCIAL SERVICES TRANSPORTATION ADVISORY COUNCIL (CTAC/SSTAC) TUESDAY, OCTOBER 16, 2018 -- 1:30 PM 3:30 PM County Government Center Hall of Administration
Central Puget Sound Regional Transit Authority
 Central Puget Sound Regional Transit Authority Single Audit Reports for the Year Ended December 31, 2014 TABLE OF CONTENTS Audited Financial Statements Management s Discussion and Analysis... 1 Independent
CITY OF IRVINE, CALIFORNIA AIR QUALITY IMPROVEMENT SPECIAL REVENUE FUND FINANCIAL STATEMENTS FOR THE YEAR ENDED JUNE 30, 2016
 CITY OF IRVINE, CALIFORNIA AIR QUALITY IMPROVEMENT SPECIAL REVENUE FUND FINANCIAL STATEMENTS FOR THE YEAR ENDED JUNE 30, 2016 CITY OF IRVINE, CALIFORNIA TABLE OF CONTENTS For the year ended June 30, 2016
Solano County Transit
 AGENDA ITEM 13 - REVISED BOARD MEETING DATE: APRIL 18, 2013 Solano County Transit TO: BOARD OF DIRECTORS PRESENTER: KRISTINA BOTSFORD, BUDGET & ACCOUNTING MANAGER MONA BABAUTA, EXECUTIVE DIRECTOR SUBJECT:
CITY OF IRVINE, CALIFORNIA AIR QUALITY IMPROVEMENT SPECIAL REVENUE FUND FINANCIAL STATEMENTS FOR THE YEAR ENDED JUNE 30, 2018
 CITY OF IRVINE, CALIFORNIA AIR QUALITY IMPROVEMENT SPECIAL REVENUE FUND FINANCIAL STATEMENTS FOR THE YEAR ENDED JUNE 30, 2018 CITY OF IRVINE, CALIFORNIA AIR QUALITY IMPROVEMENT SPECIAL REVENUE FUND TABLE
SAN JOAQUIN REGIONAL RAIL COMMISSION MEASURE B PROGRAM FUND
 MEASURE B PROGRAM FUND Independent Auditors Report, Financial Statements, Supplementary Information and Other Reports For the Year Ended June 30, 2015 MEASURE B PROGRAM FUND JUNE 30, 2015 TABLE OF CONTENTS
MARIPOSA COUNTY TRANSIT FUND, CALIFORNIA
 MARIPOSA COUNTY TRANSIT FUND, CALIFORNIA FINANCIAL STATEMENTS TOGETHER WITH INDEPENDENT AUDITOR S REPORT FOR THE YEAR ENDED JUNE 30, 2015 THIS PAGE INTENTIONALLY LEFT BLANK MARIPOSA COUNTY TRANSIT FUND
METROPOLITAN TRANSIT AUTHORITY NASHVILLE, TENNESSEE AUDITED FINANCIAL STATEMENTS AND OTHER FINANCIAL INFORMATION JUNE 30, 2017 AND 2016
 NASHVILLE, TENNESSEE AUDITED FINANCIAL STATEMENTS AND OTHER FINANCIAL INFORMATION JUNE 30, 2017 AND 2016 Table of Contents Page INTRODUCTION... 1-2 INDEPENDENT AUDITOR S REPORT... 3-5 MANAGEMENT S DISCUSSION
Diablo Water District
 Diablo Water District Oakley, California Annual Financiall Report For the Years Endedd June 30, 2016 and 2015 For the Year Ended June 30, 2016 BOARD OF DIRECTORS Howard Hobbs Kenneth L. Crockett Enrico
FINANCE/AUDIT COMMITTEE AGENDA October 25, :00 a.m. 12:00 a.m. Wellness Center SunLine Transit Agency Thousand Palms, CA
 FINANCE/AUDIT COMMITTEE AGENDA October 25, 2017 11:00 a.m. 12:00 a.m. Wellness Center SunLine Transit Agency Thousand Palms, CA Public Comments will be accepted on each Agenda item upon the conclusion
Skagit County Public Transportation Benefit Area (Skagit Transit)
") Financial Statements and Federal Single Audit Report Skagit County Public Transportation Benefit Area (Skagit Transit) For the period January 1, 2013 through December 31, 2013 Published September 15, 2014
Financial Statements and Federal Single Audit Report Skagit County Public Transportation Benefit Area (Skagit Transit) For the period January 1, 2013 through December 31, 2013 Published September 15, 2014
Skagit County Public Transportation Benefit Area (Skagit Transit)
") Washington State Auditor s Office Financial Statements and Federal Single Audit Report Skagit County Public Transportation Benefit Area (Skagit Transit) Audit Period January 1, 2012 through December 31,
Washington State Auditor s Office Financial Statements and Federal Single Audit Report Skagit County Public Transportation Benefit Area (Skagit Transit) Audit Period January 1, 2012 through December 31,
COOPERATIVE AGREEMENT FY 2004/05 VENTURA INTERCITY SERVICE TRANSIT AUTHORITY (VISTA) CONEJO CONNECTION
 CONEJO CONNECTION") COOPERATIVE AGREEMENT FY 2004/05 VENTURA INTERCITY SERVICE TRANSIT AUTHORITY (VISTA) CONEJO CONNECTION This Agreement is made and entered into by the City of Calabasas (Calabasas) and the Ventura County
COOPERATIVE AGREEMENT FY 2004/05 VENTURA INTERCITY SERVICE TRANSIT AUTHORITY (VISTA) CONEJO CONNECTION This Agreement is made and entered into by the City of Calabasas (Calabasas) and the Ventura County
CHAMPAIGN-URBANA MASS TRANSIT DISTRICT Urbana, Illinois FINANCIAL STATEMENTS AND SUPPLEMENTARY INFORMATION YEARS ENDED JUNE 30, 2016 AND 2015
 CHAMPAIGN-URBANA MASS TRANSIT DISTRICT Urbana, Illinois FINANCIAL STATEMENTS AND SUPPLEMENTARY INFORMATION YEARS ENDED JUNE 30, 2016 AND 2015 TABLE OF CONTENTS PAGE INDEPENDENT AUDITORS REPORT... 1-3 MANAGEMENT'S
A N T E L O P E V A L L E Y T R A N S I T A U T H O R I T Y C O M P R E H E N S I V E A N N U A L F I N A N C I A L R E P O R T
 A N T E L O P E V A L L E Y T R A N S I T A U T H O R I T Y L A N C A S T E R, C A L I F O R N I A C O M P R E H E N S I V E A N N U A L F I N A N C I A L R E P O R T F O R T H E Y E A R E N D E D J U
FINANCIAL STATEMENTS. Rochester Genesee Regional Transportation Authority FOR THE YEARS ENDED MARCH 31, 2014 AND 2013
 Rochester Genesee Regional Transportation Authority FINANCIAL STATEMENTS FOR THE YEARS ENDED MARCH 31, 2014 AND 2013 A Component Unit of the State of New York ROCHESTER-GENESEE REGIONAL TRANSPORTATION
COMMUNITIES IN SCHOOLS ON THE SOUTH PLAINS, INC. FINANCIAL STATEMENTS FOR THE YEAR ENDED AUGUST 31, 2018 WITH COMPARATIVE TOTALS FOR 2017 AND
 FINANCIAL STATEMENTS FOR THE YEAR ENDED AUGUST 31, 2018 WITH COMPARATIVE TOTALS FOR 2017 AND REPORT OF BOLINGER, SEGARS, GILBERT & MOSS, L.L.P. LUBBOCK, TEXAS FINANCIAL STATEMENTS FOR THE YEAR ENDED AUGUST
CITY OF SANTA MONICA, CALIFORNIA Big Blue Bus Fund (An Enterprise Fund of the City of Santa Monica) Financial Statements and Supplementary
 Financial Statements and Supplementary") Financial Statements and Supplementary Information Fiscal Years Ended June 30, 2018 and 2017 (With Independent Auditors Reports Thereon) Fiscal Years Ended June 30, 2018 and 2017 Table of Contents Page
Financial Statements and Supplementary Information Fiscal Years Ended June 30, 2018 and 2017 (With Independent Auditors Reports Thereon) Fiscal Years Ended June 30, 2018 and 2017 Table of Contents Page
CITY OF ALAMEDA, CALIFORNIA ALAMEDA COUNTY TRANSPORTATION COMMISSION MEASURE BB PROGRAM FINANCIAL STATEMENTS FOR THE YEAR ENDED JUNE 30, 2018
 CITY OF ALAMEDA, CALIFORNIA ALAMEDA COUNTY TRANSPORTATION COMMISSION MEASURE BB PROGRAM FINANCIAL STATEMENTS FOR THE YEAR ENDED JUNE 30, 2018 This Page Left Intentionally Blank CITY OF ALAMEDA, CALIFORNIA
ORANGE COUNTY COUNCIL OF GOVERNMENTS. Basic Financial Statements. Year Ended June 30, (with Independent Auditors Report Thereon)
") Basic Financial Statements Year Ended June 30, 2016 (with Independent Auditors Report Thereon) Basic Financial Statements Year Ended June 30, 2016 TABLE OF CONTENTS Independent Auditors Report 1 Management
Basic Financial Statements Year Ended June 30, 2016 (with Independent Auditors Report Thereon) Basic Financial Statements Year Ended June 30, 2016 TABLE OF CONTENTS Independent Auditors Report 1 Management
NORTH CAROLINA DEPARTMENT OF TRANSPORTATION
 STATE OF NORTH CAROLINA OFFICE OF THE STATE AUDITOR BETH A. WOOD, CPA NORTH CAROLINA DEPARTMENT OF TRANSPORTATION RALEIGH, NORTH CAROLINA FINANCIAL STATEMENT AUDIT REPORT FOR THE YEAR ENDED JUNE 30, 2017
Pacific Mountain Workforce Development Council
 Financial Statements and Federal Single Audit Report Pacific Mountain Workforce Development Council Thurston County For the period July 1, 2016 through June 30, 2017 Published March 30, 2018 Report No.
Mason County Public Transportation Benefit Area (Mason Transit Authority)
") Financial Statements and Federal Single Audit Report Mason County Public Transportation Benefit Area (Mason Transit Authority) Mason County For the period January 1, 2013 through December 31, 2013 Published
Financial Statements and Federal Single Audit Report Mason County Public Transportation Benefit Area (Mason Transit Authority) Mason County For the period January 1, 2013 through December 31, 2013 Published
CITY OF LAKE BUENA VISTA, FLORIDA ANNUAL FINANCIAL REPORT AND COMPLIANCE REPORTS
 CITY OF LAKE BUENA VISTA, FLORIDA ANNUAL FINANCIAL REPORT AND COMPLIANCE REPORTS Year Ended September 30, 2015 CITY OF LAKE BUENA VISTA, FLORIDA ANNUAL FINANCIAL REPORT AND COMPLIANCE REPORTS Year Ended
CHAUTAUQUA, CATTARAUGUS, ALLEGANY & STEUBEN SOUTHERN TIER EXTENSION RAILROAD AUTHORITY REPORT ON FINANCIAL STATEMENTS DECEMBER 31, 2017
 CHAUTAUQUA, CATTARAUGUS, ALLEGANY & STEUBEN SOUTHERN TIER EXTENSION RAILROAD AUTHORITY REPORT ON FINANCIAL STATEMENTS DECEMBER 31, 2017 CHAUTAUQUA, CATTARAUGUS, ALLEGANY & STEUBEN TABLE OF CONTENTS Independent
MARIN COUNTY TRANSIT DISTRICT. San Rafael, California A Component Unit of the County of Marin, California COMPREHENSIVE ANNUAL FINANCIAL REPORT
 San Rafael, California A Component Unit of the County of Marin, California COMPREHENSIVE ANNUAL FINANCIAL REPORT For the Years Ended June 30, 2017 and 2016 (A Component Unit of the County of Marin, California)
CITY OF SANTA MONICA, CALIFORNIA Big Blue Bus Fund (An Enterprise Fund of the City of Santa Monica) Basic Financial Statements and Required and Other
 Basic Financial Statements and Required and Other") Basic Financial Statements and Required and Other Supplementary Information (with Independent Auditor s Reports Thereon) This page intentionally left blank Table of Contents Independent Auditor s Report...
Basic Financial Statements and Required and Other Supplementary Information (with Independent Auditor s Reports Thereon) This page intentionally left blank Table of Contents Independent Auditor s Report...
POINT ARENA SCHOOLS AUDIT REPORT JUNE 30, 2018
 AUDIT REPORT JUNE 30, 2018 TABLE OF CONTENTS JUNE 30, 2018 FINANCIAL SECTION Independent Auditors Report... 1 Management s Discussion and Analysis... 4 Basic Financial Statements Government-wide Financial
CITY OF ALAMEDA, CALIFORNIA. Alameda County Transportation Commission - Measure BB Funds. Financial Statements and Independent Auditors Reports
 CITY OF ALAMEDA, CALIFORNIA Alameda County Transportation Commission - Measure BB Funds Financial Statements and Independent Auditors Reports For The Year Ended June 30, 2016 CITY OF ALAMEDA, CALIFORNIA
COUNTY OF SANTA CLARA. Single Audit Reports. Basic Financial Statements with Federal Compliance Section. For the Fiscal Year Ended June 30, 2014
 COUNTY OF SANTA CLARA Single Audit Reports Basic Financial Statements with Federal Compliance Section For the Fiscal Year Ended COUNTY OF SANTA CLARA Single Audit Reports For the Fiscal Year Ended Table
City of Union City. Measure B Funds. Union City, California. Financial Statements and Independent Auditors Reports
 Measure B Funds Union City, California Financial Statements and Independent Auditors Reports Comprehensive Annual Financial Report Table of Contents Independent Auditors Report... 1 Financial Statements:
PORTAGE AREA REGIONAL TRANSIT AUTHORITY PORTAGE COUNTY AUDIT REPORT FOR THE YEAR ENDED DECEMBER 31, 2016
 PORTAGE AREA REGIONAL TRANSIT AUTHORITY PORTAGE COUNTY AUDIT REPORT FOR THE YEAR ENDED DECEMBER 31, 2016 PORTAGE AREA REGIONAL TRANSIT AUTHORITY PORTAGE COUNTY DECEMBER 31, 2016 TABLE OF CONTENTS TITLE
Regional Fare Coordination System
 Regional Fare Coordination System Financial Statements and Independent Auditors Report for the Years Ended December 31, 2016 and 2015 This page intentionally left blank. TABLE OF CONTENTS MANAGEMENT S
TOWN OF CLARENCE INDUSTRIAL DEVELOPMENT AGENCY
 TOWN OF CLARENCE INDUSTRIAL DEVELOPMENT AGENCY Basic Financial Statements, Required Supplementary Information, Supplementary Information and Other Information for the Years Ended December 31, 2018 and
TOLTEC SCHOOL DISTRICT NO. 22 ELOY, ARIZONA
 ELOY, ARIZONA ANNUAL FINANCIAL REPORT FISCAL YEAR ENDED Issued by: Business and Finance Department This page is intentionally left blank. TABLE OF CONTENTS Page INDEPENDENT AUDITORS' REPORT...1 MANAGEMENT'S
CITY OF VISALIA, CALIFORNIA MEASURE R TRANSPORTATION FUND FINANCIAL STATEMENTS FOR THE FISCAL YEAR ENDED JUNE 30, 2015 AND 2014
 CITY OF VISALIA, CALIFORNIA FINANCIAL STATEMENTS FOR THE FISCAL YEAR ENDED JUNE 30, 2015 AND 2014 This Page Left Intentionally Blank CITY OF VISALIA FOR THE FISCAL YEAR ENDED JUNE 30, 2015 AND 2014 Table
CITY OF LAKE BUENA VISTA, FLORIDA ANNUAL FINANCIAL REPORT AND COMPLIANCE REPORTS
 ANNUAL FINANCIAL REPORT AND COMPLIANCE REPORTS Year Ended September 30, 2014 ANNUAL FINANCIAL REPORT AND COMPLIANCE REPORTS Year Ended September 30, 2014 TABLE OF CONTENTS REPORT OF INDEPENDENT CERTIFIED
ANDERSON ZURMUEHLEN & CO., P.C. CERTIFIED PUBLIC ACCOUNTANTS & BUSINESS ADVISORS
 ANDERSON ZURMUEHLEN & CO., P.C. CERTIFIED PUBLIC ACCOUNTANTS & BUSINESS ADVISORS MEMBER: AMERICAN INSTITUTE O F CERTIFIED PUBLIC A CCOUNTANTS 1821 SOUTH AVENUE WEST FIFTH FLOOR P.O. BOX 2368 MISSOULA,
WESTLAKE CHARTER SCHOOL. (A California Non-Profit Public Benefit Corporation)
") (A California Non-Profit Public Benefit Corporation) Independent Auditor s Report and Financial Statements For the Year Ended June 30, 2016 Operating: Westlake Charter School Westlake Charter Middle School
(A California Non-Profit Public Benefit Corporation) Independent Auditor s Report and Financial Statements For the Year Ended June 30, 2016 Operating: Westlake Charter School Westlake Charter Middle School
Union County Utilities Authority
 Annual Financial Report of the Union County Utilities Authority For the Years Ended December 31, 2016 and 2015 Prepared By Union County Utilities Authority Finance Department FINANCIAL SECTION I N D E
FIRE DISTRICT NO. 6 TOWNSHIP OF GLOUCESTER, NEW JERSEY REPORT OF AUDIT FOR THE YEAR ENDED DECEMBER 31, 2016
 FIRE DISTRICT NO. 6 TOWNSHIP OF GLOUCESTER, NEW JERSEY REPORT OF AUDIT FOR THE YEAR ENDED DECEMBER 31, 2016 39256 FIRE DISTRICT NO. 6 TOWNSHIP OF GLOUCESTER, NEW JERSEY Table of Contents ROSTER OF OFFICIALS
City of Arvin. Arvin, California. Independent Auditors Report and Basic Financial Statements. For the Year Ended June 30, 2015
 Arvin, California Independent Auditors Report and Basic Financial Statements Prepared By Finance Department of the Basic Financial Statements Table of Contents Page FINANCIAL SECTION Independent Auditors
Spartan Shops, Inc. (a California State University Auxiliary Organization)
") Spartan Shops, Inc. (a California State University Auxiliary Organization) Financial Statements and Report of Independent Certified Public Accountants June 30, 2013 For the Year Ended June 30, 2013 Table
Spartan Shops, Inc. (a California State University Auxiliary Organization) Financial Statements and Report of Independent Certified Public Accountants June 30, 2013 For the Year Ended June 30, 2013 Table
LAKESIDE UNION SCHOOL DISTRICT COUNTY OF SAN DIEGO LAKESIDE, CALIFORNIA AUDIT REPORT JUNE 30, 2015
 COUNTY OF SAN DIEGO LAKESIDE, CALIFORNIA AUDIT REPORT JUNE 30, 2015 Wilkinson Hadley King & Co. LLP CPA's and Advisors 218 W. Douglas Ave El Cajon, CA 92020 Introductory Section Lakeside Union School District
RUNNING SPRINGS WATER DISTRICT ANNUAL FINANCIAL REPORT. Years Ended June 30, 2018 and 2017
 RUNNING SPRINGS WATER DISTRICT ANNUAL FINANCIAL REPORT Years Ended June 30, 2018 and 2017 Running Springs Water District Annual Financial Report Years Ended June 30, 2018 and 2017 I. INTRODUCTORY SECTION
City of Rio Vista. Transportation Development Act Program. Rio Vista, California. Financial Statements and Independent Auditors Reports
 Transportation Development Act Program Rio Vista, California Financial Statements and Independent Auditors Reports For the year ended June 30, 2011 Transportation Development Act Program Financial Statements
WESTLAKE CHARTER SCHOOL FINANCIAL STATEMENTS AND SUPPLEMENTARY INFORMATION YEAR ENDED JUNE 30, 2018
 FINANCIAL STATEMENTS AND SUPPLEMENTARY INFORMATION YEAR ENDED JUNE 30, 2018 TABLE OF CONTENTS YEAR ENDED JUNE 30, 2018 INDEPENDENT AUDITORS REPORT 1 BASIC FINANCIAL STATEMENTS STATEMENT OF FINANCIAL POSITION
Parking Authority of the City of Paterson, NJ
 Parking Authority of the City of Paterson, NJ Financial Statements Years Ended Parking Authority of the City of Paterson, NJ Table of Contents PAGE Management's Discussion and Analysis 1 Independent Auditors'
FORT WORTH TRANSPORTATION AUTHORITY
 FINANCIAL REPORT SEPTEMBER 30, 2010 C O N T E N T S INDEPENDENT AUDITOR'S REPORT... 1 MANAGEMENT'S DISCUSSION AND ANALYSIS... 3 Page BASIC FINANCIAL STATEMENTS Statements of Net Assets... 8 Statements
REGIONAL GOVERNMENT SERVICES AUTHORITY FINANCIAL STATEMENTS WITH INDEPENDENT AUDITOR'S REPORT FOR THE FISCAL YEARS ENDED JUNE 30, 2013 AND 2012
 FINANCIAL STATEMENTS WITH INDEPENDENT AUDITOR'S REPORT FOR THE FISCAL YEARS ENDED JAMES MARTA & COMPANY LLP CERTIFIED PUBLIC ACCOUNTANTS 701 HOWE AVENUE, E3 SACRAMENTO, CA (916) 993-9494 WWW.JPMCPA.COM
Comprehensive Annual Financial Report
 Comprehensive Annual Financial Report For the Fiscal Year Ended June 30, 2017 The York County School Division County of York, Virginia (A Component Unit of the County of York, Virginia) Comprehensive Annual
City of Santa Monica Annual Financial Report of its
 Annual Financial Report of its Proposition A Local Return Fund Proposition C Local Return Fund Measure R Local Return Fund Transportation Development Act Article 3 Fund As of and for the Years Ended June
BEDFORD PUBLIC SCHOOLS Temperance, Michigan ANNUAL FINANCIAL REPORT. June 30, 2015
 Temperance, Michigan ANNUAL FINANCIAL REPORT June 30, 2015 Bedford Public Schools Table of Contents June 30, 2015 Independent Auditor s Report... 1-2 Independent Auditor s Report on Internal Control over
City of San Mateo Transportation Development Act Fund
 City of San Mateo Transportation Development Act Fund San Mateo, California Financial Statements and Independent Auditors Reports For the years ended June 30, 2018 and 2017 City of San Mateo Transportation