MOLDOVAN ECONOMIC TRENDS
|
|
|
- Lewis Heath
- 5 years ago
- Views:
Transcription

1 Academy of Science of Moldova National Institute for Economic Research Ministry of Economy of Moldova MOLDOVAN ECONOMIC TRENDS ISSN Chisinau
2 ISSN MET TEAM: Alexandru Stratan, Alexandru Ceban, Zaharia Olarescu, Veronica Lazarenco, Olga Timofei, Viorica Popa, Tatiana Iatisin, Alexandra Novac, Tatiana Colesnicova. The MET team would like to acknowledge the cooperation with public institutions of the Republic of Moldova: the Ministry of Economy, the Ministry of Finance, the National Bank of Moldova and the National Bureau of Statistics. All rights reserved. No information in this publication can be reprinted or reproduced in any form without written permission of NIER. National Institute for Economic Research of ASM For additional information please contact us: National Institute for Economic Research 45 Ion Creanga street, Chisinau, RM, 2064 Tel: ( ) , Fax: ( ) web site:
3 CONTENTS Main political, economic and social events from the Republic of Moldova Edition summary Chapter I. PRODUCTION Chapter II. PRICES, EXCHANGE RATES AND MONETARY POLICY Chapter III. FINANCES Chapter IV. EXTERNAL SECTOR Chapter V. BUSINESS ENVIRONMENT Chapter VI. SOCIAL SECTOR STATISTICAL ANNEXES
4 GENERAL DATA Official name REPUBLIC OF MOLDOVA Capital President President of the Parliament Prime Minister Parliament of the Republic of Moldova Chisinau Nicolae Timofti (Igor Dodon, elected on November 13, 2016) Andrian Candu Pavel Filip 101 deputies: Socialist Party of the Republic of Moldova 24, Liberal Democratic Party of Moldova 10, Communist Party of the Republic of Moldova 7, Democratic Party of Moldova 20, Liberal Party 13, Unaffiliated deputies 27. Independence was obtained on August 27, 1991 Area 33.8 thousand km 2 Administrative units 32 districts, 5 municipalities (Chisinau, Balti, Bender, Comrat, Tiraspol), ATU Gagauzia, Administrative Territorial units from the left of the Dniester Resident Population thousand inhabitants (beginning of 2016) Main religions National currency Ortodox (93.34%), Protestant (1.98%), Old-Rite Christians (0.15%), Catholic (0.14%), etc. Moldovan Leu (average exchange rate, Quarter III, USD = 19.8 MDL, 1 EUR = 22.1 MDL) 4
5 ABBREVIATIONS CEFTA RCA GATS HACCP IDA DCFTA ATP PCA EBRD ILO BMA NBM NPB NBS GAP TBT NBC EC FCPA FCH NCFM TRC EPC SITC CIS TRQ IPR SDR AVE IMF NIER HHI SMEs - Central European Free Trade Agreement - Revealed Comparative Advantage - General Agreement on Trade in Services - Hazard Analysis and Critical Control Points - International Development Association - Deep and Comprehensive Free Trade Agreement - Autonomous Trade Preferences - Partnership and Cooperation Agreement - European Bank for Reconstruction and Development - International Labour Office - Bureau for Migration and Asylum - National Bank of Moldova - National Public Budget - National Bureau of Statistics - Good Agricultural Practice - Technical Barriers to Trade - National Bank Certificates - European Commission - Final Consumption of Public Administration - Final Consumption of Households - National Commission of Financial Market - Total Regulatory Capital - Effective Protection Coefficient - Standard International Trade Classification - Commonwealth of Independent States - Tarrif Rate Quota - Intellectual Proprety Rights - Special Drawing Rights - Ad-Valorem Equivalent - International Monetary Fund - National Institute for Economic Research - Herfendahl-Hirschman Index - Small and Medium Enterprises 5
6 CPI PPI IIPP FDI IPV UVI MAFI MAIB MDL MF SPM MFN NEER NPC OBSEC ODSMEs IOM WTO UN GDP CR REER GSP MET TN VAT EU USD ATU GVA SS - Consumer Price Index - Production Price Index - Index of Industrial Products Prices - Foreign Direct Investment - Index of Physical Volume - Unit Value Index - Ministry of Agriculture and Food Industry - Moldova Agroindbank - Moldovan Leu - Ministry of Finance - Sanitary and Phytosanitary Measures - Most Favoured Nation - Nominal Effective Exchange Rate - Nominal Protection Coefficient - Organization of the Black Sea Economic Cooperation - Organization for Development of Small and Medium Enterprises - International Organization for Migration - World Trade Organization - United Nations - Gross Domestic Product - Concentration Ratio - Real Effective Exchange Rate - Generalised System of Preferences - Moldovan Economic Trends - Transnistria - Value Added Tax - European Union - US Dollar - Autonomous Territorial Unit - Gross Value Added - State Securities 6
7 TABLES Table 1.1. Dynamics of the industrial production by main types of activities in January-September 2016,% Table 1.2. Volume indices of commodities transported and mileage of commodities by transport enterprises in January-September 2016 by modes of transport, % Table BNM activity on interbank currency market during the period January 2015 October Table Structure of state debt by currencies on September 30, 2016, % of total state debt Table Dynamics and structure of public revenues in the region from the left bank of the Dniester river in January-September Table Structure of credit portofolio by branches during the period Table 5.1. Growth index in the number of registered and deregistered enterprises in QIII compared to the same period of the previous year, % Table 5.2. Data on average number of employees in small business sector enterprises, including small and micro enterprises (without individuals) from the left of the Dniester by types of activity, in January-June Table 6.1. Natural movement of population in country by development regions in QIII of Table 6.2. Trends in nominal salary rates vs real salary rates (compared to the same period of the previous year), % Table 6.3. Subsistence minimum in the region from the left bank of the Dniester River in Quarter III of
8 FIGURES Figure 1.1. GDP dynamics in January-September , % Figure 1.2. Contribution of the resources components to the GDP formation in QIII:2016 and increase of GDP compared to QIII: 2015, % Figure 1.3. Contribution of the components by use to the GDP formation in QIII:2016 and increase of the GDP compared to QIII:2015 (%) Figure 1.4. Indexex of industrial production in January-September , % Figure 1.5. Infra annual indexes of industrial production volume in September 2014-September 2016, % Figure 1.6. Dynamics of agricultural production volume in January-September Figure 1.7. Indexes of average yield per hectare for main agricultural crops in the first 9 months of 2016 compared to the same period of the previous year, % Figure 1.8. Dynamics of annual production of main livestock products in households in Figure 1.9. Structure of investment in long-term assets in January-September 2015, % Figure Dynamics (volume and value) indexes in domestic trade, % Figure Dynamics of industrial production index in January-September 2016,% Figure Dynamics of investment index in fixed assets in January-September 2016, %.. 26 Figure Annual growth rate of CPI and its components, % Figure Annual growth rate of CPI and core inflation, % Figure Annual growth rate of industrial production prices and its components, % Figure Development of the average monthly nominal exchange rate of MDL in relation to USD and EURO Figure Annual growth rate of CPI in the region from the left bank of the Dniester River, % Figure Development of interest rate on monetary policy instruments of the National Bank of Moldova, during the period Figure Ratio of required Reserves at NBM, % Figure Structure of money supply M Figure Dynamics of NPB revenues and expenditures in Figure Structure of current NPB revenues on September 30, 2016, million MDL Figure Public finances deficit, million MDL Figure Dynamics of external debt during the period , %, million USD Figure Development of bank capital quality Figure Development of quality of bank capital,
9 Figure Dynamics of liquidity principle I and II in the banking sector, % Figure Development of banking return and profitability Figure Weight of non-performing loans in the banking sector, % Figure Development of credit portofolio quality in banks under special supervision, September Figure Annual growth rate of loans in foreign and national currency, % Figure Development of banking margin*, average interest rates on deposits and loans in MDL and foreign currency, % Figure Development of deposits attracted by banks, mln. MDL Figure Annual growth rate of assets, deposits and bank loans in Transnistrian region,% Figure 4.1. Remittances from abroad made in favour of individuals quarterly, Figure 4.2. Monthly development of exports during , million US Dollars Figure 4.3. Exports of the Republic of Moldova by groups of countries, quarterly in 2016, million US Dollar Figure 4.4. Monthly development of imports during , million US Dollars Figure 4.5. Imports of the Republic of Moldova by groups of countries, quarterly in 2016, million US Dollar Figure 4.6. External trade trends during , million US Dollars Figure 4.7. External trade in Transnistrian region in the first 10 months of , million US Dollar Figure 4.8. External trade in Transnistrian region in the first 9 months of 2016 compared to the same period of the previous year Figure 5.1. Dynamics of registered and deregistered enterprises in QIII , units Figure 6.1. Natural movement of population in Q III in the period Figure 6.2. Trends in activity, employment and unemployment rates of the population aged 15 and over, in QIII in the period Figure 6.3. Dynamics of monthly nominal salary in budgetary and real sector in January September 2016, MDL Figure 6.4. Dynamics of households disposable revenues, nominal value and growth rates, by quarters, Q I 2012 Q III Figure 6.5. Dynamics of consumer expenditures, nominal value and growth rates, by quarters, Q I 2012 Q III
10 MAIN POLITICAL, ECONOMIC AND SOCIAL EVENTS FROM THE REPUBLIC OF MOLDOVA The first nine months of 2016 have been marked by several important events of political, economic and social nature. July 1 The Association Agreement between the European Union and the European Atomic Energy Community and its Member States, on the one hand, and the Republic of Moldova, on the other hand has come into effect. The Agreement shall take effect as a result of completion of all internal procedures at the EU level, on the strength of the termination of agreements ratification process by all 28 Member States and the European Parliament in July 1 The Parliament of the Republic of Moldova has voted in final reading the draft Law on State Budget for The document has been voted by 51 MPs. July 5 15 A new IMF mission led by Ms. Ivanna Vladkova-Hollar has begun her visit to Moldova. The main goal of the mission is to create the necessary preconditions to reach an agreement on the set of measures to maintain the macroeconomic stability, improve the management quality and develop the shareholders transparency in the banking sector and to contribute to the sustainable economic growth. July 8 The Board of Directors of the World Bank approved the allocation of a credit worth 10 mil. MDL for Moldova for additional funding of the project "Competitive Agriculture in Moldova" (MAC-P). The project aims to increase the competitiveness in the agrifood sector of Moldova by supporting the modernization of food safety management system, facilitating farmers' access to markets and rationalization of agroecological and sustainable practices of land management. July 11 The Deputy Prime Minister, Minister of Economy of Moldova, Mr. Octavian Calmic, participated in the seventh informal meeting of economic ministers of the Eastern Partnership countries in Kiev. At the meeting, the Ministers of Economy of Moldova, Ukraine, Azerbaijan, Belarus, Georgia and representatives of various structures of the EU have discussed issues related to economic reforms whicht can increase the potential of SMEs and the perspectives of a more efficient recovery by SME of new trade opportunities through their integration into European and regional chains of added value. Mr. Deputy Prime Minister presented the experience of Moldova towards developing and supporting SMEs and the policies promoted by the Chisinau authorities in that direction. July 12 Within the Academy of Science of Moldova took place a public presentation of the final report of analysis and evaluation of the current system of research-development-innovation in the Republic of Moldova. The report was drafted after the European exercise by an independent team of experts. At the event of report presentation attended ASM members, decision makers in science, representatives of ministries, respondents for science in universities, representatives of diplomatic missions accredited in Moldova, business environment, civil society, EU mission, 10
11 scientific researchers. In his inaugural address, the President of the Academy of Science of Moldova, the Academician Gheorghe Duca, offered thanks to the experts for their involvement and effort in the preparation of the report and for the suggestions offered on reforms which the Academy has already started, but will surely help to improve the researches administration in Moldova and to identify the ways to attract the decision makers in this activity and, not least, to boost the performance of researchers as to be more active active in the research programs. July 21 The Government of the Republic of Moldova approved a draft Law on the implementation of a sole report on salary payments and related taxes. Its purpose is to facilitate the work of entrepreneurs and reduce the volume of data required to be submitted to public authorities. Legislative amendments simplify the process of financial and statistical reporting by launching a single reporting platform managed by the State Tax Service. August 8 The Executive Committee of the National Bank of Moldova adopted the maintenance of the base rate applied on the main monetary policy operations on short term at the level of 10.0 percent annually; keeping of interest rates on overnight credits at 13.0 percent annually and overnight deposits at the level of 7.0 percent annually. In the same context, the required reserves norm from means attracted in freely convertible currency is mentained at the level of 14.0 percent of the computation base and required reserves norm from means attracted in MDL and nonconvertible currency is mentained at the level of 35.0 percent of the computation base. August 25 The Executive Committee of the National Bank of Moldova adopted the maintenance of the base rate applied on the main monetary policy operations on short term at the level of 10.0 percent annually; keeping of interest rates on overnight credits at 13.0 percent annually and overnight deposits at the level of 7.0 percent annually. In the same context, the required reserves norm from means attracted in freely convertible currency is mentained at the level of 14.0 percent of the computation base and required reserves norm from means attracted in MDL and nonconvertible currency is mentained at the level of 35.0 percent of the computation base. 13 septembrie Hungary will credit Moldova with 61 mil. EUR to strengthen the trade relations between enterprises and economic agents of the two countries. Thus, Hungary reiterate its further cooperation with Moldova, particularly in the pharmaceutical field, agriculture and economy. September 26 The Minister of Transport, Mr. Iurie Chirinciuc and head office of EIB in Moldova, Mr. Antonio Castilllo have signed a financing agreement under which the European Investment Bank will grant a loan worth 52.5 mil. EUR for modernization of railways in Moldova. Under the agreement, 50% of the amount will be used to purchase locomotives and the other 50% for the rehabilitation of existing infrastructure. September 28 European Bank for Reconstruction and Development will grant the amount of 41 mil. EUR to expand the gas pipeline Iasi-Ungheni to Chisinau to increase Moldova's energy security through diversification of gas supply. 11
12 September 29 The Executive Committee of the National Bank of Moldova has approved the reduction of the base rate applied on the main monetary policy operations on short term by 0.5 percentage points, from 10.0 to 9.5 percent annually; decrease in interest rates on overnight loans by 0.5 percentage points, from 13.0 to 12.5 percent annually and overnight deposits by 0.5 percentage points, from 7.0 to 6.5 percent annually. There are also mentained the required reserves norm from means attracted in freely convertible currency at 14.0 percent of the computation basis and required reserves norm from means attracted in MDL and non-convertible currency at the level of 35.0 percent of the computation base. 12
13 EDITION SUMMARY Production In the first nine months of 2016, the GDP of the national economy registered a growth (in real terms) of 3.3% compared to the same period of the last year. The moderate pace recorded by the main macroeconomic aggregate in the analysed period was conditioned by the cumulative effect of a favorable agricultural year and phased restoration of the banking system. The most significant influence on GDP growth had the gross value added in: wholesale and retail trade by 0.8%; agriculture, forestry and fishing by 4.9%; mining and manufacturing; professional, scientific and technical activities each by 0.2%; taxes on products by 0.4%. The industrial sectors which generated the largest contribution to the slowdown rateof industrial production growth were: electrical equipment manufacturing causing the loss per total industry by 1.6%, production, transport and distribution of electricity by 7.2%, other non-metallic mineral products, etc. These activities have contributed to the decrease in total industrial production by 0.7 and 0.6%, respectively compared to the same period of The agricultural production in all categories of households in the first nine months of 2016 increased by 18.9% compared to the same period last year, caused exclusively by the increase of vegetable production by 28.4% and livestock production by 2.4%. Enterprises of railway, road, river and air transport have carried thousand tons of commodities while in the same period in 2015 ( tons of commodities) and executed a commodities mileage by 1.9% less than in the same period of the last year. During this period, the number of transported passengers decreased by 0.4% and passenger path by 12.1% sply due to the registered rises in transportation by trolley buses, taxis and air transport. The volume of investment in long-term assets in the national economy amounted to mln. MDL, marking a decrease by 17.6% (in comparable prices) sply. During the analysed period, in the structure of investment in tangible assets by types of fixed assets, the prevailing weight as in the previous year, belongs to the equipment, machinery, transmission installations (37.5%). Prices and exchange rates In the first nine months of 2016, the consumer price index rose by 7.8% and decreasing its growth rate by 0.6 p.p. compared to the same period last year. In the same period, the CPI components have recorded the following increases: food products 8.9%, non-food products 7.4%, services 6.7%. In the third quarter of 2016 the annual rate of inflation fell to 4.5%, falling within the target established by NBM constituting by 6.6 p.p. less than the level recorded in the same period last year. The downturn is maintained in the following months, the CPI being 2.6% and 2.5%, respectively in October and November this year. In this period, the drop of the annual rate of inflation was driven mainly by gradually neutralizing of damages influence caused by the loot of the banking system, low domestic demand and comparison high base of indices registered in Since the beginning of the year, the core inflation has changed its increasing trend pursued by the end of 2013, decreasing gradually and in the third quarter of 2016 accounted for 9.6% sply. Since May 2014, the annual rates of core inflation rose faster than CPI. This decrease is due to the pressures drop from food prices on CPI, which are not taken into account to the calculation of core inflation. 13
14 In the third quarter of 2016, other price indices have also registered uneven growth, which compared to the same period last year had the following developments: Index of industrial production prices decreased by 5.4%, less by 0.6 p.p. compared to the same period of the previous year; In construction sector the prices rose by 0.4 p.p. compared to the level registered in the same period, last year amounting to 8.3%; Producer prices for agricultural products have decreased 7.5% compared to the same period of 2015; The fuel prices have decreased by 4.06% sply and this is due especially to the introduction of correlation of these prices with quotations from regional and international markets. In quarter III of 2016, the the average nominal exchange rate against the major reference currencies was 22.1 MDL / EUR and 19.8 MDL / USD depreciating compared to the same period of the previous year by 2.3% against euro and by 2.1% against the US dollar. Monetary policy In quarter III of 2016, the NBM has reduced the monetary policy rates by 3 p.p. compared to the level of the previous quarter. After the significant reduction in the first half of the year of the monetary policy interest rate at the beginning of the third quarter this was reduced once again up to 13%. The relaxing decisions of the monetary conditions have not affected the required reserves rate. In quarter III of 2016, the NBM maintains the reserve rate from the funds attracted in MDL and non-convertible currency to 35%, by 15 p.p. over the historical maximum of MMR rate recorded in The ratio of required reserves from the funds attracted in convertible currencies remained at the same level of 14%. In the third quarter of 2016, the NBM intervened on the interbank foreign exchange market as a buyer exclusively, which favored the growth of the official reserve assets balance. The balance of official reserve assets at the end of September 2016 amounted to 2.15 bln. USD, increasing by 21% sply. The stock increase of the official reserve assets was determined not only by the domestic exchange market intervention of the NBM as foreign exchange purchases as well as recording the credits and grants in favour of the Ministry of Finance of Moldova, revenues from foreign exchange reserves management, etc. In the third quarter of 2016, the growth rate of all components of money supply returns to positive developments after two years of volatile developments, mostly negative. The main contribution to the money supply growth have had the components of M2 monetary aggregate, especially term deposits in national currency. Public finances The problems of the financial sector in recent years, leaves a negative mark on the budgetary year Thus, the growth rate of revenues was placed below the average registered during and was lower to the public expenditures dynamics in this year. However, in nine months of 2016, the revenues of the national public budget, despite the existing constraints had a moderate rise around 2% sply. To the increase of the public budget revenues contributed both tax and non-tax revenues and the increase of some fees and taxes. In this context, the NPB expenditures in the third quarter 2016 increased by higher rates to the revenues supported mainly by the weight of socio-cultural expenditures (53%). Therefore, the national public budget execution in nine months of 2016 resulted in a deficit in the amount of mln. MDL, increasing by 21% compared to the same period last year. As for the public debt at the end of September 2016, it is seen a moderate reduction in the weight of public sector debt to GDP (0.8 p.p. compared to 2015). And nine months of 2016, the grants increased to mln. MDL. So the latest developments in the economic environment and legislative environment in force were reflected negatively on revenues and budgetary expenditures in the last nine months of 14
15 2016. So, the public finances are in deadlock because of the delayed external financing. The law on State Budget for 2016 is based largely on external aid to finance the deficit. Banking sector The deterioration of the economic climate has had a negative effect on the quality of the loan portfolio in recent years. This has become more visible, especially in the period and 2016, registering a more pronounced deterioration of loan portfolio quality to some banks, generated mainly by the slowdown of the economic activity, inflation growth and depreciation of the national currency. These years can be considered "the toughest years" for Moldova, embodied with the liquidation of three financial institutions (B.C. Unibank S.A., B.C. Banca Socială S.A. and B.C. Banca de Economii S.A 1 ) and the establishment of special supervision to the largest banks in Moldova, namely in BC Moldova Agroindbank, B.C. Victoriabank and B.C. Moldindconbank 2 at NBM decision. Against the crisis at the regional level and that seen in some banks, the opportunity to obtain a bank loan remains to be limited in the recent period equally by the prudential accentuation at the level of commercial banks. Also at the end of 2015 and 2016, the banking sector stability was tested again the lack of transparency of the shareholder structure and commitment in high-risk transactions, having a negative effect on the bank management quality. This effect can be observed in the three Moldovan commercial banks from the Republic of Moldova, which are under special supervision (BC Moldindconbank S.A., B.C. VICTORIABANK S.A. and BC MOLDOVA - AGROINDBANK S.A.). The risks are major for these financial institutions and for the entire domestic banking sector. The essential goal of the new management of the central bank remains to be the strengthening of the financial stability ensuring that the domestic banks act promptly to any risk in the sector, to remedy the weaknesses highlighted by the economic shocks in recent years. So, the responsibilities fallen into the financial stability goals are exercised both by regulation and prudential supervision of the institutions under its authority, and the formulation and effective transmission of monetary policy measures and supervision of operation in optimal conditions of payments systems and clearings of systemic importance. The National Bank of Moldova, as a supervisory authority has to have a tighter supervision on the commercial banks and to react promptly to the measures for improvement of the prudential regulation framework. External sector The remittances of Moldovans who work abroad continue the decreasing trend in this period. Thus, in the nine months of 2016 the remittances from abroad have been reduced to million USD. Foreign trade with goods of the Republic of Moldova during the period January-September 2016 indicates a decrease by 1.8% or by 81.8 mln. US Dollars sply. In the 9 months of 2016 the foreign trade with goods amounted to mln. Us Dollar. Goods exports, during the period January-September 2016 amounted to mln. US Dollar, by 1% less compared to the same period of the previous year. In September 2016, the goods exports amounted to mln. US Dollars or by 18.5% more compared to September 2015 and by 15.2% more compared to the previous month (August 168 mln. Dollars). Goods imports, during the period January-September 2016 continued to decline amounting to mln. US Dollars with a volume by 2.2% lower compared to that from the same period of the previous year. 1 Through the decisions of the Executive Committee no.62, no. 63 and no. 64 of the National Bank of , the licenses for carrying the financial activity of the Banca de Economii S.A., BC BANCA SOCIALA S.A., respectively B.C. UNIBANK S.A. were withdrawn and the processes of their forced liquidation initiated. 1 The decision was taken under the Law of financial institutions. 15
16 Commercial balance deficit, in January-September 2016 amounted to mln. US Dollar by 51.6 mln. US Dollar or by 3.4% less sply due to the disparity between the development of exports and imports. Turnover of external trade in Transnistrian region in the first 9 months of this year decreased by 25.5% or by mln. US Dollar compared to the same period of the last year. Business environment In Q III of 2016, the number of enterprises registered by the State Registration Chamber has diminished by 5.1% sply continuing its decreasing trend registered in QIII of (exception Q III 2013 and Q III 2014 in which was registered an increase). According to the data of the State Registration Chamber in QIII, 2016 there were registered 1304 new enterprises in the State Register. In QIII, 2016 it is attested a decrease in the number of deregistered enterprises by 19.4% sply. Thus, in Q III of 2016 the number of deregistered enterprises amounted to 983 units. Social sector Demographic situation. III Quarter of 2016 is marked by a bigger reduction in the number of deaths compared to the decrease of live births, compared to III quarter of last year. Therefore, there is a poor improvement of the natural decrease compared to the same period last year. The total number of live births in the country amounted to pers., decreasing by 2.3% sply, the birth rate was 10.6 births per 1000 inhabitants. Mortality was persons, registering a decrease of 3.7% sply, and the mortality rate was 10.8 deaths per 1000 inhabitants. The number of marriages in the country was 16872, decreasing by 9.9% compared to the same period last year, while the marriage rate was 6.3 marriages per 1000 inhabitants. The indicator for the number of divorces in the country was 7955, decreasing by 4.3% compared to the same period last year. The divorce rate made up 3.0 divorces per 1000 inhabitants. Labor market. In Q III of 2016 the active economic population amounted to thousand persons, decreasing by 0.9% sply. The activity rate of population was 44.8%, which is slightly decreasing by 0.4 p.p. sply. The employed population was thousand pers., decreasing by 0.5% compared to the same quarter in The unemployment rate in the country reached 2.9%, which is almost at the level of Q III of The inactive population aged 15 and over represented 55.2% of total population of the same age category without significant changes compared to the same period in The National Agency for Employment has provided 7312 jobs, representing 79% of total job vacancies for people with a professional education, general education and unskilled workers and for those with higher and specialized secondary education 1929 or 21% of total. Labor remmuneration. Q. III, 2016, in September the nominal average salary was MDL, registering an increase of 10.1% sply. The real salary index for September 2016 compared to September 2015 was 106.9%. The average salary amounted to MDL in September, this year (+ 8.0% compared to September 2015), in the economic (real) sector MDL (+ 10.8% compared to September 2015). Compared to the same period of the previous year in the third quarter of 2016, the real salary indices were much higher, registering an increase in the real salary amount namely in August-September 2016 compared to the same indices of the same period in 2015 when these declined. According to official statistics it appears that most of the disposable revenues of the Moldovan population are the salaries. In the analysed period, the weight of salaries is 41.6% in total disposable revenues structure. So this indicator is the main component in the revenues of population but compared to Q III of the previous year, the contribution of these revenues increased by 1.7 p.p. 16
17 Disposable monthly revenues of the population in Q III of 2016 per capita were MDL more by 5.2% than in the same quarter of In real terms, the increase is insignificant 0.7%. Average monthly consumption expenditures of the population in Q III 2016 amounted to MDL increasing in nominal value by 3.2% compared to Q III of the last year but in real value they were reduced by 1.3%. Social protection of population. According to data provided by the National Social Insurance House, the number of pensioners registered with the social protection bodies as of October 1, 2016 amounted to thousand persons or by 10.4 thousand persons more compared to October 1, The average amount of the monthly pension amounted to MDL, by 9.5% more compared to the same period of the last year. 17
18 Chapter I PRODUCTION 2 Gross Domestic Product In January-September 2016, in nominal value, the GDP amounted to mln. MDL, current market prices, increasing in real terms by 3.3% compared to the same period of the previous year Jan. - Sep. of previous year = 100 Jan.- Sep. 2009= ,4 123,7 124,3 118,2 106,5 106, ,7 112,9 104,9 104,7 103,3 99,8 100,5 98,3 92, Figure 1.1. GDP dynamics in January-September , % Source: Calculations of the author according to the data of the NBS. During the nine months of 2016, it is attested a continuing trend of the annual growth rates in the GDP volume from 0.8% in Q I to 1.8% in Q II and in Q III the economy has registered a 6.3% increase sply (in gross batch). The boost of the main macroeconomic aggregate in quarter III was determined mainly by the increase of the Gross Value Added (GVA) in the following branches of the national economy: - Agriculture, forestry and fishing, whose activity volume increased by 24.2% determining the GDP increase by 4.9%; - Wholesale and retail trade, maintenance and repair of vehicles and motorcycles registered the GVA increase by 6.8% leading to the GDP increase by 0.8%; - GVA which belongs to mining and manufacturing industry; transport and storage; information and communication sectors increased by 1.2%; 3.3% and 2.9%, respectively contributing to the GDP increase each by 0.2%. - Growth in net taxes on products generated an increase of 0.4%. The positive influences on GDP produced by the above mentioned activities were partially mitigated by the GVA reduction registered by constructions by 2.8% sply and other activities by 5.3% (Fig.1.2.). 2 The analysis is presented without the data on enterprises and organizations from the left bank of the Dniester River and Bender municipality based on the official statistics compiled by the National Bureau of Statistics. In some cases, apropriately specified, available data regarding the Transnistrian region, disseminated by the regional statistical body are presented. 18

19 110 6,3 Share in GDP, % Contribuition to GDP growth, % , ,6 11,7 0,2 GDP Total GVA agr. GVA industry 0,8 11,9 GVA trade 0,2 4,8 GVA transport -0,1-0,5 9,1 3,7 GVA constr. GVA other services 0,5 0,2-1,2 FISIM 14,1 Net taxes on products Figure 1.2. Contribution of the resources components to the GDP formation in QIII:2016 and increase of GDP compared to QIII: 2015, % Source: Calculations of the author according to the data of the National Bureau of Statistics. On the uses, the main positive contribution on GDP has had the final consumption which set to GDP a 4.2% gowth sply being generated by the household consumption. A 0.9% increase was due to the growth in gross capital formation. The export of goods and services advanced in a greater measure by 5.9% compared to the import by 4.7%. So, the commercial balance has been contracted with a GDP increase of 1.2% (Fig.1.3) ,3 100 Share in GDP, % Contribuition to GDP growth, % 4,2 85,3 14,4 21,8-0,3 GDP total FCH FCPA GFCF Stock variation 1,2 1,2 2,2-23,7 Net exports Figure 1.3. Contribution of the components by use to the GDP formation in QIII:2016 and increase of the GDP compared to QIII:2015 (%) Source: Calculations of the author according to the data of the National Bureau of Statistics. Industry During the period January-September 2016, the industrial production in Moldovan economy fell by 0.2% compared to the same period of the previous year, while marking an increase of 35% compared to 2009 (Fig. 1.4.). 19
20 ,3 106,3 117,4 115,5 110,4 98,4 130,4 135,3 135,0 122,8 106,3 106,2 103,8 99, , Jan. - Sep. of previous year = 100 Jan. - Sep. 2009=100 Figure 1.4. Indexex of industrial production in January-September , % Source: Calculations of the author according to the data of the National Bureau of Statistics. This effect was sustained by the volume decrease in mining industry by 16.7%, production and supply of electricity and heat energy, gas, hot water (-7.8%), which have contributed to the decline in total industry by 0.6% and 1%, respectively (Table 1.1). Under the influence of the positive development of the manufacturing industry 1.7%, the total industrial production volume in the country increased by 1.4%. Table 1.1. Dynamics of the industrial production by main types of activities in January-September 2016,% Indices of industrial production: 2016/2015 Weight of gross added value, % Degree of influence on production volume variance (+/-), % Industy Total Mining industry Manufacturing industry Of which food industry Production and supply of electricity and heat industry, gas, hot water and conditioned air Source: Acording to the data of the National Bureau of Statistics At the disaggregated level, the industrial sectors which generated the largest contributions to the slowdown of industrial production growth rate fell under the head of: manufacture of electrical equipment (with a weight of 5.4% in gross value added in industry), causing the loss in total industry of 1.6%, production, transport and distribution of electricity (9.2%) by 7.2%, manufacture of other non-metallic mineral products (with a weight of 9.3% in gross value added in industry), etc. These activities have contributed to the decrease in total industrial production by 0.7 and 0.6%, respectively compared to the same period of In food industry, the largest contribution to the global industrial production growth was marked by the activity of processing of dairy products (5.7%, justifying an increase of the indicator by 0.3%). At the same time, the largest contribution to the slowdown in industrial production growth belonged to processing and preservation of fruits and vegetables activities (3.8%) by 13.7% and production of non alcoholic soft drinks; production of mineral waters and other bottled waters - by 35.5%, explaining the decrease in total industry by 0.6%. (Fig. 1.5) Analyzing the monthly indices of industrial production it is seen that, unlike the positive growth rates from March, April and August 2016, in other months the industrial production volume drops compared to the same period last year. As a result, the cumulative production indices (from the beginning of the year), mark a downward trajectory at the end of the analysed period. 20
21 115 Corresponding month of the previous year =100 Corresponding period of the previous year = Sep.2014 Dec.2014 Mar.2015 Jun.2015 Sep.2015 Dec.2015 Mar.2016 Jun.2016 Sep.2016 Figure 1.5. Infra annual indexes of industrial production volume in September 2014-September 2016, % Source: Acording to the data of the National Bureau of Statistics. Agriculture In the first nine months of 2016, the agricultural production in all households categories was increasing by 18.9% compared to the same period last year, due exclusively to the increase of vegetable production by 28.4% and livestock production by 2.4% ,7 112,7 108,7 103,7 88,4 130,2 115,1 125,0 108,6 110,2 131,0 118, ,8 88,2 78, Jan. - Sep. of the previous year = 100 Jan. - Sep. 2009=100 Figure 1.6. Dynamics of agricultural production volume in January-September Source: Calculations of the author according to the data of the National Bureau of Statistics. The increment of the vegetable production is explained by the favorable weather in the first half of the summer in 2016, which was ultimately beneficial to crop growth and development. In Fig it can be followed the annual indices of the average harvest in agricultural enterprises 3 according to data of October 1, 2016 sply reflecting yield rises for all main crops, while for potatoes the production yield drops significantly. 3 Average harvest per hectare of crops in agricultural enterprises and homesteads (farm) with farmland area of 50 hectare and over. 21

22 Grapes Stone fruit Fruit Seeds Field vegetables Potatoes Sunflower Cereals and leguminous beans Figure 1.7. Indexes of average yield per hectare for main agricultural crops in the first 9 months of 2016 compared to the same period of the previous year, % Source: Calculations of the author according to the data of the National Bureau of Statistics. During the analysed period, all categories of households have increased by 2.4% in the livestock production sply being influenced by the increment of production in agricultural enterprises by 7.8% as a result of the higher average effective of livestock and poultry by 2.8% and the gain weight of cattle and pigs. In households, the volume of (raising) cattle and poultry remained at the same level of the previous year level. The milk production increased by 0.3%, including the agricultural enterprises by 4.6%, households by 0.1%, in the wake of cows productivity increase both in agricultural enterprises (by 5.2%), and households (by 1.7%). The volumes produced in 2015 in households are significantly lower compared to previous years. In case of milk production, it is 70% lower in 2015 compared to the volume in In Figure 1.8. there can be observed the negative rates recorded in the period Egg production in all categories of households increased by 9.2% due to an increase of laying-hens livestock in agricultural enterprises (by 28%) Product Cattle and poultry Milk Eggs Wool % Change 2015/2001 % Change 2009/ % 0% -70% -45% -48% -38% -65% -48% Cattle and poultry (live weight), thousand tons Eggs, million Milk, thousand tons Wool (in natural weight), tonnes Figure 1.8. Dynamics of annual production of main livestock products in households in Source: Calculations of the author according to the data of the National Bureau of Statistics. 22
23 Although the data for the first nine months of the year register growth rates, year on year, the data for the whole year shows a significant decline in livestock production in recent years in the national economy, this trend being impressed by the downward trend recorded in households that own the largest weight in total volume of livestock production. Investment in long-term assets During the period January-September 2016, the investment in long-term assets in the national economy amounted to mln. lei, their amount marking a decrease of 17.6% sply. During reviewed period, in the structure of investment in tangible assets by types of fixed assets, the prevailing weight as in the previous year is for equipment, machinery, transmission installation (37.5%). But to this type of fixed asset the investment have evolved descendantly (-26.3%), as in capitalized investment for construction and development of residential and nonresidential buildings and other types of fixed assets have registered annual decreases by 6% 22.9% and 14.1%, respectively sply against the investment increase in means of transport by 15.1% (Fig. 1.9). Types of fixed assets Resid constr. Non-resid. const. 15,3 16,6 Equipment, machinery 37,5 Transp. vehicles 9,2 Other 21,4 Funding sources StateLocal 3,4 4,7 Business and population 69,2 ForeignOther sources 5,8 16,9 Figure 1.9. Structure of investment in long-term assets in January-September 2015, % Source: Calculations of the author according to the data of the National Bureau of Statistics. As in the previous year the investment remain to be financed mainly from own sources of economic agents and population holding about 70% of total finances. At the same time their volume has negatively influenced the dynamics of the investment volume. Trade and other services for market 0% 10% 20% 30% 40% 50% 60% 70% 80% 90% 100% After 2015, when the domestic trade of goods and services has registering altogether decreasing annual indices, in January-September 2016 it is attested a pronounced increase in the monthly development of the main indices. The volume of retail trade (excepting the trade in car and motorcycle) was up by 0.4% in the first nine months of the year compared to same period of the previous year (compared to the decrease of 4.5% in January-September 2015 sply). (Fig. 1.10) The volume of market services for population in January-September 2016 increased by 15.4% sply, high pace compared to developments attested in the same period of the previous year (1% sply). Significant increases were recorded in trade in car and motorcycle. In the first nine months of 2016, the turnover in this trade went up by 19.3%. For reference, in the same period last year, this indicator decreased by 12.7% sply. At the same time, the value of turnover in wholesale trade excluding the trade in car and motorcycle in January-September 2016 increased only by 0.5% (in the adequate period of 2015 by 7.5%) sply. 23
24 140 Retail trade (volume) Market services for population (volume) Retail and wholsale trade, auto repair (value) Wholesale trade (except auto trade) (value) Jan Feb.2016 Mar.2016 Apr.2016 May 2016 Jun Jul Aug Sep.2016 Figure Dynamics (volume and value) indexes in domestic trade, % Source: Calculations of the author according to the data of the National Bureau of Statistics. Transports During the period January-September 2016, the railway, road, river and air enterprises have carried thousand tons commodities while in the same period in 2015 ( thousand tonnes commodities) and executed a commodities mileage by 1.9% less than during the same period of the previous year. Table 1.2. Volume indices of commodities transported and mileage of commodities by transport enterprises in January-September 2016 by modes of transport, % Transported commodities - total, thousand tonnes January-September 2016/January- September 2015 Structure by means of transports Contribution to the increase in the volume of transported commodities and commodities mileage (+/-) Of which by means of transport: Railway road Fluvial Air Mileage of commodities total, mln. tons-km Of which by means of transport: Railway road Fluvial Air Source: Calculations of the author according to the data of the National Bureau of Statistics. In January-September 2016 the volume of transported commodities, by fluvial transport means(100 thousand tons of goods) fell by 13.3% less than in the same period in The most 24
25 significant impact on decreasing in total mileage of commodities was generated by the contraction of the railway transport (influencing the decrease in total mileage of commodities by 27.2%). The contraction of railway mileage of commodities recorded a reduction of 7.5%, and the road one has contributed to an increase of 5.6% in total commodities mileage, which was reduced accordingly by 1.9%. Simultaneously, an increase in the activity of passenger mileage was registered. Thus, the number of transported passengers during this period decreased by 0.4% and the passenger mileage - by 12.1% sply due to the rises recorded in the trolley buses, taxis and air transport. The main impact on the increase in passenger transport activity was exercised by the trolley buses transport which marked an increase in the number of transported passengers and their mileage more than 18%. However, the number of passengers who traveled by buses and minibuses has decreased by 10.8%, their mileage was increasing by 3.1%. By 11.5% fewer passengers have traveled by railway transport, by 28.4% less sply. Tourism In the period January-September 2016, the tourist accomodation structures of the country hosted thousand tourists increasing by 8.6% compared to the same period of the previous year. The resident tourists acounted for 63.7% and non-residents 36.3%. By types of accomodation, the largest weight of tourists pertained to traditional hotels and motels 47.5%, holiday camps for students amounting to 19.3%, vacation villages and other accomodations 14.2%, recovery facilities 9.7%, touristic and agro-touristic pensions 7.6% and hotels for visitors 1.7%. Though, the number of tourists has increased, the number of overnight stays decreased by 3.6%, especially in the holiday camps for students (-11.7%), recovery facilities (-5.4%), hotels for visitors (-4.3%) and in hotels and motels (-3.7%). Of the total number of overnight stays about 85.3% pertained to the resident tourists and 14.7% non-residents. The total number of tourists and excursionists who benefited from services of travel agencies and tour operators in the 9 months of 2016 amounted to thousand persons or by 5.3% less sply. The number of participants in the inbound and outbound tourism decreased by 3.6% and 8.4%, respectively while in the domestic tourism their number increased by 13.4%. The biggest part of tourists and excursionists arrived in Moldova came from Romania (18.2%), Russian Federation (12.4%), Germany (10.6%) and Ukraine (8%). Production activity in the region of the Republic of Moldova from the left of the Dniester River and Bender 4 municipality Accoring to the information disseminated by the statistical authority from the Transnistrian region, the index of the industrial production for the period January-September 2016, in the region from the left of the Dniester river and Bender municipality amounted to 96.6% sply 5. Thus, the volume of industrial production slid to the level of about 92% of the total volume posted in The increase in the first 9 months of this year was determined by the contraction of activity in the most industrial branches. Thus, the electroenergetics, iron industry and printing industry have decreased by (-2.9%), (-19.8%) and (-50.2%) respectively, the other industrial branches have registered strong contractions compared to the same period of the last 4 According to the data of the statistical authority from the transnistrian region: Because of the partial implementation of the international standards in compiling official statistics by the statistical authority from the transnistrian region, as well as reduced access to metadata, data comparability with those prepared by the NBS is limited and difficult to assess. 5 Industrial enterprises, excepting the small business sector. 25
26 Jan. - Sep. of previous year = 100 Jan. - Sep. 2009= , ,6 106,6 95,0 94,4 97,5 102,6 75,5 105,1 94,8 90,2 91,6 96, , , Figure Dynamics of industrial production index in January-September 2016,% Source: Calculations of the author according to the data of the statistical authority from the Transnistrian region. year: food industry by 2.4%, light industry by 11.5%, building materials industry by 28.3% and chemical industry by 52.7% etc. As in the region from the right of the Dniester River, the volume of agricultural production in the transnistrian region has marked negative developments, industrial production decreasing by 9.4% sply. This trend was determined by the reduction of the vegetable production by 24%. Given that investment in fixed assets, are by their nature sensitive to the economic fluctuations, in the reference period these contracted by 12% sply 6, dropping down to 87% compared to the ,7 184, ,0 128,6 115, ,4 87,0 114,6 103,3 97,4 91,2 74,2 62,3 62, Jan. - Sep. of previous year = 100 Jan. - Sep. 2009=100 Figure Dynamics of investment index in fixed assets in January-September 2016, % Source: Calculations of the author according to the data of the statistical authority from the Transnistrian region. 6 Without small business sector. 26
27 level registered in The investment in building, expansion and technical equipment of objects with productive destination representing the largest weight (82%) in total value of investment have been reduced in physical terms by 15.6% sply. By directions of investment, the greatest flow of investment in fixed assets (44.3%) pertained to industry, followed by trade and food (11%), communications (9.9%), etc. Also, the turnover in the domestic trade of the region decreased accounting for 94.4% during the reference period compared to the same period of the last year. In terms of trade structures, the food products amounted to over 47% (+0.9 p.p. sply), and non-food ones about 53% ( 0.9 p.p.). 27

28 Chapter II PRICES, EXCHANGE RATE AND MONETARY POLICY 2.1. Prices and exchange rate Prices Since the beginning of this year, the consumer price index had a decreasing constant trend. In the first nine months of 2016, the CPI increase accounted for 7.8%, by 0.6 p.p. less compared to the same period of the previous year, in the same period, for CPI components have been registered the following increases: food products 8.9%, non-food products 7.4%, services 6.7%. In quarter III of 2016, the annual rate of inflation descended to 4.5%, being at the upper limit of the target set by the NBM and constituted by 6.6 p.p. less compared to the level attested in the same period last year. The monthly developments show a decrease in the annual rate of inflation, the gowth rate of prices in July, August and September 2016 sply being 7%, 3.6% and 3%. This trend remains the same in the following months, the CPI accounting for 2.6% şi 2.5% respectively in October and November this year. The drop of the consumer price index is caused especially by the moderate domestic demand affected by the depreciation of the national currency against the main reference currencies and the effects of the monetary policy promoted by the NBM in the last period CPI, % Food, % Non-food, % Services, % Figure Annual growth rate of CPI and its components, % Source: According to the data of the National Bureau of Statistics. In quarter III of 2016, the consumer price index to food products increased by 6.2%, the growth rate of this indicator diminishing by 4.5 p.p. versus the same period of 2015 (in monthly expression, compared to the same period last year there were produced the following increases: in July 7.9%, in August 6.2%, in September 4.6%). In this period, the fresh fruit prices advanced considerable by 16.1%, especially for citrus fruits by 14.2%; vegetables by 14%, especially for garlic by 37.2%, tomatoes by 27.7%; eggs by 8.6%, sugar by 16.0% and seed oil by 15.9%. Moreover, in this period there have been registered prices decreases for some products. The prices for potatoes, carrots, onion etc. declined. Compared to the same period of 2015, the prices for non-food products in quarter III, 2016 advanced by 5% sply, decreasing the value of this indicator by 7.8 p.p. (in monthly expression, 28
29 compared to the same period of the previous year, increases amounted to: 5.9% in July, 4.5% in August and 4.6% in September). In this period, price rises have been recorded for all non-food products excepting the fuels which prices reduced by 4.1% sply. The highest rates were recorded in prices for cigarettes 16.3%, dry goods items 11.3%, footwear 9.6% etc. the increase in prices of non-food products is a direct consequence of the national currency depreciation which is found in price increase both for imported products and national products produced of imported raw material. In quarter III of 2016, the prices for services increased by 2.1% sply (in monthly expression, compared to the same period of the previous year, the following rises rates were recorded: in July 7.4%, in August - (-)0.4% and September (-)0.8%). In the reference period, compared to quarter III of the previous year, the highest price increases were recorded for breeding and education services - by 12.5%, funeral services by 13.9%, and durable objects repair services - by 10.5%, etc The basic inflation CPI The upper limit of the inflation target set Figure Annual growth rate of CPI and core inflation, % Source: According to the data of the National Bureau of Statistics. The core inflation continues its decreasing trend recorded since February 2016, its growth rate still advancing the CPI dynamics. The annual growth rate of core inflation in January- September, 2016 was of 9.6% sply decreasing by 1.3 p.p. compared to the level reached for the same period of In the third quarter of 2016, the core inflation index was 7.7% sply, by 5.2 p.p. below the level achieved in the same period last year. In monthly expression compared to the same period of the previous year, the growth rate of core inflation recorded the following increases: in July 8.8% in August 7.5% and in September 6.7%. The return of the core inflation on the single-digit level was due to the fluctuations stabilization of the national currency against the US dollar and Euro. In the first nine months of 2016, the annual dynamics of the industrial production prices has slowly fell. This accounted for 5.4%, decreasing by 0.6 p.p. compared to the same period of the last year. In the third quarter of 2016 the annual index of industrial production prices fell by 2.6 p.p. compared to the same period of the previous year and reached 3.5%. Lower values were registered in the production price indices of mining industry by minus 0.8 p.p. to 2.7% and manufacturing by minus 3 p.p. up to 3.5%, sply. A different trajectory described the annual index of production price index in the energy sector, which increased by 0.2 p.p. to 3.6% sply. 29
30 Industry Mining and quarrying Manufacturing Electricity, gas and and water Figure Annual growth rate of industrial production prices and its components, % Source: According to the data of the National Bureau of Statistics. In the third quarter of 2016, the development of prices in construction has marked a seasonal raise peculiar to the period. The growth rate of prices in constructions in the third quarter of 2016 increased by 0.4 p.p. and amounted to 8.3% compared to the level recorded in the same period last year. In quarter III, 2016, the growth rate of prices for agricultural producers showed slight declines. In the the reviewed period, the producer prices for agricultural products decreased by 7.5% compared to the same period of In the corresponding period, both the animal and vegetable products whose prices have decreased by 8.1% and 3.9% respectively sply contributed to the reduction in the annual growth rate of this category of prices. To the price reduction for the agricultural producers have contributed both seasonal factors and the lower world prices for agricultural products. Fuels price down. In quarter III of 2015, the growth rate of fuel prices is down, decreasing by 4.06% sply (in monthly expression, compared to the same period of the previous year, the fuels price indices have registered the following values: in July (-)4.9%, in August - (-) 5.5% and in September (-) 1.8%. The downward trend is mentained also in the first months of the third quarter of the year. This is explained by approving a new methodology of formation and application of fuel prices in this period. The new way to assess the retail sale price for benzine, diesel-fuel and liquid gas (for the liquid gas only until July, this year when legislative amendments became operative which dispossessed ANRE of this competence) provides the correlation of these prices with the quotations from regional and international markets. Exchange rates The fluctuations of the exchange rates mitigate slightly but the depreciation trend of the national currency in relation to the major reference currencies is mentained. 25 MDL/USD rate 23 MDL/EUR rate In quarter III, 2016 the average exchange rate against the major reference currencies amounted to 22.1 MDL/EUR and 19.8 MDL/USD, depreciating by 2.3% against the single European currency and by 2.1% against the US Dollar compared to the same period of the previous year. Figure Development of the average monthly nominal exchange rate of MDL in relation to USD and EURO Source: According to the data of the National Bank of Moldova. 30

31 In monthly expression, the average exchange rate of the national currency against the single European currency had a volatile dynamics equating: in July 21.9 MDL/EUR, in August and September 22.2 MDL/EUR. The average exchange rate of MDL in relation to US Dollar in July- September 2016 remained at the level of 19.8 MDL/USD. In quarter III of 2016 the real exchange rate of the national currency developed differently dependent on the reference currency. The real exchange rate of MDL against USD recorded a slight appreciation of 1.5%, and against the sole European currency a slight depreciation 0.2% sply. Region of the Republic of Moldova from the left bank of the Dniester River At the end of the third quarter, the annual rate of inflation in the region from the left bank of the Dniester River changed its developed trend penetrating into a positive territory. In July-August, the annual growth rate of CPI accounted for 1.5% increasing by 3.2 p.p. compared to the same period of Figure Annual growth rate of CPI in the region from the left bank of the Dniester River, % Source: According to the data of the Central Bank of the region to the left of the Dniester River. During the third quarter of 2016, the Central Bank of the region to the left of the Dniester River has mentained the overall goal of the monetary policy priented toward targeting the exchange rate established since middle of March 2016 at the level of 11.3 PRB/USD under the economic recession pressure from the region. After the interventions of the Central Bank, at the end of quarter I, 2016, the appreciation trend of Transnistrian ruble initiated since September has reduced. The average exchange rate, in the reference period, amounted to rubles for 1 Euro, depreciating by 3% against the value of the same period last year Monetary policy The abatement of inflationary pressures encouraged the National Bank of Moldova to let down the monetary conditions from country in the first nine months of 2016 and to promote a prudential monetary policy given the economic situation which is still uncertain. Instruments of monetary policy In quarter III of 2016, the NBM has reduced the rates of monetary policy by 3 p.p. compared to the level of the previous quarter. In the first half of the year, after the significant attenuation of the interest rate of the monetary policy, at the beginning of quarter III it was reduced again up to 13%. At the same time, in the same measure, the other rates of monetary policy were also reduced, the interest rate on overnight loans laying at the level of 10% and interest rate on overnight deposits - 7%. Subsequently, at the end of September, the NBM has operated another modification of the base rate decreasing by 0.5 p.p. to 9.5% 31
32 Base rate, % The interest rate on overnight loans, % The interest rate on overnight deposits, % Figure Development of interest rate on monetary policy instruments of the National Bank of Moldova, during the period Source: According to the data of the National Bank of Moldova. Required reserves The softening decisions of the monetary conditions did not affect the required reserves ratios. The required reserve ratio immobilizes for over a year a significant amount of the commercial banks resources which could be directed to credit and finance the national economy. In quarter III of 2016, the NBM mentains the reserve ratio from funds attracted in in MDL and non-convertible currency at the level of 35%, by 15 p.p. above the historic high of MMR ratio registered in The required reserve ratio from funds attracted in convertible currencies remained unchanged at the level of 14%. 38 Required reserves ratio from financial means attracted in freely convertible currency, % 33 Required reserves ratio from financial 28 means attracted in MDL and non-convertible 23 currencies, % Figure Ratio of required Reserves at NBM, % Source: According to the data of the National Bank of Moldova. Open market operations and standing facilities In quarter III of 2016, the average monthly balance of sterilization operations was at a superior level to the same period of the last year (plus 2674 mln. MDL) and amounted to 3605 mln. MDL. The highest balance was registered in September 2016 and amounted to 4347 mln. MDL. In the third quarter of 2016 the request for overnight deposits had a volatile dynamics, the average daily balance for July, August and September, 2016 was 538 million MDL, 739 million MDL and 823 million MDL, respectively. In the same period, requests for offering lending facilities have not been received. 32
33 Foreign exchange market interventions In quarter III of 2016, the NBM has intervened on the interbank foreign exchange market exclusively as a buyer. In the reviewed period, the amount of foreign currency purchases amounted to mln. USD, by 185 mln. USD more compared to the same period of last year. These interventions were accordingly with the monetary policy promoted by the NBM and aimed to improve the situation on the domestic currency market and supply of state currency reserves. Table BNM activity on interbank currency market during the period January 2015 October 2016 Month Volume of purchases, (equivalent Volume of sales, (equivalent mln. mln. USD) USD) January February March April May June July August September October November December January February March April May June July August September October Source: According to the data of the National Bank of Moldova. The volume of official reserve assets at the end of quarter III of 2016 increased from the beginning of this year by mln. USD. At the end of September 2016, the official reserve assets balance amounted to 2.15 mln. USD increasing by 21% sply. The increase of the official reserve assets was determined by the interventions of the NBM on the domestic currency market as currency purchases, credits and grants registration in favour of Ministry of Finance of Moldova, revenues from currency reserves management etc. Monetary indicators In the third quarter of 2016, the growth rate of all money supply components returns to positive values after two years of volatile developments, preponderently negative. The main contribution to the increase of the money supply has had the components of M2 monetary aggregate, especially on term deposits in national currency. The growth rate of money supply increased slowly in this period compared to its values from the same period of last year, the growth is generated by the volume increase of deposits in national currency. In this context, the stock of monetary aggregates on September 31, 2016 compared to the data egistered on September 31, 2015 has developed as follows: 33

34 - monetary aggregate M0 registered an increase by 1.85%, and amounted approximately to 16.8 billion MDL; - monetary aggregate M1 increased by 11.9% and reached a level of 27.1 billion MDL; - growth rate of monetary aggregate M2 increased by 15.2%, and amounted to 45.4 billion MDL - monetary aggregate M3 registered an increase by 5.9% and amounted to 69.8 billion MDL. At the end of quarter III, 2016 the volume of monetary base registered a growth of 10.5% sply and amounted to 33 billion MDL. The money supply in national currency continues its position reinforcement in the total money supply. In quarter III, 2016 some structure changes were produced as a result of the monetary expansion, as for the weight distributions of different components within the money supply, loosely. On September 31, 2016, the components of money supply were distributed as follows: monetary aggregate M0 (currency in circulation) 24.3%; demand deposits 14.8%; term deposits 26.2% and deposits in foreign currency 34.8%. Compared with the data from the end of the III quarter, 2015 it can be mentioned a weight decrease of currency in circulation by 1 p.p. and deposits in foreign currency by 5.3 p.p., developments determined by the strengthening of demand deposits and term deposits position in national currency which increased their weight by 3.1 p.p and 3.2p.p. respectively. 100% 90% 80% 70% 60% 50% 40% 30% 20% 10% 0% Currency deposits Long term deposits Short term deposits Monetary aggregate M0 Figure Structure of money supply M3 Source: Calculation according to the data of the National Bank of Moldova. Monetary policy in the region of the left bank of the Dniester River The monetary policy strategy of the central bank of the Republic of Moldova s region to the left of the Dniester River provides for maintenance of the financial system stability and support of the economic growth based on targeting the exchange rate. During the III quarter, 2016 in terms of some deflationary processes stably moderate in the region, the central bank's refinancing rate was maintained at 3.5%. On July 1, 2016, the rates on required reserves have been increased by 2 p.p, which were situated in the third quarter of 2016 to a level of 12% for deposits attracted in foreign currency and 14% for those in rubles. 34
35 At the end of the III quarter, 2016, the money supply in the region of the left of the Dniester amounted to mln. rubles (eqivalent of about mln. MDL 7 ), registering a decrease of 8% compared to the volume of money supply recorded at the end of the III quarter of the previous year. On October 1, 2016 the components of money supply were distributed as follows: monetary aggregate M0 (currency in circulation) 18.2%; quasi-currency 23%; money supply in foreign currency 58.3%. Compared to the same period of the previous year, at the end of the III quarter of 2016 there have been registered some significant changes in the structure of money supply: the weight of currency in circulation increased by 7.5 p.p. and the weight of quasicurrency and money supply in foreign currency decreased by 7 p.p. and 0.5 p.p. respectively. 7 Calculated according to the official exchange rate of the CBPMR on April 1, 2016, 35
36 Chapter III FINANCES 3.1. Public finances In the first nine months of 2016, the National Public Budget Revenues were characterized by a positive rising trend, the growth rate oscillating around the average of 2.03 % s.p.l.y. Thus, the revenues accumulated in NPB amounted to mln. MDL, increasing by mln. MDL compared to the same period of In the first nine months of 2016, the taxes and fees totaling mln. MDL, contributions and premiums mln. MDL, grants mln. MDL and other revenues by 1516 mln. MDL have contributed to the increase of public budget revenues. The state budget revenues had a weight of 62.05%, social insurance budget revenues had a weight of 34.21%, respectively, compulsory health insurance funds revenues had a weight of 11.4% and local budget revenues had a weight of 26% of total national public budget revenues. mln.mdl Revenue Expenses Revenue s.p.l.y.% Expenses s.p.l.y.% % Figure Dynamics of NPB revenues and expenditures in 2016 Source: Compiled by author according to the data of the Ministry of Finance. The highest contribution have the taxes and fees on goods and services (46.4%) and income taxes (11% individuals income taxes and 7.47% legal entities income taxes) and excizes (10%). For that matter, since 2014 it is attested a continuing increase in the revenues weight of legal entities taxing reaching the level of 7% on November 30, 2016 (+1.3 p.p. compared to November 30, 2014). Actually, these trends could mark some positive changes in the structure of national public revenues and reduction of their dependence of external trade transactions. However, during the reference period of this year we could see an increment of the contributions and required premiums by 8.6% s.p.l.y. Respectively, on September 30, 2016 it amounted to mln. MDL or 29% of total revenues. For that matter, it is observed an increase of the state required social insurance contributions by 7.22% s.p.l.y and respectively required insurances of health care by 13.1% s.p.l.y. The effects of the banking sector crisis of the Republic of Moldova in recent years had an impact on external grants in 2015 and In the first nine months of 2016, the Republic of Moldova received grants amounting to mln. MDL less by 81% s.p.l.y. Respectively, in November 2016, the grants increased up to mln. MDL. 36
37 Contributions and insurance premiums Grants received ,3 1399,6 9559,4 8801,9 Contribut ions and insurance premium s 29% Non-tax revenues ,9 Grants received 1% Income tax 65% Income tax 21142, ,1 Non-tax revenues 5% Figure Structure of current NPB revenues on September 30, 2016, million MDL Source: According to the data of the Ministry of Finance. In November, 2016, the accomplishment of the executed volume of revenues was amounting to 86% versus that stated. The revenues administrated by the Tax Service representing 52% of public revenues have had the greatest development comparing to other NPB components in the first nine months of 2016 increasing by 11.8% versus the same period of Comparing with the same period of the previous year, the returns have registered a 1.62% decrease. The decline is explained by the reduction in revenues from the external projects, increase of VAT refunds and clear profit exclusion of the NBM. Until October, the Ministry of Finance refunded excizes and VAT in the ratio of 9.5% of total revenues, i.e mln. MDL. An attempt is being made to ensure favorable conditions for the development of economic agents being mentained the daily return rate. In the first half of the year, the NPB expenditures increased by superior rates to the returns revnues supported mainly by the social expenditures dynamics. The expenditure part of the national public budget in nine months of 2016 amounted to mln. MDL, increasing by 2.53% compared to the same period of In nine months of 2016, the highest weight have had the finances attributed to the social sector: education decreasing by 3% s.p.l.y. totaling mln. MDL; state services with general destination increasing by 2.3% times compared to the same period of the previous year to an amount of mln. MDL; health care decreasing by 9.3%, which decreased from mln. MDL in 2015 to mln. MDL in Globally, the public expenditures of socio-cultural nature totaled in 2016 about mln. MDL representing around 53% (-3.5 p.p. s.p.l.y.) of total value of public expenditures realized in this period. In quarter III of 2016, the preponderant part of public expenditures 88.4%, were directed to come to life the projects for social protection field 38.1%, followed by education 18%, health care 12.3%; state services with general destination 11%, services in economic field 9%, etc. Budgetary financial result. The national public budget execution in the first nine months of 2016 resulted in a deficit amounting to mln. MDL, and the increase equating to 21% compared to the same period of last year. The balances on the National Public Budget s account, as of September 30, 2016 have increased by mln. MDL amounting to mln. MDL as compared with January 1,
38 Q.III-2016 Public finances deficit 1045,7 Q.III ,6 Q.III ,6 Q.III ,7 Q.III ,5 Figure Public finances deficit, million MDL Source: According to the data of the Ministry of Finance. In the first half of the year s.p.l.y., the fluctuations of Moldovan leu against the major reference currencies which form the external state debt of the country (EURO and USD), define the upward development of the total public debt in Moldovan lei and reduction of its weight in GDP. At the end of September, 2016 the weight of public sector debt amounted to 34.7% of GDP decreasing by 0.8 p.p. compared to the end of Consequently, the balance of public sector debt equated to mln. MDL, increasing by 6.3% compared to the end of 2015 and 5.16% compared to the first quarter of Unessential changes had also its structural components. The state debt was mln. MDL, increasing by 11% compared to its balance from the end of This increase was influenced by the balance rise of the internal state debt by mln. MDL and external state debt by mln. MDL. Compared with September 30, 2015, on September 30, 2016 we can notice the following changes to the main components of the public debt: State debt which was constituting about 80.9% of public debt ( mln. MDL), increased by 11% or by mln. MDL; NBM debt which was 13% of public debt ( mln. MDL) decreased by 15.4% respectively by mln. MDL; Debt of public sector enterprises composed integrally of external commitments of these was equating to 5.2% of total public debt decreasing by 12% (320 mln. MDL); External debt of ATU with a lower weight of 0.9% (408.9 mln. MDL) in total debt registered a decrease by 0.75% or 3.10 mln. MDL respectively compared to September, The fluctuations of the Moldovan leu versus the major reference currencies which form the external public debt USD and EURO which will produce pressures on its service (return of the main amounts and external state debt service): Table Structure of state debt by currencies on September 30, 2016, % of total state debt Currency type SDR USD EURO JPY GBP MDL With SDR decomposition Without SDR decomposition Source: According to the data of the Ministry of Finance. The gross external debt of the Republic of Moldova increased during quarter III of 2016 by mln. USD or by 2.6%, amounting to 6, mln. USD on September 30,
39 External debt, mil.usd Q Q Q Figure Dynamics of external debt during the period , %, million USD Source: According to the data of the Ministry of Finance. Public finances in the region to the left of the Dniester River At the end of quarter III of 2016, the revenues of the Transnistrian budget amounted to mln. rubles, the equivalent of 1968 mln. MDL 8. These amounted to 6.06% refering to the amount of the national public budget revenues ( mln.mdl) realized on the controlled territory of the Republic of Moldova during January-September Compared with the same period last year, the expected revenues in the Transnistrian region for 9 months of this year were collected in the ratio of %. The most of the revenues categories registering receipts below the planned level, including tax revenues 66.19%, taxes on goods and services, payments for registration and licence 57.02% etc. Table Dynamics and structure of public revenues in the region from the left bank of the Dniester river in January-September 2016 Revenue category Total amount January- September, 2015, rubles Total amount January- September 2016, rubles Weight in total revenues January- September 2015, % Weight in total revenues January- September 2016, % Growth rate versus last year, % Degree of achievement of the planned level, index; % Total public revenues Tax revenues Income taxes Tax on income of individuals Tax on gambling activity Tax on goods and services, payments for registration and licence Payments for using natural resources Customs Non-tax receipts Non-refundable transfers (humanitarian aid) Funds revenues with special destination Entrepreneur activity revenues and other revenues ori Source: According to the data of the Ministry of Finance of Transnistria (available on: 8 Calculated at the official exchange rate of the Transnistrian Bank on September 30, MDL= rubles. 39
40 The data of the Ministry of Finance of Transnistria presented in the above table indicate an upward trend of total public revenues in the region to the left of the Dniester by 61.5 mln. rubles or by 5.78% determined by the sharp increase of tax on income of individuals (growth rate %), payments for using natural resources (113.03%), non-tax receipt (132.03%), funds revenues with special destination (203.70%). To other revenue categories it is noticed a downward trend (excepting the tax on gambling), and the degree of achievement of the planned level of these revenues oscillate between % (customs ) and 94.07% (profit taxes). In January-September 2016 compared to the same period of the previous year, the analysis of the revenues structural changes shows that the weight of tax revenues decreased from 72.67% to 60.18%, including income taxes from 37.27% to 33.03%, taxes on goods and services, payments for registration and licence from 9.77% to 6.68%, entrepreneur activity revenues and other revenues from 11.28% to 10.50%, etc. At the same time, it can be observed an increase in the importance of funds revenues with special destination, doubling their volume and the weight in total revenues modifying from 13.88% to 26.73%, though the degree of achievement amounted to only 44.29%. The budget expenditures in the region represented mln. rubles the equivalent of mln. MDL or 10.8% of total volume of the national public budget expenditures ( mln. MDL) realized on the controlled territory of the Republic of Moldova during the period January-September The total volume of public expenditures increased by mln. rubles or by 40.42%, registering a rise in expenditures in 16 of 19 fields compared to the same period of last year. The following expenditures have recorded significant increase: public administration and local government - from 82.8 mln. Rubles to mln rubles (+45 %); judicial bodies from 16.1 mln. rubles to 23.2 mln. rubles (+43.89%); agriculture from 16.2 mln. rubles to 25.1 mln. rubles (+54.54%); environment protection - from 6.9 mln. rubles to 10.6 mln. rubles (+53.15%); transport, roads, communication and informatics from 1.2 mln. rubles to 20.6 mln. rubles (+45.32%); education from mln. rubles to mln. rubles (+47.04%); culture, art and cinema - from 10.5 mln. rubles to 15.0 mln. rubles (+42.51%); massmedia - from 16.9 mln. rubles to 23.4 mln. rubles (+40.30%); public health - from mln. rubles to mln. rubles (+54.47%); financial assistance of other levels budgets - from 61.9 mln. rubles to mln. rubles (by 3.7 times); capital investment - from 7.0 mln. rubles to mln. rubles (by times). The analysis of public budget expenditures structure in the region to the left of the Dniester River shows that the highest weight of total expenditures is public health expenditures, both in planned structure (17.16%), and effective one (18.99%), followed by expenditures for public order and state security (respectively planned one 14.15% and effective one 14.79%), social policy expenditures (respectively planned one 14.14% and effective one 13.64%), financial assistance of other levels expenditures (11.52% and % respectively), education expenditures (9.06% and 9.95% respectively). The weight of capital investment expenditures have significantly reduced compared with the planned structure from 0.14% to 0.01%, weight of special budgetary funds expenditures from 2.53% to 1.47%. The national defense of Transnistrian region expenditures amounted to mln. rubles (the rquivalent of mln. MDL), registering an increase of 6.7 mln. rubles or by 5.9% and a weight of 5.8% (planned level being 5.75%) of total budget expenditures, in the first nine months of Banking sector In the first nine months of 2016, improvement trends of asset and banking capital quality are recorded. In the first nine months of 2016 it is seen a revival of the banking asset from mln. MDL in January, 2016 to mln. MDL in September 2016, increasing by 3.5%. However, during 2015 and 2016, the annual growth rate of bank assets was situated on a downward decline. This trend is reflected since October 2015 (-16.91%) persisting also in nine months of 2016 (in September 2016 (-30.4%)) compared to the previous year. Under the head 40
41 of risk-weighted assets there is registered an improvement trend in quarter I of 2016, totaling mln. MDL decreasing by 9.5% s.p.l.y. The financial institutions which held the most riskweighted assets in September 2016 are BC Moldova Agroindbank, amounting to mln. MDL. and B.C. Moldindconbank with mln. MDL. mil.mdl Risk weighted assets, mil.mdl Total Assets,% Risk weighted capital adequacy ( 16%) % Risk weighted assets, mil.mdl VICTORIABANK BCR Chisinau ProCredit Bank Moldindconbank MOBIASBANCA - Groupe Societe Generale FinComBank EXIMBANK - Gruppo Veneto Banca ENERGBANK EuroCreditBank COMERTBANK MOLDOVA - AGROINDBANK 246,57 268, , , , , , , ,46 883,12 177,05 191,12 368,85 377, , , , , , , , , Figure Development of bank capital quality Source: Authors calculations according to the data of the National Bank of Moldova. The average of the risk-weighted capital adequacy per banking sector still remains at a high level. Thus, in nine months of 2016, the level of capitalization 9 for 11 commercial banks in the sector registers superior values of 28.7%, (increasing by 5 p.p. compared to September 2015) indicating fair operating conditions for domestic banks. In the first nine months of 2016, ,00 Tier I capital, mil.mdl Tier I capital / risk weighted assets,% 30, ,00 25,00 mil.mdl 9.000, , , ,00 20,00 15,00 % 10,00 5, ,00 Sep.14 Oct.14 Nov.14 Dec.14 Jan.15 Feb.15 Mar.15 Apr.15 May.15 Jun.15 Jul.15 Aug.15 Sep.15 Oct.15 Nov.15 Dec.15 Jan.16 Feb.16 Mart. Apr.16 May. Jun.16 Jul.16 Aug.16 Sep.16 0,00 Figure Development of quality of bank capital, Source: According to the data of the National Bank of Moldova 9 below the minimum requirement ( 16%) set by the NBM 41
42 the level of Tier I capital of the banking sector has marked an increase of 6.2%, up to mln. MDL compared to September 30, 2015 according to the informations on economic-financial activity of the commercial banks. And the Tier I capital rate in risk-weighted asset increased in quarter II of 2016 from 23.51% in September 2015 to 27.68% in September All banks complied with the requirement to hold the minimum capital required for the the corresponding quantum established in the amount of 200 mln. MDL. The liquidity of banking sector is mentained within the prudential limits. In nine months of 2016, the liquidity indicators of the banking sector are within the normative established by the NBM, the weight of liquid assets (liquidity principle II) registers 47.20%, more by 8.4 p.p. compared to September 30, The value of long-term liquidity indicator (liquidity principle I ( 1)) of the entire banking system amounted to 0.65% on September 30, 2016, less by 0.08 p.p. compared to September 30, Consequently, we see that the most of the commercial banks register a high coefficient leading to a bank liquidity excess and meet the prudential norms imposed by the NBM. % Principle II -Current liquidity ( 20%) Principle I - Long-term liquidity ( 1) 1,8 1,6 1,4 1,2 1 % 0,8 0,6 0,4 0,2 0 EXIMBANK - Gruppo Veneto Banca Current liquidity ratio,% VICTORIABANK BCR Chisinau ProCredit Bank Moldindconbank MOBIASBANCA - Groupe Societe FinComBank ENERGBANK EuroCreditBank COMERTBANK MOLDOVA - AGROINDBANK 42,5 50,51 29,7 39,78 32,5 40,54 48,9 55,83 42,5 48,04 37,1 48,65 48,4 54,66 35,4 43,50 64,8 68,16 51,9 60,77 56,1 62,96 Figure Dynamics of liquidity principle I and II in the banking sector, % Source: According to the data of the National Bank of Moldova. The banking sector recovery through banking profitability increase. In September, 2016 the three commercial banks have contributed more than 70% in the entire sector profit amounting to mln. MDL, more by 2.2% compared to the same period of This increment is due to the main components of the operating activity interest expenditures with 28.5% compared to the end of September In this context, the values of the main profitability indicators (the rate of Return on Assets ROA 2.47% and rate of Return on Equity ROE-15.01%) increased in the first nine months of 2016 compared to previous months. So, the domenstic financial institutions have had a profitable activity in the nine months of 2016, even inspite of the deposit interest rate reduction. (Fig ) The rate increase of non-performing loans in nine months of 2016 describes the loans portofolio quality aggravation of loans. In nine months of 2016, the weight of non-performing loans in total loans increased by 6 p.p., compared to September 30, 2015 amounting to 15.77%. Respectively, the weight of net non-performing loans in TRC registered an increase of 17 p.p. in September 2016 (60.32%), compared to the same period of the previous year. In respect of volume of non-performing loans, this amounted to mln. MDL on September 30,
43 mil.mdl Total Profit, mil.mdl Return on equity (ROE),% Return on assets (ROA),% 25,00 20,00 15,00 % 10,00 5,00 0,00 Profit, mil.mdl VICTORIABANK 223,8 184,8 BCR Chisinau ProCredit Bank Moldindconbank MOBIASBANCA - Groupe Societe Generale FinComBank EXIMBANK - Gruppo Veneto Banca ENERGBANK EuroCreditBank COMERTBANK MOLDOVA - AGROINDBANK 21,4 25,8 57,7 37,3 48,5 42,1 40,4 23,7 54,1 55,8 8,3 13,5 15,3 32,3 195,2 228,7 334,5 394,4 337,4 326,8 Figure Development of banking return and profitability Source: Authors calculations according to the data of the National Bank of Moldova. increasing by 48% compared to September 30, However, the lending of national banking sector is hereinafter influenced by the reduced ability of the bank management. (Fig ) Balance of non-performing loans, mil.mdl Commercial Banks problematic exclusion from the calculation Non-performing loans,% Figure Weight of non-performing loans in the banking sector, % Source: According to the data of the National Bank of Moldova. The deterioration of the loan portofolio is more evidential to the banks under special supervision (BC Moldindconbank S.A., B.C. VICTORIABANK S.A. and BC MOLDOVA - AGROINDBANK S.A.), in the first nine months of The domestic financial institutions did not clear out their non-performing loans balances either in the first nini months of This aspect is highlighted by the increase in non-performing loans rate at BC Moldindconbank S.A., B.C. VICTORIABANK S.A. and BC MOLDOVA-AGROINDBANK S.A., which are under special supervision establishment on NBM decision. Respectively, the increase rate of non-performing loans weight in TRC at each bank is increasiung, oberving that on B.C. VICTORIABANK S.A. increased by p.p. (168.19%), BC MOLDOVA-AGROINDBANK S.A. by 14.18% (59.35%) and BC Moldindconbank S.A. by p.p. (58.52%) compared to January Hence, currently the risks are high. These indicators reflect an alarming situation within these commercial 43
44 banks and this can be characterized by a bad supervision of the bank assets quality by the management of the financial institutions. The balance of non-performing loans, mil.mdl 1483, ,17 Non-performing loans / CNT% 168, , ,62 689,24 266, Jan.2016 Sep.2016 Jan.2016 Sep.2016 Jan.2016 Sep.2016 BC MOLDOVA - AGROINDBANK S.A. B.C. VICTORIABANK S.A. BC Moldindconbank S.A. Jan.2016 Sep.2016 Jan.2016 Sep.2016 Jan.2016 Sep.2016 BC MOLDOVA - AGROINDBANK S.A. B.C. VICTORIABANK BC Moldindconbank S.A. S.A. Figure Development of credit portofolio quality in banks under special supervision, September 2016 Source: According to the data of the National Bank of Moldova. The drop trend of loans in national currency. The gross loans portofolio 10 by the commercial banks have had a negative development in September 2016 (-17% s.p.l.y.) and the volume of new loans 11 reduced by 16% s.p.l.y. Thus, the highest contribution to decrease, in September 2016, had the loans in foreign currency with a decrease of 24.4% s.p.l.y. and loans in national currency with a decrease of 9.2% s.p.l.y. The downward trend of loans in national currency started at the beginning of this year (with the tightening of the monetary policy promoted by the NBM), which will hardly redress in future the credibility and confidence of the population in the banking sector. % Total loans Loans in MDL Loans in foreign currency Figure Annual growth rate of loans in foreign and national currency, % Source: According to the data of the National Bank of Moldova. During the reviewed period, in the banking sector in the context of risks distribution and investment operations destination, the loans balance increase in MDL was produced pursuant to a loans balance raise to all economy sectors. Thus, in nine months of 2016, the highest weight in total loans held the trade loans (29%), followed by loans for food industry (10%), consumer loans (9.2%) and agriculture loans (8.2%) etc. The banks of the Republic of Moldova are still reluctant to lend loans for economic agents because of the unforseen risks which could be generated by their financial situation. The financial institutions became more cautious after the financial recession. And to avoid the risks generated by lending, the financial institutions are 10 Gross loans portofolio mln.mdl on Volume of new loans mln. MDL on
45 more directed for lending the branches which bring immediate profit (highest weight in total loan portofolio registered by loans to industry and trade), the real economy having a limited access to the bank financial resources. Nr. d/o Table Structure of credit portofolio by branches during the period Loans branch Sept Balance at the end of the period, MDL Weight, % 1 Agriculture loans Loans for food industry Loans for constructions field Consumer loans Loans for energy industry Loans for manufacturing industry 7 Trade loans Loans for non-banking financial institutions 9 Loans for real estate purchasing/construction 10 Loans for non-commercial organizations 11 Loans for employed individuals Loans for transport, telecommunications and network development field 13 Loans for provision of services field 14 Other loans Total Source: Authors calculations according to the data of the National Bank of Moldova. Dynamics of bank average interest rate. In the first nine months of 2016, the loans had become cheaper by 10 p.p., the average interest rate to new loans in the banking sector declined from 15.44% in September 2015 to 13.79% in September Respectively, the average interest rates of loans in foreign currency decreased by 1 p.p., from 6.7% in September 2015 to 5.78% in September The new deposits in national currency were attracted by the commercial banks in September 2016 to an average rate of 7.6%, increasing by 6% compared to September 2015 (13.8%). At the same time, the average interest rates on deposits in foreign currency amounted to 2.12% in September 2015 and The average interest rate on loans and deposits in national and foreign currency have been reduced constantly during , as a consequence of inflation drop and gradual decrease of base rate on monetary policy operations. However, at the beginning of 2015 and 2016, the central authority of the NBM increased the base rate from 13.5% in February 2015 to 19.5% in September 2015, as well the required reserves rate. The base rate increased significantly in this period against the banking sector crisis and leu depreciation. And, at the beginning of 2016, the NBM decreased the base rate applied to the main short-dated monetary policy operations from 19% in February to 9% annually in October (Fig ) Net interest margin in the banking sector of the Republic of Moldova for the operations in national currency recorded a lower variation compared to the margin for transactions in foreign currency. On September 30, 2016 the banking margin for operations in national currency had registered a level of 6.19%, increasing by 4 p.p. compared to September, Respectively, the margin for operations in foreign currency has also developed constantly registering a level of 3.66% decreasing slightly by 0.96 p.p. compared to September The volume increase of deposits attracted both in national and foreign currency. On September 30, the balance of bank deposits amounted to mln. MDL, decreasing by 23%, compared to September 30, This declining trend was mostly caused by the balance 2016 Sept 45
46 % Bank margin The average rate on deposits in MDL The average rate on credits in MDL % Bank margin The average rate on deposits in foreign currency The average rate on credits in foreign currency Jan.15 Feb.15 Mar.2015 Apr.15 May.15 Jun.15 Jul.15 Aug.15 Sept.15 Oct.15 Nov.15 Dec.15 Jan.16 Feb.16 Mart.16 Apr.16 May.16 Jun.16 Jul.16 Aug.16 Sept.16 Oct.16 Figure Development of banking margin*, average interest rates on deposits and loans in MDL and foreign currency, % Source: Authors calculations according to the data of the National Bank of Moldova. *Note: The banking margin index was calculated as the difference between the average rate on loans in MDL/foreign currency and average rate on deposits in MDL/foreign currency. decrease of deposits in foreign currency by 33% and balance increase of deposits in national currency by 1% compared to September 30, The total volume of new deposits attracted on term by the commercial banks advanced by 3% in the first nine months of 2016 compared to the same period of the previous year. This trend is also mentained in the following months of Respectively, in November 2016 the new deposits volume on term increased from 3487 mln. MDL in November 2015 to 3513 mil. MDL in November 2016 by 0.74% s.p.l.y. mil.mdl Foreign currency mil.mdl Currency, mil.mdl The balance of deposits of individuals / balance of deposits% % Figure Development of deposits attracted by banks, mln. MDL Source: Authors calculations according to the data of the National Bank of Moldova. 46
47 Banking sector in the region to the left of the Dniester River The banking sector in the region to the left of the Dniester River has registered growth trends in the main indicators of activity. In the first nine months of 2016, the average annual growth rate of bank assets in Transnistrian region was situated on an increasing trend constituting 9.3% s.p.l.y denominated both in rubles 12 and USD. The total assets of the banking system of the region totaled mln. rubles on November 1, The loans balance lend to the economic sector reached the amount of mln. rubles on November 1, 2016 more by 0.1% compared to November 1, The attracted deposits balance amounted to mln. rubles, on November 1, 2016 more by 2% compared to November 1, Respectively, the deposits of individuals on November 1, 2016 constitute mln. rubles decreasing by 11.33% compared to November 1, Because of the low level of attracted deposits, the banks have to make bigger efforts of capital or to attract funds from elsewhere to meet the loan demands. Thus, in the first 10 months of 2016, calculating the relation of total loans/deposits, the Transnistrian banks finance only 1.55 of loans from the attracted deposits account. As in the case of the banking sector from the right of the Dniester River there is an important problem referring to the transparency on transnistrian shareholding banks due to the lack of published information by banks related to the transnistrian banking shareholding structure and components. 20 Total assets Total deposits Total loans % Figure Annual growth rate of assets, deposits and bank loans in Transnistrian region,% Source: Author s calculations according to the data of Transistrian Bank. 12 The exchange rate of ruble in the region to the left of the Dniester River compared to the Moldovan leu on was 0,5555 rubles/mdl. On , the exchange rate of ruble against the major reference currencies was rubles/mdl, rubles/usd, rubles/euro, available on 47
48 Chapter IV EXTERNAL SECTOR Remittances The remittances of Moldovans who work abroad continue its decreasing trend in this period. Thus, in nine months of 2016, the remittances have been reduced to million USD. In nine months of 2016, the remittances have decreased by 5.6% or by mln. Dollar compared to the same period of the previous year and by 36.6% ( mln. Dollars) compared to In this period of 2016, the remittances amounted to million Dollars. As a result, this had a consequence on consumption, investment activity and budgetary revenues. To the decrease of remittances have contributed both the fluctuations of the exchange rate of the original currencies against the US Dollar and the effective decrease of remittances (eliminating the effect of the exchange rate by recalculating the amounts on the exchange rate in this period, last year). In Q III of 2016, the amount of remittances from abroad amounted to mln. US Dollars, decreasing by 0.2% sply. The most remittances were in USD 52% followed by those in Euro 35% and Russian rubles 12.8% Q I Q II Q III Q I Q II Q III Q I Q II Q III Q I Q II Q III Q I Q II Q III Q I Q II Q III Q I Q II Q III personal transfers, mil. USD the growth rate s.p.l.y., % Figure 4.1. Remittances from abroad made in favour of individuals quarterly, Source: According to the data of the National Bank of Moldova. In September, the remittances amounted to about 100 million Dollars. Since the beginning of the year, this is the highest amount transfered for a month from abroad. However, the remittances from September decreased by 0.3% compared to September 2015 and by 35.5 % compared to the same period of Instead, in August this year the increase is of three million Dollars. The least remittances were recorded in January 2016 amounting to 58 million Dollars. Foreign trade in goods The foreign trade in goods of the Republic of Moldova during the period January-September 2016 shows a decrease of 1.8% or by 81.8 mln. US Dollars compared to the same period of the previous year (in 2015 during the period January-September, the foreign trade in goods amounted to mln. US Dollars). The foreign trade in goods amounted to mln. US Dollars in the first nine months of
49 The exports of goods, in the period January-September 2016 totaled mln. US Dollars by 1% less sply. In September 2016, the exports of goods amounted to mln. US Dollars or by 18.5% more compared to September 2015 and by 15.2% more compared to previous month (August 168 mln. Dollars). The exports of domestic goods decreasing by 3.6% sply, in this period the exports of domestic goods amounted to mln. US Dollars determining a reduction of 2.4% in total exports. Compared with January-September 2015, the re-exports of foreign goods totaled mln. US Dollars (36.2% of total exports), increasing by 3.9%. The re-exports of goods after processing held 23.5% in total exports and the re-exports of classic goods did not meet essential changes 12.7% Jan Feb March April May June July Aug Sept Figure 4.2. Monthly development of exports during , million US Dollars Source: According to the data of the National Bureau of Statistics. During the period January-September, the exports of goods designed to EU countries increased by 1.7% sply, holding a weight of 63.8% in total exports (62.1% in January- September 2015). In this period, the exports of goods designed to EU countries amounted to mln. Dollars. Therewith, the exports of goods designed to CIS countries numbered mln. Dollars, possessing a weight of 21% (25.3% - in January-September 2015) in total exports. The exports of goods for these countries reduced by 17.9%, compared with January- September The developments of exports by countries compared with the same period of 2015, highlight the decrease of deliveries to Kazakhstan (-81.4%), Belarus (-22.7%), The United Kingdom of Great Britain and Northern Ireland (-17.9%), Italy (-5.1%), Russian Federation (-3.5%), Latvia (-59.8%), Switzerland (-12.5%), The United States of America (-27.9%), Spain (-47.2%), Cyprus (-62.1%), Georgia (-18.4%), Indonesia (-40.5%), Greece (-6.0%), Slovakia (-15.1%), Lithuania (-15.9%), Uzbekistan (-27.9%), Denmark (-43.6%) and Sweden (-71.9%), influencing the decrease in total exports by 9.2%. Meanwhile, there have increased the exports to Bulgaria (by 2.2 times), Romania (+6.8%), Irak (by 2.6 times), Ukraine (+16.3%), Malaysia (by 3.5 times), Germany (+5.2%), Poland (+9.6%), China (by 1.9 times), Israel (by 3.9 times), Austria (+16.0%), Lebanese Republic (+55.0%), Egypt (by 8.1 times), Myanmar (by 6.8 times), France (+3.0%), Czech Republic (+5.1%), Hungary (+49.0%), Macedonia (by 2.3 times), Jordan (by 4.8 times), India (by 7.5 times), Bangladesh (by 2.6 times) and Saudi Arabia (by 3.4 times) mitigating so the decrease in total exports by 7.9%. 49
50 , export-total CIS-countries UE-countries other-countries Q I Q II Q III Figure 4.3. Exports of the Republic of Moldova by groups of countries, quarterly in 2016, million US Dollar Source: According to the data of the National Bureau of Statistics. The imports of goods have also continued to decrease. In January-September 2016 the imports of goods amounted to mln. US Dollars with a volume by 2.2% lower to that of the previous year. The imports of goods from September 2016, increased by 3% compared to the previous month and by 7.1% - compared with September The imports of goods from September 2016 amounted to mln. US Dollars Jan Feb March April May June July Aug Sept Figure 4.4. Monthly development of imports during , million US Dollars Source: According to the data of the National Bureau of Statistics. The imports of goods from EU countries held a weight of 49.6% in total imports (49.3% - in January-September 2015). Hence, the imports of goods from EU countries accounted for mln. US Dollars or by 1.8% less compared to January-September However, the imports of goods from CIS countries constituted mln. US Dollars amounting to a weight of 25.2% in total imports (25.1% in January-September 2015). Their decrease by 1.8% was also insignisficant as the deliveries from EU compared to the same period of the previous year. (Fig. 4.5) In January-September 2016, compared with the same period of 2015, the development of imports by countries indicates the decrease of deliveries from Romania (-9.6%), Turkey (-8.9%), Japan (-43.1%), Russian Federation (-3.5%), Austria (-18.5%), Israel (-54.3%), Uzbekistan (-79.0%), Germany (-2.7%), Bulgaria (-11.1%), Kazakhstan (-71.4%), Belgium (-10.0%), Switzerland (-15.0%), South Koreea (-10.1%), India (-14.6%) and Denmark (-26.2%), influencing to the drop in total imports by 5.2%. At the same time, increments of imports from Belarus (+23.5%), China (+4.0%), Hungary (+15.6%), Poland (+5.3%), France (+12.2%), The United Kingdom of Great Britain and Northern Ireland (+18.5%), Viet Nam (by 1.8 times), Ukraine (+1.1%), Italy (+2.3%), The United States of America (+10.3%), Czech Republic (+6.2%), Spain (+11.3%), Slovakia (+26.0%), 50

51 Import - total CIS countries UE countries other countries Q I Q II Q III Figure 4.5. Imports of the Republic of Moldova by groups of countries, quarterly in 2016, million US Dollar Source: According to the data of the National Bureau of Statistics. Serbia (+15.9%), Taiwan (+27.3%), Portugal (by 1.8 times), Macedonia (by 3.8 times), Iceland (by 1.8 times) were recorded, mitigating the decrease in total imports by 3.2%. In January-September 2016, the deficit of commercial balance accounting for mln. US Dollars by 51.6 mln. US Dollars or by 3.4% less compared to the same period of the previous year, as a result of the significant gap in the development of exports and imports. The commercial balance ended in a deficit of mln. US Dollars with EU countries (in January-September mln. US Dollars), and of mln. US Dollars with CIS countries (in January-September mln. US Dollars) ,1 3865, ,5 Figure 4.6. External trade trends during , million US Dollars Source: According to the data of the National Bureau of Statistics. Region of the Republic of Moldova to the left of the Dniester River ,9 1448,2 1432,7-2229,1-1513,8-1463,2-2128,3 Jan-Sept 2013 Jan-Sept 2014 Jan-Sept 2015 Jan-Sept 2016 In the first nine months of this year, the turnover of the foreign trade in the Transnistrian region decreased by 25.5% or by mln. US Dollars compared to the same period of the previous year. The total volume of the foreign trade in goods in this period amounted to million US Dollars. Both, exports and imports have registered a negative trend, the import declined by 30.5% (the import amounted to mln. US Dollars) and export by 15.7% (the export amounted to mln. US Dollars) compared with the same period last year. In January-October 2016, the Transnistrian region performed foreign trade transactions with 82 countries, including 11 from CIS. The export of goods to EU and CIS has marked a negative trend. 51

52 Jan Feb March Apr May June July Aug Sept Oct Nov Decem Jan 90, Feb March Apr May June July Aug Sept Oct Figure 4.7. External trade in Transnistrian region in the first 10 months of , million US Dollar Source: According to the data of the State Customs Committee of the region to the left of the Dniester River. The volume of foreign trade in goods for EU countries amounted to mln. US Dollars, by 56.9 mln. US Dollars less compared to the same period of the previous year. The volume of export and import decreased by 15.4% and 15%, respectively sply. The value of foreign trade to Romania amounted to 72.4 mln. US Dollars declining by 27.6% (or by mln. US Dollars) sply milion US Dollars CIS UE export import Figure 4.8. External trade in Transnistrian region in the first 9 months of 2016 compared to the same period of the previous year Source: According to the data of the State Customs Committee of the region to the left of the Dniester River. The value of foreign trade in goods for CIS countries amounted to 799 mln. US Dollars, by 304 mln. US Dollars less compared to the same period of last year (in mln. US Dollars). The volume of export decreased by 15.2%, and the volume of import by 33% sply. The main partner of Transnistrian region on foreign trade remains Russian Federation, the weight of which amounted to 34% (378.4 million US Dollars) of total foreign trade. At the same time, the trade volume with Russian Federation decreased by 31% sply ( mln. US Dollars). The volume of ecport in goods accounted for 36.2 mln. US Dollars (-3.3 mln. US Dollars sply), import mln. US Dollars ( mln. US Dollars). On the second position by trade volume is situated the Republic of Moldova wih mln. US Dollars and Ukraine with mln. US Dollars. 52
53 Chapter V BUSINESS ENVIRONMENT Dynamics of registered and deregistered enterprises in the III quarter, On November 1, 2016 the State Register contained information about legal entities and individual entrepreneurs according to the data of the State Registration Chamber QIII 2010 QIII 2011 QIII 2012 QIII 2013 QIII 2014 QIII 2015 QIII 2016 Registered Deregistered Figure 5.1. Dynamics of registered and deregistered enterprises in QIII , units Source: According to the data of the State Registration Chamber. In Q III of 2016, the number of enterprises registered by the State Registration Chamber decreased by 5.1% sply, continuing the downward trend recorded in Q III of (exception Q III 2013 and Q III 2014 in which was registered an increase). According to the data of the State Registration Chamber, in Q III of 2016 in the State Register have been registered 1304 new enterprises. Table 5.1. Growth index in the number of registered and deregistered enterprises in QIII compared to the same period of the previous year, % Enterprises registration Enterprises deregistration Quarter III Quarter III Quarter III Quarter III Quarter III Quarter III Source: Author s calculations according to the data of the State Registration Chamber. In Q III of 2016, it is seen a decrease by 19.4% in the number of deregistered enterprises sply. Thus, in Q III of 2016 the number of deregistered enterprises amounted to 983 units. Business development indicators in the region of the left bank of the Dniester River During the period January-June 2016, in the region to the left of the Dniester River, in the small business sector were functioning 3,841 enterprises. During the period January-June 2016, in the small business sector, including small and micro enterprises (except individuals), 18,894 employees were employed, decreasing by 1.7% sply. In this period, the most of the economic sectors register a decreasing trend in the number of employees (a -13.4% decrease in industry sector, -2.4% in constructions, -13.5% in communication sector, -10.7% in recreation and 53
54 tourism). At the same time, in the reviewed period (January-June 2016) some economic sectors mark an increasing trend in the average number of employees. These include Agriculture, Transport, Communal services household, Logistics and Distribution, Culture and art which recorded an increase in the average number of employees sply. Table 5.2. Data on average number of employees in small business sector enterprises 13, including small and micro enterprises (without individuals) from the left of the Dniester by types of activity, in January-June 2016 January-June January-June 2016, pers. 2015, pers. Indices, % Total 18,894 19, Industry 2,848 3, Agriculture 2,188 1, Transport Communications Constructions 1,970 2, Trade and food service 7,129 7, Logistics and distributions Real estate operations General trade activity Publishing Housing and communal services household Health and social insurance Education Culture and art Recreation and tourism Other branches Source: «Main activity indicators of small businesses, including small and micro enterprises (without individuals) for January-June 2016». 13 Data are presented for small business sector enterprises, including small and micro enterprises, with the average number of employees up to 50 persons and annual turnover up to RU MZP (calculated level of minimum salary) 1 RU MZP is tantamount to 12.7 Transnistrian RUB (2015) 54
55 Chapter VI SOCIAL SECTOR Demographic situation. Quarter III of 2016 is characterized by a higher reduction in the number of deaths compared with the decrease in the number of live births in relation to Quarter III of last year. Therefore, there is a marginal improvement in the natural decrease of population compared to the same period of the previous year. In Quarter III of 2016, according to preliminary data of NBS, the total number of live births in the country amounted to pers., decreasing by 2.3% versus the same period of the previous year, the birth rate accounted for 10.6 live births per 1000 inhabitants. The number of deceased was pers., registering also a decrease of 3.7% compared to January-September 2015 and mortality rate numbered 10.8 deaths per 1000 inhabitants. In this period, the number of deaths of children aged under 1 year declined by 17 cases compared to the same period last year and infant (aged under 1 year) mortality rate equated to 9.1 deaths per 1000 live births ,0 Persons ,5 0,0-0,5 Promilles ,0 0 QIII 2010 QIII 2011 QIII 2012 QIII 2013 QIII 2014 QIII 2015 QIII 2016 Live births, persons Deceased, persons Natural increase -1,5 Figure 6.1. Natural movement of population in Q III in the period Source: According to the data of the National Bureau of Statistics. After causes of deaths, it is highlighted that the most deaths are caused by the circulatory system diseases 56.8%, malignant tumors 16.0%, digestive system diseases 9.7%, accidents, intoxications and traumas 7.1%, respiratory diseases 4.5%, and other classes 5.9%. In the third quarter of 2016, the natural movement of population in the Republic of Moldova by development regions shows that Chisinau municipality, the Northern and Central regions have registered the most live births and dead children under 1 year. Most deaths, respectively the most important natural decreases of these regions took place in Northern and Central regions. Chisinau municipality is the only region with a positive natural growth. The most marriages and divorces were registered in Chisinau municipality, Northern and Central regions. The least divorces have been recorded in ATU Gagauzia compared to other regions. 55
56 The highest birth rate was registered in Chisinau municipality and the lowest in South region. In Chisinau municipality and ATU Gagauzia, the natural growth is positive unlike Northern, Central and Southern regions where the overall mortality is the highest one as well as the natural decrease. Table 6.1. Natural movement of population in country by development regions in QIII of 2016 Live births Deaths Deceased Natural infants growth Marriages Divorces Chisinau pers municipality Northern region pers Central region pers Southern region pers ATU Gagauzia pers Source: According to the data of the National Bureau of Statistics. The total number of marriages in country in Q III amounted to 16872, declining by 9.9% compared to the same period of last year and marriage rate was 6.3 marriages per 1000 inhabitants. In the case of divorces in country, the indicator amounted to 7955, decreasing by 4.3% compared to the same period of the previous year. The divorce rate amounted to 3.0 divorces per 1000 inhabitants. Labor market. In quarter III of 2016, the economic active population accounted for thousand pers., decreasing by 0.9% compared to s.p.l.y. The activity rate of population was 44.8%, slightly decreasing by 0.4 p.p. compared to s.p.l.y. The employed population numbered thousand pers., droping by 0.5% compared to the same quarter of The unemployment rate in country reached the value of 2.9%, being almost the same as in quarter III of The unemployed population aged 15 and over represented 55.2% of total population of the same age without significant changes compared to the same period last year. The National Agency for Employment has provided 7312 jobs for people with professional and general education and for unskilled workers representing 79% of total number of job vacancies and for those with higher and specialized secondary education 1929, i.e. 21% of total. In Q III of 2016 the economic active population amounted to thousand pers., decreasing by 0.9% (12.2 thousands) compared to Q III of The structure of active population was not changed significantly: 97.1% employed and 2.9% unemployed. The employment rate of population was 44.8%, slightly declining by 0.4 p.p. compared to the same quarter of previous year 45.2%. Between the economic active persons were registered: men 50.3% and women 49.7%. The share of economic active population in rural area was higher than that in the urban area: 55.2% and 44.8%, respectively. This indicator reached higher values among men 47.8%, compared to the rate for women 42.1%. The activity rate by areas that have been recorded: 45.1% in urban area and 44.5% in rural area. In the age group of years, this indicator had the value of 32.5%, and in the age group of years 49.6%. The activity rate of working age population (according to the national legislation: years for women and years for men) was 52.4%. The employment rate of population aged 15 and over accounted for 43.5%, being almost the same as in Q III of 2015 (43.7%). For men it was higher (46.2%) compared with women (41.1%). By distribution of residence areas, the employment rate had the value of 43.2% in urban area and 43.7% in rural area. The employment rate of working age population (16-56/61 56
57 years) was 50.7%, for population aged years 48.1% and in the group of years this indicator reached the value of 30.6%. thousand persons % QIII 2010 QIII 2011 QIII 2012 QIII 2013 QIII 2014 QIII 2015 QIII 2016 Number of unemployed, thousand persons Employed population, thousand persons Rate of employment of population aged 15 years and over, % Rate of unemployment, % 0 Figure 6.2. Trends in activity, employment and unemployment rates of the population aged 15 and over, in QIII in the period Source: According to the data of the National Bureau of Statistics. The employed population amounted to thousand persons decreasing by 0.5% versus the third quarter of As in the case of economic active population, there were registered no disparities by gender 50.0% for men and 50.0% for women. The share of employment in rural area was higher than in the urban area: 55.9% - in rural area and 44.1% in urban area. The number of unemployed people amounted to 38.7 thousand pers. according to the International Labour Office, decreasing compared to Q III of 2015 (44.0 thousands). The unemployment affected more men 58.6% of total unemployed population, as well the persons in urban area 66.5%. The unemployment rate in country has registered the value of 2.9%, being almost at the same level as in the third quarter of 2015 (3.3%). The unemployment rate for men accounted for 3.4%, and for women - 2.4%. There were registered disparities by unemployment rate in urban and rural areas (respectively, 4.3% and 1.8%). Among young people (15-24 years) the unemployment rate was 8.9%. In the age group of years, this indicator accounted for 5.7%. Inactive population aged 15 and over represented 55.2% of total population of the same age group without significant changes compared to Q III of 2015 (54.8%). The number of discouraged persons to find the job they want amounted to 9.3 thousand compared to 6.0 thousand in Q III The number of persons declared by the households as gone abroad to work or to seek work reached approximately thousand pers. compared to thousands in Q III of More than two thirds of those declared as gone abroad were men (68.2%), as well the persons gone from rural areas (70.2%). Labor remuneration. In quarter III of 2016, in September, the average nominal salary amounted to MDL, registering an increase of 10.1% compared to s.p.l.y. The index of real salary for September 2016 was 106.9% compared to September In September 57
58 Box 6.1. Job vacancies on labor market in the Republic of Moldova On October 25, 2016, 9241 job vacancies were registered according to the data of the National Agency for Employment. The most jobs are found in urban area. More job vacancies are: in Chisinau 4219, Balti 745, Ungheni 317, fewer offers are in: Drochia 33, Dubasari 33, Edinet 26 job vacancies. For persons with higher and specialized secondary education are available 1929 job vacancies amounting to about 21% of total job vacancies. More offers are for health specialists 281 (doctor specialists 109, medical assistants 96, doctors of general medicine 96, veterinarians 8, pharmacists 8, laboratory pharmacists 6, doctor s assistants 5), specialists in education 247 (high school teachers 80, pre-primary school teachers 67, middle school teachers 50, professional education teachers 9, pre-school teachers 9), inspectors 255, specialists in financial, economic or trade activities 104, managers 58, engineers 57. The National Agency for Employment has provided 7312 jobs for people with professional and general education and for unskilled workers representing 79% of total number of job vacancies: textile industry and clothes workers , skilled workers in industrial enterprises - 645, workers in construction 534, sales workers 530. Source: According to the data of the National Agency for Employment this year, the average salary amounted to MDL (+8.0% compared to September 2015), in real economic sector MDL (+10.8% compared to September 2015). In comparison with the same period of the previous year, in quarter III of 2016 the indices of real salary were higher, registering an increase in the amount of real salary namely for August-September 2016, in comparison with the same indices from the same period of 2015 when they decreased. In quarter III of 2016, in September, the average nominal salary accounted for MDL, registering a 10.1% growth compared to September 2015, droping by 1.4% in comparison with the previous month of The index of real salary for September 2016 to September 2015 (calculated as a ratio between the gross nominal salary index and consumer price index) represented 106.9%, or increasing by 6.9% compared to the level of the last year. In September Average nominal salary in budgetary sector Average nominal salary Average nominal salary in real sector Figure 6.3. Dynamics of monthly nominal salary in budgetary and real sector in January September 2016, MDL Source: According to the data of the National Bureau of Statistics. 58
59 of this year the average salary amounted to MDL (+8.0% to September 2015), in real economic sector MDL (+10.8% to September 2015). According to the types of economic activities, the highest average monthly salary in September 2016 was registered in: Information and communication MDL, Financial and insurance activities MDL, Production and supply of electricity and heat energy, gas, hot water and conditioned air MDL and Other activities of services MDL. The lowest salaries are found in the following economic activities: Education MDL, Agriculture, forestry and fishing MDL, Accommodation and food services MDL and Art, recreation and leisure activities MDL. In comparison with the same period of the previous year, in Q III of 2016, the indices in the real salary were higher, recording an increase in the amount of real salary, namely in August- September 2016, compared to the same indices from the same period of 2015, when they have decreased. These differences are a result of the inflationary pressures as it can be seen in Table 6.2, which in Q III of 2016 are not so high as compared to the same quarter of last year. Table 6.2. Trends in nominal salary rates vs real salary rates (compared to the same period of the previous year), % 2015 Month Jan Feb Mar Apr May Jun Jul Aug Sept Oct Nov Dec Nominal salary, % Real salary, % Month Jan Feb Mar Apr May Jun Jul Aug Sept Nominal salary, % Real salary, % Source: According to the data of the National Bureau of Statistics. According to the official statistics it comes out that the highest part of disposable revenues of the Moldovan population are the salaries. During the reviewed period, the weight of salaries is 41.6% in the structure of total disposable revenues. Thus, this indicator is the main component in the revenues of population, but in comparison with Q III of the previous year their contribution increased by 1.7 p.p. Disposable revenues of the popolation per month, in quarter III of 2016 per capita on average amounted to MDL which is by 5.2% more compared to the same quarter of In real terms, it is an insignificant growth, 0.7%. The disposable revenues of the population per month in Q III of 2016 per capita on average amounted to MDL, respectively by 5.2% more than in s.p.l.y. In real terms, adjusted to the consumer price index, the revenues of the population have registered an insignificant increase of 0.7%. The salaries contribution in the structure of revenues is the most important financial source for population. The salary revenues represent 41.6% of total disposable revenues, their value increased by 1.7 p.p compared to Q III of The social benefits are the second significant source of revenues of Moldovans with the share of 24.3% or by 2.8 p.p. more than s.p.l.y. The revenues of population obtained from self-employment activities amount to 14.6% of which 7.6% of individual agricultural activities and 7.0% of non-agricultural ones. Revenues of remittances from abroad are still an important source for the household budget. They represent 16.1% of total revenues, showing a lower contribution by 2.2 p.p. compared to the same period of last year. It can be mentioned that people in villages are more dependent on remittances, their weight representing 21.9% in total revenues, higher than people in urban areas (10.3%). By area 59
60 of residence the same trend is maintained: the revenues of population from urban area are higher on average by MDL or by 1.3 times higher compared to the revenues of population from rural areas. MDL % Nominal average monthly income/person, MDL Growth rate of real monthly income of population, %, in comparison with s.p.l.y. Growth rate of nominal monthly income of population, %, in comparison with s.p.l.y. Figure 6.4. Dynamics of households disposable revenues, nominal value and growth rates, by quarters, Q I 2012 Q III 2016 Source: According to the data of the National Bureau of Statistics. Average monthly consumption expenditures of population in the third quarter of 2016 amounted to MDL, increasing in nominal value by 3.2% compared to the third quarter of last year, however in real value they decreased by 1.3%. The average monthly consumption expenditures of the population in 2016 per capita amounted to MDL, increasing by 3.2% compared to Q III of In real terms, adjusted to the consumer price index, on average the population spent by 1.3% less compared to the same period of the previous year. During the reviewed period, food consumption is the highest part of expenditures 41.3% (41.6% in Q III of 2015). The housing maintenance expenditures, on average per capita amounted to 18.0% of total expenditures (18.9% in the same quarter of 2015), and for clothing and footwear 10.8% (decreasing by 1.0 p.p. compared to Q III of 2015). The other expenditures covered health 7.4% compared to 6.2% in the s.p.l.y., communication 4.3%, transport 4.3% compared to 4.0% in s.p.l.y., housing facilities 4.1%, education - 0.7%, etc. The consumption expenditures of population in urban areas on average amounted to MDL per month per capita, by MDL more or by 1.4 higher than in rural area. Urban population allocated 38.7% for food consumption of total monthly consumption expenditures (38.3% in s.p.l.y.), and in rural area 44.1% (45.1% in s.p.l.y.). At the same time, urban population spent more for housing maintenance 18.4% against 17.5% in rural area, for transport 4.7% against 3.9%, communication 4.5% against 4.2%, for hotels, cafes and restaurants 2.8% against 0.4%, leisure services 2.4% against 0.9%. Rural population spent more for clothing, footwear 11.1% against 10.4% in urban area, for health 8.0% (against 6.8% in urban area) and housing facilities 4.6% against 3.6%. (Fig. 6.5) Social protection of population. According to the data of the National House of Social Insurance, the number of pensioners registered to the social protection bodies on October 1, 2016 amounted to thousand pers. or by 10.4 thousand pers. more compared to October 1, The monthly average pension amounted to MDL, by 9.5% more compared to the same period of the previous year. 60
61 , ,0 10,0 0,0-10,0-20,0-30,0-40, ,0 0-60,0 Nominal average monthly consumer expenditures/person, MDL Growth rate of nominal monthly expenditures of population, %, in comparison with s.p.l.y. Growth rate of real monthly expenditures of population, %, in comparison with s.p.l.y. Figure 6.5. Dynamics of consumer expenditures, nominal value and growth rates, by quarters, Q I 2012 Q III 2016 Source: According to the data of the National Bureau of Statistics. Social development of the region to the left bank of the Dniester River 14 Demographic situation. The natural decrease of population in January-September 2016 amounted to 1539 pers., compared to the same period of the previous year, decreasing by 1.1%. During January-September 2016, 3504 live births were registered, representing 93.2% compared to s.p.l.y. and the number of deaths reached 5043 pers., representing 94.9% in comparison with s.p.l.y. During the analysed period of 2016, in comparison with the same period of last year, the number of deaths caused by cancer increased by 4.6%, vascular brain lesions by 1.1%, however, the mortality from digestive diseases decreased by 9.8%, intoxications, lesions and murder by 9.1%, coronary heart diseases by 8.4%. The infant mortality under the age of 1 year increased up to 20 pers., by 16.7% less than in s.p.l.y. The structure of the main causes of infant deaths includes: conditions from perinatal period (7 cases), congenital abnormalities (3 cases), sepsis (2 cases) and accidents, intoxications, traumas (2 cases). The population decline due to migration, in the analysed period, regarding internal and external migration amounted to 1660 pers., compared to the same period of the previous year decreased by 5.4%. During the reviewed period, in the region arrived 4321 pers. (out of the region 1008 pers.), representing 99.2% of arrivals in January-September 2015, of them children under 16 years 855 pers., i.e. 19.8% of total number of arrivals pers. left (out of the region 2102 pers.) or 97.9% of those who left in January-September 2015, including children under 16 years 1100 pers. or 18.4% of total number of departures. Of total number of arrivals in the region 45.2% are men (1954 pers.), the number of men who leave the country is 47.4% (2835 pers.). During the analysed period, in urban areas arrived 2844 pers. and left 4221 pers., representing 102.5% than in s.p.l.y. and 99.0%, respectively. 791 pers. arrived from 14 The analysis was conducted based on the Statistical Service of Transnistria. 61
62 outside of the region, and from region left 1718 pers. In villages arrived 1477 pers. and left 1760 pers., representing 93.5% and 95.4%, respectively compared to the previous period. The number of marriages registered was 2069, compared to January-September 2015 decreased by 15.6%. The number of divorces reached 1246, increasing by 0.7% compared to the previous period. Labor market. On October 1, 2016, the number of employees in all economic organisations (except small enterprises, religious and non-profit organisations, security structures and customs authorities) amounted to 98.3 thousand pers., decreasing by 1524 pers. or by 1.5% compared to the same period of the previous year. Since the beginning of 2016, pers. of all citizens registered to the employment agencies were employed, including 611 pers. to newly created jobs. The procent of substitution of pensioners with new employees was 97.6%. During January-September 2016, persons laid off from institutions and organisations representing 13.1% on the staff number of employees since the beginning of the year. The main reason of dismissal is worker s own initiative, pers. are in this category (85.3%). According to the Social Insurance Fund of Transnistria, at the end of September 2016, the number of citizens officially registered as unemployed amount to 4137 pers., by 31.8% more than at the end of September pers. or 53.6% are women of total number of registered citizens. During January-September 2016 through the Transnistrian Agency for Employment 6120 pers. were recorded as unemployed, of them 3010 pers. are women (49.2% of total number of registered citizens). During January-September 2016, thousand rubles were spent for payment of unemplyment benefits pers. received unemployment benefits, the average amount of unemployment benefits in January-September rubles or 33.6% of the budget on average subsistence minimum per capita. Labor remuneration. During January-September 2016 the average monthly nominal salary calculated for an employee in the region (except small enterprises and religious and non-profit organisations, security structures and customs authorities) amounted to 3810 rubles, or 98.9% than in s.p.l.y. The average salary on state organisations amounted to 2699 rubles, increasing by 1.5% compared to s.p.l.y. During the reference period 15, the average monthly nominal salary calculated for an employee was higher than the average salary in the region in the following economic branches: Electro and radio-communication (9584 rubles or 852 US Dollars), Banks and credits (7079 rubles or 629 US Dollars), Insurances (6884 rubles or 612 US Dollars), Information and computer services (5246 rubles or 466 US Dollars), Industry (4931 rubles or 438 US Dollars), Constructions (4485 rubles or 399 US Dollars), Real estate transactions (4320 rubles or 384 US Dollars), Governing and control bodies (4281 rubles or 381 US Dollars), Transport (3916 rubles or 348 US Dollars), Trade and food services (3837 rubles or 341 US Dollars). The average monthly nominal salary calculated for an employee was lower than the average salary in the region in the following economic branches: Geology and meteorology (2001 rubles or 178 US Dollars), Social assistence (2108 rubles or 187 US Dollars), Postal communication (2322 rubles or 206 US Dollars), Culture and art (2409 rubles or 214 US Dollars), Education (2670 rubles or 237 US Dollars), Health (2700 rubles or 240 US Dollars), Forestry (2585 rubles or 230 US Dollars), Agriculture (3151 rubles or 280 US Dollars), Science (3056 rubles or 272 US Dollars). In industry the highest monthly nominal salary during the reference period was registered for the employees of the following branches: electricity 6082 rubles or 541 US Dollars, which is higher than the average salary in the region by 59.6%; steel industry 5545 rubles or 493 US 15 The official average exchange rate of the monetary authority of the region to the left bank of the Dniester River in January- September, 2016: 1 US Dollar= rubles ( 62
63 Dollars or by 45.5% higher than the average salary in economy; manufacturing of machinery and processing of metals 5133 rubles or 456 US Dollars or by 34.7% higher than the average salary in economy; food industry 4562 rubles or 406 US Dollars or by 19.7% higher than the average salary in economy; printing industry rubles or 375 US Dollars or by 10.8% higher than the average salary in economy; chemical industry 4167 rubles or 370 US Dollars or by 9.4% higher than the average salary in economy; construction materials industry 4100 rubles or 364 US Dollars or by 7.6% higher than the average salary in economy; milling and baking industry 4017 rubles or 357 US Dollars or by 5.4% higher than the average salary in economy; light industry 3927 rubles or 349 US Dollars or by 3.1% higher than the average salary in economy. Social protection of population. During January-September 2016, the average number of pensioners equated to pers., of these pers. benefited from labor pension and 4205 pers. from social pension. The average amount of the pensions was rubles (labor pension rubles and social pension rubles), more by 1.4% compared to the same period of the previous year. Subsistence minimum. In January-September 2016 the amount of the subsistence minimum on average per capita amounted to rubles per month, which is less by 1.8% than in s.p.l.y. Table 6.3. Subsistence minimum in the region from the left bank of the Dniester River in Quarter III of 2016 (average per person, rubles per month) Including: Able to work Children Total population Pensioners aged under 6 from 7 to 15 Men Women years years January February March April May June July August September Source: According to the data of the Transnistrian Statistical Service. Crimes. During January-September 2016, according to the the public order protection bodies were registered 8049 requests and reports on crimes which is by 6.8% less compared to the same period of last year. During the reference period, the level of crimes in region, in terms of crime type include: 14 murders, 41 intentional severe injuries, 58 rapes and other crimes against sexual integrity, 208 crimes related to illegal trafficking of arms, 63 crimes committed by use of arms, munitions and explosives, 441 crimes against public order, 524 drug-related crimes, 839 thefts, 114 robberies, 93 hooliganisms, 18 corruption cases (bribery), 801 other crimes etc. During the reviewed period, 3184 crimes were investigated of which 661 (20.8%) crimes were committed by persons previously convicted, 415 (13.0%) by women, 298 (9.4%) by groups of individuals, 212 (6.7%) crimes committed by minors, 401 (12.6%) crimes committed in a state of alcoholic drunkenness, a narcotic state or other condition. As a result of these crimes, 1760 pers. sufferred, including 27 pers. died (1.5%), and 30 pers (1.7%) were caused serious health injuries. 63
64 STATISTICAL ANNEXES 64

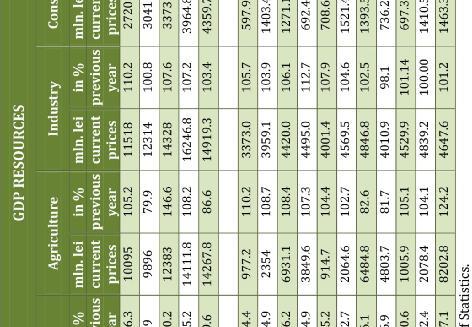
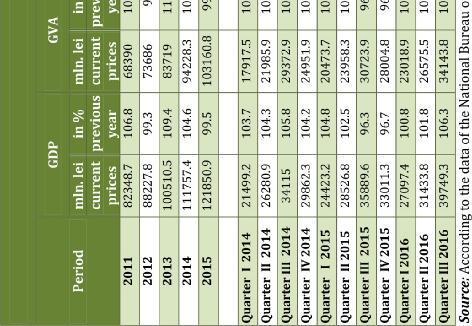
65

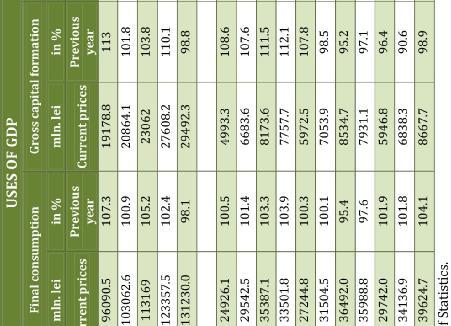
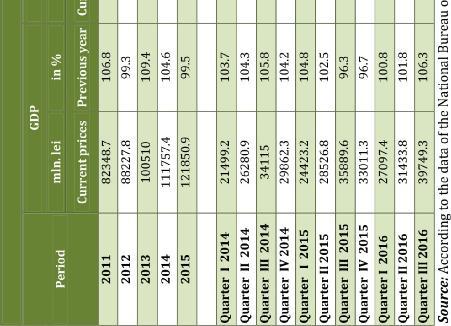
66 66

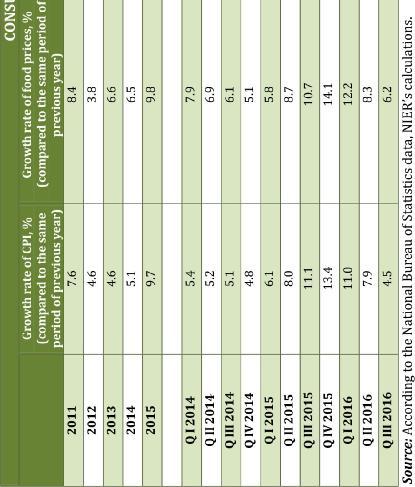
67 67

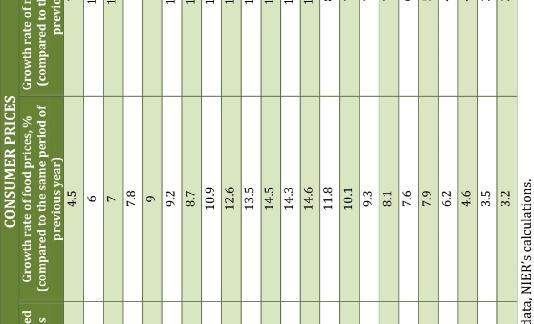
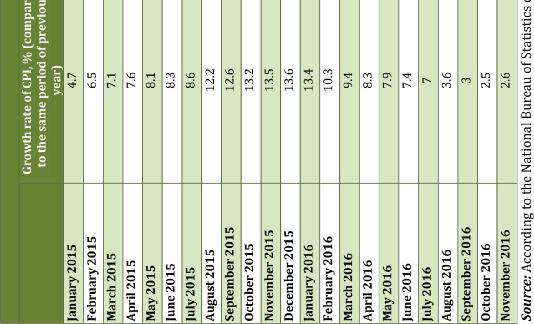
68 68

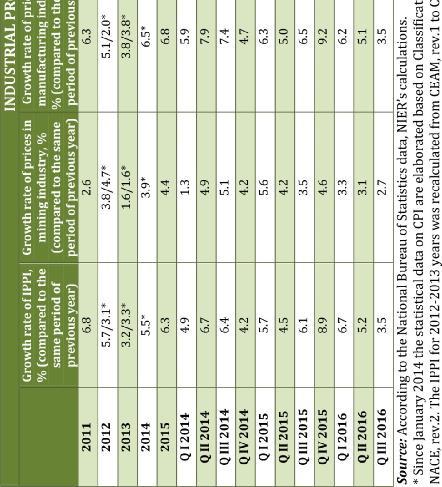
69 69


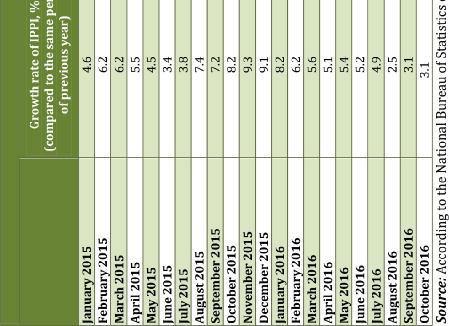
70 70


71 71

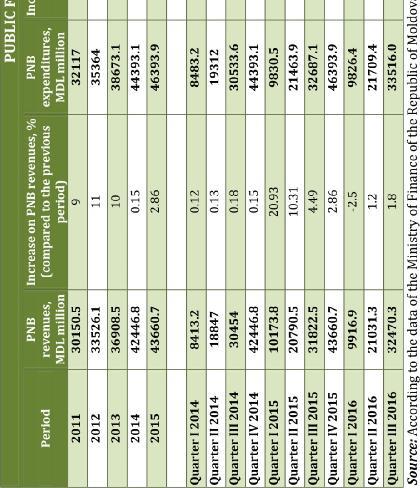
72 72

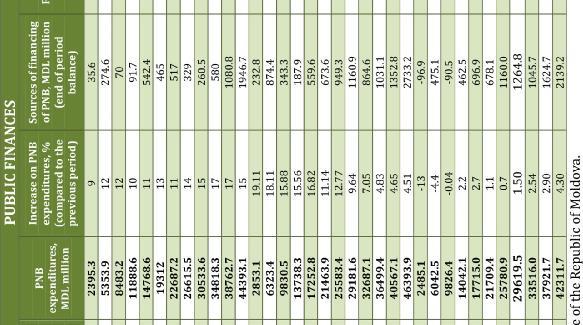
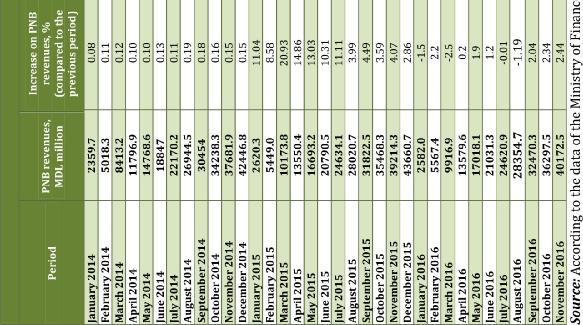
73 73

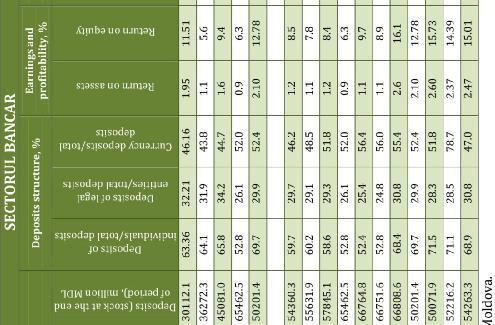

74 74

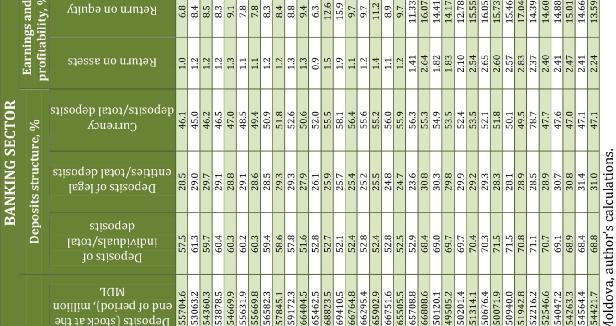
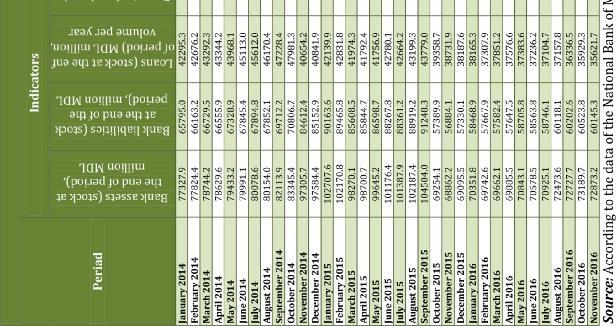
75 75

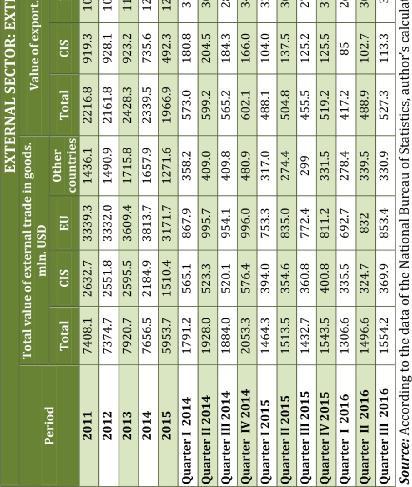
76 76

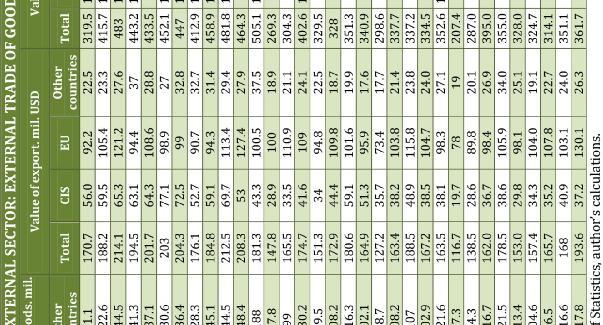
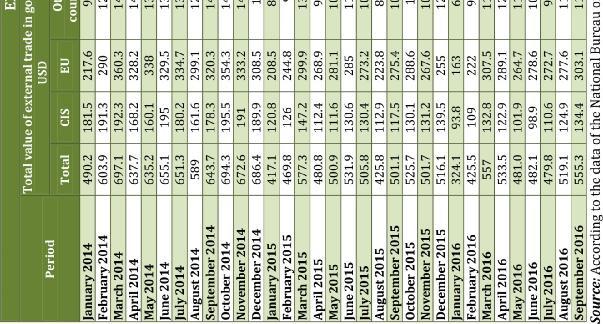
77 77

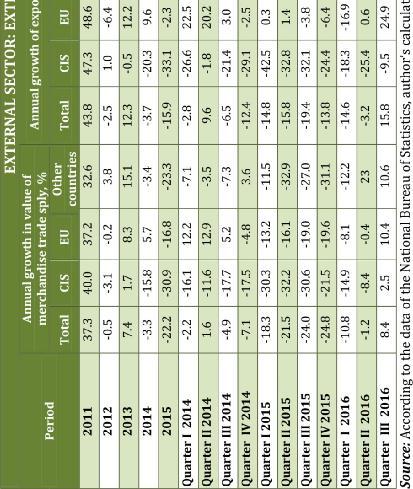
78 78

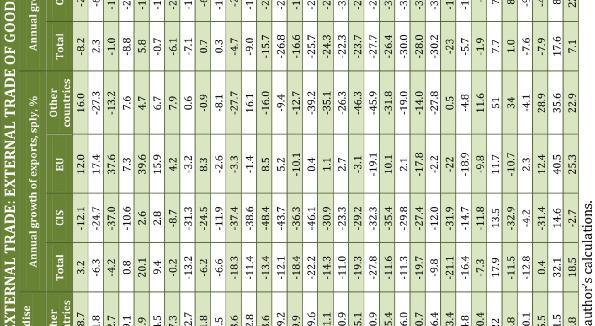
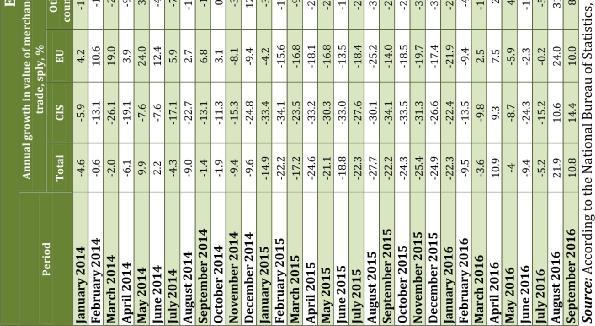
79 79

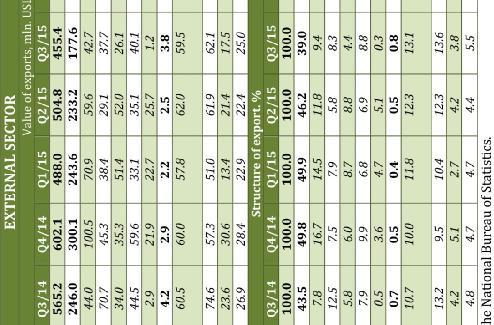
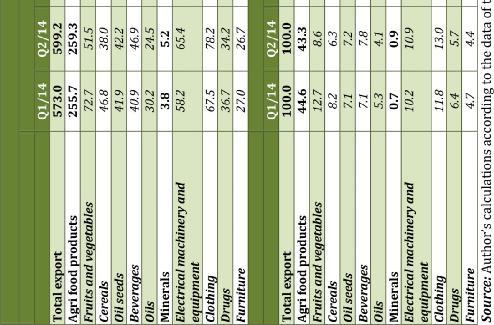
80 80


81 81

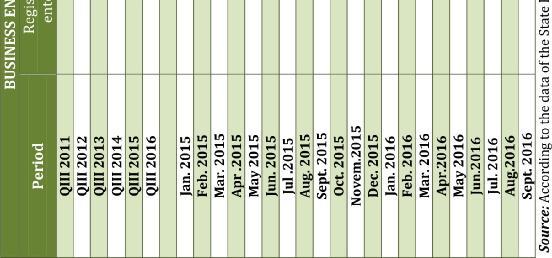
82 82


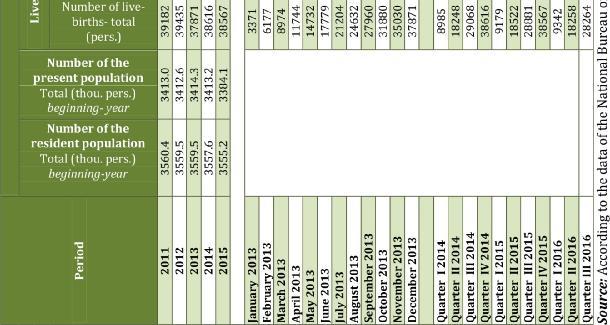
83 83

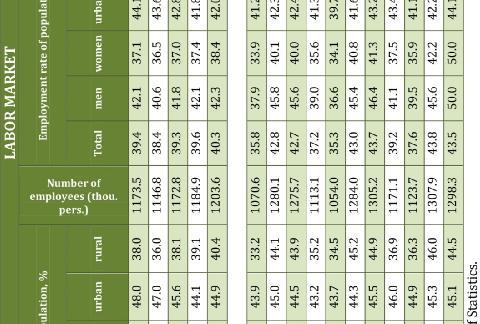
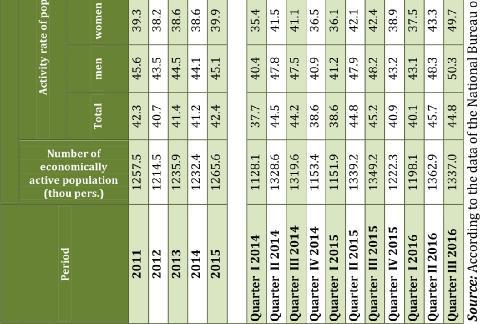
84 84

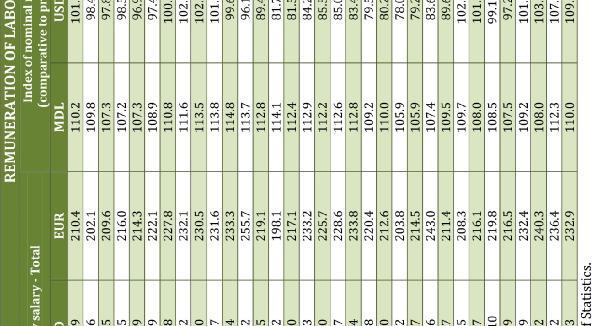
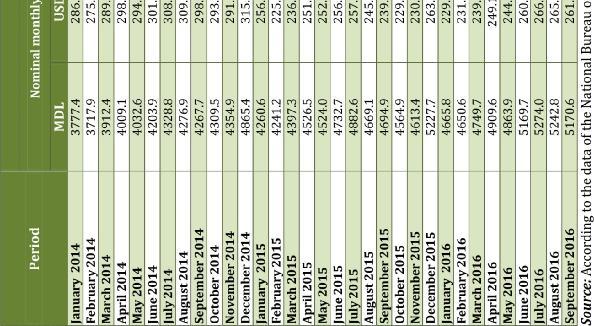
85 85


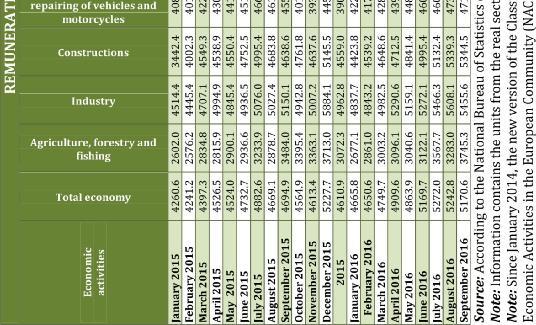
86 86

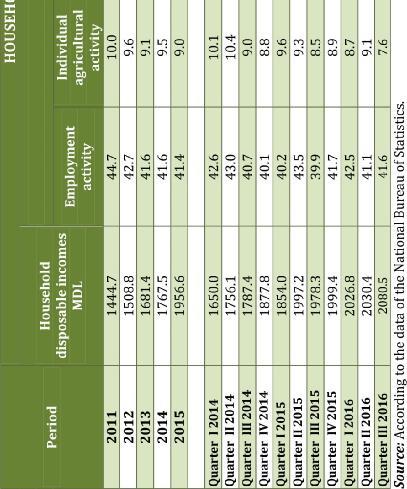
87 87
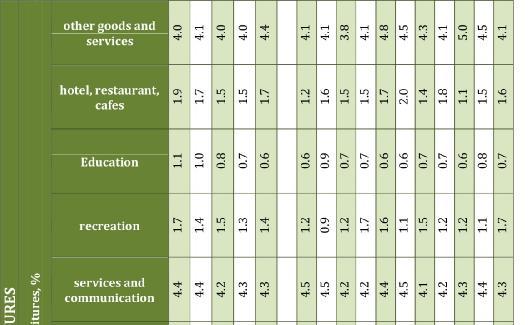
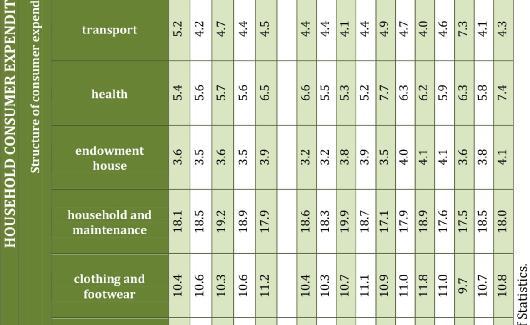
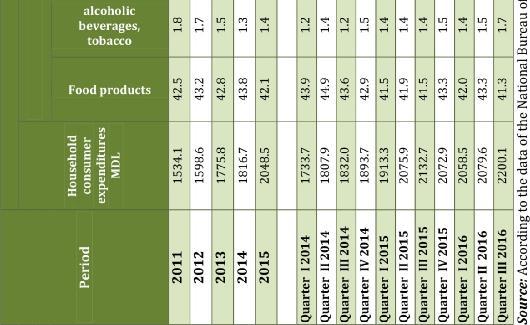
88 88

89 89
MOLDOVAN ECONOMIC TRENDS
 Academy of Sciences of Moldova National Institute for Economic Research Ministry of Economy of the Republic of Moldova MOLDOVAN ECONOMIC TRENDS ISSN 1857 3134 Chisinau ISSN 1857 3134 AUTHORS: Alexandru
MOLDOVAN ECONOMIC TRENDS
 Academy of Sciences of Moldova National Institute for Economic Research Ministry of Economy of the Republic of Moldova MOLDOVAN ECONOMIC TRENDS ISSN 1857-3134 Chisinau Supported by the European Union High
ECONOMIC MONITOR MOLDOVA Issue 7 January 2018
 ECONOMIC MONITOR MOLDOVA Issue 7 January 218 Overview Economic growth at 3.5% in 217 Weaker growth of 3.% expected in 218 due to decreased consumption demand Inflation at 6.6% in average during 217; lower
MOLDOVAN ECONOMIC TRENDS
 Academy of Sciences of Moldova Institute of Economy, Finance and Statistics Ministry of Economy of the Republic of Moldova MOLDOVAN ECONOMIC TRENDS Nr. 6 (Q II) 2012 ISSN 1857 3134 Chisinau Supported by
ECONOMIC MONITOR MOLDOVA Issue 8 June 2018
 ECONOMIC MONITOR MOLDOVA Issue 8 June 218 Overview Economic growth of 4.5% in 217, slowdown to low 3.8% expected for 218 Growth driven by private consumption, also positive contribution from investment
National Bank of Moldova
 Note Monetary Policy Report no. 3, August 2010 was prepared bearing on the most recent statistical data compiled by the National Bank of Moldova, National Bureau of Statistics, Ministry of Economy and
Priorities of the Government of the Republic of Moldova in the area of attracting investments and promoting exports
 Ministry of Economy and Infrastructure of the Republic of Moldova Priorities of the Government of the Republic of Moldova in the area of attracting investments and promoting exports THE REPUBLIC OF MOLDOVA
Highlights 2/2017. Main topics: Ministry of Finance of the Republic of Bulgaria. Economic and Financial Policy Directorate ISSN
 BULGARIAN месечен ECONOMY обзор Monthly Report Ministry of Finance of the Republic of Bulgaria 2/217 Economic and Financial Policy Directorate ISSN 2367-2 Main topics:» Gross domestic product» Short-term
OFFICIAL DEVELOPMENT ASSISTANCE STATE CHANCELLERY JULY 9, 2015
 OFFICIAL DEVELOPMENT ASSISTANCE 2014 STATE CHANCELLERY JULY 9, 2015 SOURCES OF DATA COLLECTION 1. DEVELOPMENT PARTNERS 2. CENTRAL PUBLIC AUTHORITIES 3. AID MANAGEMENT PLATFORM (www.amp.gov.md) ODA DISBURSED
Regional Economic Integration of the Republic of Moldova: Opportunities and Challenges
 Regional Economic Integration of the Republic of Moldova: Opportunities and Challenges Octavian CALMÎC, Deputy Minister of Economy of the Republic of Moldova, Chişinău 2015 Republic of Moldova: geo - economic
NBS MoNthly BulletiN december 2017
 Published by: Národná banka Slovenska Address: Národná banka Slovenska Imricha Karvaša 1, 81 Bratislava Slovakia Contact: +1//787 1 http://www.nbs.sk Discussed by the Bank Board on 19 December 17. All
NBS MoNthly BulletiN december 2016
 Published by: Národná banka Slovenska Address: Národná banka Slovenska Imricha Karvaša 1, 813 5 Bratislava Slovakia Contact: +1//5787 1 http://www.nbs.sk Discussed by the Bank Board on December 1. All
International Monetary Fund Washington, D.C.
 2004 International Monetary Fund May 2004 IMF Country Report No. 04/140 January 29, 2001 January 29, 2001 January 29, 2001 January 29, 2001 January 29, 2001 Republic of Belarus: Statistical Appendix This
National Bank of Moldova. Translation. Annual Report. 1 Grigore Vieru Avenue MD 2005 Chișinău
 National Bank of Moldova Translation Annual Report 2012 1 Grigore Vieru Avenue MD 2005 Chișinău www.bnm.md E-mail: official@bnm.md Annual Report (NBM, 2012) Note The report was compiled using the latest
SUMMARY OF MACROECONOMIC DEVELOPMENTS
 SUMMARY OF MACROECONOMIC DEVELOPMENTS NOVEMBER 2018 2 Summary of macroeconomic developments, November 2018 Indicators of global economic activity suggest a continuation of solid growth in the final quarter
International Monetary Fund Washington, D.C.
 2007 International Monetary Fund February 2007 IMF Country Report No. 07/48 Ukraine: Statistical Appendix This Statistical Appendix for Ukraine was prepared by a staff team of the International Monetary
The Republic of Moldova: Key developments and Challenges
 The Republic of Moldova: Key developments and Challenges Investment opportunities Calmic Octavian, deputy minister Ministry of Economy of the Republic of Moldova May, 2011 Economic recovery GDP compared
All data in the edition are the last available data as of May 2017
 All data in the edition are the last available data as of May 2017 The quoted data set in this report are the last available data, published in the official source s web sites. The sources are Ministry
NBS MoNthly BulletiN february 2017
 Published by: Národná banka Slovenska Address: Národná banka Slovenska Imricha Karvaša 1, 813 5 Bratislava Slovakia Contact: +41//5787 146 http://www.nbs.sk All rights reserved. Reproduction for educational
Turkey: Recent Developments and Future Prospects. ISBANK Economic Research Division October 2018
 Turkey: Recent Developments and Future Prospects ISBANK Economic Research Division October 2018 Macroeconomic Outlook Strong Economic Growth Cycle GDP of 851 bn USD (2017), 10.6k USD (2017) per capita
Romania Macroeconomic Situation
 November 13 Valentyn Povroznyuk, Radu Mihai Balan, Edilberto L. Segura GDP grew by.7% over 9 months of 13. Industrial production grew by.3% yoy in August 13. The consolidated budget deficit reached 1.3%
Kazakhstan s economy expanded by 4.2% in 1H17, supported by growth in mining, manufacturing, construction and transportation sectors
 Economics Research Desk Market Highlights: Kazakhstan 18 July 2017 Kazakhstan s economy expanded by 4.2% in 1H17, supported by growth in mining, manufacturing, construction and transportation sectors Review
Economic Update 9/2016
 Economic Update 9/ Date of issue: 10 October Central Bank of Malta, Address Pjazza Kastilja Valletta VLT 1060 Malta Telephone (+356) 2550 0000 Fax (+356) 2550 2500 Website https://www.centralbankmalta.org
COSTA RICA. 1. General trends
 Economic Survey of Latin America and the Caribbean 2016 1 COSTA RICA 1. General trends According to new official statistics, the Costa Rican economy grew by 3.7% in real terms in 2015, up from 3% in 2014,
4. Balance of Payments and Foreign Trade
 24 4. Balance of Payments and Foreign Trade 4. Balance of Payments and Foreign Trade Current account deficit in 2014 was lower than the one realised in 2013 In the period January- November 2014, current
Economic UpdatE JUnE 2016
 Economic Update June Date of issue: 30 June Central Bank of Malta, Address Pjazza Kastilja Valletta VLT 1060 Malta Telephone (+356) 2550 0000 Fax (+356) 2550 2500 Website https://www.centralbankmalta.org
Inflation projection of Narodowy Bank Polski based on the NECMOD model
 Economic Institute Inflation projection of Narodowy Bank Polski based on the NECMOD model Warsaw / 9 March Inflation projection of the NBP based on the NECMOD model Outline: Introduction Changes between
South Region Committee Brexit and the Associated Challenges
 South Region Committee Brexit and the Associated Challenges event in Tralee with Jim Power Tralee, 17 October 2017 Brexit and the Associated Challenges The Institute of Banking, Tralee October 17 th 2017
Netherlands. May 2018 Statistical Factsheet
 May 2018 Statistical Factsheet Netherlands CONTENTS Main figures 1. KEY DATA 2. POPULATI ON & ECONOMY 3. FINANCIAL ASPECTS 4. ECONOMI C ACCOUNTS 5. AGRICULTURAL TRADE 6. FARM STRUCTURE 1 2 3 4-5 6-12 13-14
Italy. May 2018 Statistical Factsheet
 May 2018 Statistical Factsheet Italy CONTENTS Main figures 1. KEY DATA 2. POPULATI ON & ECONOMY 3. FINANCIAL ASPECTS 4. ECONOMI C ACCOUNTS 5. AGRICULTURAL TRADE 6. FARM STRUCTURE 1 2 3 4-5 6-12 13-14 15-16
Austria. May 2018 Statistical Factsheet
 May 2018 Statistical Factsheet Austria CONTENTS Main figures 1. KEY DATA 2. POPULATI ON & ECONOMY 3. FINANCIAL ASPECTS 4. ECONOMI C ACCOUNTS 5. AGRICULTURAL TRADE 6. FARM STRUCTURE 1 2 3 4-5 6-12 13-14
Estonia. May 2018 Statistical Factsheet
 May 2018 Statistical Factsheet Estonia CONTENTS Main figures 1. KEY DATA 2. POPULATI ON & ECONOMY 3. FINANCIAL ASPECTS 4. ECONOMI C ACCOUNTS 5. AGRICULTURAL TRADE 6. FARM STRUCTURE 1 2 3 4-5 6-12 13-14
SUMMARY OF SELECTED ECONOMIC INDICATORS
 SUMMARY OF SELECTED ECONOMIC INDICATORS RECENT DATA GRAPHS HISTORICAL DATA GRAPHS P.E.I. CONSUMER PRICE INDEX P.E.I. LABOUR FORCE STATISTICS CANADA/P.E.I. GROSS DOMESTIC PRODUCT, INCOME-BASED CANADA /
Financial Stability Review. January June, Financial stability review. Central Bank of the Republic of Azerbaijan
 21 Financial Stability Review January June, 21 Financial stability review Central Bank of the Republic of Azerbaijan January June 21 Table of Contents Summary 4 1. Financial markets. 6 1.1. Foreign exchange
Short term indicators in April 2009
 29:4 3 April 29.3% growth of GDP in 28.9% decrease of GDP in 4 th quarter 28 Gross Domestic Product 28 and 4th quarter 28 The present figures show Gross Domestic Product (GDP) in 28 amounting to 1,465
France. May 2018 Statistical Factsheet
 May 2018 Statistical Factsheet France CONTENTS Main figures 1. KEY DATA 2. POPULATI ON & ECONOMY 3. FINANCIAL ASPECTS 4. ECONOMI C ACCOUNTS 5. AGRICULTURAL TRADE 6. FARM STRUCTURE 1 2 3 4-5 6-12 13-14
HONDURAS. 1. General trends
 Economic Survey of Latin America and the Caribbean 2016 1 HONDURAS 1. General trends Economic growth in Honduras picked up in 2015, reaching 3.6%, compared with 3.1% in 2014. This performance was mainly
Dismantling the myths about Moldova s trade failures after implementing the Association Agreement
 Dismantling the myths about Moldova s trade failures after implementing the Association Agreement Authors: Adrian Lupușor Vadim Gumene This publication was developed under the Project Understanding the
Invest in Moldova An insider s perspective. 3 February 2017 EBA MOLDOVA
 Invest in Moldova An insider s perspective 3 February 2017 EBA MOLDOVA EBA Moldova >50 Members European companies Moldovan companies exporters, service providers, etc. Member of European Business Organization
Greece. Sources: European Commission, Eurostat, and Directorate General for Economic and Financial Affairs. Updated: M ay 2018
 May 2018 Statistical Factsheet Greece CONTENTS Main figures 1. KEY DATA 2. POPULATI ON & ECONOMY 3. FINANCIAL ASPECTS 4. ECONOMI C ACCOUNTS 5. AGRICULTURAL TRADE 6. FARM STRUCTURE 1 2 3 4-5 6-12 13-14
II. ESTONIAN BALANCE OF PAYMENTS FOR 2001
 18 II ESTONIAN BALANCE OF PAYMENTS FOR 2001 In 2001 a rapid slowdown of economic growth was registered with all Estonia s major export partners The negative import growth of the euro area Finland and Sweden
National Bank of the Republic of Macedonia Research Department. Monthly Information 10/2012
 National Bank of the Republic of Macedonia Research Department Monthly Information 1/212 November, 212 Summary During October 212, the National Bank kept the key interest rate at the level of 3.75%, assessing
BULGARIA: ECONOMIC AND MARKET ANALYSES Monthly report, August 2015
 BULGARIA: ECONOMIC AND MARKET ANALYSES Monthly report, August 2015 All data in the edition are the last available data as of 29 of August 2015 The quoted data set in this report are the last available
Statistical Factsheet. France CONTENTS. Main figures - Year 2016
 June 2017 Statistical Factsheet France CONTENTS Main figures 2016 1. KEY DATA 2. POPULATION & ECONOMY 3. FINANCIAL ASPECTS 4. ECONOMIC ACCOUNTS 5. AGRICULTURAL TRADE 6. FARM STRUCTURE 1 2 3 4-5 6-12 13-14
Statistical Factsheet. Belgium CONTENTS. Main figures - Year 2016
 June 2017 Statistical Factsheet Belgium CONTENTS Main figures 2016 1. KEY DATA 2. POPULATION & ECONOMY 3. FINANCIAL ASPECTS 4. ECONOMIC ACCOUNTS 5. AGRICULTURAL TRADE 6. FARM STRUCTURE 1 2 3 4-5 6-12 13-14
Statistical Factsheet. Italy CONTENTS. Main figures - Year 2016
 June 2017 Statistical Factsheet Italy CONTENTS Main figures 2016 1. KEY DATA 2. POPULATION & ECONOMY 3. FINANCIAL ASPECTS 4. ECONOMIC ACCOUNTS 5. AGRICULTURAL TRADE 6. FARM STRUCTURE 1 2 3 4-5 6-12 13-14
Denmark. Sources: European Commission, Eurostat, and Directorate General for Economic and Financial Affairs. Updated: M ay 2018
 May 2018 Statistical Factsheet Denmark CONTENTS Main figures 1. KEY DATA 2. POPULATI ON & ECONOMY 3. FINANCIAL ASPECTS 4. ECONOMI C ACCOUNTS 5. AGRICULTURAL TRADE 6. FARM STRUCTURE 1 2 3 4-5 6-12 13-14
THE ROLE OF INVESTMENT IN A SUSTAINABLE DEVELOPMENT OF THE ECONOMY OF LATVIA ABSTRACT
 УПРАВЛЕНИЕ И УСТОЙЧИВО РАЗВИТИЕ 1-2/25(12) MANAGEMENT AND SUSTAINABLE DEVELOPMENT 1-2/25(12) THE ROLE OF INVESTMENT IN A SUSTAINABLE DEVELOPMENT OF THE ECONOMY OF LATVIA Maija Senfelde Technical University
GUATEMALA. 1. General trends
 Economic Survey of Latin America and the Caribbean 2016 1 GUATEMALA 1. General trends In 2015, Guatemala s GDP grew by 4.1% in real terms (a figure similar to the 4.2% recorded the previous year), driven
Statistical Factsheet. Lithuania CONTENTS. Main figures - Year 2016
 June 2017 Statistical Factsheet Lithuania CONTENTS Main figures 2016 1. KEY DATA 2. POPULATION & ECONOMY 3. FINANCIAL ASPECTS 4. ECONOMIC ACCOUNTS 5. AGRICULTURAL TRADE 6. FARM STRUCTURE 1 2 3 4-5 6-12
Valentyn Povroznyuk, Radu Mihai Balan, Edilberto L. Segura
 September 214 GDP grew by 1.2% yoy in Q2 214. Industrial output growth was equal to 1.4% yoy in June 214. The consolidated budget deficit narrowed to.2% of GDP in January-July 214. Consumer inflation slightly
Structural changes of Romanian economy
 Bulletin of the Transilvania University of Braşov Series V: Economic Sciences Vol. 8 (57) No. 2-2015 Structural changes of Romanian economy Constantin DUGULEANĂ 1 Abstract: Economic activity in Romania
ECONOMIC OUTLOOK. September, 2017 MINISTRY OF ECONOMY AND SUSTAINABLE DEVELOPMENT
 ECONOMIC OUTLOOK September, 2017 MINISTRY OF ECONOMY AND SUSTAINABLE DEVELOPMENT CONTENTS GDP growth... 3 Potential Level of Economic Growth and GDP Gap... 3 Macroeconomic Environment in the Region...
MACROECONOMIC FORECAST
 MACROECONOMIC FORECAST Spring 17 Ministry of Finance of the Republic of Bulgaria Bulgarian economy is expected to expand by 3% in 17 driven by domestic demand. As compared to 16, the external sector will
CATALOGUE of statistical publications
 National Bureau for Statistics of the Republic of Moldova CATALOGUE of statistical publications 2008 Chisinau 2008 Contents pag. Services offered by NBS... 4 Annual publications Statistical Yearbook of
Monthly policy monetary report October monetary policy monthly report
 Monthly policy monetary report October 2006 monetary policy monthly report OCTOBER 2006 October 2006 Monthly policy monetary report Main highlights Inflation developments Annual inflation in October experienced
Ukraine and the Global Economic Crisis
 Ukraine and the Global Economic Crisis by Mykola Kulinich Ambassador of Ukraine to Japan 23 October, 2009 The Structure of the Lecture 1. General information about economy of Ukraine. 2.Ukraine and the
Eesti Pank ESTONIA S BALANCE OF PAYMENTS FOR 2015
 Eesti Pank ESTONIA S BALANCE OF PAYMENTS FOR 215 216 Eesti Pank, 215 Address Estonia pst 13 1595 Tallinn Estonia Telephone +372 668 719 E-mail info@eestipank.ee Website www.eestipank.ee ISSN 1736-7859
Latest economic developments in Greece and Challenges for the Trade Finance Market
 Latest economic developments in Greece and Challenges for the Trade Finance Market Peter Sanfey Deputy Director, Country Economics and Policy, EBRD 15 September 216, Bank of Greece, Athens The Greek economy:
Turkey: Recent Developments and Future Prospects. ISBANK Economic Research Division May 2018
 Turkey: Recent Developments and Future Prospects ISBANK Economic Research Division May 2018 Macroeconomic Outlook Strong Economic Growth Cycle GDP of 851 bn USD (2017), 10.6k USD (2017) per capita Average
SESAVALI INFLATION REPORT NATIONAL BANK OF GEORGIA
 SESAVALI INFLATION REPORT NATIONAL BANK OF GEORGIA 29 21 211 212 1 NATIONAL BANK OF GEORGIA INFLATION REPORT Q2 212 TBILISI CONTENTS 1 INTRODUCTION...5 2 CHANGE IN CONSUMER PRICES...7 3 INFLATION FACTORS...
Radu Mihai Balan, Edilberto L. Segura
 April 15 GDP expanded by.9% yoy in 1, reaching EUR 15.7 billion. Industrial output expanded 1.% yoy in January, slowing down from 3.1% yoy in December. The consolidated budget deficit posted a.33% of GDP
The Greek economy comes out of recession much more gradually than anticipated, while structural weaknesses inhibit growth.
 ISSUE 23 15 May 2017 INDEX Main indicators 3 Economic climate 4 Employment, prices, wages 5 Industry, trade, services 6 Exports, tourism 7 European Commission s spring forecasts for Greece (European Commission,
National Accounts Estimates ( ) September 2018 issue
 September 2018 issue") National Accounts Estimates (2015 2018) September 2018 issue 1. INTRODUCTION This issue of Economic and Social Indicators presents National Accounts estimates for the period 2015 to 2018. Concepts and
National Accounts Estimates (2015 2018) September 2018 issue 1. INTRODUCTION This issue of Economic and Social Indicators presents National Accounts estimates for the period 2015 to 2018. Concepts and
Countries of the CIS
 Countries Socio-economic Statistics Key Publications A summary of key publications from (StatCommittee) comprising socio-economic statistics on the twelve countries of the Commonwealth of Independent States:
4. Balance of Payments and Foreign Trade
 4. Balance of Payments and Foreign Trade 25 In Q2 the current account deficit was 383 million euros, i.e. 4.8% of GDP In 2014 we expect the current account deficit to stay at around 5% of GDP Growth of
Quarterly Assessment of the Economy
 2 Quarterly Assessment of the Economy No. 4, Q III/213 12 1 8 6 4 1 2 3 4 5 6 7 8 9 Summary Economic activity in Kosovo has continued to grow also in Q3 213. In this context, it is worth mentioning the
Footnotes for enlargement countries
 26 June 2018 Footnotes for enlargement countries Contents Living conditions... 2 Wages and salaries... 3 Education... 4 Labour force... 6 Sector accounts/government finance statistics... 8 Balance of payments...
ECONOMIC SURVEY OF LATIN AMERICA MONTSERRAT
 UN TED NATIIONS nt* ECONO I[C / Apiza) SOCIAL COUNCII_ Distr. LIMITED E/CEPAL/L.286/Add.24 June 1984 ORIGINAL: INGLES ECLA Economic Commission for Latin America BIBUCTECA EACTUNES MBAS MEM ECONOMIC SURVEY
GDP growth accelerates at year-end, although risks remain
 Activity Spain: The GDP growth forecast for 4Q18 supports the 2.6% advance for 2018 Spain and Portugal Unit 14 December 2018 The growth of the Spanish economy could stand between 0.7% and 0.8% quarterly
GROSS DOMESTIC PRODUCT, SECOND QUARTER OF 2017 (PRELIMINARY DATA)
") GROSS DOMESTIC PRODUCT, SECOND QUARTER OF 2017 (PRELIMINARY DATA) In the second quarter of 2017 Gross Domestic Product (GDP) 1 at current prices amounts to 24 149 million BGN. In Euro terms GDP is 12 347
GROSS DOMESTIC PRODUCT, SECOND QUARTER OF 2017 (PRELIMINARY DATA) In the second quarter of 2017 Gross Domestic Product (GDP) 1 at current prices amounts to 24 149 million BGN. In Euro terms GDP is 12 347
BELIZE. 1. General trends
 Economic Survey of Latin America and the Caribbean 2017 1 BELIZE 1. General trends The Belizean economy experienced a reversal of fortunes in 2016, with growth dropping to -0.8% from 2.9% in 2015. A sharp
The real change in private inventories added 0.22 percentage points to the second quarter GDP growth, after subtracting 0.65% in the first quarter.
 QIRGRETA Monthly Macroeconomic Commentary United States The U.S. economy bounced back in the second quarter of 2007, growing at the fastest pace in more than a year. According the final estimates released
Kazakhstan: on the wave of structural reforms. Aset Irgaliyev, PhD First Deputy Chairman Economic Research Institute
 Kazakhstan: on the wave of structural reforms Aset Irgaliyev, PhD First Deputy Chairman Economic Research Institute September 2015 New economic reality: transformation of global economy Over the last 12
NATIONAL BANK OF ROMANIA
 1 The annual inflation rate dropped below the mid-point of the ±1pp variation band around the 3% target set by the NBR for 212 12 annual percentage change 1 8 Target 2 5. 2 Target 27. Target 28 3.8 Target
National Bank of Moldova. Translation. Annual Report. 1 Grigore Vieru Avenue MD 2005 Chișinău
 National Bank of Moldova Translation Annual Report 2014 1 Grigore Vieru Avenue MD 2005 Chișinău www.bnm.md E-mail: official@bnm.md Annual Report (NBM, 2014) Note The report was compiled using the latest
Ministry of Finance of Georgia. Georgia The Outlook. January 2018
 Ministry of Finance of Georgia Georgia The Outlook January 2018 Axes of Georgia s Long-Term Growth Strategy The Government of Georgia s long-term strategy seeks sustained and inclusive growth that is based
Greek growth in 2017: Investment recovers while consumption stagnates!
 ISSUE 32 12 March 2018 INDEX Investment by asset type and contribution to growth (ELSTAT, quarterly national accounts, Q4 ) Main indicators 4 Economic climate 5 Employment, prices, wages 6 Industry, trade,
Country Report UZBEKISTAN
 Regional Course on SNA 2008 (Special Topics): Improving Exhaustiveness of GDP Coverage 22 30 August 2016 Daejeon, Republic of Korea Country Report UZBEKISTAN Data sources and estimation methods for compiling
Economic Survey of Latin America and the Caribbean CHILE. 1. General trends. 2. Economic policy
 Economic Survey of Latin America and the Caribbean 2017 1 CHILE 1. General trends In 2016 the Chilean economy grew at a slower rate (1.6%) than in 2015 (2.3%), as the drop in investment and exports outweighed
Quarterly National Accounts Inventory Croatia
 Quarterly National Accounts Inventory Croatia IPA 2011 Multi-beneficiary Statistical Co-operation Programme Contact persons: Verica Roknić (RoknicV@dzs.hr) - GDP by Expenditure Approach Department Natalija
National Bureau of Statistics Ministry of Finance Dar-es-Salaam
 THE UNITED REPUBLIC OF TANZANIA National Bureau of Statistics Ministry of Finance Dar-es-Salaam October, 2013 PREFACE The publication National Accounts of Tanzania Mainland 2001-2012 is the fifth in the
Economic activity gathers pace
 Produced by the Economic Research Unit October 2014 A quarterly analysis of trends in the Irish economy Economic activity gathers pace Positive data flow Recovery broadening out GDP growth revised up to
Ministry of Finance January March 2018
 milion euro Government of the Republic of Kosovo Macroeconomic Overview Ministry of Finance January March 218 The Macroeconomic Overview is published by the Ministry of Finance every three months and its
Economic connectivity in European conflict regions - The case of Transnistria -
 Economic connectivity in European conflict regions - The case of Transnistria - Workshop at Vienna Institute for International Economic Studies (wiiw) Jörg Radeke, Berlin Economics Vienna, 01 July 2016
UKRAINE Market Monitor Review January-June 2018
 Picture: FSLC Ukraine UKRAINE Market Monitor Review January-June 218 HIGHLIGHTS Ukrainian economy continued its gradual growth for the third year in a row with 3.1 percent GDP increase in the first quarter
II. Macroeconomic Developments 2.1 Economic Growth. Overview QUARTERLY ECONOMIC BRIEF UNITED NATIONS DEVELOPMENT PROGRAMME ETHIOPIA.
 QUARTERLY ECONOMIC BRIEF UNITED NATIONS DEVELOPMENT PROGRAMME ETHIOPIA Volume I, 2018 Overview Economic growth recovered from the impact of drought in 2015/16 and registered 10.9 percent annual growth
5.9 Percent 4.4 Percent 10.2 Percent 9.7 Percent. autonomous federated state Head of Government Angela Merkel Horst Seehofer José Manuel Barroso 3,7%
 Economic Outlook Germany, Bavaria, Eurozone, and EU-27 General Information Germany Bavaria Eurozone EU-27 Area 357.022 km² 70.552 km² 4.324.782 km² Population 81.796.000 12.583.538 327.054.866 502.489.100
STATE AID, TAXATION AND DEVELOPMENT IN UKRAINE
 Academy of Financial Management STATE AID, TAXATION AND DEVELOPMENT IN UKRAINE Tetiana Iefymenko, President of the Academy of Financial Management, Corresponding Member of the National Academy of Sciences
2016 Economic Outlook for Ireland & Eurozone IFP Launch
 2016 Economic Outlook for Ireland & Eurozone IFP Launch December 3 rd 2015 Jim Power Global Background US & UK growing at reasonable pace Euro Zone growing well below potential Emerging markets in some
NBS MoNthly BulletiN april 2014
 Mo n t h ly Bulletin april Published by: Národná banka Slovenska Address: Národná banka Slovenska Imricha Karvaša, 8 Bratislava Slovakia Contact: +//787 http://www.nbs.sk Debated by the Bank Board on 9
Oleg Ustenko, Julia Segura, Valentyn Povroznyuk Edilberto L. Segura
 Executive Summary: With the participation of Ukraine, France, Germany and Russia, a Normandy-Four Meeting was held in Berlin on October 19, with disappointing results. Russia insisted that the so-called
Montenegrin Economic Outlook
 Montenegrin Economic Outlook Institute For Strategic Studies and Prognoses This publication is created under the project Increasing the analytical capacities of ISSP which is implemented by KOF and ISSP
GROSS DOMESTIC PRODUCT, THIRD QUARTER OF 2018 (PRELIMINARY DATA)
") GROSS DOMESTIC PRODUCT, THIRD QUARTER OF 2018 (PRELIMINARY DATA) In the third quarter of 2018 Gross Domestic Product (GDP) 1 at current prices amounts to 29 822 million BGN. In Euro terms GDP is 15 248
GROSS DOMESTIC PRODUCT, THIRD QUARTER OF 2018 (PRELIMINARY DATA) In the third quarter of 2018 Gross Domestic Product (GDP) 1 at current prices amounts to 29 822 million BGN. In Euro terms GDP is 15 248
SDMX CONTENT-ORIENTED GUIDELINES LIST OF SUBJECT-MATTER DOMAINS
 SDMX CONTENT-ORIENTED GUIDELINES LIST OF SUBJECT-MATTER DOMAINS 2009 SDMX 2009 http://www.sdmx.org/ Page 2 of 10 SDMX list of statistical subject-matter domains 1 : Overview Domain 1: Demographic and social
DEVELOPMENT TRENDS, INFLUENCE FACTORS, FORECAST MACROINDICATORS OF UKRAINE S ECONOMY FOR THE PERION UNTIL 1015
 UKRAINE COUNTRY REPORT: DEVELOPMENT TRENDS, INFLUENCE FACTORS, FORECAST MACROINDICATORS OF UKRAINE S ECONOMY FOR THE PERION UNTIL 1015 New York, October 22-24, 2012 Valeriy Heyets, Maria Skrypnychenko
GROSS DOMESTIC PRODUCT, FIRST QUARTER OF 2018 (PRELIMINARY DATA)
") GROSS DOMESTIC PRODUCT, FIRST QUARTER OF 2018 (PRELIMINARY DATA) In the first quarter of 2018 Gross Domestic Product (GDP) 1 at current prices amounts to 21 479 million BGN. In Euro terms GDP is 10 982
GROSS DOMESTIC PRODUCT, FIRST QUARTER OF 2018 (PRELIMINARY DATA) In the first quarter of 2018 Gross Domestic Product (GDP) 1 at current prices amounts to 21 479 million BGN. In Euro terms GDP is 10 982
BULGARIA STATISTICAL PANORAMA
 BULGARIA 2008 - STATISTICAL PANORAMA Basic features and specific problems of the demographic, social and economic development, R & D and the environment s conditions in the country are presented in the
GROSS DOMESTIC PRODUCT FOR THE SECOND QUARTER OF 2012
 GROSS DOMESTIC PRODUCT FOR THE SECOND QUARTER OF 2012 In the second quarter of 2012 GDP at current prices amounted to 19 007 Million Levs. In Euro terms GDP was 9 718 Million Euro or 1 330 Euro per person.
Development of Economy and Financial Markets of Kazakhstan
 Development of Economy and Financial Markets of Kazakhstan National Bank of Kazakhstan Macroeconomic development GDP, real growth, % 116 112 18 14 1 113,5 11,7 216,7223,8226,5 19,8 19,8 19,3 19,619,7 199,