MOLDOVAN ECONOMIC TRENDS
|
|
|
- Cecil Stewart
- 5 years ago
- Views:
Transcription
1 Academy of Sciences of Moldova National Institute for Economic Research Ministry of Economy of the Republic of Moldova MOLDOVAN ECONOMIC TRENDS ISSN Chisinau Supported by the European Union High Level Policy Advice Mission to the Republic of Moldova
2 ISSN AUTHORS: Alexandru Stratan, Anatolii Rojco, Tatiana Colesnicova, Victoria Clipa, Viorica Popa, Veronica Vragaleva, Alexandra Novac, Eugenia Lucasenco, Corina Gribincea, Zinaida Toaca, Sergiu Gherbovet, Zaharia Olarescu Acknowledgements This initiative was supported by the EUHLPAM Project, funded by European Union and implemented by UNDP Moldova. The MET team would like to acknowledge the cooperation with public institutions: the Ministry of Economy, the Minister of Finance, the National Bank of Moldova and the National Bureau of Statistics. All rights reserved. No information in this publication cannot be reprinted or reproduced in any form without written permission of NIER. The Moldovan Economic Trends is a quarterly publication, produced with the assistance of the European Union. The contents of this publication are the sole responsibility of National Institute for Economic Research and can in no way be taken to reflect the views of the European Union. National Institute for Economic Research For additional information please contact us: National Institute for Economic Research 2064, RM, Chisinau, Str. Ion Creanga, 45 Tel: ( ) , Fax: ( ) iefs@iefs.md, web site:
3 CONTENTS The main political, economic and social events from the Republic of Moldova... 7 Edition summary Chapter I. PRODUCTION Chapter II. PRICES AND EXCHANGE RATES Chapter III. FINANCE Chapter IV. EXTERNAL SECTOR Chapter V. BUSINESS ENVIRONMENT Chapter VI. SOCIAL SECTOR Chapter VII. UPDATED ESTIMATES FOR DEVELOPING A TIME SERIES MODEL FOR ASSESSING AND FORECASTING THE EVOLUTION OF QUARTERLY REAL GDP IN MOLDOVA... Apostolos Papaphilippou 87 STATISTICAL ANNEX
4 GENERAL DATA Official name Capital President President of the Parliament Prime Minister Parliament of the Republic of Moldova REPUBLIC OF MOLDOVA Chisinau Nicolae Timofti Igor Corman Iurie Leanca 101 deputies (the Communist Party of the Republic of Moldova 33, the Liberal Democrat Party of Moldova 31, the Democrat Party of Moldova 16, Liberal Party 12, unaffiliated deputies 9) Independence was obtained on August 27, 1991 Area 33.8 thousand km 2 Administrative units Resident population Main religions National currency 32 districts, 5 municipalities (Chisinau, Balti, Bender, Comrat, Tiraspol), UTA Gagauzia, Administrative-territorial units from the left of the Dniester 3,559.5 thousand Orthodox (93.34%), Protestant (1.98%), Old-rite Christian (0.15%), Catholic (0.14%), etc. Moldovan Leu (1 USD = MDL, 1 EUR = MDL) 4
5 ABBREVIATIONS ATP ATU AVE BMA CEFTA CIS CPI CR DCFTA EBRD EC EPC EU FDI GAP GATS GDP GSP GVA HACCP HHI IDA IIPP IMF IOM IPA MAFI MDL MET MF MFN MFO NBC Autonomous Trade Preferences Autonomous Territorial Unit Ad-Valorem Equivalent Bureau for Migration and Asylum Central European Free Trade Agreement Commonwealth of Independent States Consumer Price Index Concentration Ratio Deep and Comprehensive Free Trade Agreement European Bank for Reconstruction of Development European Commission Effective Protection Coefficient European Union Foreign Direct Investment Good Agricultural Practice General Agreement on Trade in Services Gross Domestic Product Generalised System of Preferences Gross Value Added Hazard Analysis and Critical Control Points Herfindahl-Hirschman Index International Development Association Index of Industrial Products Prices International Monetary Fund International Organization for Migration Intellectual Property Rights Ministry of Agriculture and Food Industry Moldovan Leu Moldovan Economic Trends The Ministry of Finance Most Favoured Nation Microfinance Organization National Bank Certificates 5
6 NBM NBS NCFM NEER NIER NPB NPC ODSME PCA PPI RCA REER SDR SITC SME SPS TBT TN TRC TRQ UN USD VAT WTO YoY National Bank of Moldova National Bureau of Statistics National Commission of Financial Market Nominal Effective Exchange Rate National Institute for Economic Research National Public Budget Nominal Protection Coefficient Organization for Development of Small and Medium Enterprises Partnership and Cooperation Agreement Production Price Index Revealed Comparative Advantage Real Effective Exchange Rate Special Drawing Rights Standard International Trade Classification Small and Medium Enterprises Sanitary and phytosanitary measures Technical Barriers to Trade Transnistria Total Regulatory Capital Tariff Rate Quota United Nations US Dollar Value Added Tax World Trade Organization Year on Year 6
7 MAIN POLITICAL, ECONOMIC AND SOCIAL EVENTS FROM THE REPUBLIC OF MOLDOVA The first semester of 2013 was characterized by a series of political, economic and social events. April 2nd The budget of the city of Chisinau for 2013 was approved in the second reading, with the vote of 26 councilmen. The Communists and the Socialists voted against. It is estimated that the budget of 2013 will be 2,790,291,300 MDL At the same time, there will be expenses of 2,858,911,800 MDL. The budget deficit will be 68,620,500 MDL. Approximately 52% of expenses will be redirected to the social field, and the most important functional group will be the field of education, to which the amount of over 1 billion MDL is allocated. The budget for 2013 is 14% higher than in 2012 and 53% higher than in April 9th - 10th Between April 9th and 10th the President of the Academy of Sciences of Moldova, academician Gheorghe Duca, participated in the Conference of Danube Academies: European Science and Strategy for the Danube Region, held at Bucharest by the Romanian Academy and the European Science and Art Academy. The event reunited the consortium of Science Academies which provides scientific support for the implementation of the European Strategy for the Danube Region, representatives of the Common Research Center of the European Union and representatives of the Romanian Government. By a common decision, the members of the consortium decided that the following reunion will take place at Chisinau, in order to discuss the progress made in implementing the Danube Strategy, and the encountered impediments. April 10th The President of the Republic of Moldova, Nicolae Timofti, appointed the candidate for the position of Prime Minister, Vlad Filat, the current Prime Minister and the leader of the Liberal Democrat Party. April 12th A PL reforming council is created, which included some of the current members of the party. April 23rd In the first quarter of 2013, the national public budget accumulated total revenues of 7.52 billion MDL. The expenses of the budget were 7.6 billion MDL. Thus, in the first quarter Moldova accumulated a deficit of 76.7 million MDL. In the first quarter of 2013, the revenues accumulated at the state budget were 4.47 billion MDL, 17.5% more than planned. The state budget expenses were 4.64 billion MDL, 5.9% more than in the first quarter of 2012 or 23.4% less than planned. The accumulated budgets of the administrativeterritorial units were 1.87 billion MDL. The expenses for these budgets were 1.81 billion MDL. 7
8 April 23rd 66 businesses created by migrant Moldovans will benefit from non-reimbursable funding within "PARE 1+1" Program. The decision was approved, yesterday, within the meeting of the supervision committee of the program. Approximately 46 million MDL will be invested in the projects selected for funding. Out of this amount, approximately 12 million MDL will be the grant provided by the "PARE 1+1" Program. Approximately 40% of the Moldovans who expressed their will to open a business in Moldova with the money earned abroad worked in Italy. They are followed by the Moldovan who emigrated to Russia 15%, USA, Portugal and Spain 7%, and Ireland 4%. April 23rd Iurie Leanca was appointed as the interim Prime Minister of the Republic of Moldova. April 25th The National Bank reassessed the risks corresponding to inflation and determined that in the following periods the risks which can compromise the achievement of a 5% inflation will prevail. As such, the leadership of the central bank of the Republic of Moldova took certain monetary policy decisions designed to stimulate the crediting activity and the economic activity, but also to ensure the achievement of the targeted inflation. Thus, the Board of Directors of NMB decided at the meeting to decrease the monetary policy interest rate by 1%, to 3.5%. There was also a 1% decrease in the basic rate for long-term credits (longer than 5 years), from 5% to 4% a year. April 25th The France-Moldova Chamber of Commerce and Trade launched a high-level professional training program Tri Executive MBA (TEMBA). This program is implemented by the Toulouse Business School TBS. More than 50,000 students of over 80 nationalities participate in the training programs proposed by TBS from post high school to Bachelor's Degree and PhD. TEMBA has 3 international accreditations, an American one AACSB, an European one EQUIS, and one that is specific to MBA and DBA programs AMBA. Less than 1% of the Business Schools worldwide have these 3 certifications. The Tri Executive MBA Program of the Toulouse Business School implemented in Chisinau in collaboration with the France-Moldova Chamber of Commerce and Trade provides the possibility of obtaining an internationally-acknowledged French diploma. April 26th The International Monetary Fund (IMF) will no longer grant the Republic of Moldova the last tranche of 76 million dollars from the credit that was agreed with the Government. The permanent representative of IMF mentioned the fact that it is not possible to have an agreement until the expiry of the program in the absence of a Government. May 27th The board of directors of Commercial Bank "Moldova-Agroindbank" issued a press release informing that starting with February this year, the bank, its management bodies and the shareholders of the bank became the target of new fraudulent activities by a group of persons who acted in an organized manner. Being aware of the gravity of the 8
9 situation, in order to reduce the negative consequences for the bank, its shareholders and the entire banking system, even the economic system of the country, the board of B.C. «Moldova-Agroindbank» S.A. draws attention to the authorities of the state and the entire public opinion about the danger created for the bank, its creditors and its depositors. May 29th The assets administered by State Enterprise "International Airport of Chisinau" and its land were leased. A decision for this purpose was taken at the meeting of the current cabinet of ministers. A project of the Government indicates that the activity of the Official Delegation Hall will take place according to the provisions of the legislation and will be coordinated by the State Chancellor's Office. The goal of the lease, according to the project, is to ensure the development of the airport infrastructure and the quality of the services provided by the international airport of Chisinau. The project intends to raise the level of regional competitiveness of the airport by increasing the durable economic and general efficiency of the aeronautical and non-aeronautical revenues, by complying with the maximum security and safety standards. The assets of State Enterprise "AIC" and its land will be leased for 49 years. The volume of the investments of the leasing company will be at least 230 million. June 19th - 26th A mission of the International Monetary Fund was at Chisinau between June 19th and June 26th. Within its visit, the mission assessed the existing situation in various economic sectors and issued some recommendations for promoting reforms. The representatives of IMF talked with the authorities of the Republic of Moldova in order to assess the macroeconomic situation of the country, the revision of the Program supported based on the Extended Crediting Mechanism / the Extended Funding Mechanism and the issuance of proposals for a new aid program. June 25th The European Investment Bank will support the rehabilitation of the roads from the Republic of Moldova. An agreement which provides granting of a loan of 150 million by the European Investment Bank was signed at Luxembourg by Prime Minister Iurie Leanca and the vice president of the European Investment Bank, Wilhelm Molterer. According to the agreement, financial means will be directed in order to perform works for the construction of roads on the trans-european corridors which pass through the Republic of Moldova the southwestern section of the Chisinau beltway, the completion of the connection from Porumbeni to Cimislia and a detour road at Comrat. Thus, approximately 180 km of national roads will be rehabilitated The works will start in June 27th Japan offers to Moldova over 60 million USD in order to improve medical assistance services. The credit offered by Japan to the Government of the Republic of Moldova will be used for procuring high-performance imagery diagnosis equipment, technology for 15 operating rooms and intensive care units, as well as analytical equipment. The Ministry of Health intends to modernize five medical institutions, among which the Republican Clinical Hospital, the Oncology Institute, the Mother and Child Institute and 9
10 11 public health centers. The project "Improvement of Medical Assistance Services" is based on a credit with an interest rate of 0.1% a year for 20 years, and the grace period is 10 years. June 28th 210 km of highway will be rehabilitated due to an agreement signed with the European Reconstruction and Development Bank. The funding agreement provides the granting of 150 million for the rehabilitation of the main roads of Moldova, and it was signed by Prime Minister Iurie Leanca and the transportation manager of ERDB, Sue Barett. The 150 million loan will be used to rehabilitate several roads of national importance, namely the section of road R33 Hincesti-Lapusna-M1, section R14 Balti-Sarateni, section R9 Soroca-Arionesti and section Hincesti-Leova-Cantemir. In total, 210 km of main roads will be rehabilitated, including the reconstruction of 17 km of the M3 Slobozia Mare Beltway on Chisinau-Giurgiulesti route, which will connect the capital to the river port. 10
11 EDITION SUMMARY Production The evolutions from the first half of the year indicate the fact that the economy has exceeded the crisis conditions from the previous year and shows an increasing trend again. In the first two quarters the economy continued to increase, by 3.5% and 6.1%, respectively. Thus, in the first half of the year GDP increased by 4.9% compared to the similar period of last year, and was million lei. The increase of GDP in this period was largely supported by the positive evolutions from the sector of services, and also from that of industry. Considering that the agricultural year was good, the forecasts regarding the evolutions of GDP in the second half of the year became more optimistic. The increase of production from the first half of the year was supported by a slight recovery of the final consumption of households, the investment activity of entrepreneurs, including foreign ones, and also by external demand. Regarding the increase of exports, the vulnerability of this factor remains relatively high, which generates uncertainty regarding the capacity of supporting economic growth on the level of expectations. Prices and exchange rates In the first half year of 2013, the consumer price index increased by 5.5% compared to the similar period of last year. Despite the favorable climate conditions, the ascending dynamics of the inflation rate was caused by the increase of the prices of food products and the gradual depreciation of the national currency. Between June 2012 and June 2013, the evolution of the basis inflation was between 4.3% and 4.4%, and from August 2012 to August 2013, the values of the basic inflation increased from 3.9% to 4.3%. Starting with the second quarter of 2013, the growth rates of CPI exceed the basic inflation. At the same time, the stabilization of basic inflation must be associated, most probably, to the attenuation of internal demand. Other price indexes also increased: In the first 8 months of 2013, the index of industrial production prices increased by 1.9%, compared to the similar period of last year; In the second quarter of 2013, construction prices increased by 8%, compared to the similar period of the previous year; In the first 6 months of 2013, the prices of agricultural products increased by 6.8% compared to the similar period of last year. In the first six months of 2013 there was an average exchange rate MDL/EUR of 16.4, which represents a depreciation of the national currency by 8.4%, compared to the similar period of In the same period of 2013, the average exchange rate MDL/USD was 12.45, as the position of USD increased by 3% compared to the similar period of At the same time, the real exchange rate of the national currency continually increased, due to the faster evolution of prices in the Republic of Moldova compared to the dynamics of the inflation from USA and the Euro area. Since the end of 2008, there has been a trend of stabilization of the real exchange rate. Public finances In the first half year of 2013 NPB accumulated total revenues of million MDL, million MDL or 9.1% more than in the similar period of We would like to mention that 11
12 compared to the planned value of revenues, in the first half year of 2012 the achievement level was 96.5% or million MDL less. By examining the structure of NPB revenues in the first half year of 2013, we find that the dominant part continues to be formed of fiscal revenues (89.2%), and the respective revenue value is higher by million MDL or 15.9% compared to the similar period of last year. In fiscal revenues, the most important weight is represented by revenues from VAT (37.1%, in the 1st half year of %), social contributions 24.4%, income taxes 13.8%, excises 10.2%, and compulsory medical assistance premiums 6.5%. In the first half year of 2013, the budget incurred total expenses of million MDL, million MDL or 5.6% more than in the similar period of The predominant part continues to be social expenses (71.3%), and their weight increased by 1.6% compared to the similar period of last year. As of June 30, 2013, the balance of the public debt was 21,741.0 million MDL, an increase of million MDL compared to the beginning of the year. In the examined period, compared to the similar period of last year, there was an increase of the state debt balance for all instruments, except for converted VMS and VMS for ensuring financial stability. As an evolution, we notice the ascending trend of the external public debt to multilateral creditors. At the same time, the external public debt to bilateral and commercial creditors continued to drop. In the first half year of 2013, the revenues of the budget of Transnistria were million MDL, namely 6.1% of the total revenues obtained in the controlled territory of the Republic of Moldova, namely 1.1% higher than the revenues recorded in the similar period of Compared to the planned value, the accumulations were 24.9% higher. The expenses of the budget of Transnistria represented million MDL or 7.6% of the total expenses incurred on the controlled territory of the Republic of Moldova, which constitutes 79.4% variation from the established plan of expenses. Compared to the similar period of last year, expenses were 87.3%. Banking sector In the period , the situation of the banking system from the Republic of Moldova, despite the worsening of the situation of S.A. Banca de Economii and the economic decline of 2012, continues to be stable, with sufficient liquidities and good capitalization, which allows the banks to resist unpredictable shocks and disturbances. The first half of 2013 proved to be eventful, especially regarding the situation of one of the most important banks from the Republic of Moldova, "Moldova Agroindbank" (MAIB), where important packages of shares of this financial institution were taken over. The shares of MAIB were transferred to 7 companies registered in Great Britain, Cyprus and Latvia, and each company has an interest under 5%, which does not require it to obtain a prior permission from NBM. Despite the worsening of the financial situation of S.A. Banca de Economii, we notice a decreasing trend for the main indexes (assets, deposits and credits). While on June 30, 2012, by the balance of banking credits, the financial institution had a market share of 8.1%, on June 30, 2013 its market share was 4.6%. Consequently, the financial institution had granted less credits (credit balance million MDL), 1065 million MDL or 61.2% less than on June 30, In order for the situation of financial institution S.A. Banca de Economii to be improved, the following solutions are required: 12
13 - recapitalization of the bank; - ensuring the efficient management by the new owners. The balance of credits in the economy was million MDL on June 30, 2013, million MDL or 6.4% higher than January 31, The increasing trends were caused by the increase of the balance of loans granted in national currency by 7.5% and by 6.09% of the balance of loans granted in foreign currency, respectively. At the end of July 2013, the balance of credits in the economy was million MDL, a 15.6% increase compared to the end of July The balance of deposits in the banking system was million MDL, a 6% increase in the 1st half year of 2013, compared to the end of 2012, as a result of the increase of the balance of deposits in MDL by 4.8%, a weight of 61%, and the increase of deposits in foreign currencies by 0.24%, a weight of 39% in the total deposits. Consequently, in July 2013 the balance of deposits in the banking system was million MDL, a 6% increase compared to December Monetary policy In the first half of 2013, NBM promoted its monetary policy by adjusting its actions depending on the economic situation. The attenuation of the growth rates of prices and the decrease of the annual inflation rate conditioned the relaxing the monetary policy. During the first half year of 2013, the monetary indicators recorded an ascending evolution. In the analyzed period, the monetary mass recorded an increase of 19.1% compared to June 30, The monetary policy rates were constant in the first quarter of 2013, while in the second quarter their level decreased. Thus, in the 2nd quarter of 2013, NBM reduced by 1.0% the basic rate, whose level starting with April 29, 2013 was 3.5%. There was also a 1% decrease in the basic rate for long-term credits (longer than 5 years), from 5% to 4% a year. In the 2nd quarter, NBM intensified its intervention on the currency market. In order to depreciate the MDL in relation to the reference currencies (thus decreasing the prices of exported products and stimulating the competitiveness of internal commodities) NBM resorted to currency procurements. External sector The external factors which in the previous year influenced the decrease of the national economy, this year seemed to be favorable for the recovery of economic growth. At the same time, their evolution in the second half of the year reflects a relatively high degree of uncertainty, determined by several factors, but especially the difficult recovery of the EU economy and the attenuation of economic growth in the Russian Federation. Moreover, these evolutions occurred in the context where the global economic system shows fragility signs. The current account of the payment balance showed an increase of 16% of the deficit compared to the similar period of last year, much lower than the 1st half year of Thus, at the end of June the current account balance was million USD, 41.6 million USD more than in the first half year of 2012 and 82.3 million USD less compared to the same period of The moderate advance of the current account deficit occurred under the influence of several factors: - the attenuated increase of imports under the influence of the decrease of the unit value of imports, of the volumes of commodities purchased for processing in the country, and also the external demand for several products re-exported in pure form; - the recovery of exports at the same time, their increase in the first 7 months was relatively volatile, an evolution which was predominantly determined by the slow invigoration of the external demand of EU countries and the decrease of the demand of the Russian Federation. 13
14 Although the good agricultural year and the progress in identifying new sale markets create premises for a good dynamics of exports this year, its prospects are attenuated by its structure, characterized by a high weight of products with low added value (unprocessed agricultural products, products made entirely from raw materials of contractors, re-exports) and the tensioning of economic relations with the Russian Federation; - increase of remittances from abroad, which in the first half of the year were million USD. At the same time, their increase is continuously attenuated compared to last year, because of the decrease of remittances from the Russian Federation, where 60% of transfers originated, and the slow recovery of those from other countries. On the background of the aforementioned evolutions, a significant advancement was recorded by net inflows of ISD, which marked an increase of 45.8% compared to the same period of last year, amounting to million USD. Although the high increase is generated including by the very low comparison basis of last year, the structure of investments by forms of capital shows a recovery of the national economy and a slow recovery of the trust of investors in the internal business environment. The national economy needs new impulses for recovery and consolidation, in order to mitigate at least partially the effects generated by the difficult economic situation from the main partner economies. One of these impulses is the acceleration of structural reforms and their subordination to reaching the desiderate of increasing national competitiveness. Business environment In the first half of 2013, the number of companies registered by the State Chamber of Registration increased compared to the similar period of last year, and the index was 101.5%. Thus, according to the State Chamber of Registration, 3306 new companies were registered in the State Register between January and June In the 1st half year of 2013, the number of enterprises that were deregistered was 1368 units or 15.1% less than in the same period of last year. According to the data of NBS, in there was an insignificant but constant increase of the number of companies: from 48.5 to 50.7 thousand companies, and the index was 104.4%. The average number of employees, according to the data of NBS, in , recorded, unlike previous years, an increasing trend (the index was 101.9%). According to the data of the National Bureau of Statistics, in January-June 2013 there was only a 2.4% increase (in comparable prices) of the revenues from sales for the companies operating mainly in retail trade, compared to the same period of According to NBS, in the first half year of 2013 there was a 4.8% increase (in current prices) of the turnover of the companies operating mainly in wholesale, compared to the same period of In January-June 2013, there was a 9.8% increase of the turnover of the companies mainly operating in market services provided to the population (in comparable prices) compared to the similar period of last year. In this period, only companies from the Northern region recorded increases of the turnover compared to the 1st half year of The value index of the turnover of the companies mainly operating in market services provided especially to companies increased by 4.5% (in current prices) in January-June 2013 compared to the 1st half year of
15 Social sector Demographic situation. In January-June 2013, the number of live births in the country was 17,783 pers., a 6.4% decrease compared to the same period of last year. The birth rate was 10.1 born alive for every 1,000 people. The number of deceased represented 19,936 persons. The general death rate decreased by 4.4% compared to last year. The death rate was 11.3 deceased for every 1,000 people. The natural decrease rate was 2,153 persons, or 1.2 persons for every 1,000 people, compared to 1.1 in the first half year of The number of infants deceased in this period decreased by 7 persons, as the infant mortality rate was 10.1 deceased under 1 year for every 1,000 live births. The total number of marriages in the republic was 9,014. The marriage rate was 5.1 marriages for every 1,000 people. The number of divorces was 5,506. The divorce rate was 3.1 divorces for every 1,000 people. Migration of population. In January-June 2013, 1,171 foreign citizens and 153 repatriates received residence permits (permanent and temporary). The structure of immigrants by the goal of arrival was dominated by family 42.9%, work 38.3%, education 5.7%, other causes 13.1%. Labor market. In the 2nd quarter of 2013 the economically active population of the Republic of Moldova was 1,288.4 thousand persons, 1.0% (21.5 thousand) more than in the second quarter of The activity rate of the population over the age of 15 was 43.1%, an increase compared to level reported in the 2nd quarter of 2012 (42.5%). Employed population was 1,227.6 thousand persons, 1.5% more than the 2nd quarter of The employment rate of the population over the age of 15 was 41.1%, an increase of 0.6% compared to the second quarter of In the distribution by the activities in the national economy we find that in the agricultural sector thousand persons are active (32.5% out of the total number of active persons). In nonagricultural activities the number of active persons was thousand, 2.3 thousand or 0.3% lower compared to the 2nd quarter of In the informal sector there are 14.2% of the total active persons in the economy, and 32.7% had informal jobs. Out of the number of informally employed persons, employees are 20.7%, and 10.4% of total employees have informal jobs. The number of unemployed persons, estimated according to the International Labor Office was 60.8 thousand, 3.2 thousand more than the 2nd quarter of The unemployment rate on country level recorded the value of 4.7%, more than in the 2nd quarter of 2012 (4.5%). The household disposable income during Q2 of 2013 represented a monthly average per person of MDL 1,667.2, higher by 9.8% compared to Q1 of In real terms (adjusted to the consumer price index), the income of the population increased by 4.4%. The average monthly consumption expenditures of the population in the 2nd quarter of 2013 for a person were in average 1,761.8 MDL, 11.3% higher than in the 2nd quarter of In real terms (by adjustment to the consumer price index), the population spent in average 5.8% more than in the 1st quarter of Remuneration of labor. In June 2013, the average gross nominal wage was 3,859.0 MDL, 1.4% less than in June 2012, and 2.7% more than in the previous month (May 2013). The index of the real salary earnings for June 2013 compared to June 2012 was 93.5% (calculated as the ratio between the index of the gross nominal salary earnings and the index of consumer prices). In the public sector the average salary in June this year was 3,696.4 MDL (-18.9% compared to June 2012). In the (real) economic sector the salary in June was 3,924.6 MDL (+8.5% compared to June 2012). Subsistence minimum. The increase of the subsistence minimum in the first half year of 2013 was in average 1,608.3 MDL a month for one person. Depending on area and residence, there are significant differences, and the highest value of the subsistence minimum is for the population of large cities (Chişinău and Bălţi) 1,692.8 MDL or 2.9% more compared to other cities 1,
16 MDL and 8.3% more compared to the rural areas 1,563.2 MDL. By categories of population, the maximum value of the subsistence minimum is that of the active population 1,700.3 MDL, especially men 1,838.5 MDL, compared to 1,553.0 MDL in case of women. The minimum subsistence level of children, in average, was MDL 1,533.9 per month, with a differentiation depending on children's age: from MDL for a child up to 1 year old to MDL 1,724.2 for a child aged Depending on their residence area, the subsistence minimum for children from large cities is 8.1% higher compared to the rural areas, and for children up to one year old this difference is 16.5%. Social protection of the population. The number of pensioners registered by the social protection institutions as of July 01, 2013 was thousand persons, or 10.5 thousand persons more compared to July 01, The average value of the monthly (indexed) pension was MDL , 6.6% higher than on July 01, Healthcare. The morbidity of the population by certain infectious diseases in January-June 2013 is characterized by the increase of the number of diseases by acute respiratory infections with multiple localizations thousand cases compared to thousand cases in January-June At the same time, there were more cases of influenza, bacterial dysentery, but less cases of acute intestinal infections, chickenpox, epidemic parotiditis, etc. In case of morbidity by "socially determined" diseases, there was a decrease, especially of gonococcus infections and pediculosis. In January-June 2013, the number of the carriers of HIV was 54, and there were 6 registered cases of AIDS. Crimes. In January-June 2013, there were 18.1 thousand crimes, 7.4% more than in the same period of last year. In average, for 10 thousand people there are 51 crimes in this period. The highest level of crime was in Chişinău and Bălţi, and the lowest level was in the district of Râşcani. There were 1,068 road accidents, or approximately 6 accidents every day. Following these accidents, 105 people died (including 7 children), and 1,268 persons suffered traumas (including 221 children). In average, for 100 thousand people there are 30 road accidents. 16
17 Chapter I PRODUCTION The gross domestic product the main macroeconomic indicator, which represents the final result of the production activity of the country, in January-June 2013 amounted, as a nominal value, million MDL, current market prices, an increase in real terms (average prices of 2012) by 4.9% compared to January-June In the second quarter of 2013, the GDP was million MDL, exceeding the results of the respective period of last year by 6.1% HI 2009 HI 2010 HI 2011 HI 2012 HI 2013 Percent change from preceding period Q. I 2008=100 Figure 1.1. Evolution of GDP in the first half years of , % Source: Drafted based on the data of National Bureau of Statistics. Gross domestic product by categories of resources The gross value added generated by the services sector increased, in January-June 2013, by 6.1%, compared to the similar period of last year, with a positive impact (+1.3%) on the evolution of the gross domestic product. The gross value added generated in agriculture, hunting, forestry, fishing, fish farming and industry exceeded the results of the similar period of the previous year by 3.4% and 7.4%, respectively. The contribution of the sector of goods to the formation of the GDP was 21.3%, in the reference period. The gross value added generated by the services sector increased by 3.5%, compared to the 1st half year of the previous year, and contributed to the increase of the GDP by 2.3%. The wholesale and retail trade were the activities with the highest increase of the gross added value (+5.9%), followed by transportation and communications (+3.7%), constructions (+3.7%) and other service activities (+2.5%). Out of "other services", there were considerable increases for other collective, social, personal services and services provided to private households by employees (+11.5%), real estate transactions, leasing and services provided to companies (+6.2%), hotels and restaurants (+5.5%). Light increases of the gross added value were recorded in financial activities (+0.7%), health and welfare (+0.6%) and public administration (+0.4%). There was a decrease of the gross added value in education (-2.8%) (see annex no. 2). The contribution of the sector of services to the formation of the GDP was 63.1%, in the reference period. The volume of taxes on products collected at the National Public Budget increased by 5.9% compared to the similar period of last year, with a positive impact (+1.0%) on the evolution of the gross domestic product. In the reference period the volume of taxes on products contributed to the formation of GDP by 17.8%. 17
18 Although the final consumption of population households and the public and private administration continues to exceed the volume of GDP, in the first half years of the last 3 years there was a positive trend of its decrease in relation to GDP (from 124% in 2011 to 122.6% in 2012 and to 117.2% in 2013) and an increase of the gross formation of capital, namely 18.9%, 21.1% and 23.8%, respectively HI 2009 HI 2010 HI 2011 HI 2012 HI 2013 Internal demand Household and public administration final consumption expenditures Gross capital formation Figure 1.2. Evolution of internal demand and its components in relation to GDP in the first half year of Source: Drafted based on the data of National Bureau of Statistics. Investments in long-term material assets In the national economy, in January-June of this year, from the account of all the funding sources, there were capitalizations of investments in value of 5395 million MDL (in current prices), out of which building and assembly works were 2425 million MDL, or 101.5% and 103.8% (in comparable prices) in relation to the adequate period of last year million MDL was invested in machinery, equipment and means of transportation, 3.25% more. There was an increase in the weight of building-assembly works by 2.5%, while the share of investments in machinery, equipment and means of transportation dropped by 1%. Concomitantly, the quarterly dynamics of investments shows a situation which is not as encouraging. Thus, while in the first quarter there was a 4.5% increase, then in the 2nd quarter there was a decrease (-0.1%). The analysis of the investment structure by forms of ownership showed that the intensification of the investment activity occurred mainly in the private sector of the national economy. In this sector 2522 million MDL were capitalized, or 46.8% of the total, an increase of 1.7% compared to the respective period of last year (in comparable prices). The public sector had 32% of the total investments from the country, or 1727 million MDL, a 6.7% increase compared to the level recorded in January-June
19 Joint-venture companies and those under foreign ownership amounted to 19.3% of the overall investments used in the country, or by 2.4% less than the results of the similar period of In the reference period, there were capitalizations of 3491 million MDL from the equity of companies and the population, practically constituting 2/3 of the total investments, but their volume was 4.2% under the level recorded in January-June From the account of budget sources over 400 million MDL was used, an increase of 47.3% compared to the similar period of 2012, and from the account of the means of foreign investors over 500 million MDL, or 61.4% more than in the same period of last year HI 2009 HI 2010 HI 2011 HI 2012 HI 2013 Public Private Figure 1.3. Evolution of investment increase indexes, % Source: Drafted based on the data of National Bureau of Statistics. The weight of the investments used in erecting buildings and structures was 30.2% of the total investments. The share of investments in building housing units increased by 1.1% compared to January-June 2012, and in erecting other buildings and structures dropped by 0.3%. Production of goods and services Industry In the first half year of 2013 industrial companies had a production of 18.3 billion MDL (in current prices), which was 106.4% (in comparable prices) compared to the similar period of The situation from the industrial sector was determined by the activities from the processing industry, which had 82.8% of the total value of the sector and which ensured an increase of 8.1% compared to January-June The food and beverage industry recorded an increase of the production volume by 2.9%, thus influencing the increase of the total industry index by 0.8%. The production volume especially increased in the following activities: manufacture for dairy products by 27% (causing the overall industry increase by 0.9%); manufacture of distilled alcoholic beverages by 22.7% (+0.3%); wine making by 10.8% (+0.3%); processing and preservation of fruits and vegetables by 9.2% (+0.3%); manufacturing, processing and preserving meat and meat products, making bread and patisserie products by 6.7% (+0.2%). In the reference period there were increases in other activities of the processing industry, such as: manufacturing other products from non-metallic minerals by 48.6%; chemical industry 19
20 by 44.8%; manufacturing electrical machinery and equipment by 44.3%; metallurgic industry by 30.1%; manufacturing furniture by 4.1% HI 2007 HI 2008 H I 2009 HI 2010 HI 2011 HI 2012 HI2013 Percent change from preceiding period Q.I 2008=100 Figure 1.4. Evolution of the industrial production volume index in the first half year of , % Source: Drafted based on the data of National Bureau of Statistics. The highest increases were recorded in manufacturing brandies and liqueurs (+81.4%), glass and glass flasks (+59.7%), processed and preserved fruits (+54.4%), champagne (+43%), flour (+36.4%), poultry (+20.9%), etc. At the same time, in the analyzed period there were decreases of the production volume compared to January-June 2012 in activities: manufacture of medical, precision and optical devices and instruments - by 39.5% (causing the overall industry decrease by 1.3%); publishing houses, polygraphy and reproduction of informational materials by 19.6% (-0.4%); manufacture of tobacco products by 14.7% (-0.2%); manufacture of leather, leather products and footwear by 10.3% (-0.3%); manufacture of clothing, manufacture and painting of furs by 7.6% (-0.6%), etc. The revenues from the sales of industrial production were 19.9 billion MDL (in the first half year of billion MDL). Out of the total volume of the delivered production, 35.5% was on the external market (in the 1st half year of %). Agriculture The global agricultural production in households of all categories, in January-June 2013, was 3.7 billion MDL, or 2.8% more (in comparable prices) compared to the respective period of The increase of global agricultural production was determined by the increase of vegetable production by 29%, and the animal production decreased by 1.9%. Animal production was 81% of the total volume of agricultural production, and vegetable production was 19%. Table 1.1. Evolution of the agricultural production indexes, % I- III 2012 I-VI 2012 I-IX 2012 I-XII 2012 I-III 2013 I-VI 2013 Total agricultural production Vegetable production Animal production Source: Based on the data of the National Statistics Bureau. 20
21 The start of agricultural harvesting this year in agricultural companies is characterized by a considerable increase of the production of fruits with stones 2.5 times, autumn rape 2.1 times, grains and legumes 64% (out of which wheat by 74% and barley by 69%). At the same time, there was a 40% decrease of the average harvest of legumes for beans and a 27% increase of field vegetables. In the first half year of 2013 compared to the same period of the previous year households of all categories reported production (breeding) increases for cattle and poultry by 2.8%, which was influenced by the increase of meat production in agricultural enterprises by 29.8%. In population households the production (breeding) volume for cattle and poultry decreased by 9.8% as a result of the decrease of the average number of animals and poultry (cows 4%, pigs 18%, poultry 8%, sheep and goats 1%). The production of eggs of households of all categories increased by 8.3%: in agricultural enterprises by 17.8%, and in population households by 1.4%. The egg production decreased by 14.1%, including in agricultural enterprises by 14.5% (as a result of the decrease of cow productivity by 19%), in population households 14.1% (as a result of the decrease of the average number of cows by 5% and their productivity by 10%). Trade and services Retail. In June 2013, the volume of the turnover of companies mainly operating in retail increased by 3.8% (in comparable prices) compared to the previous month and by 6.5% compared to June 2012, and in the first half year, the volume of the turnover increased by 1.3% compared to the similar period of last year. Market services provided to the population. In June 2013, the turnover volume of the companies mainly operating in market services provided to the population increased by 32.5% in comparable prices, compared to the previous month, and by 19.4% compared to June In the 1st half year the turnover volume increased by 9.8% compared to the similar period of Wholesale. In June 2013, the value of the turnover of companies mainly operating in wholesale decreased by 1.2% (in current prices) compared to the previous month and by 7.6% compared to June 2012, and in the first half year, the value of the turnover decreased by 0.4% compared to the similar period of last year Jan.2013 Feb Mar Apr May 2013 Jun Perchent change from preceiding period Perchent change from the same period in the previous year Figure 1.5. Evolution of turnover volume indexes for services provided to companies, % Source: Based on the data of the data of the National Bureau of Statistics. Market services provided mainly to companies In June 2013, the value of the turnover of companies mainly operating in market services provided to companies increased by 8.7% (in current prices) compared to the previous month and by 3.9% compared to June 2012, and in the 21
22 first half year, the value of the turnover increased by 4.8% compared to the similar period of last year. Transportation Railway, river and air transportation companies carried commodities of 4977 thousand tons or 13.9% more than in the similar period of The increase of the volumes of carried commodities was recorded in railway (+19.1%), river (+15.6%) and automotive (+10.3%) transportation, and decreased by 26.7% for air transportation. In January-June 2013, automotive transportation companies carried 2809 thousand tons of commodities. Significant weights in the total volume of commodities carried by road transportation means are those of Chisinau (57.5%), Central (21.2%) and Northern (17.0%) regions thousand tons of commodities were carried by railway transportation means in January- June In railway transportation the average stationing duration in technical stations of freight cars in transit increased, from 43.5 hours in January-June 2012 to 49.9 hours in January- June 2013, and the average turnover duration of freight cars increased from 8.4 days to 9.3 days. The transportation of commodities also increased, totaling 1882 million tons-km, 8.9% higher compared to that recorded in January-June There were also increases in river (+16.8%), railway (+10.2%) and automotive (+8.4%) transportation companies, and in air transportation there was a decrease of 40.8%. In January-June 2013 compared to the similar period of 2012, there were increases in the number of passengers who used public transportation (+0.6%). Out of the total number of transported passengers, 57.2 million passengers (48.4%) were transported by buses and vans, and 56.7 million passengers (48%) by trolleybuses or by 0.4%, and 1.4% more than in the same period of Communications In January-June 2013, compared to the corresponding period of 2012, the number of mail shippings increased (+19.6%), as well as the volume of correspondence (+5.9.%), pensions, allowances and indemnifications paid by mail services (+6.6%). At the same time, there were decreases in the post and telegraph money transfers (-9.7%), telegrams (-7.8%), newspapers and magazines (-4.9%). On June 30, 2013, 1123 thousand main telephone stations operated in the public network, out of which 1020 thousand were home ones. The increase of the revenues reported was mainly generated by the increase of the number of users of the services on all five markets and the sale volumes on three markets (mobile telephony, dedicated mobile Internet, landline telephony and data transmissions). Tourism In January-June 2013, tourism agencies and tour operators provided tourism services to 80.9 thousand tourists and visitors, 1.6% more than in the similar period of There were more tourists outgoing and incoming (by 6.1% and 4.4%), and the number of internal tourists decreased by 10.6%. Out of the 5.4 foreign thousand tourists and visitors who visited the Republic of Moldova in January-June 2013 and benefited from the services of tourism agencies and tour operators, 47.6% visited the country for business and professional purposes, 44.3% for rest, recreation and entertainment, 3.5% for treatment. More significant weights in the total number of foreign 22
23 tourists visiting the Republic of Moldova were those of Romania (15.6%), Russian Federation (10.0%), Poland and Germany (6.6%), Ukraine (6.2%), Italy (5.0%), USA (4.8%), Austria (4.4%), France (4.0%) and other countries. By travel agencies and tour operators, 61.5 thousand tourists and visitors traveled abroad, 4.4% more than in the same period of Most Moldovan citizens traveled abroad for rest, recreation and entertainment (97.4%). The citizens of the Republic of Moldova preferred to travel mainly to Bulgaria (33.9%), Turkey (32.9%), Romania (11.7%), Greece (5.9%), Ukraine (3.7%), Egypt (2.2%), United Arab Emirates (1.2%) and Austria (1.0%). The number of tourists and visitors who visited the country was 14 thousand tourists, 10.6% less compared to the similar period of Moldovan residents traveling in the country, for tourism purposes, was organized especially by tourism agencies and tour operators from Chisinau (34.8%) and development regions: Center (32.3%) and South (25.0%). 23
24 Chapter II PRICES AND EXCHANGE RATES In the first half of 2013, the consumer price index increased by 5.5% compared to the similar period of last year. In the same period, CPI components recorded the following increases: food products 9.2%, non-food products 4.5%, services 2%. Respectively, in August 2013 the Consumer Price Index (CPI) decreased compared to 2013 by 0.2%, and compared to 2012 by 3.7% (in August 2012 compared to July 2012 CPI was 100.4% and compared to August %). The level of inflation in August 2013 slightly increased the price growth rate compared to the same period of last year was 5.5%, lower than April-June 2012, when this indicator was 4.1%. The main cause of the increase of inflation was the increase of agricultural and food product prices. Respectively, in August 2013 the consumer price growth rate was 3.7%, 0.6% less than in July 2013 (4.3%). After the decrease of prices in food products in February 2013, this spring they increased, and the highest level was reached in May %. This situation is explained by the methodological change by NBS of the procedure for reflecting the prices of the agricultural production from the new harvest. The annual increase of the prices for food products in August 2013 decreased to 4.2%, while the prices of non-food products and services increased by only 4.5% and 2.1% CPI Food Non-food Services Jan Feb Mar Apr May Jun Jul Aug Sep Oct Nov Dec Jan Feb Mar Apr May Jun Jul Aug Sep Oct Nov Dec Jan Feb Mar Apr May Jun Jul Aug Sep Oct Noiem Dec Jan Feb Mar Apr May 2013 Jun Jul Aug Figure 2.1. Annual growth rates of CPI and its components, % Source: According to the data of the National Bureau of Statistics. In August the prices of fresh cucumbers increased by 23.4%, and those of milk by 1.5%; there was also a significant increase in the price of sugar 7.8% compared to the same month of last year. In January-August 2013 the growth rates of non-food products oscillated around the value of 4%. Service prices increased in the first four months of 2013 by approximately 3%, and in August they increased by only 2.1%. 24
25 From August 2012 to August 2013, the values of basic inflation increased from 3.9 to 4.3%. On the other hand, CPI of August 2012 increased by faster growth rates than the basis inflation, but in August 2013 it was 3.7% less than the basic inflation. This excess was caused by the increase of the prices of agricultural and food products, which caused the increase of the growth rates of CPI, which are not considered in calculating the basic inflation The basic inflation CPI 0 Jan Feb Mar Apr May 2011 Jun Jul Aug Sep Oct Nov Dec Jan Feb Mar Apr May 2012 Jun Jul Aug Sep Oct Nov Dec Jan Feb Mar Apr May 2013 Jun jul Aug Figure 2.2. Annual growth rate for inflation and basic inflation, % Source: According to the data of the National Bureau of Statistics. In August 2013, the index of industrial production prices increased by 3.4%, compared to the similar period of last year. In industry branches there were the following increases: extraction industry 1.1%, processing industry 4.2%, and the energy sector 2.4%. From August 2012 to August 2013 there was an attenuation in the evolution of the industrial production price index compared to the same period of the previous year, and the growth rates of prices decreased from 4.8% to 3.4%. In the same period there were increasing trends in the processing industry, an increase of the price growth rates from 3.9 to 4.2%. In the energy sector there was a decrease of 12.3%. In the mining and quarrying industry the evolution of prices is much more volatile. 20 industry mining and quarrying manufacturing Electricity, gas and water Figure 2.3. Annual growth rate of the industrial production price and its components, % Source: According to the National Bureau of Statistics. In the first quarter of 2013, construction prices increased by 8%, compared to the similar period of the previous year. Starting with the 4th quarter of 2011, the evolution of growth rates of construction prices stabilized and varies in an interval comprised between 9.3 and 8%. In the first quarter of 2013, the highest price increases in constructions, compared to the similar period of last year, were reported in telecommunications 10.5%, agriculture 10.2%, trade 25
26 and public food services 9.2%, other constructions 9.1% and construction of social-cultural items 9.3% Q. I Q. II Q. III Q. IV Q. I Q. II Q. III Q. IV Q. I Q. II Q. III Q. IV Q. I Q. II Q. III Q. IV Q. I 2013 Q. II 2013 Figure 2.4. Evolution of construction prices, % (compared to the same period of last year) Source: According to the National Bureau of Statistics. In January-June 2013, the manufacturer prices increased by 6.8% compared to January-June In the same period, the sale prices of vegetable products increased by 17.3%, and those of animal-based products decreased by 2.9% Total agricultural vegetable products animal products Q. I 2010 Q. II 2010 Q. III 2010 Q. IV 2010 Q. I 2011 Q. II 2011 Q. III 2011 Q. IV 2011 Q. I 2012 Q. II 2012 Q. III 2012 Q. IV 2012 Q. I 2013 Figure 2.5. Evolution of agricultural product prices, % (compared to the same period of last year) Source: According to the National Bureau of Statistics. In January-June 2013, the highest price increases, compared to the same period of 2012, were recorded for the following products: potatoes 3.1 times, grapes 2.5 times, grain cultures and pulses by 23.4% (especially wheat (excluding grade seeds) by 29.8%, corn (excluding grade seeds) by 32.6%), sunflower (excluding grade seeds) by 15.4%, bovines (live) by 14.4%, milk by 7.6%. At the same time, the sale prices decreased for fruits and berries by 6.7%, edible eggs by 12.8%, poultry (live) by 5.3%, sheep and goats (live) by 3.6%. In January August 2013, the annual fuel prices oscillated around the value of 4-5%, and the highest level, of 5.8%, was recorded in May. The attenuation of the fuel price increase in the last three months, compared to the respective months of 2012, was largely caused by the reduction of the global oil price on the international market. 26
27 Jan Feb Mar Apr May 2011 Jun Jul Aug Sep Oct Nov Dec Jan Feb Mar Apr May 2012 Jun Jul Aug Sep Oct Nov Dec Jan Feb Mar Apr May 2013 Jun Jul Aug Figure 2.6. Evolution of the fuel price, % Source: According to the National Bureau of Statistics. In the first six months of 2013 there was an average exchange rate MDL/EUR of 16.4, which represents a depreciation of the national currency by 8.4%, compared to the similar period of In the second half of 2012 there was a reverse trend, as the European currency got stronger compared to MDL, from an exchange rate of 15.2 MDL/EUR in July to 16 MDL/EUR in December. In January-June 2013, the average exchange rate MDL/USD was 12.45, as the position of USD decreased by 3% compared to the similar period of In the 2nd quarter of 2013, compared to the similar period of last year, the position of USD increased by 3.9% compared to the national currency Jan Mar May 2009 Jul Sep MDL/USD RATE NoV Jan Mar MaY 2010 Jul Sep NoV Jan Mar May 2011 Jul Sep Nov MDL/Euro RATE Jan Mar May 2012 jul Sep Nov Jan Mar May 2013 Jul Figure 2.7. Evolution of the nominal exchange rate of MDL compared to USD and EUR Source: According to the data of the National Bank of Moldova. In August 2013 the nominal exchange rate of the national currency was of MDL for USD 1, which represents a MDL depreciation by 4.5% compared to August 2012, and with respect to the sole European currency an exchange rate of MDL for EUR 1 was registered a 1.0% increase. 27
28 The region of the Republic of Moldova to the left of the river Dniester. In the region left of the river Dniester, in the 1st quarter of 2013 the inflation rate was CPI 2% compared to December 2012, and in the 2nd quarter CPI was -3.4% compared to the end of In August 2013 the inflation was 1.4%. In August 2013 the average exchange rate in relation to USD was 11.1 rubles in the region left of Dniester river for one USD. Respectively, for the same period, the average exchange rate compared to EUR was 14.5 rubles for one EUR, a 0.1% decrease compared to January
29 Chapter III FINANCES 3.1. Public finances Revenues of the national public budget In the first half year of 2013 NPB accumulated total revenues of million MDL, million MDL or 9.1% more than in the similar period of We would like to mention that compared to the planned value of revenues, in the first half year of 2012 the achievement level was 96.5% or million MDL less. By analyzing the revenues for consecutive budgets, we would like to mention that for the state budget in all its components, the revenues were million MDL), namely million MDL, or 6.8% less compared to the results of the administration period. Compared to the similar period of 2012, the accumulated revenues increased by million MDL, or by 10.1%. The revenues of administrative-territorial units for all components was million MDL (100.3% compared to the planned value). Out of the total amount of the revenues of administrativeterritorial units, approximately 53.7% or million MDL are own revenues (without transfers). Compared to the 1st quarter of the previous year, the budgets of the administrativeterritorial units cashed in own revenues which were million MDL higher. The state budget allocated transfers from the budgeting leveling fund to the budgets of the administrativeterritorial units, in the 1st half year of 2013, with special destination, and other transfers of million MDL. The revenue part of the budget of state social insurance was million MDL, (including transfers from the state budget of million MDL), 18.0 million MDL less, namely 99.7% of the results of the administration period. Own revenues were of million MDL which, compared to 6 months of 2012, increased by million MDL, or by 7.9%. The mandatory healthcare premiums funds collected total revenues of million MDL, (including transfers from the state budget of million MDL), namely 50.8 million MDL, or 2.5% less compared to the results of the administration period. The own revenues of the mandatory medical insurance funds represented million MDL which, compared the first 6 months of 2012, increased by 83.9 million MDL, or by 9.3%. By examining the structure of NPB revenues in the first half year of 2013, we find that the dominant part continues to be formed of fiscal revenues (89.2%), and the respective revenue value is higher by million MDL or 15.9% compared to the similar period of last year. There were also increases of 6.4% of the value of revenues from special funds. At the same time, the non-fiscal collections in the first half year of 2013 decreased by 47.6 million MDL, or by 5.6%. We would like to mention that the revenues under "Revenues from special means of public institutions" and "Grants" sections reported a considerable decrease in the examined period compared to the similar period of the previous year, and the value of the given indicator was 62.7% ( million MDL) and, respectively, 53.5% ( million MDL) of the value obtained the first half year of In fiscal revenues, the most important weight is represented by revenues from VAT (37.1%), social contributions 24.4%, income taxes 13.8%, excises 10.2%, and compulsory medical assistance premiums 6.5%. Regarding non-fiscal collections, we would like to mention that in the first quarter of 2013, the weight in the total revenues was 4.8%, while in the similar period of 2012 this indicator was 5.5%. 29
30 5% 2% 1% 3% Fiscal incomes Non-fiscal incomes Incomes from the special resources of the public institutions Incomes from special funds Grants 89% Figure Structure of the revenues of the national budget at the end of the 2nd quarter of 2013 Source: According to the data of the Ministry of Finance Q Q Figure Structure of fiscal revenues at the end of the 2nd quarter of 2012 and 2013, million MDL Source: According to the data of the Ministry of Finance. The most important contribution to the formation of revenues from grants is represented by external grants. For the examined period of 2013, the total amount of budget revenues as grants was million MDL, out of which million MDL external grants and 16.8 million MDL internal grants. Expenditures of the national public budget In the first half year of 2013, the budget incurred total expenses of million MDL, million MDL or 5.6% more than in the similar period of The expenses of the state budget for all components were million MDL, million MDL less, or 84.6% of the results of the administration period, namely million MDL or 9.4% more than in the respective period of In January-June, the budgets of administrativeterritorial units incurred total expenses of million MDL, which is million MDL less, 30
31 or 75.2% of the results of the administration period, namely million MDL or 3.1% more compared to the similar period of The expense part of the budget of state social insurance was the total amount of million MDL, 33.1 million MDL less, or 99.4% of the results of the administration period, and million MDL or 7.2% more than in the respective period of The expenses of the mandatory healthcare premiums represented million MDL, million MDL less, or 89.1% of the results of the administration period, and 26.3 million MDL or 1.5% less compared to the similar period of By analyzing the structure of expenses from GDP in the first half year of 2013, we notice that the predominant part continues to be social expenses (71.3%), and their weight increased by 1.6% compared to the similar period of last year Q Q Justice and constitutional jurisdicition Maintaining public order and national security Social expenditures Science and innovation Economic expenditures Environmental protection and hydrometeorology Figure Volume of expenses from GDP at the end of the 1st quarter of 2012 and 2013, million MDL Source: According to the data of the Ministry of Finance. In the 1st half year of 2013, out of the total social expenses, the highest weight is represented by expenses on social insurance and assistance (50.5%), which shows an increase (+7.0%) based on the data for the similar period of Other components from this group also recorded increases of the weight in the total, such as: culture, arts and sports 10.0% and health protection 1.7%. At the same time, education expenses decreased by 7.4%. Another important component of public expenses is represented by economic expenses, whose weight in the examined period of 2013 was 11.6% a weight which increased by 26% compared to that of the similar period of the previous year, and compared to the 1st quarter it increased by 4%. In absolute values, the economic expenses incurred in the 1st half year of 2013 increased by million MDL compared to the similar period of The main component of economic expenses is represented by transportations, road administration, communications and information technology, which in the first half year represented 49.8% of the total economic expenses The amount of the respective expenses increased by 60.7% compared to the similar period of last year. At the same time, the amount of the expenses for agriculture, forestry administration, fishing administration and water administration decreased by 11.9% compared to the similar period of last year. Budget financial result The performance of the state budget in the 1st half year of 2013 resulted in a deficit of million MDL, namely 48.2% of the deficit from the same period of
32 In the first half year of 2013 there was a state budget deficit of million MDL, and the budget of state social insurance was 7.7 million MDL, and the administrative-territorial units and the funds of mandatory medical insurance funds reported an excess of million MDL and 96.8 million MDL, respectively The financing sources of the deficit were: revenues from the sale of state movable assets (278.5 million MDL); redemption of public securities issued for ensuring financial stability (-46.5 million MDL); loans paid from external sources (401.7 million MDL); reimbursement of principal ( million MDL); assets from the sale and privatization of the public property (30.0 million MDL); change of balances ( million MDL); other sources (+91.9 million MDL). Balances of the accounts of the national public budget as of June 30, 2013 increased, compared to January 01, 2013, by 61.8 million MDL and were million MDL. The balances of the accounts of the state budget, as of June 30, 2013, decreased by million MDL, compared to January 01, 2013, namely million MDL. The balances of the budgets of the administrative-territorial units, compared to January 01, 2013, increased by million MDL, compared to June 30, 2013, namely million MDL. The balances of the accounts of the state social insurance budget, as of March 31, 2013, were million MDL, a decrease of 7.7 million MDL. As of June 30, 2013, the balances of the funds from the mandatory healthcare premiums were million MDL, an increase of million MDL compared to the beginning of the year. Public debt As of June 30, 2013, the balance of the public debt was 21, million MDL, an increase of million MDL compared to the beginning of the year. Regarding the structure by debt type, the public debt as of June 30, 2013 was composed of 70.6% external public debts and 29.4% internal public debts. The dynamics shows that the weights of the external and internal public debt remained relatively constant, according to the analysis of the quarterly evolutions of the previous year and of the examined period External state debt State securities issued on the primary market SDR allocation Converted state securities State security for financial stability Q Q Q Figure Structure of the state debt by instruments, million MDL Source: According to the data of the Ministry of Finance. 32
33 The balance of the public debt by instruments shows that in the examined period, compared to the similar period of the previous year, there was an increase of the balance of the public debt for all instruments, except for converted state movable assets and state movable assets for ensuring financial stability, which reported a decrease of 6.8% and 26.7%, respectively. The highest increase in the dynamics was that of the balance of the public debt resulted from state movable assets issued on the primary market (17.9%) followed by external state loans (+11.3%). External state debt As of June 30, 2013, the balance of the external public debt was million MDL. Compared to the situation as of January 01, 2013, the external state debt recorded an increase of million MDL, or by 2.2%. Compared to the situation from the same period of last year, the external state debt increased by 1372 million MDL, or by 9.8%. By analyzing the external state debt depending on maturity on June 30, 2013, we find that it is largely composed of the long-term external public debt (76.6%) a situation which differs from the one recorded at the same moment of 2012, given the fact that there are also two other positions - medium-term external public debt (approximately 19%) and the short-term external public debt (approximately 5.7%). 16, , , , , , , , Q Q Q Long-term Medium-term Short-term Figure Structure of external state debt by maturity as of June 30, 2012, December 31, 2012 and June 30, 2013, million MDL Source: According to the data of the Ministry of Finance. Depending on the currency structure of the debt, the external debt is examined without the breakdown of DST and with the breakdown of DST. Table Structure of the external public debt by currency,% of the total external debt Currency type DST USD EURO JPY GBP WPU With the breakdown of DST Without the breakdown of DST Source: According to the data of the Ministry of Finance. In the structure of the external state debt by creditors, multilateral creditors continue to be the main creditors of the Government of the Republic of Moldova. The external state debt to multilateral creditors, as of June 30, 2013, was 84.3% of the total external state debt, to bilateral creditors 15.3%, to commercial creditors 0.4%. The highest weight in the balance of the external state debt to multilateral creditors is that of IDA with 40.9%, followed by IMF with 26.1%, EIB with 5.8%, IFAD with 4.9%, etc. 33
34 As an evolution, we notice the ascending trend of the external public debt to multilateral creditors. At the same time, the external public debt to bilateral and commercial creditors continued to drop. Internal public debt As of June 30, 2013, the internal state debt was million MDL and is completely formed of state movable assets. Compared to the situation as of January 01, 2013, the internal state debt recorded an increase of million MDL, or by 3.8%. Compared to the same situation of last year, the internal public debt increased by million MDL, or by 7.8%. The increase of internal debt is mostly due to the additional issuance of state movable assets on the primary market. By analyzing the internal state debt based on its components, we notice that 64.1% are state movable assets issued on the primary market (as of June 30, 2012 their weight was 57.1%), 32.3% - converted state movable assets (37.4% as of June 30, 2012) and 3.6% - public securities issued for ensuring financial stability (as of June 30, 2012 they were 5.5% and on June 30, 2011 they were not even issued). The state movable assets with maturities up to a year were issued with three terms: T-notes of 91 days, 182 days and 364 days, whose weight in the total SMA traded by tenders was 99%. The highest weight in issued state securities belonged to T-notes on 182 days (43.2%) and 91 days (30.1%) weights which remained relatively constant in relation to the similar period of last year (42.6% for BT of 182 days and 33.8% for BT of 91 days). We would like to mention that there was also a decrease of the weight of state bonds for 2 years, a decrease of 1.5% out of the total VMS traded on the primary market at 1.0%. A significant decrease as of June 30, 2013, compared to June 30, 2012, was that of state bonds by subscription which, from a weight of 2.1% recorded on June 30, 2012, were no longer in the situation as of June 30, By analyzing the internal state debt depending on the maturity as of June 30, 2012, we find that the highest weight is that of the short-term internal debt (95.9%), followed by medium-term internal public debt (4.1%), and long-term internal public debt is completely absent. Thus, the trend mentioned in the previous editions, namely the increase of the weight of short-term internal debt is emphasized. 7, , , , , ,000.0 Long-term Medium-term Short-term 1, Q Q Q Figure Structure of internal state debt by maturity as of June 30, 2012, December 31, 2012 and June 30, 2013, million MDL Source: According to the data of the Ministry of Finance. 34
35 State debt service In the first half year of 2013 for the state debt service, assets of million MDL were used from the state budget, out of which: external state debt service of million MDL (93.5% of the value planned for the respective period) and the internal state debt service of million MDL (83.8% of the estimated value). Out of the total external public debt, the amount of million MDL was used to reimburse the main amount and 84.8 million MDL for the external state debt service. Public finances in the region from the left side of the river Dniester In the first half year of 2013, the revenues of the budget of Transnistria were million MDL, namely 6.1% of the total revenues obtained from the territory controlled by the Republic of Moldova, out of which: million MDL fiscal payments (79.2%); 24.0 million; MDL nonfiscal payments (2.3%); million MDL revenues from special funds (10.7%); 79.8 million MDL revenues from entrepreneur business and other revenues (7.8%). The accumulation of budget revenues in the first half year of 2013 was 1.1% higher than in the similar period of Compared to the planned value, the accumulations were 24.9% higher Q Q Fiscal incomes Non-fiscal incomes Incomes from special funds Revenues from income tax and other revenues Figure Structure of Transnistria revenues in the 1st half year of 2012 and 2013, million MDL Source: According to the data of the Ministry of Finance of Transnistria. The expenses of the budget of Transnistria represented million MDL or 7.6% of the total expenses incurred on the controlled territory of the Republic of Moldova, which constitutes 79.4% variation from the established plan of expenses. Compared to the similar period of last year, expenses were 87.3%. The most important weight in the total expenses is that of social expenses, especially expenses for social (19.3%) and medical (16.7%) protection, education, science, culture. An important weight is that of the expenses of state institutions for maintaining public order (14.6%) Banking sector In the period , the situation of the banking system from the Republic of Moldova, despite the worsening of the situation of S.A. Banca de Economii and the economic decline of 2012, continues to be stable, with sufficient liquidities and good capitalization, which allows the banks to resist unpredictable shocks and disturbances. 35
36 We would like to mention that the banking sector of the Republic of Moldova consists of 2 levels, represented by the National Bank of Moldova (NBM) and 14 licensed commercial banks. The total number of employees from the banking system as of June 30, 2013 was less than on December 31, Namely, in average for each employee from the banking sector there were assets of 5.7 million MDL, 0.5% more than on January 31, In the first half year of 2013, the total assets of the banking system totaled million MDL, a 5.9% increase compared to the end of January On July 30, 2013, the total assets of the banking system amounted to million MDL, a 10.8% increase compared to January 31, In July 2013, the evolution of banking assets was determined by the accentuated growth of profit-generating assets, the highest weight in the total assets was that of the credit portfolio 62.3%. Table Evolution of banking assets by volume and structure, in 2012 H1 2013, % Indicator name: Q H % of total assets Total assets, out of which: Cash and cash equivalents Financial assets held for trading Financial assets available for sale Loans and receivables Investments held to maturity Tangible assets Intangible assets and tax receivables Other assets Source: National Bank of Moldova. Thus, on June 30, 2013, compared to December 31, 2012, there were the following modifications: - increase of cash by 1%, to million MDL; - increase of tangible assets by 0.2%, to million MDL; - decrease of other assets by 1%, to million MDL. The balance of credits in the economy was million MDL on June 30, 2013, million MDL or 6.4% higher than January 31, The increasing trends were caused by the increase of the balance of loans granted in national currency by 7.5% and by 6.09% of the balance of loans granted in foreign currency, respectively. At the end of July 2013, the balance of credits in the economy was million MDL, a 15.6% increase compared to the end of July In the 1st half year of 2013, the increase of the balance of credits in MDL occurred following the increase of the balances of credits granted to all sectors of the economy, thus the balance of other organizations performing financial operations increased by 0.2% compared to the end of Respectively, the balance of credits granted to the private sector was 77.9%, the same as at the end of In July 2013, the positive evolution of the balance of the demand from the economy in the national currency was determined by the increase of the balance of the demand from the private sector by million MDL (3.3%) and from other residential sectors by million MDL (2.3%). At the same time, the balance of the demand from state companies decreased by 3.9 million MDL (0.5%) and that of the demand from other organizations which perform financial operations by 55.4 million MDL (13%). 36
37 Private sector- 77.9% Other organizations performing some financial operations- Consumer loans 2.6% -6.5% Other resident sectors (individuals) % Housing loans- 4.2% State-owned companies- 4.2% Other loans- 4.6% Figure Distribution of credits in the economy of the Republic of Moldova (%) in the 1st half year of 2013 Source: According to the data of the National Bank of Moldova /12/ /01/ /09/ /12/ /01/ /03/ /06/ /07/2013 Non-performing loans Provisions for loan losses Figure Evolution of banking credit quality, % Source: According to the data of the National Bank of Moldova. In the first half year of 2013, the amount of bad credits (substandard, compromised and doubtful) in absolute value was million MDL, and the weight from the total credits was 12.7%, a decrease by 1.8% compared to December 31, The same volume of bad credits, projected on TNC, was 18.4% on June 31, 2013, 7.5% lower than on December 31, In this context, the discounts for loan liabilities decreased by 0.5%, and reached 10.7% at the end of At the end of July 2013, the discounts of the credit debt were 10.1%. In June 2013, the average rate of the interest for the credits granted in the national currency decreased by 0.05% compared to December 2012, and reached 12.03%, and in July 2013 it reached 12.05%. Consequently, in June 2013, the average interest rate for the credits in foreign currencies was 7.59%, a 0.77% decrease compared to December 2012 (8.32%), and in July 2013, the average interest rate for credits in foreign currencies was 7.37%, 0.95% less than in December Consequently, the volume of new credits granted by banks in the national currency decreased in August 2012 March 2013 because of the decreases in some sectors (industry, transportation 37
38 and wholesale). Starting with 2013, the volume of credits in the economy increased due to the increase in the volume of loans in MDL due to the improvement of the economic situation and outlook. Respectively, in 2013 the volume of credits granted in MDL in January 2013 was million MDL, and in June 2013 it was million MDL, an increase of million MDL. In July 2013, the volume of new credits granted in the national currency increased by million MDL, or 49% compared to the similar period of last year, and amounted to million MDL. The weighted average rate of the interest for new credits granted in the respective period was 12.05%, a decrease of 1.33% compared to the similar period of last year. Table Evolution of new credits granted by volume and structure in 2012 H January 2012 December 2012 April 2013 June 2013 Foreign Foreign Foreign Foreign million MDL currency million MDL million MDL currency million MDL million MDL currency million MDL million MDL currency million MDL Up to 1 month months months months Over 12 months Total Average rate, % Source: According to the data of the National Bank of Moldova. In June 2013, the volume of new credits granted in foreign currencies (expressed in MDL) decreased by million MDL, compared to December 2012, namely million MDL. The weighted average rate of the interest for these credits in the respective period was 7.59%, a decrease of 0.73%. In the 1st half year of 2013 there was an increase by the value of the assets owned by the commercial banks of the Republic of Moldova. Thus, by the value of banking assets, the market is concentrated by 4 commercial banks, which own 61.7% of the total assets. The leader by the value of assets is BC Moldova-Agroindbank, which as of June 30, 2013 reached the total value of million MDL, a 19.2% share. The following position is held by BC Victoriabank, with an asset volume of million MDL, million MDL higher than June 30, 2012, and the market share of the bank remained the same, 17.8%. By analyzing the market concentration index (the Herfindahl-Hirschman index) in the 1st half year of 2013, we find that the banking sector is within the limits of a banking market with a moderate degree of concentration ( points) by the value of assets (see table 3.2.3). In July 2013 there was an increase of deposits for the commercial banks of the Republic of Moldova. Thus, by the value of banking deposits, the market is concentrated by 4 commercial banks, which own 67.1%. The leader by the volume of obtained deposits is BC Victoriabank, which as of June 30, 2013, had obtained deposits in total value of million MDL, million MDL more than June 30, 2012, and the market share of the bank decreased by 0.9%, to 21.1%. The second position in the rankings as of June 30, 2013 is held by BC Moldova- Agroindbank, with obtained deposits of million MDL, million MDL more than on December 31, 2012, and the market share of the bank is 19.3%. 38
39 Table Concentration indexes in the banking sector, in the 1st half year of , % Market share by the Market share by the Market share by the No. Name of the banks value of assets (%) value of Credits (%) value of deposits (%) June 30, June 30, June 30, June 30, June 30, June 30, Comerţbank Banca Socială Victoriabank Moldova- Agroindbank Moldindconbank Banca de Economii EuroCreditBank Unibank FinComBank Energbank ProCreditBank BCR Chişinău Eximbank-Gruppo Veneto Banca Mobiasbanca- Groupe Societe Generale HHI index (points) CR-4 index (%) Source: Calculations based on the data provided by the commercial banks. The evolution of the credits of commercial banks increased in the 1st half year of As on June 30, 2013, by the balance of banking credits, the market is concentrated by 4 commercial banks, which own 65.3% of the total credits, out of which: BC Moldova-Agroindbank 21.4%, BC Moldindconbank 18.1%, BC Victoriabank 17.8% and BC Eximbank 8%. Respectively, BC Moldova-Agroindbank, the leader of the banking market, recorded a credit balance of million MDL on June 30, 2013, million MDL more than on June 30, In this analyzed period, despite the worsening of the financial situation of S.A. Banca de Economii, we notice a decreasing trend for the main indexes (assets, deposits and credits). Thus, on June 30, 2013, by the balance of banking credits, the financial institution has a market share of 4.6%, 3.5% less than on June 30, Consequently, as of June 30, 2013, the financial institution had granted less credits (credit balance million MDL), 1065 million MDL or 61.2% less than on June 30, The total normative capital, a determining factor of bank solvency, as of June 30, 2013, for the entire banking sector, was million MDL, an increase of million MDL compared to December 31, At the end of July 2013, the total normative capital was million MDL. Thus, the risk-weighted assets were million MDL, more by million MDL compared to the end of The 1st tier capital, as of June 30, 2013, increased by 6.3% to million MDL compared to December 31, In July 2013, this indicator decreased by 0.4% compared to the previous month. The positive value of this indicator confirms the resistance and safety of the system in case of financial shocks. Consequently, all the commercial banks from the Republic of Moldova 39
40 have a 1st tier banking capital corresponding to the minimum necessary capital of 200 million MDL, except for one. In the first quarter of 2013, the share of foreign investments in the share capital of banks was 75.1%, a 4% increase. This situation is explained by the increase of the share capital due to the investments of non-resident shareholders by 15.5% and the decrease of the investments of resident shareholders by 3.2%. I semester2013 I quarter Total risk-weighted assets First-tier capital CNT Figure Evolution of the banking system capital Source: According to the data of the National Bank of Moldova. At the end of the 1st half year of 2013, bank bonds amounted to million MDL, a 10% increase compared to December 31, On June 30, 2013, compared to the end of 2012, there were the following modifications in the structure of the bonds of the banking sector: - Decrease of financial liabilities assessed at harmonized cost by 0.09%, namely 51,972.9 million MDL; - decrease of provisions by 0.04%, namely MDL; - decrease of tax liabilities by 0.02%, namely MDL; - increase of other liabilities by 0.18%, to million MDL. Table Evolution of bank bonds by volume and structure, in 2012 and in the 1st half year of 2013, % Indicator name: Q H % of total bonds Total bonds, out of which: Financial liabilities assessed at harmonized cost Provisions Tax liabilities Other liabilities Source: National Bank of Moldova. In the first half year of 2013, the balance of deposits in the banking system totaled million MDL, a 6% increase, compared to the end of 2012, as a result of the increase of the balance of deposits in MDL by 4.8%, a weight of 61%, and of deposits in foreign currencies by 0.24%, a weight of 39% in the total deposits.. Consequently, in July 2013 the balance of deposits in the banking system was million MDL, a 6% increase compared to December
41 Other resident sectors (natural persons) 77% Non-banking financial sector 4% Sector of nonfinancial commercial companies 19% Figure Distribution of deposits in the economy of the Republic of Moldova (%), as of June 30, 2013 Source: According to the data of the National Bank of Moldova. The volume of new deposits obtained as of March 31, 2013 was million MDL, 32% less than on December 31, In July 2013, the new term deposits in MDL decreased by million MDL, or 27% compared to the same period of the previous year, to million MDL. The average interest rate for term deposits in MDL in the respective period decreased by 0.24%, to 7.16%. Table Evolution of new deposits obtained by volume and structure in 2012 H January 2012 December 2012 April 2013 June 2013 Foreign Foreign Foreign Foreign million MDL currency million MDL million MDL currency million MDL million MDL currency million MDL million MDL currency million MDL Up to 1 month months months months Over 12 months Total Average rate, % Source: According to the data of the National Bank of Moldova. In June 2012 June 2013, we notice a decrease of million MDL, or 29%, and amounted to million MDL, in the structure of deposits in foreign currencies, consequently there was an increase in the average rate of the interests of obtained deposits by 0.57%. Therefore, we notice a descending trend in new deposits obtained by banks, starting with June 2012, and this situation was caused by the decrease of deposits with a due date of up to 6 months and deposits with due dates higher than 6 months, in an irregular manner. These modifications in the structure of new deposits by the due dates were caused by the delay of investment projects of some companies and the worsening of the situation of Banca de Economii, caused the reduction of the total volume of deposits. 41
42 The banking margin for the operations in the national currency in December 2012, recorded a minimum level of 3.54%, and in July 2013 there was a level of 4.89%, with an increase of 1.35% compared to December Average rate for deposits in MDL Average rate for credits in MDL 0 dec.2007 dec.2008 dec.2009 jan.2010 marc.2010 may.2010 jul.2010 sep.2010 nov.2010 jan.2011 marc.2011 may.2011 julie.2011 sep.2011 nov.2011 dec.2011 feb.2012 marc.2012 may.2012 junie 2012 sept.2012 nov.2012 dec.2012 marc.2013 mai.2013 iulie.2013 Figure Evolution of the banking margin*, of average interest rates of deposits and credits in MDL, % Source: Calculations based on the data provided by the National Bank of Moldova. *Note: The banking margin indicator was calculated as the difference between the average interest rate of deposits in MDL and the average rate of credits in MDL. In this context, we notice that the average interest rates of deposits in the national currency started to increase in February 2012, to 8.04%, and in December 2012 there was the highest rate of 8.44%. The average interest rates for the deposits in foreign currencies decreased since the beginning of the year from 4.79% in January 2013 to 4.29% in July 2013, a 0.5% decrease. In the first half year of 2013, the profit of the banks in the entire system was million MDL, and in June 2013 it was 28.9 million MDL, million MDL or 17.2% less than in the similar period of Profit I semestre I semestre 2013 Figure Evolution of the banking profitability, million MDL Source: According to the data of the National Bank of Moldova. In the first half year of 2013, the net revenues on assets (ROA) was 1.6%, and the net revenues on equity capital (ROE) was 9.3%. At the same time with the increase of the volume of the shareholding capital and assets, the increase of ROE and ROA shows that the growth rate of the net profit is much faster, which is quite encouraging. 42
43 ROE ROA I semestre I semestre Figure Evolution of banking profitability, % Source: According to the data of the National Bank of Moldova. The weight of assets, generating interests in the total assets, as of March 31, 2013, increased by 1.7% and was 83.4% compared to December 31, 2012, which was 81.7%. Respectively, on June 30, 2013, the level of the net interest margin was 3.8%. Thus, banks in more difficult situations compensate revenues from other sources, especially from transfer commissions, including from abroad, and from other commissions applied by banks. The efficiency index, determined as the ratio between the net revenues corresponding to interests plus expenses not corresponding to interests, as of June 30, 2013, was 139.1%, 26.5% more than on December 31, In July 2013, the efficiency index was 141.2%, 28.6% more than in December jan.2011 april.2011june 2011 jan.2012 april.2012june.2012 sep.2012 dec.2012 jan.2013 april.2013 jun 2013 jul.2013 Liquid assets / Total assets The minimum capital adequacy Capital adequacy The minimum level of liquidity Figure Liquidity indicators and capital sufficiency, % Source: According to the data of the National Bank of Moldova. The capital sufficiency degree is maintained on a high level of 23.3% on June 31, Although above the necessary minimum level of 16% (until May 2012 the sufficiency of the risk-weighted capital was 12%), we notice a decrease of this indicator by 1.10% compared to December 31, We consider that the insignificant increase of the banking capital sufficiency degree is explainable by the considerable increase of the credit portfolio, which is part of the high-risk assets with a major weight in the risk. Banking liquidity may be regarded both based on the weight of liquid assets in the total assets, and based on bonds, which the bank is obligated to pay. Thus, in December 2012, the weight of 43
44 liquid assets (2nd principle of liquidity) was 32.9%, and in July 2013 it was 31.2%, a decrease of 1.7%. Table Trends of banking liquidity, % Indicators Q H Second principle of liquidity First principle of liquidity Source: According to the data of the National Bank of Moldova. Long-term liquidity or the 1st principle of liquidity for the entire banking system recorded 0.8% as of June 30, 2013, 0.1% more than in December 31, These values of the liquidity indicators show the existence of adequate sources for supporting payments corresponding to bonds. The region of the Republic of Moldova to the left of the river Dniester. In the 1st half year of 2013, the evolution of the banking sector of Transnistria recorded relatively stable development trends. The total assets of the banking system of Transnistria as of August 01, 2013 amounted to million rubles, the equivalent value of million MDL. Compared to January 01, 2012, assets increased by million rubles, amounting to million rubles (48.1% of GDP), the equivalent value of million MDL (as of August 01, 2013 a Transnistrian ruble was MDL, and on January 01, 2012 it was MDL). As of August 01, 2013, the owner's equity of the banks was million rubles, million rubles more than on January 01, 2013 ( million rubles). The equity capital of Transnistrian banks on August 01, 2013 was million rubles. The balance of credits granted to the economic sector reached on August 01, 2013 the amount of million rubles. The credits granted to natural persons in this period was million rubles, and the credits granted to legal entities were million rubles Monetary policy The monetary analysis is based on the fact that inflation and monetary expansion are tightly related, average term and long term, thus supporting the average-term orientation of the monetary policy strategy of the National Bank of Moldova (NBM). Within the key-indicator range which it periodically monitors and analyzes, NBM pays great importance to monetary aggregates. Consequently, monetary indicators recorded an increasing trend, as on June 30, 2013 the monetary aggregate stock was higher compared to June 30, monetary aggregate M0 was approximately 13.9 billion MDL (as of June 30, billion MDL); - monetary aggregate M1 was 21.7 billion MDL (as of June 30, billion MDL); - monetary aggregate M2 was 37.4 billion MDL (as of June 30, billion MDL); - monetary aggregate M3 was 52.4 billion MDL (as of June 30, billion MDL); There was also an increase of the monetary base on June 30, 2013, reaching a level of 20.9 billion MDL, a 19.1% increase compared to June 30, 2012 (17.5 billion MDL). This increase was largely due to the positive evolution of the net internal assets of NBM. 44
45 Monetary base Monetary aggregate M3 Monetary aggregate M2 Monetary aggregate M1 Monetary aggregate M0 Jun Mar Dec Dec Dec Figure Evolution of aggregate monetary indexes and the monetary base, million MDL Source: According to the data of the National Bank of Moldova. The structure of the monetary mass did change significantly. On June 30, 2013, the components of the monetary mass were distributed as follows: aggregate monetary index M0 (circulating money) 26.7%; on-demand deposits 14.8%; term deposits 29.9% and foreign-currency deposits 28.6%. Respectively, in the 2nd quarter of 2013 the high growth rate of monetary aggregates was maintained, and the quarterly average values in annual terms were 26.1% for M2 and 21.9% for M3, 0.5% above the growth rate from the first quarter of % 80% 60% 40% 20% Monetary aggregate M0 Instruments of monetary market Short term deposits Long term deposits 0% Figure Structure of monetary mass M3 Source: Calculations according to the data of the National Bank of Moldova. The attenuation of the growth rates of prices and the decrease of the annual inflation rate reflected the necessity of relaxing the monetary policy of NBM. The monetary policy instruments decreased in the first quarter of 2012, and starting with April 2012 their level remained constant until March Thus, in the 2nd quarter of 2013, NBM reduced by 1.0% the basic rate, whose level starting with April 29, 2013 was 3.5%. There was also a 1% decrease in the basic rate for long-term credits (longer than 5 years), from 5% to 4% a year. In 2012 the evolution of the liquidity sterilization operations was characterized by an increasing trend, which continued in the first months of 2013 (the highest balance was in March 2013; the 45
46 average daily balance of CBN sales was 4.56 billion MDL). Consequently, in the following months of 2013 the daily average balance of CBN sales started to drop, and in July there was the lowest balance of 3.30 billion MDL. 14 Base rate, % The interest rate on overnight loans, % % Jan Mar Juni.2012 Sept Jan Febr Mart Jun. 2013Julie 2013Aug.2013 Figure Evolution of the interest rates for the monetary policy instruments of the National Bank of Moldova between 2012 and 2013 Source: According to the data of the National Bank of Moldova. Mil. MDL Jan CNB, average daily stock Overnight credits, average daily stock Apr Jul Oct Jan Apr Jul Oct Jan Apr Jul Oct Jan Apr Jul Oct Overnight deposits, average daily stock Jan Apr Jul Oct Jan Apr Iul Oct Ian Apr Jul Figure Monetary policy instruments, million MDL Source: According to the data of the National Bank of Moldova. Between January 2013 and August 2013, the demand of overnight deposits recorded a volatile evolution, as the average daily balance varied between million MDL (January 2013) and million MDL (August 2013). In the same period, commercial banks requested overnight credit facilities from NBM only in August 2013 of 0.3 million MDL. In the 1st half year of 2013 and in August 2013, NBM did not change the mandatory reserve rate, and its level was maintained at 14%. 46
47 25 Reserve requirements Ian Apr Jul Oct Ian Apr Iul Oct Ian Apr Iul Oct Ian Apr Iul Oct Ian Apr Iul Oct Ian Apr Iul Oct Ian Apr Iul Figure Evolution of mandatory reserve rates, % Source: According to the data of the National Bank of Moldova. The moderate depreciation of the national currency in the current year is according to the monetary policy of NBM, directly aiming at inflation and contributing to the attenuation of deflation pressures by stimulating internal demand. In order to depreciate the MDL in relation to the reference currencies (thus decreasing the prices of exported products and stimulating the competitiveness of internal commodities) NBM resorted to currency procurements. Table Foreign currency procurements made by NBM on the interbank market between June 2012 and July 2013 Month Volume of procurements, million USD June July August September October November December January February March April May June July Source: According to the data of the National Bank of Moldova. In the 2nd quarter, the activity of NBM on the interbanking currency market versus MDL was million USD, out of which 0.65 million USD represented currency conversions with World Bank institutions. In June 2013 NBM performed operations on the interbanking currency market of 15 million USD, representing currency swaps. The maximum value of currency procurements was achieved in July 2013, when the amount of USD 91.8 million was purchased. USD. At the same time, the balance of official reserve assets exceeded 2 billion USD (on June 28, 2013, the balance of currency reserves was 2.46 billion) USD). Respectively, by comparing to May 31, 2013, the official reserve assets dropped by 8.72 million USD, when they were 2.47 billion USD. 47
48 Consequently, the decrease of official reserve assets was conditioned by the performance of currency swap operations on the internal currency market as foreign currency sales of 15 million USD, and by the payments corresponding to the external debt service of the Republic of Moldova of 7.34 million USD, and other payments of 1.74 million USD. The increase of official reserve assets was largely conditioned by the increase of the exchange rates of the currencies of currency reserves in relation to USD of 4.83 million USD, and by the entries corresponding to the mandatory foreign-currency reserves of licensed banks of 3.06 million USD Official reserve assets Net foreign assets Net international reserves June June 2013 Table Evolution of official reserve rates and net external assets, million MDL Source: According to the data of the National Bank of Moldova. The region of the Republic of Moldova to the left of the river Dniester. As of July 01, 2013, the monetary mass in the region left of the river Dniester was 5687 million rubles, 5.5% less than in June Characteristic for the region left of the river Dniester in July 2012 June 2013 there was a decrease in the weight of foreign currencies in the monetary mass by 0.2%, to 64.7%. In the 1st half year of 2013, given the increase of the liquidity excess, the mandatory reserve rate increased on two occasions: on January 01, 2012 from 11 to 13%, and on February 01, 2012 from 13 to 14%. The mandatory reserve rate of 14% remained constant in March - June
49 Chapter IV EXTERNAL SECTOR In the first 6 months of 2013, the current account of the payment balance recorded a deficit of million USD, 16.1% higher than the similar period of last year. The increase of the negative balance was caused by the increase of the goods trade balance deficit by 5.4% on the background of an attenuation of excess revenues and current transfers, which increased by 5.8% and 0.7%. The evolutions of these sub-accounts influence the most the formation of the current account balance, given their significant volume. Table 4.1. Balance of payments Current account (synthetic presentation) Nominal value, million USD Growth rate,% H H H H H Current account Goods Export Import Services Export Import Revenues Collections Payments Current transfers Collections Payments Source: According to the data of the National Bank of Moldova. The goods trade balance in the first half of the year showed a decrease of the trade deficit by 5.4%. Especially following the evolutions from the first quarter, exports increased in the first six months of the year by 7.5%, while imports increased more slowly, being influenced both by the moderate demand and by the decrease of the unit value of imported products. A better situation is shown by the trade with services, as its trade deficit is only 14.4 million USD, a 26.5% decrease compared to the similar period of last year. Exports of services in the first half year were million USD, a 10.7% increase compared to the similar period of last year, a positive dynamics for most categories of services, except for communications, insurance and some governmental services. Imports had a slower evolution in the analyzed period, both compared to the growth rate of exports and compared to the evolution of imports in January- June Thus, they increased by 9.1%, and reached a level of million USD. The main services which were subject to external commercial transactions were transportation and traveling services, with a weight of 62.8% of exports and 73.5% of imports. An important source of incomings in the current account, besides exports, is represented by revenues obtained from the compensation for work of Moldovan residents by non-residents and personal transfers from abroad. At the same time, in January-June 2013 their increase was significantly attenuated, by 37.9% and 9.9% compared to the similar period of last year. 49
50 Table 4.2. Evolution of foreign trade in services in the 1st half year of 2013 Nominal value, million USD Export Growth rate, 2013/ 2012, % Structure, % Nominal value, million USD Import Growth rate, 2013/ 2012, % Structure, % Commercial balance, million USD Total Transportation Travel Communications services Construction services Insurance services Financial services Computer and informational services Royalty services and license fees Other business services Personal, cultural and recreational services Governmental services not included elsewhere Source: According to the data of the National Bank of Moldova. Table 4.3. Balance of payments Capital and financial account (synthetic presentation) Nominal value, million USD Growth rate,% H H H H H A Capital and financial account Capital account Input Output Financial account Direct investments Portfolio investments Financial derivatives Other investments Reserve assets Assets
51 Table 4.3 continue A FDI Portfolio investments Financial derivatives Other investments Reserve assets Liabilities FDI Portfolio investments Financial derivatives Other investments Source: According to the data of the National Bank of Moldova. In the first six months of the year, the positive balance of the financial account increased by 14.9% compared to the similar period of last year, to million USD. Its increase occurred as a result of the decrease of assets from the financial account (predominantly the decrease of cash in foreign currencies held by residents and of current accounts and term accounts of residents abroad, the decrease of receivables to commercial partners, and the decrease of reserve assets), on one hand, and the increase of liabilities, on the other hand. The increase of liabilities occurred due to a relatively good increase of the net inflow of FDI, while loans contracted from nonresidents decreased because of the high volume of amounts reimbursed by companies, including from the banking sector, and by the government sector and monetary authorities. Remittances This year, remittances continued the attenuation trend from last year. In the first quarter the volume of remittances made from abroad into the Republic of Moldova increased by 12.3%, and in the 2nd quarter by 8% a 2.3% and 1.8% decrease compared to the same periods of last year. Thus, in the first six months they totaled million USD, namely 9.9% more, compared to the same period of 2012, but less than 10.3% compared to the previous semester H I 2008 H II 2008 H I 2009 H II 2009 H I 2010 H II 2010 H I 2011 H II 2011 H I 2012 H II 2012 Nominal value, mil. USD Growth rate, % H I Figure 4.1. Evolution of the inflow of remittances in Source: According to the data of the National Bank of Moldova. The attenuation of the growth rates of remittances can be explained both by the difficult recovery of Western economies, where the unemployment rates continued to increase also this year, and by the dynamic of this flow of monetary means from the Russian Federation, which 51
52 seems to be the determining factor. Remittances made from this country were in the first half of this year million USD, which represents 60% of all the money transfers made in this period, +0.4% compared to the level of the first half year of At the same time, we would like to mention that this position is maintained even in case of significant attenuations of the inflow of remittances at least in the last two years, and its evolutions exceeded the dynamics of th remittances from other states. We would like to mention that in the first two quarters the added value in the construction sector, where some of the Moldovan emigrants are employed, had a very modest evolution, after a 0.4% increase in the 2nd quarter, and continued with a decrease of 3.9% in the following period. On the background of these evolutions, and also given the latest events in Moldovan-Russian relations towards the end of the 3rd quarter, the growth prospects of these inflows become uncertain HI 2011 HII 2011 HI 2012 HII 2012 HI Share of remittances from other countries, % Share of remittances from Russia, % Growth rate of remittances from Russia, % Growth rate of remittances from other countries, % Figure 4.2. Transfers of monetary means made to the Republic of Moldova, coming from the Russian Federation in Source: According to the data of the National Bank of Moldova. Given the components of the payment balance which form the inflows of remittances, 55.1% are made up of work compensations and 43.9% from personal transfers made by non-residents to residents. The increase by 9.9% of the inflow of remittances in the first half year of 2013 compared to the similar period of 2012 was 5.7% determined by the increase of revenues obtained by work compensations, while personal transfers contributed less, 4.1%. Foreign direct investments After the evolutions of last year, where according to the updated data the net inflows of FDI decreased by 33.5%, the available data for the first half of this year shows a recovery. Thus, between January and June 2013, the volume of net FDI made in the Republic of Moldova was million USD, which represents a 45.8% increase compared to the amount of foreign investments obtained in the national economy. Such dynamics is encouraging, but given the low comparison basis of last year and the critical insufficiency in the national economy, it is insufficient. Although the level of net foreign direct investments exceeded almost twice the value recorded in the 1st half year of last year, it remains lower, compared to the first half year of Considering the inflows of the beginning of the year, at the end of the first half year of 2013 the stock of FDI in the national economy was million USD. Considering the structure of investments by capital forms 67.3% of them were represented by investments in share capital, 10.9% by reinvested revenues, and 21.9% by other investments (out of which 80.8% commitments to foreign investors). The structure was modified compared to the situation from the first half of last year, when the increase was exclusively ensured by the evolution of investments in share capital, while reinvested revenues and intra-group credits marked negative values - (-) 0.5 million USD and, ( ) 10.8 million USD. 52
53 H I 2008 H II 2008 H I 2009 H II 2009 H I 2010 H II 2010 H I 2011 H II 2011 H I 2012 H II 2012 Nominal value, mil. USD Growth rate, % H I Figure 4.3. Net inflow of FDI in the economy of the Republic of Moldova in Source: According to the data of the National Bank of Moldova. H I 2013 H II 2012 H I 2012 H II 2011 H I 2011 Other capital Reinvestment of earnings Equity capital Figure 4.4. Net inflow of FDI by forms of capital Source: According to the data of the National Bank of Moldova. This year, the foreign investments in the share capital were most significant 82.7 million USD, and compared to the same period of last year they decreased by 13.6%. However, in this period there was a recovery of the investments made from undistributed revenues of foreign investors and contracted intra-group credits. The short-term and medium-term growth prospects of FDI in the national economy could be endangered by a series of events, occurred more or less recently, such as political instability, situations occurred in the national banking system, the transparency of the process of the privatization of public assets on the background of other acute constraints, which could decrease the trust of foreign investors in the national business environment. Foreign trade The total value of commercial transactions with goods performed by resident agents with nonresident agents in the first half of the year indicates a slight recovery. The total value of foreign trade in this period was 3716 million USD, a 6.1% increase compared to the similar period of last year, as both imports and exports increased. At the same time, an increase of exports with rates which exceeded those of imports maintained a moderate increase of the negative balance of the trade with goods and the pressure on GDP. At the same time, the evolution of foreign trade in this period, which also reflects a certain degree of instability, and the climate of uncertainty created in the economic relations with 53
54 Eastern partners, generate uncertainty in the development prospects for these flows in the following months, until the end of the year. Table 4.4. Growth rate of the nominal value of foreign trade in , % Export Import Commercial balance H H H H H Figure 4.5. Evolution of the half year nominal value of foreign trade in in million USD Source: Based on the data of the National Bureau of Statistics Exports Imports Figure 4.6. Monthly evolution of foreign trade in , % Source: Based on the data of the National Bureau of Statistics. 54
55 Exports After a progressive decrease which started in the second half of 2011, in the fourth quarter of last year exports reached their inflection point. In the first half of this year, they resumed their increasing trend, but their dynamics is marked by unstable evolutions. Table 4.5. Export volatility level Volatility (calculated based on the standard deviation) Source: Calculated by authors. January-July 2011 January-July 2012 January-July After a 15.4% increase in the first quarter compared to the similar period of last year, in the second quarter the increase of exports significantly decreased to only 0.4%. At the same time, in the first half of the year goods were exported in value of million USD, which represents a 7.7 increase compared to the first half year of Considering the dynamics of exports in July (+24%) for January-July 2013, we had an increase of exports of 9.9%, and the level estimated for this year was reached and even exceeded (9.5%). The relatively low base from the second half of 2012 would allow the maintaining of this level until the end of this year, but there are certain risks in this regard: the embargoes imposed in September by the Russian Federation for wines and fruits imported from the Republic of Moldova, and also the difficult recovery of demand from Western partners for foreign products Q. I 11 Q. II 11 Q. III 11Q. IV 11 Q. I 12 Q. II 12 Q. III 12Q. IV 12 Q. I 13 Value index Unit Value index Volume index Figure 4.7. Quarterly dynamics of exports: value, physical volume and unit value indexes, % Source: Based on the data of the National Bureau of Statistics. Geographically, exports are dominated by the two large markets: the European Union (45.7%) and CIS (40.5%), but the weight of these markets slightly changed: -3.1% and 0.6%, in favor of the group of other states. Predominantly, following the acceleration of exports to Turkey (waste and residues from cast iron, sunflower seeds, clothing, containers, wheat etc.) and other states New Zealand (sunflower seeds and wheat), Georgia (alcoholic beverages, containers, medicine etc.), the group of other countries had a higher weight in Moldovan exports (+3.7%) of 13.8%. Under the influence of these evolutions there were some modifications also in the rankings of the first five export markets. Great Britain was replaced by Turkey with a weight of 7.7%, higher than Italy and Ukraine. At the same time, the position of the first two export markets was slightly 55
56 consolidated with 45.5%, 0.3% more than the similar period of last year. The trend was mainly determined by the dynamics of exports in Romania, which compared to last year continued to increase, despite the decrease of demand for import products compared to the similar period of last year. Although with an insignificant contribution to the increase of the total volume of exports, given the very low delivered volumes, the most dynamic five markets in this period were: Mexico (other items from plastic materials), Indonesia (transportation items or packaging items from plastic materials), South Korea (wine, other aerial articles, etc.), Vietnam (medicines), Congo (diodes, transistors, other similar devices with semiconductors, pneumatic tires, industrial oils), etc. A negative impact on the increase of exports was the decrease of deliveries on uncertain markets, especially Italy (-35.8% sunflower seed oils (-) 37 million USD, knit and non-knit clothing items and accessories, medicine (-) 465 thousand USD, grape wine (-) 47 thousand USD), Iraq ( -59,6%; other peel fruits, fresh or dry (-) 11,2 million USD); Kazakhstan (-33%; grape wine and must (-) 831 thousand USD, other fermented beverages (-) 728,7 thousand USD, natural honey (-) 73 thousand USD, beef and horse meat (-) 60 thousand USD, various fresh fruits and vegetables, for example tomatoes, cucumbers, citrus fruits etc., other food products, etc.) Overall, the decrease of deliveries to these destinations caused a decrease of exports by 59.5 million USD, and the degree of influence was -5.7%. Table 4.6. Geographical structure of exports in the first half-year, ,% Nominal value, million USD Growth rate,% Influence rate,% Weight in total,% H H H H H H H H Total Groups of countries CIS EU Other countries Top 5 export markets Russian Federation Romania Turkey Italy Ukraine Top five export markets which contributed the most to the increase of exports Turkey Russian Federation Romania Germany Greece Top 5 most dynamic markets Mexico Indonesia South Korea Vietnam Congo Source: Based on the data of the National Bureau of Statistics. 56
57 Regarding its structure by large groups of products, exports did not change significantly. The highest weight, which remained unmodified, compared to the similar period of last year, was that of manufactured products, followed by agricultural and food products, which decreased a little in favor of inedible raw materials and fuels, to a lesser degree. Manufactured products in the first half of the year amounted to 56.6% of the total exports, which on the background of a moderate increase did not cause changes in their weight. The effect of the relatively good dynamics of some products was attenuated by the negative trend of other goods, more or less traditional for Moldovan exports. The products with the best dynamics and which influenced the most the increase of manufactured product exports were: - items processed from metals, out of which 84.6% are exported to the CIS area pharmaceutical products, out of which million USD are medicines. 93% of the exported medicines were delivered on Eastern markets, out of which 77% in the Russian Federation, 5% in Ukraine 3.9% in Uzbekistan, 3.4% in Belarus. We would like to mention that in this interval the export of medicines increased significantly both on traditional and on Eastern markets, except for Ukraine, and in other countries outside the European Union: Georgia, Vietnam, and Turkey; - machinery and electric equipment and parts thereof, out the which fibers, cables and other electrical conductors, amounted to million USD and are 91.3% exported to the European Union; At the same time, there was a decrease of other lines of exported products, exported both in the European Union and in the CIS: - yarns and fabrics and textile items exported 73.8% to CIS countries; - clothing and footwear, out of which 66.5% and 82.4% exported to EU countries. The decrease of the demand on these markets influenced the export of this category of products; - various machinery and equipment specialized for specific industries, exported predominantly in CIS countries 60.37%, mostly to the Russian Federation. In January-June the export of these products was 8.3 million USD, 22.3% lower than the similar period of last year. Agricultural and food products in the first half of the year had a lower weight in the total value of exports, which was predominantly caused by the decrease of exports of vegetable and animal oils, and of animal products. At the same time, there was a slight increase of the weight of agricultural products of vegetable origin from 16.4 to 16.6%, and that of the food products from 16.3% to 18.3%. Geographically, exports of agricultural and food products increased by 41.5% to other countries outside CIS and EU, while in CIS the increase was moderate 2%, and in the EU there was a decrease of 12.7%. Exports of vegetable and animal oils, which had a relatively significant weight in previous years, in the first six months of this year decreased drastically. Approximately 98.6% 15.5 million USD of the exports of animal and vegetable oils are oriented towards Western markets, out of which 14.3 are sunflower seed oils. The exports of oils for this destination decreased by 73.3% on the background of the decrease of deliveries of sunflower seed oil to Italy by 37.2 million USD (from 40.6 to 3.4 million USD), to Romania by 3.9 mil. USD (from 5.5 to 1,6 million USD). In Portugal there was a decrease to 0 from 2.2 million USD in the similar period of last year, and in other countries. Exports of sunflower oil increased to Greece by 7.8 million USD, but the increase was too small to compensate the losses caused by the decrease of exports to other destinations. These trends could be explained by the still weak recovery of the main export markets of this product, and also by the modest performance of the oil industry in the analyzed period. In January-June 2013, the industrial production of oils and vegetable and animal fats decreased compared to the similar period of last year by 90.7%. We would like to mention that last year we had an increase of 8% of the sunflower areas, and the global crop decreased by 31%. 57
58 At the same time, this did not hinder the increase of raw sunflower seed exports, which was one of the products with the greatest contribution to the increase of the exports of vegetable products, and overall. The volume of sunflower seeds exported in this period increased by 52.6 thousand tons, to thousand tons, with a value of 76.9 million USD (39.2% of the global production of sunflower last year). These were predominantly exported to Turkey (40%), Ukraine (20%), New Zealand (16%) and Great Britain H I 2011 H I 2012 H I 2013 Sunflower seeds Sunflower oils Figure 4.8. Export of sunflower seeds in natural and processed form, thousand tons Source: Based on the data of the National Bureau of Statistics. A good indicator is the export of agricultural products under processed form, a significant increase in this regard being recorded for: - Exports of fruit juices were 26.8 million USD, 3.6 times higher than the similar period of last year. The main sale market of Moldovan juices is represented by EU countries, but after a decrease of more than 5 times in the first half year, especially in Germany and Poland, their share increased from 58.3% in the first half year of 2012 to 90% this year. At the same time, the exports to Customs Union Russia Kazakhstan Belarus decreased from 21.7% to 3.7%. - Exports of grape wine increased to all three main destinations: CIS 20.2%, EU 43.9% and other countries 5.6%. We would like to mention that this year the exports of wines to the latter group increased much more modestly compared to the increase of the first half year of 2012, especially following the reduction of the demand of China for this product. In this context, we would like to mention that with the increase of fruit juices there was a decrease of the deliveries of fresh fruits, and peel fruit exports decreased to Iraq, especially nuts, grapes and other fruits in fresh form to the Russian Federation. Besides the aforementioned products, although they have a lower weight in the exports, in the first half year the deliveries of metalliferous ores and metal waste to Turkey, and fuel, predominantly black oil and well gas, to Bulgaria, significantly increased compared to the similar period of last year, by 5.2 million USD and 2.1 million USD. By categories of products, the products which influenced the increase of exports the most were: oleaginous seeds and fruits, alcoholic beverages, without alcohol and vinegar, cast iron, iron and steel, various items from common metals, electric machines, devices and equipment and parts thereof, products from vegetables, fruits, pharmaceutical products. On the other hand, the decrease of their dynamics was predominantly caused by the decrease of: fats and oils of animal or vegetable origin, edible fruits and nuts; residues and waste from the food industry, fodder for animals, footwear, clothing items and accessories, etc. 58
59 Table 4.7. Structure of exports by groups of products, % Nominal value, H1 2013, million USD Structure,% H H Growth rate H H Influence degree,% H H Total Agricultural and food products Alcoholic and non-alcoholic beverages Seeds and oleaginous fruits Edible fruits and nuts Oils Fuels Inedible gross materials Manufactured goods Clothing and accessories Electrical machinery and devices and parts thereof Furniture and parts thereof Pharmaceutical products Items processed from metals Yarns, fabrics, textile items Source: Based on the data of the National Bureau of Statistics. In this context, we would like to mention that some of the trends of exports characterize the development of Moldovan exports based on products with a relatively low added value: reexports, products manufactured based on lohn manufacture systems, increase of the weight of agricultural unprocessed products based on their delivery in processed form. These represent long-term threats, including a strong dependence on external partners. Imports Unlike exports, imports seem to have a much more stable evolution and go through a recovery phase, which is gradual but definite. In this context, the international context is favorable, given that developed countries show an invigoration of exports and the degree of diversification of imports which make it less vulnerable to various shocks. The available data for the first quarter indicate an increase of imports stimulated predominantly by the increase of the physically imported volume. Thus, after a 3.2% increase in the first quarter of 2013 and a 7.5% increase in the second quarter, for the first half of the year imports amounted to million USD or 5.4% more compared to the similar period of The increase trends from the second half could be influenced, on one hand, by the decreasing dynamics of world prices both for energy and for non-energy products, and by the fragility of external demand for the products which are subject to re-exports. The forecasts for the growth of the Russian economy in 2013 were reduced, and approximately 60% of Moldovan exports to this destination were re-exports. In the first half of the year, the increase of imports was predominantly influenced by deliveries from EU and the group of other countries. At the same time, imports from CIS increased at a moderate rate of 1.5%. Following these trends, the weight of CIS countries in the total imports decreased, and the share of the group of other countries increased. 59
60 Q. I 11 Q. II 11 Q. III 11 Q. IV 11 Q. I 12 Q. II 12 Q. III 12 Q. IV 12 Q. I 13 Value index Unit Value index Volume index Figure 4.9. Quarterly dynamics of imports: value, physical volume and unit value indexes, % Source: Based on the data of the National Bureau of Statistics. Table 4.8. Geographical structure of imports in the first half-year, , % Nominal value, Weight in Growth rate,% Influence rate,% million USD total,% H H H H H H H H Total Groups of countries CIS EU Other countries Top 5 countries by origin of imports Russian Federation Romania Turkey Italy Ukraine Top five export markets which contributed the most to the increase of imports Romania China Ukraine Austria Bulgaria Top 5 most dynamic markets Tajikistan Saudi Arabia Malta Mexico Hong Kong, Special Administrative Region of China Source: Based on the data of the National Bureau of Statistics. The greatest contribution on the increase of imports was that of the increase of deliveries from Romania, China, Ukraine, Austria and Bulgaria, which led to an increase of 5.8%. However, there 60
61 were also good increases of the imports from Bulgaria (+36%), Japan (+28%), Finland (+24%) etc. A high dynamics was reported also for imports from other, less traditional, markets: Saudi Arabia, Malta, Mexico (frozen fish, bananas, wine distillates), Hong Kong (telephones, sound recording media), etc., but the very low volumes did not significantly influence the total value of imports. Contrary to these trends, a descending trend was that of the imports from the Russian Federation and several European countries: Germany, Italy, Poland, UK, the Netherlands, Spain, Greece, Israel, etc. Table 4.9. Structure of imports by groups of products, % Nominal value Influence Structure, % Growth rate, % in the first half degree, % year of 2013, thousand USD H H H H H H Total Agricultural and food products Inedible gross products Fuels Manufactured goods Source: Based on the data of the National Bureau of Statistics. Like in the case of exports, given the high weight of manufactured products in the total imports, they contributed the most to the increase of imports. At the same time, the low growth rate maintained the share of this group of products unchanged. Imports of various machines and electrical equipment and parts thereof and clothing for processing on the territory of the Republic of Moldova and subsequently for export; imports of medicinal products, some of which are re-exported, also increased. At the same time, there was a reduction of the imports of yarns, fabrics and textile items, road vehicles, prefabricated constructions, specialized machines and equipment for specific industries, etc. There were no changes in the weight of inedible unprocessed products, despite a 10.3% increase, following the increase of the purchases of raw materials of vegetable and animal origin, essential oils, chemical fertilizers. Given that the imports of fuels increased at a moderate rate of 0.8%, which conditioned the reduction of its weight in the total imports by 1.1%, and the more or less modest increase of manufactured products and inedible raw materials, the imports of food products increased by 13.2%, as they were predominantly influenced by the dynamics of the purchases of sugar and sugar-based products, fruits and vegetables, beverages, dairy products and bird eggs, oils and fats of animal and vegetable origin, oleaginous seeds and fruits, etc. Evolution of the foreign trade of the region on the left side of the Dniester In January-August of this year, the foreign trade of the region on the left side of the Dniester was million USD, 17.4% lower than the similar period of last year. There were significant decreases of both imports and exports, which caused a decrease of the trade balance by 6.4%. In the analyzed period it was million USD. In January-August this year exports were million USD, namely 73.4% of the value recorded in the corresponding period of last year. The evolution of exports started to mark negative rates from March to August. 61
62 250, , , ,000 50, , ,000 Jan Feb Mar Apr May 2012 Jun Jul Aug Sep Oct Nov Dec Jan Feb Mar Apr May 2013 Jun Jul Aug ,000 Exports Imports Net exports of goods Figure Dynamics of the foreign trade of the region on the left side of the Dniester, thousand USD Source: Drafted based on the data of the Customs State Committee of the region on the left side of the Dniester. The negative evolution of exports in this period was caused by the strong decrease of deliveries on the main export markets the Republic of Moldova (-13.5%), the Russian Federation (-29.2%), Ukraine (-45%), Romania (-73.6%). We would like to mention that the exports of the region on the left side of the Dniester are concentrated on 4 main markets: the Republic of Moldova, the Russian Federation, Italy and Ukraine, which make up 78.8% of the total external deliveries. Table Structure and dynamics of exports and imports by geographical regions/origins in January-August 2013 compared to the similar period, % Export Import Country Structure, % Growth rate, % Influence degree, % Country Structure, % Growth rate, % Influence degree, % Total Total Republic of Russian Moldova Federation Russian Ukraine Federation Italy Belarus Ukraine Germany Germany Republic of Moldova Romania Italy France Poland Serbia Uzbekistan Slovakia China Poland Latvia Source: Drafted based on the data of the Customs State Committee of the region on the left side of the Dniester. The highest weight in exports was that of fuels, of 27%. Following the decrease of the exports for this product by 32.7%, it influenced the decrease of exports by -9.7%. A negative influence was also the decrease of exports by 77.6%. At the same time, the export of materials and textile products maintained its positive trend. 62
63 Table Structure and dynamics of exports and imports by groups of products in January-August 2013 compared to the similar period, % Export Import Product Structure Growth rate Influence degree Country Structure Growth rate Influence degree Total Total Fuels Fuels Agricultural and Items of the machine food products building industry Footwear Agricultural and food products Textile items Chemical products Metals and metal Metals and metal items items Textile materials Textile products Items of the Pharmaceutical machine building products industry Mineral products Clothing Wood and cellulose items Leather, wool and products made therefrom Chemical products Ceramic items Source: Drafted based on the data of the Customs State Committee of the region on the left side of the Dniester. Imports, in the first 8 months of the year, amounted to million USD, 13.9% less than the similar period of last year. We would like to mention that while 42% of the exports of this region are oriented towards the Republic of Moldova, the same percentage of imports come from the Russian Federation. Actually, 67.2% of imports come from 3 countries from the CIS area the Russian Federation, Ukraine and Belarus. At the same time, the purchases from the Republic of Moldova represented only 3.5%. The evolutions of the imports of the Republic of Moldova and the Russian Federation influenced the most the decrease of the imports of the region on the left side of the Dniester. The same as in exports, fuels, which have the highest weight in imports, also had the highest negative impact on them. The import of metals also decreased significantly. Trends and policies in the main countries that are economic partners of the Republic of Moldova Despite an improvement of the international economic and financial conditions, the world economy continues to extend at a slow rate in the first half of From the beginning of the year, the estimates of the International Monetary Fund for 2013 were reduced twice by 0.2% in April and July. In the first half of the year, following the trends of the last year, many emerging countries manifested slowdown signs, and were affected by the external demand which is still weak, the decrease of the prices of basic products, the temperate increase of the inflow of external funding, etc. 63
64 Table Increase of world production, , annual percentage variation GDP growth, % Modification from the estimates of April Worldwide Developed countries USA Japan EU Emerging and developing economies China India Brazil CIS Russian Federation Source: Drafted in virtue of IMF data 1. Table Trends in the international goods trade (%, compared to the similar period of last year) Export Import Q3 Q4 Q1 Q2 Q3 Q4 Q1 Q Worldwide North America USA Central and South America Europe Turkey EU (27) Germany Italy Romania Intra EU(27) Extra EU(27) CIS Russian Federation Ukraine Africa Middle East Asia China India Japan Korea Singapore Source: Calculations based on the data provided by the commercial banks. 1 World economic outlook update: Growing pains. IMF: July 2013 PRESS RELEASES ( ; 2 Algeria, Egypt, Kenya, Mauritius, Morocco, Nigeria, South Africa, Tanzania, Tunisia 3 Bahrain, Iran, Israel, Jordan, Kuweit, Lebanon, Saudi Arabia 64
65 At the same time, the recent trends of the developed economies allow us to be optimistic regarding the evolution from the second half of this year. More regions may record moderate growth, given the gradual recovery of demand and the increase of the propensity for investments, stimulating production and the decrease of the pressure on the labor market. At the same time, the increase is still very fragile, and their external demand is recovered very slowly. According to the estimates of WTO in September, this year foreign trade will have a more moderate evolution than shown by previous forecasts, as a volume increase of 2.5% is estimated, compared to the 3.3% level estimated in April. The highest risk comes from the difficult recovery of demand of developed economies for import products and a modest evolution of exports both from developed and developing countries 1. According to the IMF data, given the very fragile recovery of supply, international prices for commodities decreased in December June 2013 by 2.0%. (compared to December) 2. The relatively good crop of this year conditioned a decrease of the prices of food products by 3% which are estimated to decrease also in the second half of the year. Metal prices decreased as well by 12%. An important factor in this regard was considered the decrease of economic growth in China, which will influence its investments in infrastructure projects. Given the relatively low demand the prices of energy products decreased by 2%. At the same time, the production risks generated by the uncertain situation from the oil manufacturing countries caused an increase of prices for this product, which started in the 2nd quarter Jan Feb Mar Apr May 2012 Jun Jul Aug Sep Oct Nov Dec Jan Feb Mar Apr May 2013 Jun Jul Aug All products Food and drinks Agricultural raw materials Metals Energy Figure Evolution of world prices, price indexes 2005=100 Source: Drafted in virtue of IMF data. USA Despite the process of budget consolidation and the external evolutions, the USA economy increased in the first half of this year, but the rate was modest compared to the similar period of last year. 1 WTO sees gradual recovery in coming months despite cut in trade forecasts. WTO: September 2013 PRESS RELEASES ( 2 Commodity Market Monthly. IMF. July 12, 2013 ( 65
66 According to the OECD data, the growth rate of GDP volume (measured based on the non-season data series) accelerated in the 2nd quarter compared to the previous period, predominantly sustained by the increase of exports and non-residential investments, and also a slight positive modification of the gross formation of capital and private consumption despite a decrease of public expenditure. The temperate recovery of consumption was shown by the decrease of imports and also by a moderate increase of consumer price indexes. At the same time, the situation on the labor market indicates an invigoration of the business environment. Country/In dicator Table Development trends of the main economic partners of the Republic of Moldova (% of the same period of the previous year) GDP CPI Export Import Unemploymen t rate Q1 Q2 Q1 Q2 Q1 Q2 Q1 Q2 Q1 Q2 USA EU Romania Turkey Russia Ukraine Source: National statistics of USA, Romania, CIS, Russian Federation, Ukraine, Eurostat, OECD, OMC. Note: The unemployment rate in the 2nd quarter represents the value at the end of the 2nd quarter for the aggregate period from the beginning of the year; the increase of GDP in USA is indicated based on seasonally adjusted data. European Union The recession continued in EU also in the first half of this year. At the same time, the evolutions from the last quarter indicate a gradual stabilization. Although both in the 1st quarter and in the 2nd quarter the GDP of EU continued to decrease compared to the similar periods of 2012, in the 2nd quarter there was a slight increase compared to the previous period. Internal demand recovers very slowly, and delays internal production capabilities. Investments decrease, and the unemployment rate increased and stabilized in the first half of the year, 0.9% and 0.7% more than in the 1st and 2nd quarters of the previous year. At the same time, the effects of the decrease of internal demands for internal production were partially compensated by the external demand of other states and the decrease of imports. Geographically, while in some countries the decline from the first two quarters was significant, under 1% Cyprus, Greece, Italy, Portugal, the Netherlands, other countries proved relatively immune, and the most relevant example in this regard is that of the Baltic countries. At the same time, France resumed its positive trend in the 2nd quarter, compared to the similar period of 2012, and others such Poland and UK accelerated their growth rates. The unemployment rate in the Euro area was 12.1% in the 2nd quarter, while in EU28 it was 11.0%. Among the EU member states the lowest unemployment rates were recorded in Austria (4.8%), Germany (5.3%) and Luxembourg (5.7%), and the highest were in Greece (27.6%) and Spain (26.3%). Romania Romania is one of the EU economies which seem to have overcome the most difficult period caused by the crisis from the EU area. In the first quarter of this year, the GDP of Romania increased compared to the similar period of last year by 2.2%, an evolution determined mostly by external demand, which stimulated the processing industry. The business environment is still uncertain, a fact proven by the low demand for imports and an increasing unemployment rate. 66
67 After a decrease of the unemployment rate from 7.3% at the beginning of the year to 6.7% at the end of 2012, this year it increased again to 7.4% in the 2nd quarter. There is also a continuation of the trend of decreasing credit portfolios and the fragile situation of public finance, and the budget expenses increased faster than revenues. The volume of GDP in the 2nd quarter of 2013 was 0.5% higher than in the 1st quarter of 2013 (seasonally adjusted). Compared to the same quarter of 2012, GDP increased by 1.5% (gross) and by 1.4% (seasonally adjusted). Thus, in the first six months of GDP increased compared to the 1st quarter of 2012 by 1.8% both gross and as a seasonally adjusted series. Russian Federation By continuing the trend from the end of 2011, the increase of the Russian economy continued to decrease also this year. GDP increased by 1.6% and 1.2% in the first two quarters of the year compared to the similar periods of We would like to mention that in the same quarters of last year the increase was 4.8% and 4.3%. The business environment in the Russian economy in the first half of 2013 was especially caused by the decrease of external demand for Russian products, which immediately affected the production sector. The problem from this sector and the decrease of government expenses also conditioned the decrease of internal demand. The uncertain situation negatively influenced investments in the fixed capital, which decreased in the 2nd quarter of 2013 by 2.5% compared to the same period of 2012, and the gross formation of capital by 9.9%. The consumption inflation from January-June 2013 was 103.5% compared to 103.2% last year, as a yearly value in June 2013 the inflation reached 106.9% compared to 104.3% in the respective period of 2012, and the prices of food products increased at devastating rates. The indexation of the adjusted fees to the communal services in the second half of 2013 will condition, the same as in 2012, the decrease of the turnover in retail. Nevertheless, the unemployment rate was in the 2nd quarter on a relatively low level of 5.4%, a decrease of 0.4% compared to the 1st quarter, and an increase of 0.1% compared to the 1st quarter of last year. Ukraine In 2013 the economy of Ukraine entered recession, and the decrease of GDP continued in the last two quarters of last year. The lack of incentives for resuming the growth rates of the GDP of the country can be explained by the long process of recession in the Euro area, and the attenuation of the economic growth rates in the Russian Federation. Following the action of all unfavorable factors, most international organizations decreased their GDP growth estimates for Ukraine for Thus, in the first two quarters, the volume of GDP decreased by 1.1% and 1.3% compared to the similar periods of last year. 67
68 Chapter V BUSINESS ENVIRONMENT Business activities. Number of registered entities: classification by organizational-legal forms. According to the data of the State Chamber of Registration, as of September 01, 2013, the State Register contained information on 163,562 legal entities and individual entrepreneurs. On September 01, 2013, compared to September 01, 2012, the number of entities from the Register increased by 963 units, or 0.6%. On September 01, 2013, compared to the same period of last year, there were no essential modifications in the weight of the companies registered in the Register by the organizationallegal form. The majority weight is represented by limited liability companies (51%), a 2 p.p. increase, and individual enterprises (40%), a 1 p.p. decrease compared to the similar period of last year. The weight of joint-stock companies is 3%. The weight of state and municipal entities in the State Register is 1%. cooperative 2% state and municipal companies 1% non-commercial organizations 1% others 2% joint-stock companies 3% limited liability companies 51% individual enterprises 40% Figure 5.1. Companies registered by organizational-legal form, on September 1, 2013 Source: According to the data of the State Chamber of Registration. Dynamics of entities registered and deregistered in the 1st half year of The number of entities registered at the State Chamber of Registration insignificantly increased in the 2nd quarter of 2013 compared to the same period of last year, and the index is 100.6%. In the first half of 2013, the number of companies registered by the State Chamber of Registration increased compared to the similar period of last year, and the index was 101.5%. Thus, according to the State Chamber of Registration, 3,306 new companies were registered in the State Register between January and June The number of entities deregistered at the State Chamber of Registration significantly decreased in the 2nd quarter of 2013 compared to the same period of last year, and the index is 87.9%. In the 1st half year of 2013, the number of enterprises that were deregistered was 1,368 units or 15.1% less than in the same period of last year. 68
69 Jan. Feb. Mar. Apr. May Jun Figure 5.2. Evolution of the number of entities deregistered in the 1st half year of Source: According to the data of the State Chamber of Registration Jan. Feb. Mar. Apr. May Jun Figure 5.3. Evolution of the number of entities deregistered in the 1st half year of Source: According to the data of the State Chamber of Registration The calculated indicator, which characterizes the net increase/decrease of the number of entities (registered minus deregistered), shows that in the 1st half year of there was a net increase of the number of entities, as the index was 117.9%. Table 5.1. Dynamics of entities registered and deregistered in the 1st half year of Net increase / decrease Years/month Number of units (registered enterprises minus deregistered enterprises) Index, % Semester I ,644 Semester I 2013, including: 1, January February March April May June Source: Authors' calculations according to the data of the State Chamber of Registration. 69
70 Business development indicators in 2012 According to the data of NBS, in there was an insignificant but constant increase of the number of companies: from 48.5 to 50.7 thousand companies, and the index was 104.4%. The average number of employees, according to the data of NBS, in , recorded, unlike previous years, an increasing trend (the index was 101.9%). Table 5.2. Dynamics of the main indicators of company activities in Indicators Number of companies, thousands of units Indexes,% Average number of employees, thousands of persons Indexes,% Revenues from sales, million MDL 177, , ,759 Indexes,% Source: Authors' calculations according to the data of the National Bureau of Statistics. In the SME sector, in , there was also an increasing trend of the number of employees (the index was 102.0%). On the contrary, the average number of employees of medium companies in the given period decreased (the index was 96.1%). In this period, there was a slight decrease in the average number of employees from the SME sector in the following sectors of economy (4.3% in the agricultural sector compared to 2011, 1.3% in the processing industry, 3.8% in electricity, gases, water, etc.). On the other hand, there was a significant increase in the average number of employees in the SMEs from the following sectors: hotels and restaurants (a 17.1% increase compared to 2011), health and welfare (a 15.5% increase), constructions (a 3.3% increase). The situation of 2012 is illustrated in the graphical representation (Fig. 5.4) which shows a series of significant trends and connections in the structure of the number of employees in the SME sector by size classes and the main activity sectors. 100% 80% 60% 40% 20% 0% agriculture industry trade constructions micro small medium Figure 5.4. Structure of the number of employees in the SME sector by size classes and the main activity sectors in 2012(%) Source: According to the National Bureau of Statistics. 70
71 Thus, it is shown that: - the specific weight of trade employees is negatively correlated with the size class, namely the weight of those who operate in this sector increases as the size of the companies decreases, reaching 45% for micro companies; - the trend is opposite regarding the number of employees from industry, which significantly increases as the size of the companies increases, namely from 19.6% for micro companies to 42.3% for medium companies; - in the agricultural sector, the same as in the industrial sector, the number of employees increases as the size of the companies increases. The average number of employees in the SME sector is 6.1 persons per company, and for micro companies, the given indicator is 2.4. Size Table 5.3. Distribution of the number of active companies and the employment rate by size, 2012 Number of companies Weight of companies (%) Number of employees Weight of employees (%) Average size of the company Micro 38, , Small 9, , Medium 1, , SME 49, , Large 1, , Total 50, , Source: Authors' calculations according to the data of the National Bureau of Statistics. In 2012, the global turnover was distributed by the size class of companies as follows: 65.5% in large companies, 11.8% in medium companies, 18.1% in small companies and 4.6% in micro companies. In 2012 there was an insignificant increase of revenues in the sectors of the economy (the turnover increased by 2.0% compared to 2011). In , the highest increases of sales revenues were recorded in the following sectors: hotels and restaurants (14.2%), electricity, heating, gases and water (11.8%), processing industry (6.6%). There were decreases of the turnover in in agriculture (12.6%), constructions (7.7%), transportation and communications (2.3%). The SME sector represents 97.6% of all the companies, has approximately 57.7% of employees and generates 34.5% of the revenues of the formal sector in According to the data of NBS for 2012, 52.7% of SMEs reported losses, 5.9 p.p. more than in the previous year. Sector-wise, the highest weight of SMEs which incurred losses is in industry (57.6%), hotels and restaurants (66.6%) and trade (55.9%). According to the information from fig. 5.6, regarding the structure of the turnover by main activity sectors, in 2012 the participation of companies from various sectors is distributed in order of importance as follows: - trade companies contributed the most to the turnover (47%), a 0.4 p.p. decrease compared to the previous year; - industry companies contributed with 27% to the turnover in 2012, a 1.6 p.p. increase compared to the previous year. 71
72 % large medium small micro number of enterprises average number of employees Figure 5.5. Structure of revenues from sales, average number of employees and number of companies by the size of the companies, 2012 Source: According to the National Bureau of Statistics. constructions 4% others 10% agriculture 3% industry 27% trade 47% transport and communications 9% Figure 5.6. Distribution of the turnover of companies by economic activity sectors in 2012 (%) Source: According to the National Bureau of Statistics. According to the data of the National Bureau of Statistics, in January-June 2013 there was only a 2.4% increase (in comparable prices) of the revenues from sales for the companies operating mainly in retail trade 1, compared to the same period of In the first half year of 2013, an increase of the turnover by the companies mainly operating in retail was recorded only in the Northern Region (a 2.7% increase), Chişinău (2.4%) and the Central region (6.8%) compared to the similar period of According to NBS, in January-June 2013 there was a 4.8% increase (in current prices) of the turnover of the companies operating mainly in wholesale 2, compared to the same period of 1 Entities whose main scope of activity was retail trade, with 20 or more employees, comprised in the monthly statistical research on short term indexes (SERV TS) 2 Entities mainly operating in wholesale, with at least 20 employees, comprised in the monthly statistical research on short-term indicators (SERV TS) 72
73 2012. Only the companies from the Central Region and Chisinau recorded an increase of the turnover in wholesale (15.3% in the Central region and 7.4% in Chisinau). Companies from the Northern, Southern and ATU Gagauzia regions recorded significant turnover decreases compared to January-June In January-June 2013, there was a 9.8% increase of the turnover of the companies mainly operating in market services provided to the population 1 (in comparable prices) compared to the similar period of last year. In this period, only companies from the Northern region recorded decreases of the turnover compared to the 1st half year of The value index of the turnover of the companies mainly operating in market services provided especially to companies 2 increased by 4.5% (in current prices) in January-June 2013 compared to the 1st half year of A higher increase of the turnover was recorded by the companies of the Southern Region (11.7%) Turnover in retail trade Turnover in wholesale trade Turnover with market services rendered to public Turnover with market services rendered to business mun. Chişinău North Center South ATU Gagauzia Figure 5.7. Evolution of the turnover for trade and services by development regions in the 1st half year of 2013 in% compared to the 1st half year of 2012 Source: According to the National Bureau of Statistics. Business development indicators in the region left of the Dniester In January-March 2013, in the region left of the Dniester, 49.4% of the organizations and companies obtained net profits, respectively 46.8% incurred losses (except for small companies, banks, budget and insurance organizations). Out of the organizations which recorded net profit in this period, the highest weight, the same as in the previous year, was recorded by trade and public food services organizations (64.6%) and from agriculture (56.7%). Out of the organizations which recorded net losses in January-March 2013, the highest weight was recorded by companies from communications (77.8%), constructions (68.8%) and industry (53.2%). Value-wise, industry entities incurred higher net losses (83.8% net losses of the total). 1 Entities mainly operating in market services provided to the population, with at least 20 employees, comprised in the monthly statistical research on short-term indicators (SERV TS) 2 The entities mainly operating in market services provided to companies, with at least 20 employees, comprised in the monthly statistical research on short-term indicators (SERV TS) 73
74 Table 5.4. Data on the net profit (loss) of the organizations in the region left of the Dniester by types of activity, in January-March 2013 Types of activity Number of organization which reported net profits % of the total number Number of organization which incurred net losses % of the total number Net profit, thousand RUB Net loss, thousand RUB Total , ,911 including: industry , ,925 agriculture ,432 8,526 transportation ,793 7,865 communications , constructions ,611 6,176 public food trade and services housing administration and communal services ,367 5, ,752 7,371 other branches ,701 22,449 Source: Социально-Экономическое Развитие Приднестровской Молдавской Республики, январьиюнь
75 Chapter VI SOCIAL SECTOR Demographic situation. In January-June 2013, the number of live births in the country was 17,783 pers., an 6.4% decrease compared to the same period of last year. The birth rate was 10.1 born alive for every 1,000 people. The number of deceased was 19,936 persons. The general death rate decreased by 4.4% compared to last year. The death rate was 11.3 deceased for every 1,000 people. The natural decrease rate was 2,153 persons, or 1.2 persons for every 1,000 people, compared to 1.1 in the first half year of The number of infants deceased in this period decreased by 7 persons, as the infant mortality rate was 10.1 deceased under 1 year for every 1,000 live births. The structure of the death rate by death cause classes shows that most deaths (60.5%) were caused by diseases of the circulatory apparatus, malign tumors represent 13.8%, diseases of the digestive apparatus 8.6%, accidents, intoxications and traumas 6.9%, diseases of the respiratory apparatus 4.9%, other classes 5.3%. Table 6.1. Evolution of demographic processes by development region in January-June 2013, thousand persons Live births, persons Deceased, persons Infant deceased, persons Populati on growth rate Number of marriages Number of divorces Chisinau North Center South U.T.A. Găgăuzia Source: According to the National Bureau of Statistics. The total number of marriages in the republic was 9,014, an 3.6% increase compared to the similar period of last year. The marriage rate was 5.1 marriages for every 1,000 people. The total number of divorces in the country was 5,506, an 1.3% increase compared to the similar period of last year. The divorce rate was 3.1 divorces for every 1,000 people. Box 6.1. Average life expectancy in the Republic of Moldova in 2012 According to the research of the National Bureau of Statistics, starting with 2000 there was a continuous increase of life expectancy, except for 2005, when there was a high general and infantile mortality. In 2012, this indicator recorded the maximum value of the given period 71.1 years, 67.2 in men and 75.0 in women. The significant increase of life expectancy was influenced by the decrease of general mortality to 11.1 deceased for 1,000 people, and that of infantile mortality which was 9.8 deceased of under 1 year for 1,000 live births. Women live longer than men by 7.8 years. This difference is caused by the high level of premature mortality of men. Due to the different level of mortality, in 2012 the average life expectancy of the people from the urban environment was higher than that from the rural environment, namely 3.52 years for men and 4.54 years for women. 75
76 Migration of population. In January-June 2013, according to the Ministry of Internal Affairs, 1,171 foreign citizens and 153 repatriates received residence permits (permanent and temporary). The structure of immigrants by the goal of arrival was dominated by family 42.9%, work 38.3%, education 5.7%, other causes 13.1%. By country of emigration, foreign citizens are immigrants from: Romania 231 persons, Ukraine 179 persons, Turkey 173 persons, Russian Federation 139 persons, Italy 60 persons, Syria 41 persons, USA 27 persons, Israel 24 persons, Iraq 20 persons, Germany 19 persons, Azerbaijan 17 persons, Austria 16 persons, Georgia 15 persons, Greece 14 persons, other countries 196 persons. Other causes 13.1% Work immigration 38.3% Family immigration 42.9% Studies immigration 5.7% Fig Distribution of foreign citizens by arrival purpose in RM in January-June 2013, % Source: According to the data of the Ministry of Internal Affairs. Labor market. According to the data of the National Bureau of Statistics, in the 2nd quarter of 2013 the economically active population of the Republic of Moldova was 1,288.4 thousand persons, 21.5 thousand or 1.0% more than in the 2nd quarter of The share of the employed population within the active population decreased by 0.2 p.p.: in the rural areas it decreased by 0.8 p.p., and in the urban areas it remained unchanged. There were no disparities by gender within the economically active population: the share of men was 51.8%, and that of women was 48.2%. Important disparities by areas: the share of economically active persons from the urban areas (45.0%) was lower compared to the active population from the rural areas (55.0%). The activity rate of the population aged 15 years and over was 43.1%, 0.6 p.p. higher than in the 2nd quarter of This indicator reached higher values among men 47.2%, compared to women 39.5%. The activity rates by area had the following values: 45.0% in urban areas and 41.7% in rural areas. In age category 15-29, this indicator was 31.4%, and in age category (the work age in the countries of the European Union according to the Eurostat methodology) 48.2%, 1.1% higher than the level of the 2nd quarter of The activity rate of the work-age population in the country was 51.0%. Employed population was 1,227.6 thousand persons, 1.5% more than the 2nd quarter of There were no disparities by gender: 48.7% women and 51.3% men. Disparities by areas: 44.2% in urban areas and 55.8% in rural areas. The employment rate of the population over the age of 15 was 41.1%, an increase of 0.6% compared to the second quarter of The occupancy rate of men was 44.5%, and that of women was 38.0%. In the distribution by residence area, it was 42.1% in the urban area and 40.3% in the rural area. The employment rate of the active 76
77 population (16-56/61 years old) was 48.4%, of the population aged %, and in age category this indicator was 28.9%. In the distribution by activities from the national economy we find that in the agricultural sector thousand persons are active (32.5% out of the total number of active persons). Compared to the 2nd quarter of 2012, the number of the active population in agriculture increased by 20.6 thousand, or 5.4%. In non-agricultural activities the number of active persons was thousand, 2.3 thousand or 0.3% lower compared to the 2nd quarter of The share of employed persons in industry was 11.7% and in constructions 5.3%. The number of active persons in industry decreased by 4.9%, and in constructions, it decreased by 5.8% compared to the previous year. 50.5% of the total employed persons worked in services. The distribution by ownership forms 74.0% of the population was active in units with private types of ownership, and 26.0% in units with public types of ownership. The structure of active population by professional statute shows that the number of employees was 65.2% of the total. In the informal sector there are 14.2% of the total active persons in the economy, and 32.7% had informal jobs. Out of the number of informally employed persons, employees are 20.7%, and 10.4% of total employees have informal jobs. The number of underemployed persons was 94.4 thousand, which represents 7.7% of all employed persons. The number of persons from this category increased by 16.9% compared to the 2nd quarter of The number of unemployed persons, estimated according to the methodology of the International Labor Office was 60.8 thousand, 3.2 thousand more than the 2nd quarter of Unemployment affected men more 60.9% from the total number of unemployed persons, and people from urban areas 61.1%. The unemployment rate on country level recorded the value of 4.7%, more than in the 2nd quarter of The unemployment rate for men was 5.6%, and for women it was 3.8%. Significant disparities were recorded between the unemployment rate from urban areas 6.4%, compared to rural areas 3.3%. Among youth aged 15-25, the unemployment rate was 13.3%, and in the age category this indicator was 8.0%. The inactive population over the age of 15 was 56.9% of the total population of the same age category, lower than the level of the second quarter of 2012 by 0.7 p.p., or 17 thousand persons. Occupationally discouraged persons were 17.4 thousand compared to 23.1 thousand in The number of persons declared by household units as having left to other countries looking for work was thousand persons compared to thousand persons in Two thirds of the number of people who left were men (67.1%), the same as persons who left from rural areas (70.4%). Household disposable income in the 2nd quarter of 2013 were in average 1,667.2 MDL per month, according to the data of the Household Budget Survey, 9.8% higher than in the 2nd quarter of In real terms, with the adjustment of the consumer price index (the consumer price index in the 2nd quarter compared to the 2nd quarter of 2012 was 105.2%), the revenues of the population increased by 4.4%. Salary payments represent the most important source of income, 43.7% of the total available income, practically on the same level as in the similar period of the previous year. In Q2 of 2013 social services contributed to the formation of household revenues by 18.8% or 0.2% less than in the same period of the previous year. Revenues from independent activities represent 16.3% of household revenues, including 10.0% revenues from individual agricultural activities, and 6.3% revenues from non-agricultural individual activities. Money transfers from abroad represents 16.4% from the total revenues, and their contribution is 0.8% higher than in the 2nd quarter of Depending on the residence areas, we find that the revenues of urban population were in average MDL or 1.4 times higher than those from rural areas. The main income source of 77
78 the population from the urban area is represented by salaries, with 59% of the total revenues (57.0% in Q2 of 2012) and social services 16.9% (15.7% in Q2 of 2012). The main income source of the population from rural areas is also represented by salaries (27.2%), but its contribution is practically half the contribution from urban areas. At the same time, the revenues obtained from individual agricultural activities were 19.7% of the total disposable revenues. The rural population compared to the urban one depends more on transfers from abroad, as their weight in revenues is 23.7% compared to 9.6% for the urban population. At the same time, a higher weight of social services is characteristic for the rural population, as their contribution is 20.9%, compared to 16.9% in the urban area. In the structure of disposable household income, monetary revenues are predominant 89.0%, while in-kind resources account for 11.0%. In absolute terms, the monetary revenues were 1,484.4 MDL a month in average per person, and that of in-kind revenues was MDL. Monetary revenues represent 95.8% of the revenues of the urban population, while for rural areas their contribution is 81.7%. Household consumer expenditure in Q2 of 2013 was 1,761.8 MDL per person, according to the date of the Household Budget Survey, 11.3% more than in Q2 of In real terms (by adjustment to the consumer price index), the population spent in average 5.8% more than in the 2nd quarter of The highest weight of expenses was for covering food consumption necessities 44.3%, 0.6% more than in Q2 of For household maintenance a person allocated in average 19.0% of the total consumption expenses (0.5% more than in Q2 of 2012), and for clothing and footwear 10.6%, 0.6% less. Other expenditures were as follows: transportation (4.9% compared to 4.5% in Q2 of 2012), health (4.7% compared to 4.8%), communications (4.3% compared to 4.5%), house fitting (3.2% compared to 3.3%), education 0.9% (the level of the previous year), etc. In average, the consumer expenditures of the urban population were 2,085.9 MDL per person per month, MDL or 1.4 times higher than in rural areas. In urban areas, in order to ensure the consumption of food products, the population allocated 42.2% of monthly consumer expenditures (40.6% in the 2nd quarter of 2012), and in rural areas 46.5% (47.2 in the 2nd quarter of 2012). The urban population spends more for household maintenance (20.7% compared to 17.2% in rural areas), transportation (5.6% compared to 4.2%) communications services (4.7% compared to 4.0%), hotels, coffee shops and restaurants (2.3% compared to 0.6%) and entertainment services (1.4% compared to 0.5%). In the structure of total consumer expenditures of the population, monetary expenditures are predominant 89.8%, over in-kind ones %. In urban households, in-kind expenses were 4.0% of the total consumption expenses, usually representing the consumption of food products received free of charge from outside the household (relatives, financial aid, etc.) In the case of rural households, in-kind expenses represented the consumption of food products from the auxiliary household, namely 16.7% of the total consumption expenses. Remuneration of labor. In June 2013, according to the data of the National Bureau of Statistics, the average gross nominal wage was 3,859.0 MDL, 1.4% less than in June 2012, and 2.7% more than in the previous month (May 2013). The index of the real salary earnings for June 2013 compared to June 2012 was 93.5% (calculated as the ratio between the index of the gross nominal salary earnings and the index of consumer prices). In the budget sector the average salary in June this year was 3,696.4 MDL (18.9% less than in June 2012). In the (real) economic sector the salary in June was 3,924.6 MDL (8.5% higher than June 2012). The decrease of the average monthly wage in the budget sector in June 2013 compared to June 2012 is explained by the fact that this year in education institutions, the amounts calculated for annual holidays are reflected separately for each holiday month, unlike last year, when the 78
79 respective payments were recorded in the month in which they were calculated (namely in June) This influenced the decrease of the growth rate of the wages in the entire economy, especially in the budget sector. Table 6.2. Average nominal gross salary in January-June 2013 by economic activities, MDL Economic activities January Total economy Agriculture, hunting and forestry Pisciculture Industry - total: Mining and quarrying Manufacturing industry Electricity and heat, natural gas and water supply Constructions Wholesale and retail trade Hotels and restaurants Transportation and communications Financial activities Real estate transactions Public administration Education Health and social work Other communal, social and personal service activities Source: According to the National Bureau of Statistics. Subsistence minimum. The increase of the subsistence minimum in the first half year of 2013 was in average 1,608.3 MDL a month for one person. Depending on environment and residence, there are significant differences, and the highest value of the subsistence minimum is for the population of large cities (Chişinău and Bălţi) 1,692.8 MDL or 2.9% more compared to other cities 1,644.5 MDL and 8.3% more compared to the rural areas 1,563.2 MDL. By categories of population, the maximum value of the subsistence minimum is that of the active population 1,700.3 MDL, especially men 1,838.5 MDL, compared to 1,553.0 MDL in case of women. The minimum subsistence level of children, in average, was MDL 1,533.9 per month, with a differentiation depending on children's age: from MDL for a child up to 1 year old to MDL 1,724.2 for a child aged Depending on their residence area, the subsistence minimum for children from large cities is 8.1% higher compared to the rural areas, and for children up to one year old this difference is 16.5%. The National Bureau of Statistics informs that starting from 2013, the subsistence minimum will be calculated according to the methodology revised and approved by the Joint Order published on September 20, 2013 in the Official Monitor no art "On the approval of the methodological guide regarding the calculation of the subsistence minimum" no. 147 of September 06, 2013 in virtue of the provisions of the Resolution of the Government of the February March April May June 79
80 Republic of Moldova no. 285 of April 30, The dissemination period for this indicator will be on a half-year basis. Social protection of the population. The number of pensioners registered by the social protection institutions as of July 01, 2013, according to the data of the Social Insurance national Fund, was thousand persons, or 10.5 thousand persons more compared to July 01, The average value of the monthly (indexed) pension was MDL 1,020.8, 6.6% higher than on July 01, Healthcare. The morbidity of the population from certain infectious diseases in January-June 2013, according to preliminary data of the Ministry of Health, is characterized by the increase of the number of diseases by acute respiratory infections ways with multiple localizations thousand cases compared to thousand cases in January-June At the same time, there were more cases of influenza 2.4 thousand cases compared to 0.2 thousand cases in January- June 2012, bacterial dysentery 111 cases compared to 74 cases in January-June 2012, but less cases of acute intestinal infections, chicken pox, epidemic parotiditis, etc. Most cases of morbidity by acute respiratory infections are in Balti 15.1 thousand cases or 10.1 thousand cases for every 100,000 people, Chişinău 56.7 thousand or 7.1 thousand cases for 100,000 people, Criuleni 4.9 thousand or 6.8 thousand cases for 100,000 people, Anenii Noi 4.6 thousand or 5.5 Cases for 100,000 people, etc mun. Balti mun. Chisinau Criuleni Anenii Noi Figure 6.2. Morbidity cases by acute respiratory infections in January-June 2013, thousand cases for 100,000 people Source: According to the National Bureau of Statistics. Every second case of acute respiratory infection with multiple locations is recorded in children. Most cases of diseases by these infections of children were in Chişinău 33.0 thousand cases, Bălţi 10.3 thousand, districts of Ialoveni 3.6 thousand, Ungheni and Străşeni, 3.3 thousand each, Criuleni 3.2 thousand, Sângerei 2.9 thousand, etc. In case of the morbidity caused by "socially determined" diseases, there is a decrease, especially for gonococcus infections and pediculosis. In January-June 2013, the number of HIV carriers was 54 pers., and there were 6 registered cases of AIDS. Crimes. In January-June 2013, according to the data of the Ministry of Internal Affairs, there were 18.1 thousand crimes, 7.4% more than in the same period of last year. In average, for 10 thousand people there are 51 crimes in this period. The highest level of crime was in Chişinău 85 crimes for 10,000 people, and Bălţi 64 crimes for 10,000 people. The lowest level of crime was in Râşcani district 22 crimes for 10,000 people. 80
81 In February-June 2013 there were 62.1% more crimes against families and minors, including cases of family violence 80.9%. At the same time, there were more crimes against the patrimony (16.1%), security and public order (13.5%) and sexual (5.9%). Thefts are predominant in the structure of crimes, with a weight of approximately 42% of the total crimes. In this period there were less economic crimes, and less crimes against public health and social living. Compared to the second quarter of 2012, there were more crimes involving firearms, explosives and grenades. The number of these crimes increased by 28%, and was 37 cases in January-June 2013, out of which 11 cases of intentional harming, 7 cases of hooliganism and robbery each, and 3 murders. Out of the total crimes, every fifth crime was committed by work-able, unemployed persons. The weight of crimes committed by minors or with their participation was 3.0%. In January-June 2013 there were 1,068 road accidents, or approximately 6 accidents every day. Because of road accidents, 105 persons lost their lives, including 7 children, and 1,268 persons were traumatized, including 221 children. In average, for 100 thousand people there are 30 road accidents. In January-June 2013, according to the data of the Service of Civil Protection and Exceptional Situations within the Ministry of Internal Affairs, there were 758 fires or 30.5% less compared to the 2nd quarter of As a result of these fires, 61 persons died, including 5 children, and the value of losses was 15.9 million MDL. Region left of the Dniester According to the data of the Statistical Service of Transnistria: Demographic situation. The calculated number of people as of July 01, 2013 was thousand persons. At the same time, the number of people in cities was thousand persons (69.1% of the population), and the number of people in the rural environment thousand persons (30.9%) The natural decrease of the population in January-June 2013 was 1,296 persons compared to January-June 2012, a 6.4% decrease. There were 2,255 live births, but the number of the deceased was 3,551 persons. Infantile mortality of children under one year, in January- June 2013, was 16 persons, compared to the same period of the previous year, a 23.8% decrease. The main causes of infantile mortality are: the state occurred in the perinatal period (7 cases), and congenital anomalies (3 cases). The migration decrease of population for January-June 2013 (considering internal and external migration) was 793 persons, compared to the similar period of last year, a 7.7% increase. In January-June 2013, 3,419 persons arrived in the region, namely 99.8% of the number of people arrived in January-June 2012, out of whom 684 children under 16, or 20% of the total number of arrivals. 4,212 people left or 101.2% of the people who left in January-June 2012, including children under persons or 15.5% of the total number of persons who left. Out of the total number of people who came in the region 47.2% are men (1,613 persons), while out of the people who left, 47.0% were men (1,980 persons) In January-June 2013, 2,295 people came and 3,155 people left urban areas, or compared to January-June % and 101.5%, respectively. In rural areas, 1,124 people came and 1,057 left (compared to the previous year % and 100.2%, respectively). The number of recorded marriages was 1,400, 3.2% more than in January-June The number of divorces was 963, 1.9% less than in January-June Labor market. On July 01, 2013, the employed population was thousand persons, 795 persons or 0.8% more than in January-June At the end of June 2013, the number of unemployed citizens registered with labor occupancy agencies was 4,253 and compared to the same period of the previous year, 29.4% less. Out of the total number of registered citizens 2,516 persons or 59.2% are women. Overall, in January-June 2013, the Transnistrian Employment Agency helped hire 1,080 persons. In January-June 2013 there were professional 81
82 consultation sessions with students: group consultations 193, with 3,289 persons, and individual consultations 1,015, with 997 persons, with the adult population: individual consultations 3,438, 3,317 persons for professional training, thousand rubles were spent, including for paying scholarships thousand rubles. For unemployment benefits, 9,498.9 thousand rubles were spent. The average value of the unemployment benefit in January- March 2013 was rubles. Remuneration of labor. In January-June 2013, the average monthly nominal salary calculated for one employee (except for employees from small enterprises) was 3,656 rubles or 111.9% compared to January-June 2012 (at the official exchange rate of the monetary authority left of the Dniester 329 USD or 112.3% compared to January-June 2012). In the analyzed period, the average monthly nominal salary calculated for one employee was higher than the average salary per region in the following economic branches: "Banks and credits" (7,967 rubles or 718 USD), "Electro- and radio- communications" (8,087 rubles or 729 USD), "Insurance" (5,670 rubles or 511 USD), "Industry" (4,711 rubles or 424 USD), "Sports, entertainment and tourism" (4,360 rubles or 393 USD), "Trade and public food services" (4,260 rubles or 384 USD), "General commercial activities" (4,169 rubles or 376 USD), "Constructions" (4,038 rubles or 364 USD), "Transportation" (3,818 rubles or 344 USD), "Real estate transactions" (3,745 rubles or 337 USD). At the same time, the average monthly salary calculated for one employee was lower than the average salary per region in the following economic branches: "Geology and meteorology (1,729 rubles or 156 USD), "Forestry (1,798 rubles or 162 USD), "Social work (1,947 rubles or 175 USD), "Postal communications (2,026 rubles or 183 USD), "Culture and art (2,493 rubles or 225 USD), "Administration bodies (2,375 rubles or 214 USD), "Health (2,423 rubles or 218 USD), "Education (2,389 rubles or 215 USD), "Science (2,493 rubles or 225 USD), "Agriculture (2,779 rubles or 250 USD). In industry, the highest average nominal monthly salary in January-June 2013 was recorded for the employees of the following sub-branches: electricity 5,589 rubles or 504 USD, which is more than the average region salary by 52.9%; ferrous metallurgy 5,076 rubles or 457 USD or 138.8% of the average economy salary; food industry 4,494 rubles or 405 USD or 22.9% more than the average economy salary; chemical industry 3,789 rubles or 341 USD or 3.6% more than the average economy salary. The lowest monthly average salaries, calculated for January- June 2013, were those of the employees of the following branches: other industrial branches 2,288 rubles or 206 USD, which is lower than the average region salary by 62.6%, wood processing industry 2,667 rubles or 240 USD, lower than the average salary by 27.1%, polygraphic industry 3,323 rubles or 299 USD, lower than the average region salary by 9.1%. Social protection of the population. The average number of pensioners for January-June 2013 was 138,959 persons, out of which work pensions 134,616 persons, and social pensions 4,342 persons. The average value of pensions was 1, rubles (labor pension 1, rubles, social pension rubles), which is 12.4% more than in the similar period of the previous year. Subsistence minimum. In January-June 2013, the subsistence minimum in average for one person was 1, rubles a month. In January-June 2013, the subsistence minimum in average for one person was 1, rubles a month. By population categories, the value of the subsistence minimum is for the active population: men 1, rubles a month, women 1, rubles a month. The subsistence minimum of pensioners was 1, rubles a month, children under the age of 6 1, rubles a month, children aged 7 to 15 1, rubles a month. 82
83 Table 6.3. Subsistence minimum in the region from the left side of the river Dniester in January-June 2013 (in average for one person, rubles per month) Including: Total Active Children population Pensioners Men Women aged under 6 7 to 15 January February March April May June Source: According to the data of the Statistical Service of Transnistria. Crimes. In January-June 2013, public order protection agencies recorded 5,732 complaints and reports regarding crimes or 6.9% more than in January-June There were 2,557 crimes, 12.7% less than January-March of the previous year. Out of these: 23 murders, 19 severe intentional attacks, 143 crimes related to illegal arm trafficking, 78 crimes committed by the use of, arms, munitions and explosives, 268 crimes against the public order, 236 drug-related crimes, 80 frauds, 655 thefts, 88 larcenies, other crimes 701, etc. The crimes affected 1433 persons, out of which 40 persons died (2.8%), and 48 persons were seriously injured (3.3%). 83
84 Chapter VII UPDATED ESTIMATES FOR 2013 The presented estimates were drafted based on the econometric model of INCE and coordinated with the experts of the institution. Overall, the estimates are quite precise, and the difference between estimated and achieved indexes are within admissible limits. Most often errors are caused by the uncertain evolutions of the economies of the countries with which our country has close commercial relations. The validity depends on climate conditions, which more or less influence the volume of the production from the agricultural sector, and also other sectors of the national economy. For the estimation of the main macroeconomic indicators, we used the macroeconomic model, in which regressions were updated when year 2012 was included in the sample, and the revision of the statistical information for The dynamic evolution of the main indicators is determined by the specification of regressions and by the values of exogenetic factors, which include both internal and external indicators, as estimated by the IMF. The estimate for 2013 is based on the following hypotheses of the model: - the indicators from the national economy will have the following evolution: The annual average of the exchange rate of the national currency will be 12.4 MDL/USD; The average interest rate for the credits granted for 2013 will be 12%. Remittances (transfers) will increase by 3.7%; - World indicators will have the following evolution: The average annual consumer price index in 2013 will increase by 3.8%; The prices of oil and gas products will decrease in 2013, namely by 4.7% and 2.4%; The prices of food products will decrease by 3.3%; The growth rate of the world GDP will be 3.3%. The calculations made based on the model (Table 7.1) indicate a positive evolution of most main macroeconomic indicators, as they are higher than previously estimated ones. Table 7.1. Evolution of the main macroeconomic indicators for (based on the macro-econometric model of IEFS) Measurement unit Actual Estimate A Nominal GDP MDL billion Versus last year, in comparable prices % Consumer price index % MDL average exchange rate MDL/USD Export of goods USD million Versus last year % Import of goods USD million Versus last year % Balance of the trade balance USD million Industrial production in current prices MDL billion Versus last year, in comparable prices %
85 Table 7.1 continue A Agricultural production in current prices MDL billion Versus last year, in comparable prices % Investments in long-term material assets MDL billion Versus last year, in comparable prices % Monthly average nominal salary lei Versus last year % nominal real Labor remuneration fund MDL billion Economically active population thousand persons Employed population thousand persons Unemployment rate thousand persons Economic growth premises in the Republic of Moldova in 2013 Consumer prices and the exchange rate of MDL are relatively stable. The situation from the financial-banking and the monetary-credit systems is rather stable, especially that of the budget system. This situation, which is favorable for the business environment, allows us to estimate a positive overall economic evolution of the country in the following months and in the entire year 2013, which will be a durable basis for economic growth also in the future. Consumer prices and the exchange rate of MDL are relatively stable. The consumer price index has lately increased in a relatively moderate manner. In July 2013 consumer prices decreased by 1% compared to June, and increased by 4.3% compared to July By monitoring the recent evolution of prices and by considering that this trend will be maintained in the future, it is estimated that in 2013 the consumer index prices will not exceed %. It is estimated that the exchange rate of the national currency will vary between and MDL for one USD. Increase of the internal demand. The increase of the final consumption of households and public administration, influenced by the increase of salaries and of the revenues of the population, partially stimulated by the increase of remittances, will cause the increase of total consumption, from 2.6% in the 1st quarter to 6.2% in the 2nd quarter. Overall, in 2013 consumption will increase by 7-8%. Encouraging results in agriculture. The favorable climate conditions of last year contributed to a good crop for most plants, which will exceed by one third the volume of production from last year and by 5-10% the average volume of previous years. The activity in other related branches, such as the food industry, transportation, etc. will depend on the volume and quality of agricultural production. Ascending industry. The monthly dynamics of the industrial sector compared to the similar period of last year (from 97.9% to 106.4% in June this year) allows us to presume that in the following months the evolution of this sector will be rather dynamic, and 2013 will end with an increase of approximately 8-10% compared to the previous year. 85
86 Improvement of the situation of transportation companies. After the collapse of transportation activities in 2009 (by over 50%), in 2010 and 2011 there were increases, and in 2012 there was a decrease again, but this time an insignificant one (-2.7%). The results of the 1st half year of 2013 indicate an increase in the volume of transported commodities by approximately 15%, which makes us believe that there will be an increase until the end of the year of at least 10-12%. Increasing exports and imports. As a positive factor, we would like to mention the increase of the weight of national products in the total volume of exports and the decrease of the volume of re-exports. The evolution of exports and imports from the 1st half year (+7.7% and +5.4%, respectively) lead to the conclusion that this year, overall, exports will increase by 9.5%, and imports by 7.5%, and the negative trade balance will also increase by 6%. Internal trade and different-rate services. Considering the evolution from the first half year of wholesale, retail and market services provided to the population, we assume that in the end retail will have a surplus compared to the respective period of the previous year of 2%, in comparable prices, and for market services provided to the population of approximately 8%. Modest results in investment activities. Investments in long-term material assets, as a main source of economic growth, in the last 2 years, were rather stagnant. Thus, while in 2012 investments decreased by 4.1% compared to the previous year, in the 1st half of this year there was an increase of only 1.5%. Concomitantly, the quarterly dynamics shows a worsening situation (in the 1st quarter + 4.5%, in the 2nd quarter - 0.1%), which makes us assume an annual increase of approximately 3%, considering that in the second half of the previous year there were significant decreases. Decrease of the risk of social exclusion. The social evolution is positive and most indicators are ascending, which makes us believe that this trend will be maintained both until the end of the year and later on. The disposable revenues of the population in the 2nd quarter of 2013 in average for one person were of MDL, an increase of 9.8% compared to the second quarter of 2012 in nominal terms, and a 4.4% increase in real terms. The average monthly salary of an employee from the national economy in the 1st half year of 2013 was 3638 MDL, a 7.3% increase compared to the 1st half year of 2012, and the real increase was 2.4%. For 2013 we estimate that the average monthly salary will be almost 3800 lei, 9% higher than last year, and the real increase will be 4.6%. The unemployment rate will be between 4.0% and 5.0%, namely below that of last year. The economically active population will be approximately 1,200 people, or lower than in
87 DEVELOPING A TIME SERIES MODEL FOR ASSESSING AND FORECASTING THE EVOLUTION OF QUARTERLY REAL GDP IN MOLDOVA 1. INTRODUCTION AND LINK TO EARLIER WORK Apostolos Papaphilippou 1 This paper follows an earlier article which developed and estimated an Auto-Regressive Integrated Moving Average (ARIMA) model for Moldova s seasonally-adjusted quarterly real GDP estimates [Papaphilippou (2011b)] 2. It is part of a research agenda on aspects linked to trade and investment, economic growth, macroeconomic forecasting and the conduct of economic policy in Moldova 3. The current paper s goal is to summarise the empirical work undertaken to develop an ARIMA model for the original (i.e. not seasonally-adjusted) quarterly real GDP time-series. As noted in the earlier paper this a natural area for further work. The justification is that a model fitted to the original time-series may be particularly useful for short-term monitoring and forecasting purposes given that: 1. Such a model will explicitly capture the strong seasonality that characterises the evolution of real GDP in Moldova (through the incorporation of seasonal autoregressive parameters and/or seasonal moving average parameters); and 2. It will be easier to update this model and use it for short-term monitoring and forecasting purposes. This is because the ARIMA model that was fitted to seasonally-adjusted data relied upon data that are available with a significant time-lag (as they need to be reconciled with the yearly estimates of real GDP, and also seasonally-adjusted). In contrast the preliminary estimates of the quarterly GDP evolution as released over the year from the National Bureau of Statistics may be readily incorporated into the ARIMA model that is fitted to seasonallyunadjusted data, so as to improve the short-term monitoring of the evolution of GDP in Moldova and the assessment of the short-to medium term outlook. This working paper is organised as follows: Section 2 presents and analyses the quarterly GDP time series and its stationarity. Section 3 presents the ARIMA model and the econometric estimates. Section 4 contains an indicative forecast. Section 5 concludes with a few comments and suggestions on the use of ARIMA models as instruments facilitating the short-term assessment of an economy s recent economic activity and its short-term outlook. 2. DATA AND STATIONARITY Graph 1 below portrays the evolution of quarterly real GDP in Moldova, as reported by the National Bureau of Statistics (2011). These quarterly real GDP estimates are reconciled with the annual real GDP estimates, are expressed in average prices of the year 2000 (in MDL thousand), and exclude the Transnistrian region. 1 I am grateful to Mr Iurii Torkunov, the Head of the Division for Macroeconomic Analysis and Forecasting of the Ministry of Economy, and Ms Lilia Tolocico, a Senior Expert in the same Division, for discussing with me several aspects linked to macroeconomic analysis and forecasting in Moldova. I am, however, responsible for the work and views expressed in this article and any errors therein. 2 The earlier paper provided an overview of a number of key issues, such as: the concept of a time series s stationarity, the time-series methodology, and the specification, estimation and validation of ARIMA models. The earlier paper may be downloaded from the website of the National Institute for Economic Research: 3 A number or recent articles on these issues are listed in the current paper s reference section. 87
88 It is notable that: Graph 1 exhibits the strong seasonality that characterises the evolution of real GDP in Moldova; and A visual inspection of graph 1 and standard tests performed on the quarterly real GDP time series reported in the graph and its logarithmic transformation undertaken for our empirical work, suggest that the series are not stationary. 8,000,000 GDP 7,000,000 6,000,000 5,000,000 4,000,000 3,000,000 2,000, Graph 1. The evolution of quarterly real GDP (in average prices of 2000, MDL thou) In line with the Box and Jenkins (1970) methodology described briefly in our previous ARIMA paper we consider the first difference in the natural logarithm of real GDP. This is defined by the expression: dloggdp = loggdp loggdp(-1) were by loggdp we refer to the natural logarithm of the GDP estimates, i.e. to the logarithm with base e..6 DLOGGDP Graph 2. The evolution of the first difference in the logarithm of the seasonally unadjusted real GDP estimates. The series portrayed in graph 2 is likely to be a stationary time-series, as indicated Philipps- Perron test reproduced in table 1 below, which rejects the null hypothesis of the existence of a unit root. 88
89 Table 1. Result of the Phillipps-Perron stationarity test for the first difference in the logarithm of the seasonally-adjusted GDP estimates. Null Hypothesis: D(LOGGDP) has a unit root Exogenous: Constant Bandwidth: 11 (Newey-West automatic) using Bartlett kernel Adj. t-stat Prob.* Phillips-Perron test statistic Test critical values: 1% level % level % level *MacKinnon (1996) one-sided p-values. 3. MODEL SPECIFICATION AND ECONOMETRIC ESTIMATES We now turn to present our preferred ARIMA model and report the econometric estimates. The preferred specification is a (2,1,1) ARIMA model, incorporating a seasonal autoregressive term, SAR (4), a seasonal moving average term, SMA(4), and two dummy variables, namely: 1. A dummy variable capturing the effect of the drought in the third quarter of 2007: for the whole of 2007 the volume of agricultural output dropped by 35 percent in comparison with the previous year; given the strong seasonality of agricultural output, and the weight of agricultural output in total output in the third quarter, the adverse effect in real GDP was extremely significant in 2007q3; and 2. The effect of the international financial crisis in 2009q1. The above two dummy variables take the value of 1 in 2007q3 and 2009q1 respectively, and the value of 0 elsewhere. A general discussion of the time series methodology and the ARIMA model selection and validation is contained in the earlier paper to which the reader is referred to. For the purposes of the current paper it suffices to note that a comparison on the basis of: 1. Goodness-of-fit; and 2. Information criteria; suggested that, among the ARIMA models incorporating: (i) seasonal autoregressive and moving average terms; and (ii) the above-mentioned two dummy variables, the (2,1,1) ARIMA was the preferred model, followed by the (1,1,1) model. Table 2 reproduces the criteria for the comparison between the two models estimated over the period 2000q1 to 2010q4. This sample excludes the observations over the period 1995q1 to 1999q4 and concentrates on the period from the commencement of sustained economic growth 89
90 in Moldova. It thus excludes: (i) the period were the economy was still adjusting to onset of the transition process; and also (ii) the impact of the Russian crisis on the Moldovan economy. Table 2. Goodness-of-fit and information criteria comparison between (2,1,1) and (1,1,1) ARIMA model Adjusted R 2 Akaike Information Schwarz Information Criterion Criterion (2,1,1) (1,1,1) Note: The table reports the comparator statistics between a (2,1,1) and a (1,1,1) model that incorporate (i) seasonal autoregressive and moving average terms; and (ii) the two dummy variables for 2007q3 and 2009q1, estimated over the sample 2000q1 and 2010q4. Table 2 provides the estimates over the period 2001q1 to 2010q4 under three criteria, namely: 1. The adjusted R 2 to capture the goodness-of-fit of the overall regression, while penalising for the addition of regressors that do not contribute to the explanatory power of the model - with the equation specification with the larger value of the adjusted R 2 criterion being the preferred one; 2. The Akaike Information Criterion (which is used to select among alternative specifications with the regression specification with the smaller value preferred); and 3. The Schwartz Information Criterion (this is an alternative to the Akaike Information Criterion used to select among alternative specifications, which, however, imposes a larger penalty for the addition of regressors as is the case with the Akaike Information Criterion, the regression specification with the smaller value is preferred). Table 3 reproduces the estimation output of the preferred specification over the period 2000q1 2010q4. In addition to the excellent overall fit of the reported regression, it is also notable that the residuals of the fitted regression follow a normal distribution (as indicated by the histogram of the residuals and a high p-value of the Jarque-Berra statistic). Table 3. Estimation output of the preferred ARIMA model. Dependent Variable: D(LOG(GDP)) Method: Least Squares Sample: 2000Q1 2010Q4 Included observations: 44 MA Backcast: 1998Q4 1999Q4 Variable Coefficient Std. Error t-statistic Prob. C D_2007Q D_2009Q AR(1) AR(2) SAR(4) MA(1) SMA(4) R-squared Mean dependent var Adjusted R-squared S.D. dependent var
91 S.E. of regression Akaike info criterion Sum squared resid Schwarz criterion Log likelihood Hannan-Quinn criter F-statistic Durbin-Watson stat Prob(F-statistic) Finally graph 3 contains the actual, fitted and residuals plot of the preferred specification FORECASTS Graph 3. Actual, fitted and residuals graph of the preferred specification As noted in the previous section our model has been estimated over the sample 2000q1 to 2010q4. We proceed below to report the out-of-sample dynamic forecast of the estimated model for the period 2011q1 to 2013q4. 11,000,000 Residual Actual Fitted 10,000,000 9,000,000 8,000,000 7,000,000 6,000,000 5,000,000 I II III IV I II III IV I II III IV GDPF ± 2 S.E. Graph 4. Out-of-sample forecast and confidence intervals of the preferred (2,1,1) model The forecast exhibits the strong seasonality in the evolution of real GDP in Moldova, and suggests that, on the basis of the econometric estimates over the period 2000q1-2010q4, the economy is projected to follow an upward trend. 91
92 Table 4 below reports the actual real GDP figures for 2010q1 to 2010q4, the forecasted values of real GDP for 2011q1 to 2011q4, and compares the annual real GDP estimates between 2010 and 2011 and Table 4. Actual and forecasted GDP estimates and forecasted annual growth rate Quarterly real GDP estimates Annual real GDP estimates Ratio between real GDP in 2010 and Q Q Q Q Q Q Q Q Note: Reported estimates in the table to 2010q4 are actual values. The remaining values, which appear in italics, are the forecasted out-of-sample estimates generated through the ARIMA model estimated over the period 2000q1 to 2010q4. The out-of-sample forecast would indicate that, on the basis of the GDP time series historical evolution, the forecasted 2011 GDP annual growth rate would be 7.1 percent. According to the National Bureau of Statistics in2011 the real GDP growth rate was 6.8 percent. This was followed by a drop of 0.8 percent in real GDP in 2012 that reflected an unfavourable external environment and weather-induced shocks in the agricultural sector. The rebound in real economic activity in 2013 is expected to be of the order of 4-5 percent. This recent evolution of real GDP provides some support for the claim made in earlier research papers that, in the absence of a policy-induced change in the underlying growth model, future economic growth in Moldova is likely to be modest and below Moldova s growth record over the period from 2000 onwards [Papaphilippou (2011a), (2011b)]. 5. CONCLUDING COMMENTS AND SUGGESTIONS FOR FURTHER WORK ARIMA models have been widely used for both analytical and forecasting purposes. This class of models have proved to be useful tools in order: To provide insight and analyse the behaviour of a particular time series in general, and the time series short-term dynamical properties in particular; as well as, Generate indicative short to medium term forecasts of the time series in question. Forecasts generated by ARIMA models are frequently used as benchmarks and are combined with other information on ongoing developments in the economy, and additional empirical analysis of the structural characteristics of the economy under consideration and its external environment. At the same time it should be emphasised that the exercise of informed judgement is required to specify, validate, and update an ARIMA model through time. The specified model in this working paper provides a basis for an ongoing research effort to update and possibly revise the ARIMA model, as well as test its properties and forecasting ability through time. These are all areas for further work. 92
93 Finally, as is the case with every economic model, judgement is also required to interpret its empirical estimates and the ARIMA model s indicative forecasts, and adjust these indicative forecasts taking into account: The additional information provided by other models (such as structural econometric models); and The researcher s monitoring and assessment of ongoing developments in the economy, the economy s outlook, and the emerging risks. References Box, G. and G. Jenkins (1970), Time series analysis: Forecasting and control, San Francisco: Holden-Day. National Bureau of Statistics (2011), Reconcilierea Calculelor Trimestriale ale Produsului Intern Brut cu cele Annuale, Chisinau. Papaphilippou, A. (2012a), On Macro-Fiscal and Trade Forecasting in Moldova: An Institutional Analysis with some Recommendations, Moldovan Economic Trends, Nr. 4. Papaphilippou, A. (2012b), Comparing an Economy s Output Before and After the Beginning of Transition: A General Analysis with Emphasis on the Case of Moldova, Moldovan Economic Trends, Nr. 2. Papaphilippou, A. (2011a), On Moldova s Incremental Capital-Output Ratio with some Observations on Growth, Investment and the Conduct of Policy, Moldovan Economic Trends, Nr. 4. Papaphilippou, A. (2011b), Developing an ARIMA Model for Analysing the Evolution of Real GDP in Moldova: Econometric Estimates and Implications for Policy, Moldovan Economic Trends, Nr. 2. STATISTICAL ANNEX Real GDP estimates 1995Q Q Q Q Q Q Q Q Q Q Q Q Q Q Q Q Q Q
94 1999Q Q Q Q Q Q Q Q Q Q Q Q Q Q Q Q Q Q Q Q Q Q Q Q Q Q Q Q Q Q Q Q Q Q Q Q Q Q Q Q Q Q Q Q Q Q Source: National Bureau of Statistics (2011), p. 19. Note: The reported estimates exclude the Transnistrian region, are reconciled with the annual real GDP estimates, and are expressed in average prices of the year 2000 (in MDL thousand). 94
95 STATISTICAL ANNEX 95

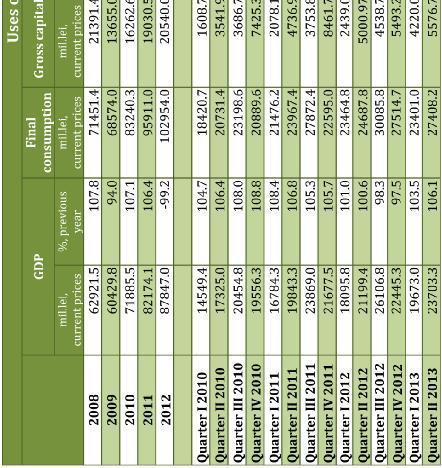
96 96

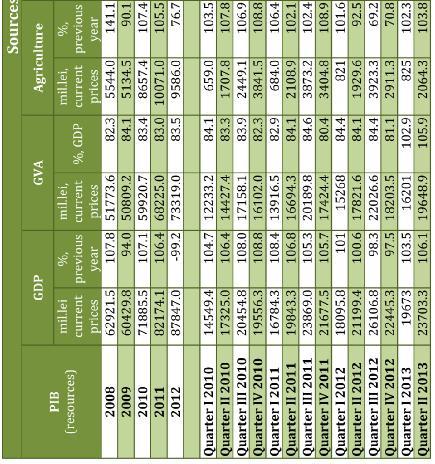
97 97

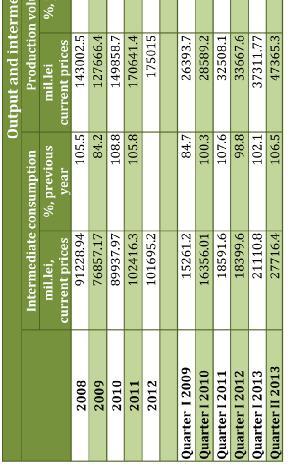
98 98

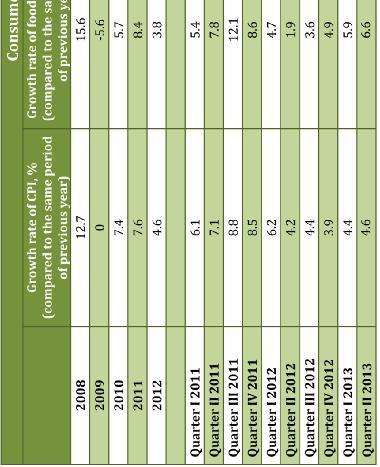
99 99

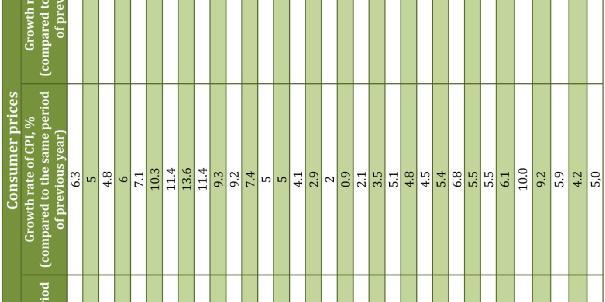
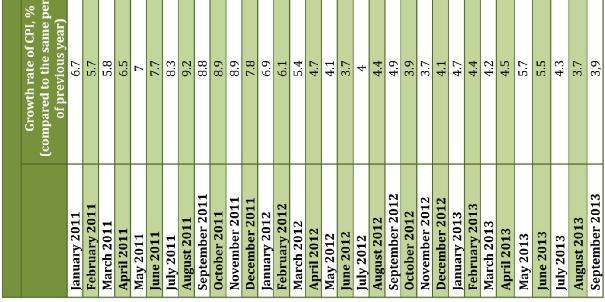
100 100

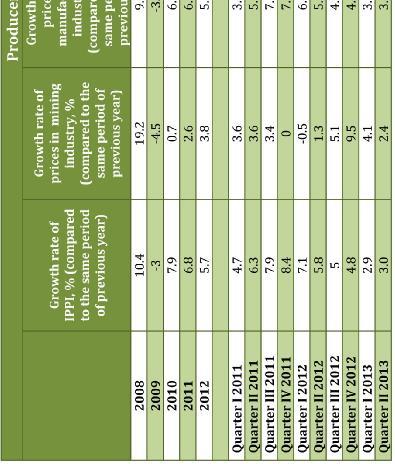
101 101

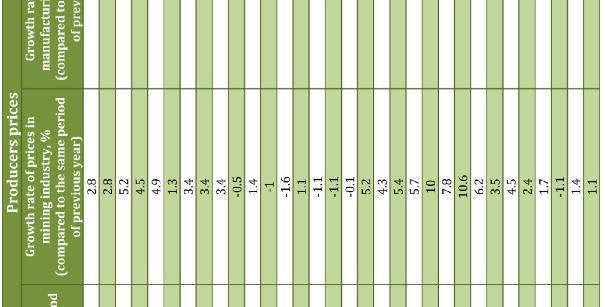

102 102

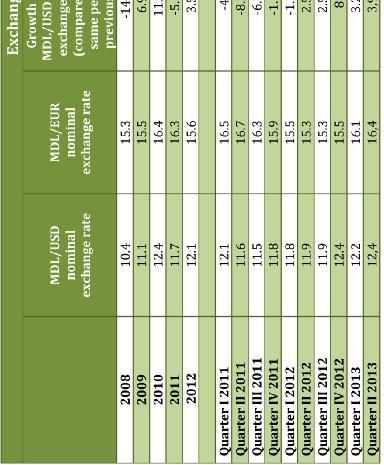
103 103

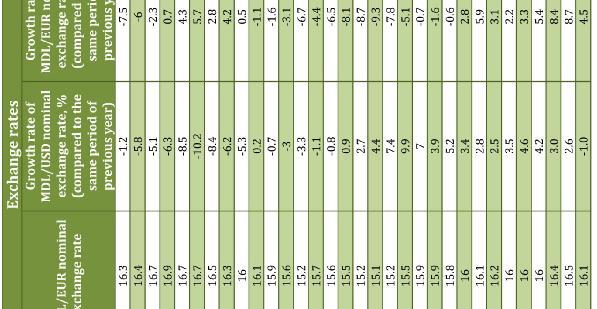
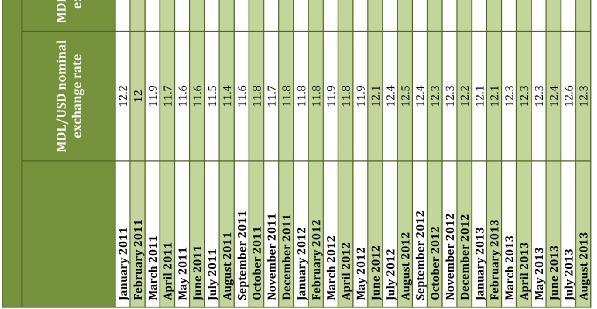
104 104

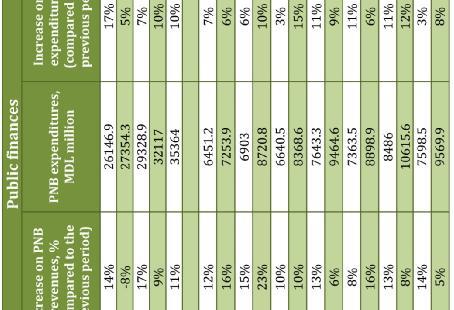
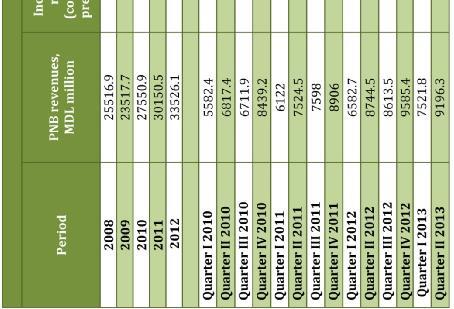
105 105

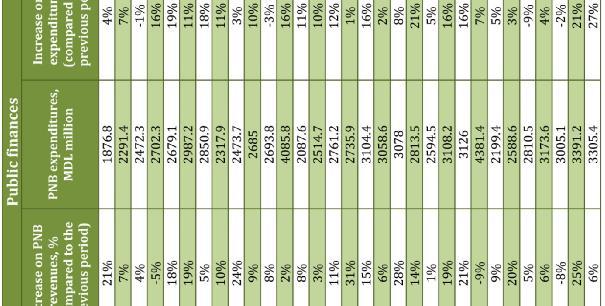
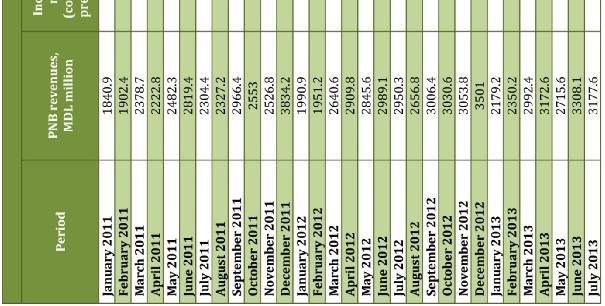
106 106

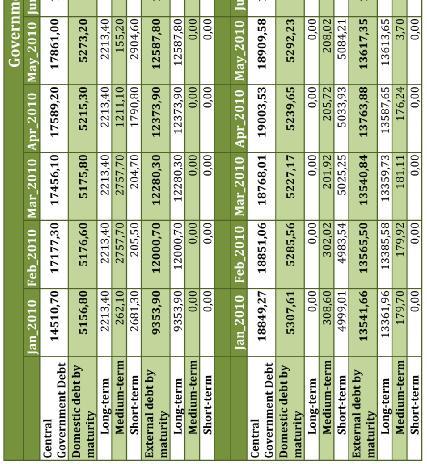
107 107


108 108

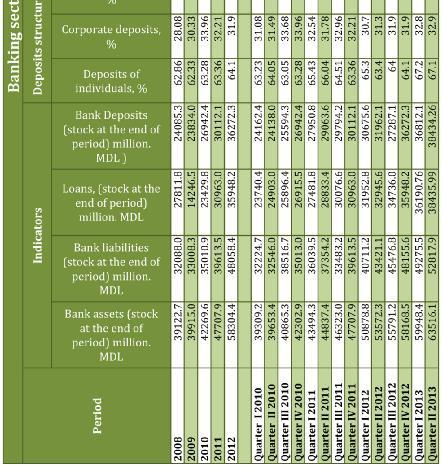
109 109

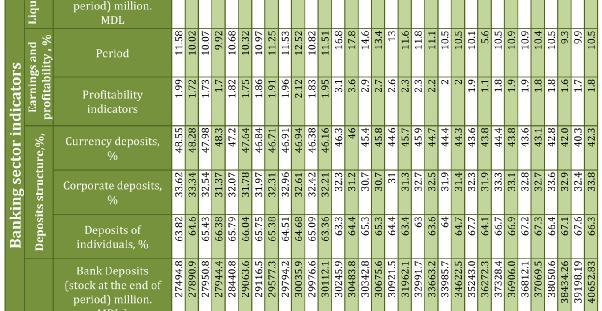
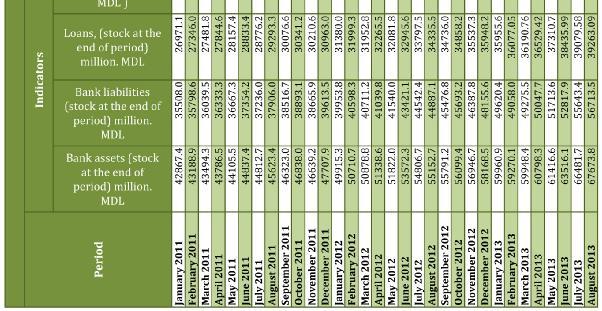
110 110

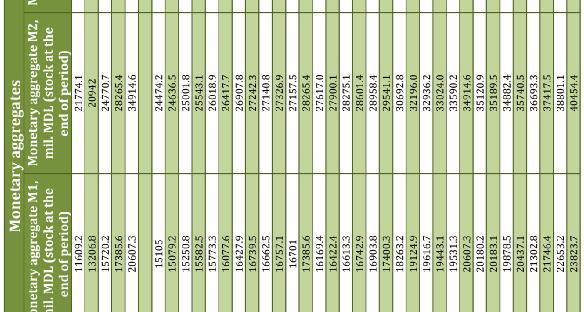

111 111

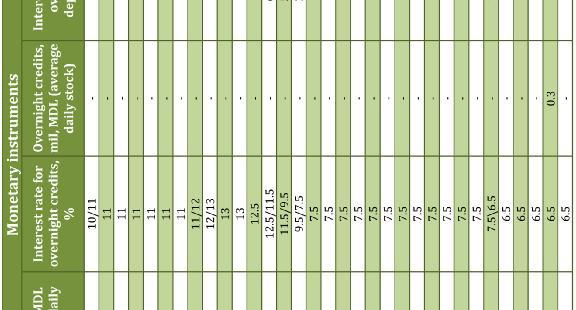

112 112

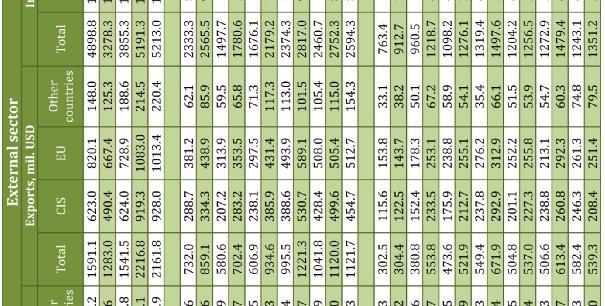
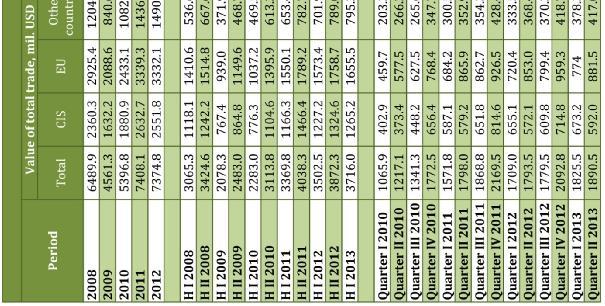
113 113

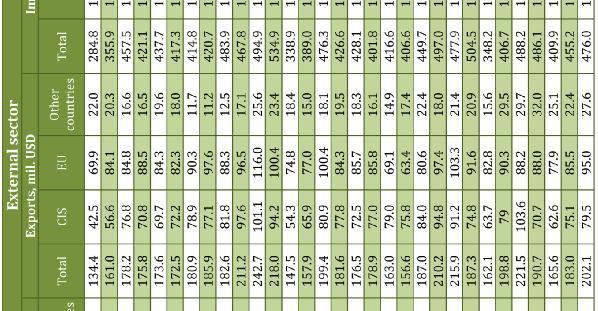
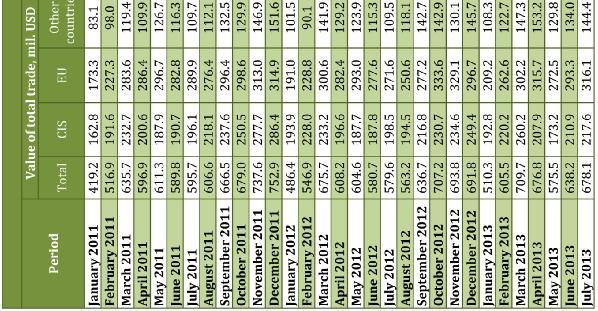
114 114

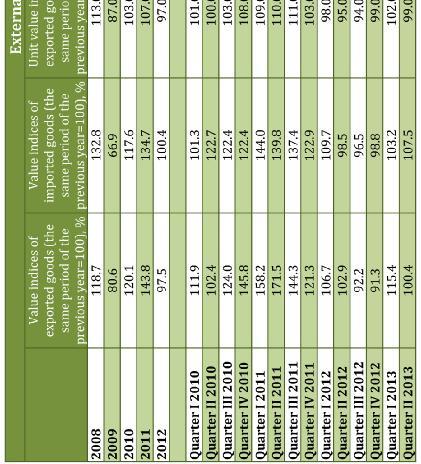
115 115


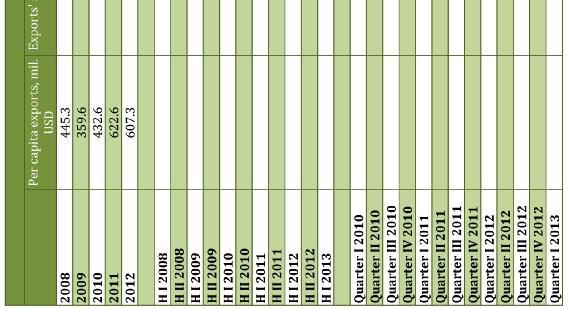
116 116

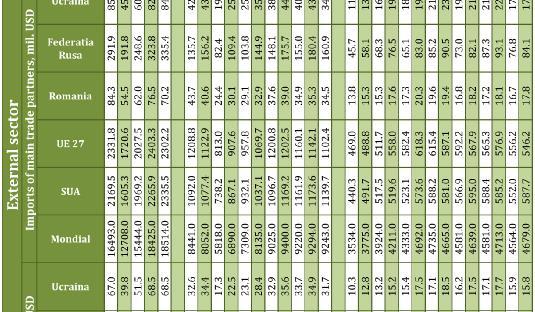
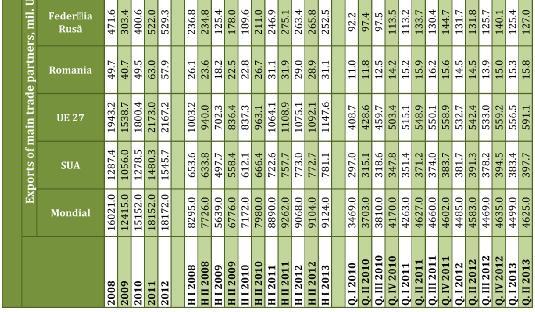
117 117

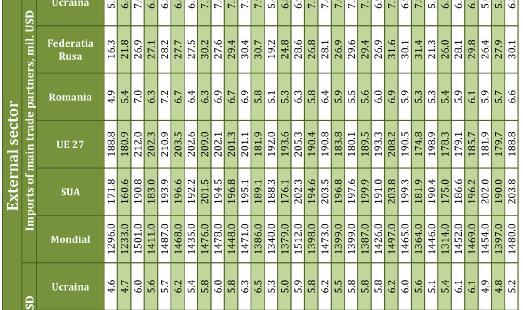
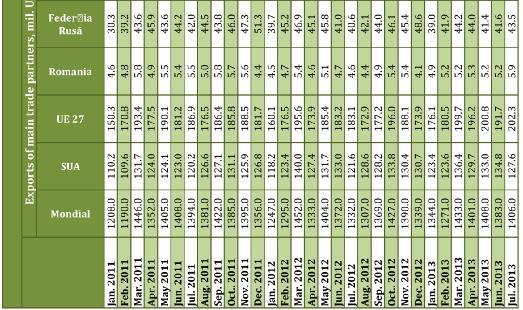
118 118


119 119

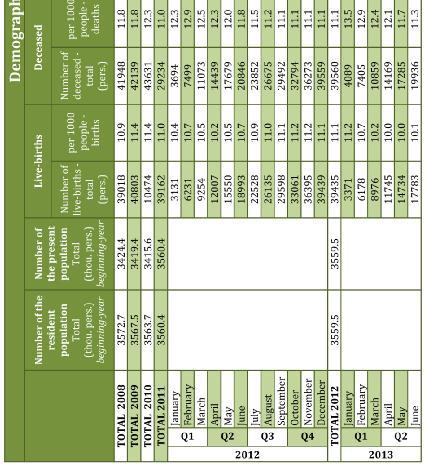
120 120

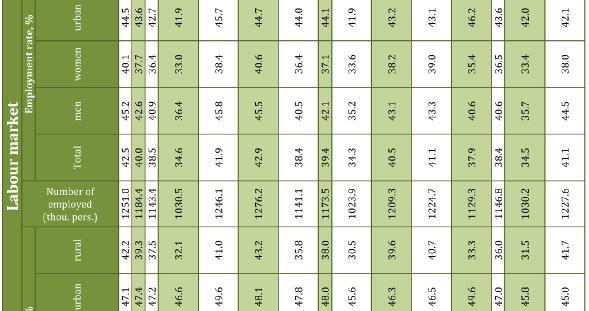
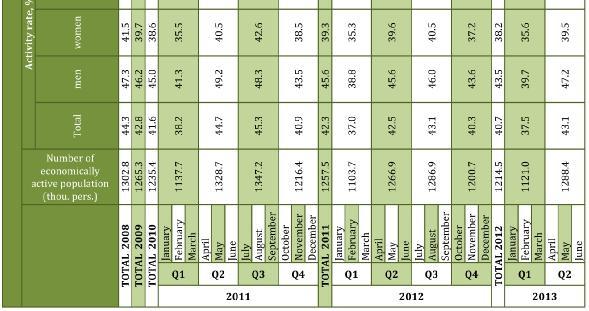
121 121

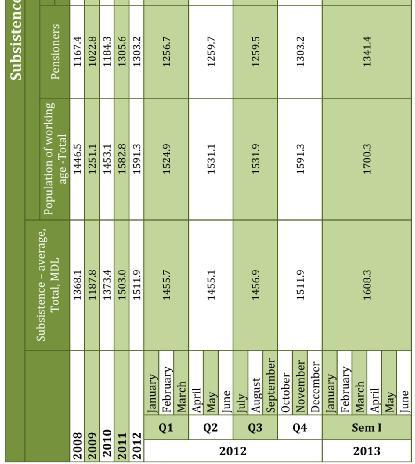
122 122

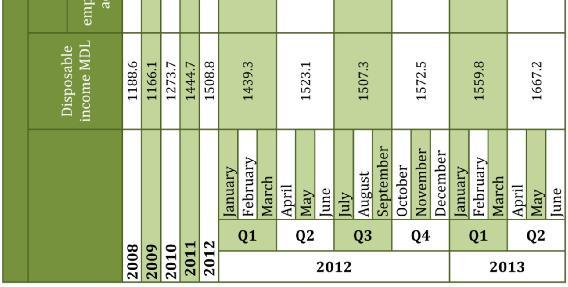
123 123

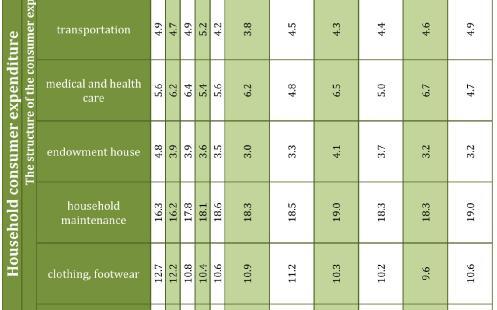
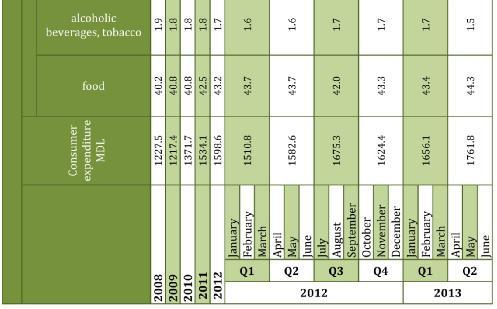
124 124

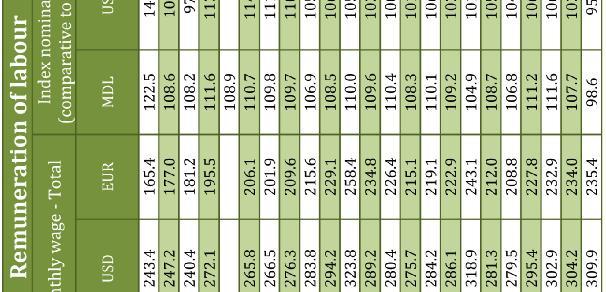
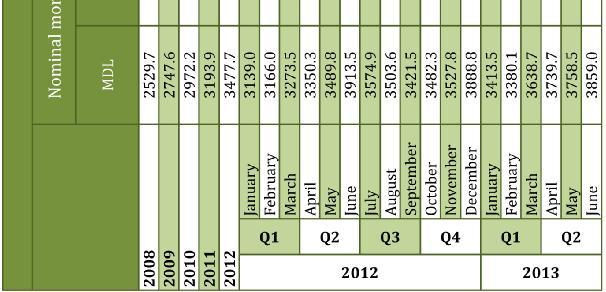
125 125

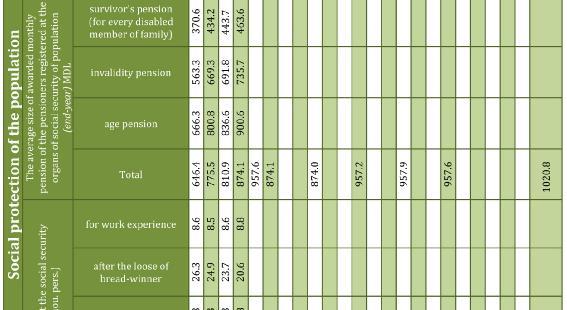
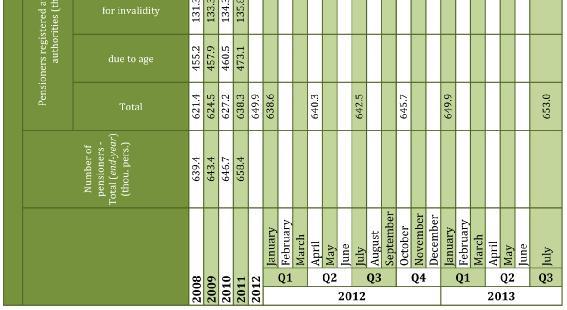
126 126

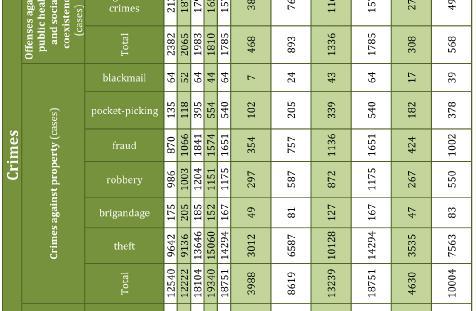
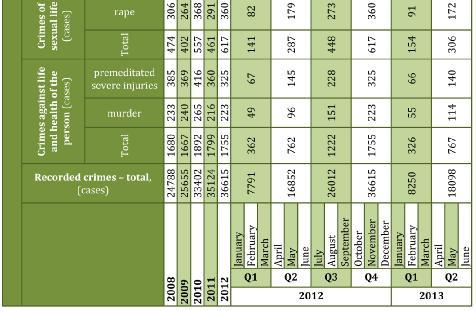
127 127
MOLDOVAN ECONOMIC TRENDS
 Academy of Sciences of Moldova Institute of Economy, Finance and Statistics Ministry of Economy of the Republic of Moldova MOLDOVAN ECONOMIC TRENDS Nr. 6 (Q II) 2012 ISSN 1857 3134 Chisinau Supported by
MOLDOVAN ECONOMIC TRENDS
 Academy of Sciences of Moldova National Institute for Economic Research Ministry of Economy of the Republic of Moldova MOLDOVAN ECONOMIC TRENDS ISSN 1857 3134 Chisinau ISSN 1857 3134 AUTHORS: Alexandru
MOLDOVAN ECONOMIC TRENDS
 Academy of Science of Moldova National Institute for Economic Research Ministry of Economy of Moldova MOLDOVAN ECONOMIC TRENDS ISSN 1857-3126 Chisinau ISSN 1857-3126 MET TEAM: Alexandru Stratan, Alexandru
National Bank of Moldova
 Note Monetary Policy Report no. 3, August 2010 was prepared bearing on the most recent statistical data compiled by the National Bank of Moldova, National Bureau of Statistics, Ministry of Economy and
CATALOGUE of statistical publications
 National Bureau for Statistics of the Republic of Moldova CATALOGUE of statistical publications 2008 Chisinau 2008 Contents pag. Services offered by NBS... 4 Annual publications Statistical Yearbook of
All data in the edition are the last available data as of May 2017
 All data in the edition are the last available data as of May 2017 The quoted data set in this report are the last available data, published in the official source s web sites. The sources are Ministry
ECONOMIC MONITOR MOLDOVA Issue 7 January 2018
 ECONOMIC MONITOR MOLDOVA Issue 7 January 218 Overview Economic growth at 3.5% in 217 Weaker growth of 3.% expected in 218 due to decreased consumption demand Inflation at 6.6% in average during 217; lower
BULGARIA STATISTICAL PANORAMA
 BULGARIA 2008 - STATISTICAL PANORAMA Basic features and specific problems of the demographic, social and economic development, R & D and the environment s conditions in the country are presented in the
Priorities of the Government of the Republic of Moldova in the area of attracting investments and promoting exports
 Ministry of Economy and Infrastructure of the Republic of Moldova Priorities of the Government of the Republic of Moldova in the area of attracting investments and promoting exports THE REPUBLIC OF MOLDOVA
Statistical Factsheet. France CONTENTS. Main figures - Year 2016
 June 2017 Statistical Factsheet France CONTENTS Main figures 2016 1. KEY DATA 2. POPULATION & ECONOMY 3. FINANCIAL ASPECTS 4. ECONOMIC ACCOUNTS 5. AGRICULTURAL TRADE 6. FARM STRUCTURE 1 2 3 4-5 6-12 13-14
Statistical Factsheet. Italy CONTENTS. Main figures - Year 2016
 June 2017 Statistical Factsheet Italy CONTENTS Main figures 2016 1. KEY DATA 2. POPULATION & ECONOMY 3. FINANCIAL ASPECTS 4. ECONOMIC ACCOUNTS 5. AGRICULTURAL TRADE 6. FARM STRUCTURE 1 2 3 4-5 6-12 13-14
Italy. May 2018 Statistical Factsheet
 May 2018 Statistical Factsheet Italy CONTENTS Main figures 1. KEY DATA 2. POPULATI ON & ECONOMY 3. FINANCIAL ASPECTS 4. ECONOMI C ACCOUNTS 5. AGRICULTURAL TRADE 6. FARM STRUCTURE 1 2 3 4-5 6-12 13-14 15-16
France. May 2018 Statistical Factsheet
 May 2018 Statistical Factsheet France CONTENTS Main figures 1. KEY DATA 2. POPULATI ON & ECONOMY 3. FINANCIAL ASPECTS 4. ECONOMI C ACCOUNTS 5. AGRICULTURAL TRADE 6. FARM STRUCTURE 1 2 3 4-5 6-12 13-14
Business Opportunities in Moldova Banking sector Business opportunities
 Business Opportunities in Moldova Banking sector Business opportunities May 15th, 2015 Ridha Tekaia, president of CB MOBIASBANCĂ Groupe Société Générale S.A. and Foreign Investors Association Financial
Statistical Factsheet. Belgium CONTENTS. Main figures - Year 2016
 June 2017 Statistical Factsheet Belgium CONTENTS Main figures 2016 1. KEY DATA 2. POPULATION & ECONOMY 3. FINANCIAL ASPECTS 4. ECONOMIC ACCOUNTS 5. AGRICULTURAL TRADE 6. FARM STRUCTURE 1 2 3 4-5 6-12 13-14
Statistical Factsheet. Lithuania CONTENTS. Main figures - Year 2016
 June 2017 Statistical Factsheet Lithuania CONTENTS Main figures 2016 1. KEY DATA 2. POPULATION & ECONOMY 3. FINANCIAL ASPECTS 4. ECONOMIC ACCOUNTS 5. AGRICULTURAL TRADE 6. FARM STRUCTURE 1 2 3 4-5 6-12
Austria. May 2018 Statistical Factsheet
 May 2018 Statistical Factsheet Austria CONTENTS Main figures 1. KEY DATA 2. POPULATI ON & ECONOMY 3. FINANCIAL ASPECTS 4. ECONOMI C ACCOUNTS 5. AGRICULTURAL TRADE 6. FARM STRUCTURE 1 2 3 4-5 6-12 13-14
Netherlands. May 2018 Statistical Factsheet
 May 2018 Statistical Factsheet Netherlands CONTENTS Main figures 1. KEY DATA 2. POPULATI ON & ECONOMY 3. FINANCIAL ASPECTS 4. ECONOMI C ACCOUNTS 5. AGRICULTURAL TRADE 6. FARM STRUCTURE 1 2 3 4-5 6-12 13-14
Estonia. May 2018 Statistical Factsheet
 May 2018 Statistical Factsheet Estonia CONTENTS Main figures 1. KEY DATA 2. POPULATI ON & ECONOMY 3. FINANCIAL ASPECTS 4. ECONOMI C ACCOUNTS 5. AGRICULTURAL TRADE 6. FARM STRUCTURE 1 2 3 4-5 6-12 13-14
Regional Economic Integration of the Republic of Moldova: Opportunities and Challenges
 Regional Economic Integration of the Republic of Moldova: Opportunities and Challenges Octavian CALMÎC, Deputy Minister of Economy of the Republic of Moldova, Chişinău 2015 Republic of Moldova: geo - economic
Greece. Sources: European Commission, Eurostat, and Directorate General for Economic and Financial Affairs. Updated: M ay 2018
 May 2018 Statistical Factsheet Greece CONTENTS Main figures 1. KEY DATA 2. POPULATI ON & ECONOMY 3. FINANCIAL ASPECTS 4. ECONOMI C ACCOUNTS 5. AGRICULTURAL TRADE 6. FARM STRUCTURE 1 2 3 4-5 6-12 13-14
APPENDIX 2 TO ANNEX VIII ICELAND SCHEDULE OF SPECIFIC COMMITMENTS
 APPENDIX 2 TO ANNEX VIII ICELAND SCHEDULE OF SPECIFIC COMMITMENTS I. HORIZONTAL COMMITMENTS ALL SECTORS INCLUDED IN THIS SCHEDULE 3) All foreign investment and currency transfers must be reported to the
GUATEMALA. 1. General trends
 Economic Survey of Latin America and the Caribbean 2016 1 GUATEMALA 1. General trends In 2015, Guatemala s GDP grew by 4.1% in real terms (a figure similar to the 4.2% recorded the previous year), driven
National Bank of the Republic of Macedonia Research Department. Monthly Information 10/2012
 National Bank of the Republic of Macedonia Research Department Monthly Information 1/212 November, 212 Summary During October 212, the National Bank kept the key interest rate at the level of 3.75%, assessing
Denmark. Sources: European Commission, Eurostat, and Directorate General for Economic and Financial Affairs. Updated: M ay 2018
 May 2018 Statistical Factsheet Denmark CONTENTS Main figures 1. KEY DATA 2. POPULATI ON & ECONOMY 3. FINANCIAL ASPECTS 4. ECONOMI C ACCOUNTS 5. AGRICULTURAL TRADE 6. FARM STRUCTURE 1 2 3 4-5 6-12 13-14
Montenegrin Economic Outlook
 Montenegrin Economic Outlook Institute For Strategic Studies and Prognoses This publication is created under the project Increasing the analytical capacities of ISSP which is implemented by KOF and ISSP
International Monetary Fund Washington, D.C.
 2008 International Monetary Fund October 2008 IMF Country Report No. 08/330 St. Lucia: Statistical Appendix This Statistical Appendix for St. Lucia was prepared by a staff team of the International Monetary
Quarterly Report for the Greek Economy
 Quarterly Report for the Greek Economy 3-2016 October 11 th, 2016 This presentation is supported by Various developments in the current period Positive developments: international tourism, low energy prices,
Figures of Catalonia Generalitat de Catalunya Government of Catalonia
 www.idescat.cat Figures of Generalitat de Catalunya Government of POPULATION Population (1 000) 7 479 46 704 505 730 49.3 49.3 48.8 51.0 50.8 51.2 Structure () 0-14 years 15.9 15.2 15.6 15-24 years 9.4
Highlights 2/2017. Main topics: Ministry of Finance of the Republic of Bulgaria. Economic and Financial Policy Directorate ISSN
 BULGARIAN месечен ECONOMY обзор Monthly Report Ministry of Finance of the Republic of Bulgaria 2/217 Economic and Financial Policy Directorate ISSN 2367-2 Main topics:» Gross domestic product» Short-term
International Monetary Fund Washington, D.C.
 2008 International Monetary Fund February 2008 IMF Country Report No. 08/68 St. Lucia: Statistical Appendix This Statistical Appendix paper for St. Lucia was prepared by a staff team of the International
BULGARIA: ECONOMIC AND MARKET ANALYSES Monthly report, August 2015
 BULGARIA: ECONOMIC AND MARKET ANALYSES Monthly report, August 2015 All data in the edition are the last available data as of 29 of August 2015 The quoted data set in this report are the last available
ECONOMIC MONITOR MOLDOVA Issue 8 June 2018
 ECONOMIC MONITOR MOLDOVA Issue 8 June 218 Overview Economic growth of 4.5% in 217, slowdown to low 3.8% expected for 218 Growth driven by private consumption, also positive contribution from investment
International Monetary Fund Washington, D.C.
 2006 International Monetary Fund September 2006 IMF Country Report No. 06/326 St. Lucia: Statistical Appendix This Statistical Appendix for St. Lucia was prepared by a staff team of the International Monetary
CHILE TRADE SUMMARY IMPORT POLICIES. Tariffs
 CHILE TRADE SUMMARY The U.S. goods trade deficit with Chile was $692 million in 2007, a decrease of $2.1 billion from $2.8 billion in 2006. U.S. goods exports in 2007 were $8.3 billion, up 22.5 percent
CURRENT STATISTICAL SURVEY
 1 (96) 2016 CURRENT STATISTICAL SURVEY Magazine of the Federal State Statistics Service Contents: 9 Statistical Review for 2015 Economic and Social Indicators Population 12 Vital Statistics 12 Vital Rates
International Monetary Fund Washington, D.C.
 2005 International Monetary Fund August 2005 IMF Country Report No. 05/295 Iraq: Statistical Appendix This Statistical Appendix paper for Iraq was prepared by a staff team of the International Monetary
International Monetary Fund Washington, D.C.
 2004 International Monetary Fund May 2004 IMF Country Report No. 04/140 January 29, 2001 January 29, 2001 January 29, 2001 January 29, 2001 January 29, 2001 Republic of Belarus: Statistical Appendix This
ANNUAL ECONOMIC REPORT AJMAN 2015
 ANNUAL ECONOMIC REPORT AJMAN C O N T E N T S Introduction Growth of the Global Economy Economic Growth in the United Arab Emirates Macro - Economic Growth in the Emirate of Ajman Gross Domestic Product
ECONOMIC OUTLOOK. September, 2017 MINISTRY OF ECONOMY AND SUSTAINABLE DEVELOPMENT
 ECONOMIC OUTLOOK September, 2017 MINISTRY OF ECONOMY AND SUSTAINABLE DEVELOPMENT CONTENTS GDP growth... 3 Potential Level of Economic Growth and GDP Gap... 3 Macroeconomic Environment in the Region...
CURRENT STATISTICAL SURVEY
 1 (98) 2017 CURRENT STATISTICAL SURVEY Magazine of the Federal State Statistics Service Contents: 9 Statistical Review for 2016 Economic and Social Indicators Population 12 Vital Statistics 12 Vital Rates
National Bank of Moldova. Translation. Annual Report. 1 Grigore Vieru Avenue MD 2005 Chișinău
 National Bank of Moldova Translation Annual Report 2012 1 Grigore Vieru Avenue MD 2005 Chișinău www.bnm.md E-mail: official@bnm.md Annual Report (NBM, 2012) Note The report was compiled using the latest
5. Prices and the Exchange Rate
 3 5. Prices and the Exchange Rate 5. Prices and the Exchange Rate Since the beginning of the year, inflation in Serbia has been extremely low, the cumulative growth rate in the first seven months is %.
Previsions Macroeconòmiques. Macroeconomic scenario for the Catalan economy 2017 and June 2017
 PM Previsions Macroeconòmiques Macroeconomic scenario for the Catalan economy 2017 and 2018 June 2017 Previsions macroeconòmiques Macroeconomic scenario for the Catalan economy June 2017 ISSN: 2013-2182
Content. Introduction. Part I: The Lebanese Macroeconomy. 1. Gross Domestic Product. 2. Monetary Situation. 3. Banking Sector. 4. Balance of Payments
 Content Introduction Part I: The Lebanese Macroeconomy 1. Gross Domestic Product 2. Monetary Situation 3. Banking Sector 4. Balance of Payments 5. Public Finance 6. Financial Markets 7. Foreign Trade 8.
Oleg Ustenko, Julia Segura, Valentyn Povroznyuk Edilberto L. Segura
 Executive Summary: With the participation of Ukraine, France, Germany and Russia, a Normandy-Four Meeting was held in Berlin on October 19, with disappointing results. Russia insisted that the so-called
SDMX CONTENT-ORIENTED GUIDELINES LIST OF SUBJECT-MATTER DOMAINS
 SDMX CONTENT-ORIENTED GUIDELINES LIST OF SUBJECT-MATTER DOMAINS 2009 SDMX 2009 http://www.sdmx.org/ Page 2 of 10 SDMX list of statistical subject-matter domains 1 : Overview Domain 1: Demographic and social
2.4. Price development. GDP deflator
 2.4. Price development GDP deflator Differing changes in domestic and external prices The same growth in the implicit deflator for production as in intermediate consumption The differing influence of domestic
International Monetary Fund Washington, D.C.
 2006 International Monetary Fund November 2006 IMF Country Report No. 06/423 Vietnam: Statistical Appendix This Statistical Appendix for Vietnam was prepared by a staff team of the International Monetary
Sheep - see agriculture Shipping: port traffic 264 Social welfare Stocks: in industry 201
 Alphabetical Index A Accidents: road 93-94 Age: at death 68 at marriage 72 at maternity 70 by nationality 16-17 by place of birth 16 of population 11-13 of travellers 14 Agriculture: accounts 185-186 area
Council of the European Union Brussels, 23 April 2018 (OR. en) Eugen Orlando Teodorovici, Minister of Public Finance, Ministry of Public Finance
 Eugen Orlando Teodorovici, Minister of Public Finance, Ministry of Public Finance") Council of the European Union Brussels, 23 April 2018 (OR. en) 8257/18 ECOFIN 354 UEM 125 COVER NOTE From: date of receipt: 23 April 2018 To: Subject: Eugen Orlando Teodorovici, Minister of Public Finance,
Council of the European Union Brussels, 23 April 2018 (OR. en) 8257/18 ECOFIN 354 UEM 125 COVER NOTE From: date of receipt: 23 April 2018 To: Subject: Eugen Orlando Teodorovici, Minister of Public Finance,
STATISTICAL YEARBOOK OF PORTUGAL
 Statistical Yearbook (Issue year 2008) 30 December, 2008 STATISTICAL YEARBOOK OF PORTUGAL Statistics Portugal released its main reference publication, Anuário Estatístico de Portugal (Statistical Yearbook
Quarterly Assessment of the Economy
 4 2 Quarterly Assessment of the Economy No. 17, Q IV/216 12 1 8 6 1 2 3 4 5 6 7 8 9 Summary Economic activity in euro area has continued to recover in 216, while in line with the CBK expectations, the
Romania Macroeconomic Situation
 November 13 Valentyn Povroznyuk, Radu Mihai Balan, Edilberto L. Segura GDP grew by.7% over 9 months of 13. Industrial production grew by.3% yoy in August 13. The consolidated budget deficit reached 1.3%
Ukraine and the Global Economic Crisis
 Ukraine and the Global Economic Crisis by Mykola Kulinich Ambassador of Ukraine to Japan 23 October, 2009 The Structure of the Lecture 1. General information about economy of Ukraine. 2.Ukraine and the
41.8 hours per week, respectively. Workers in the. clothing and chemicals and chemical products industries on average worked less than other
 CZECH REPUBLIC 3,500,000 3,000,000 2,500,000 2,000,000 1,500,000 1,000,000 500,000 5000 4000 3000 2000 1000 0 Fig. 1: Employment by Major Economic Activity ('000s), 2000-2008 2000 2002 2004 2006 2008 Source:
Republika e Kosovës/ Republika Kosova-Republic of Kosovo. Qeveria Vlada-Government
 Republika e Kosovës/ Republika Kosova-Republic of Kosovo Qeveria Vlada-Government Ministria e Tregtisë dhe Industrisë-Ministarstvo Trgovine i Industrije/Ministry of Trade and Industry Departamenti i Industrisë/Department
Valentyn Povroznyuk, Radu Mihai Balan, Edilberto L. Segura
 September 214 GDP grew by 1.2% yoy in Q2 214. Industrial output growth was equal to 1.4% yoy in June 214. The consolidated budget deficit narrowed to.2% of GDP in January-July 214. Consumer inflation slightly
Monetary and Foreign Exchange Policy of the National Bank of Moldova for 2004
 Monetary and Foreign Exchange Policy of the National Bank of Moldova for 2004 The monetary and foreign exchange policy and the main directions of the NBM activity set with the view to fulfilling the basic
NBS MoNthly BulletiN december 2017
 Published by: Národná banka Slovenska Address: Národná banka Slovenska Imricha Karvaša 1, 81 Bratislava Slovakia Contact: +1//787 1 http://www.nbs.sk Discussed by the Bank Board on 19 December 17. All
International Monetary Fund Washington, D.C.
 2007 International Monetary Fund February 2007 IMF Country Report No. 07/48 Ukraine: Statistical Appendix This Statistical Appendix for Ukraine was prepared by a staff team of the International Monetary
OFFICIAL DEVELOPMENT ASSISTANCE STATE CHANCELLERY JULY 9, 2015
 OFFICIAL DEVELOPMENT ASSISTANCE 2014 STATE CHANCELLERY JULY 9, 2015 SOURCES OF DATA COLLECTION 1. DEVELOPMENT PARTNERS 2. CENTRAL PUBLIC AUTHORITIES 3. AID MANAGEMENT PLATFORM (www.amp.gov.md) ODA DISBURSED
International Monetary Fund Washington, D.C.
 2004 International Monetary Fund May 2004 IMF Country Report No. 04/153 Barbados: Statistical Appendix This Statistical Appendix for Barbados was prepared by a staff team of the International Monetary
Kazakhstan: on the wave of structural reforms. Aset Irgaliyev, PhD First Deputy Chairman Economic Research Institute
 Kazakhstan: on the wave of structural reforms Aset Irgaliyev, PhD First Deputy Chairman Economic Research Institute September 2015 New economic reality: transformation of global economy Over the last 12
The Economic Letter December 2010
 ASSOCIATION OF BANKS IN LEBANON Research & Statistics Department The Economic Letter December 2010 Summary: Despite the deceleration in the activities of a number of economic sectors in the fourth quarter,
ST. VINCENT AND THE GRENADINES Tax Structure TYPE OF TAX TAX BASE TAX RATE EXEMPTIONS AND DEDUCTIONS Taxes on Income, Profits and Capital Gains
 1. TYPE OF TAX TAX BASE TAX RATE EXEMPTIONS AND DEDUCTIONS Taxes on Income, Profits and Capital Gains Basis for assessment is the previous calendar year; income including social security employees are
Doing Business in Moldova
 Doing Business in Moldova www.bakertillyinternational.com Preface This guide has been prepared by Baker Tilly, an independent member of Baker Tilly International. It is designed to provide information
Investment Policy of the Kyrgyz Republic in the Framework of Integration Process
 Investment Policy of the Kyrgyz Republic in the Framework of Integration Process The Center of Economic Research The National Bank of the Kyrgyz Republic Content Macroeconomic indicators Economic achievements
Quarterly Assessment of the Economy
 2 Quarterly Assessment of the Economy No. 4, Q III/213 12 1 8 6 4 1 2 3 4 5 6 7 8 9 Summary Economic activity in Kosovo has continued to grow also in Q3 213. In this context, it is worth mentioning the
Brexit s impact on Lithuanian exports. Export Club: Brexit April 26, Vilnius Thomas Notten Senior analyst Enterprise Lithuania
 Brexit s impact on Lithuanian exports Export Club: Brexit April 26, Vilnius Thomas Notten Senior analyst Enterprise Lithuania Content Brexit timeline Possible future trade regimes Incentives for a trade
DYNAMICS OF BUDGETARY REVENUE IN THE CONDITIONS OF ROMANIAN INTEGRATION IN THE EUROPEAN UNION - A CONSEQUENTLY OF THE TAX AND HARMONIZATION POLICY
 260 Finance Challenges of the Future DYNAMICS OF BUDGETARY REVENUE IN THE CONDITIONS OF ROMANIAN INTEGRATION IN THE EUROPEAN UNION - A CONSEQUENTLY OF THE TAX AND HARMONIZATION POLICY Mădălin CINCĂ, PhD
Economic Impact of Canada s Participation in the Comprehensive and Progressive Agreement for Trans-Pacific Partnership
 Economic Impact of Canada s Participation in the Comprehensive and Progressive Agreement for Trans-Pacific Partnership Office of the Chief Economist, Global Affairs Canada February 16, 2018 1. Introduction
Monthly policy monetary report October monetary policy monthly report
 Monthly policy monetary report October 2006 monetary policy monthly report OCTOBER 2006 October 2006 Monthly policy monetary report Main highlights Inflation developments Annual inflation in October experienced
The Economic Letter September 2018
 ASSOCIATION OF BANKS IN LEBANON Research & Statistics Department The Economic Letter September 2018 Summary: In the first three quarters of 2018, most real sector indicators retreated in relation to the
International Monetary Fund Washington, D.C.
 2006 International Monetary Fund February 2006 IMF Country Report No. 06/52 Vietnam: Statistical Appendix This Statistical Appendix paper for Vietnam was prepared by a staff team of the International Monetary
The Economic Letter July 2018
 ASSOCIATION OF BANKS IN LEBANON Research & Statistics Department The Economic Letter July 2018 Summary: In July 2018, real sector indicators progressed in relation to the preceding month. Both imports
Investment Attraction Team April, 2013 INVEST IN MOLDOVA
 INVEST IN MOLDOVA Dear Reader, This newsletter is written and sent to you by the Investment Attraction Team (IAT), working in the Prime Minister s Office. Our Team will be sending the newsletter once in
Ministry of Finance January March 2016
 1-Jan 1-Mar 1-May 1-Jul 1-Sep 1-Nov 1-Jan 1-Mar 1-May 1-Jul 1-Sep 1-Nov 1-Jan 1-Mar 1-May 1-Jul 1-Sep 1-Nov 1-Jan 1-Mar The Government of the Republic of Kosovo Macroeconomic Overview Ministry of Finance
Chart 1 Development of real GDP by quarters (year-on-year growth in %)
") A T E C 1 14 12 1 8 4 2-2 -4 I -9-12 -15 8/29B volume 17, Development of the real economy in the first quarter of 29 Viera Kollárová, Helena Solčánska Národná banka Slovenska The indicators of Slovakia
A T E C 1 14 12 1 8 4 2-2 -4 I -9-12 -15 8/29B volume 17, Development of the real economy in the first quarter of 29 Viera Kollárová, Helena Solčánska Národná banka Slovenska The indicators of Slovakia
Statistical appendix. 1. Prices. Costs of living. Retail prices. Monthly Report 9/2003. Table 1 Costs of living
 Statistical appendix 1. Prices Table 1 Costs of living IX.2003 IX.2003 I-IX.2003 VIII.2003 IX.2002 I-IX.2002 Costs of living Food Tobacco and beverages Clothing and footwear Housing Flat (rent, water,
INVESTMENT OPPORTUNITIES OF THE REPUBLIC OF MOLDOVA. Ministry of Economy of the Republic of Moldova
 INVESTMENT OPPORTUNITIES OF THE REPUBLIC OF MOLDOVA Ministry of Economy of the Republic of Moldova Favourable geopolitical position MOLDOVA TODAY A BRIDGE BETWEEN EAST AND WEST Population GDP growth rate
INTERSTATE STATISTICAL COMMITTEE OF THE COMMONWEALTH OF INDEPENDENT STATES
 INTERSTATE STATISTICAL COMMITTEE OF THE COMMONWEALTH OF INDEPENDENT STATES W O R K P R O G R A M of the Interstate Statistical Committee of the Commonwealth of Independent States for 2016 Moscow 2015 Approved
FEATURES OF FISCAL AND BUDGETARY POLICY FROM THE PERSPECTIVE OF COMPETITIVENESS
 FEATURES OF FISCAL AND BUDGETARY POLICY FROM THE PERSPECTIVE OF COMPETITIVENESS COMANICIU Carmen Abstract: In the content of the indicators of competitiveness (of the business environment, of the resources,
At IBISWorld, we know that industry intelligence is more than assembling facts: It's combining data and insight to answer the questions that
 At IBISWorld, we know that industry intelligence is more than assembling facts: It's combining data and insight to answer the questions that successful businesses ask IBISWorld Australia Business Environment
Mauritius Economy Update October 2013
 October 28, 2013 Economics Mauritius Economy Update October 2013 Mauritius, a tropical island situated towards the south east coast of Africa comprises 9 districts Flacq, Grand port, Moka, Pamplemousses,
ЕCONOMIC MONITOR. No. 10
 ЕCONOMIC MONITOR No. 10 OCTOBER TABLE OF CONTENTS 1 Introduction... 1 2 Total IRBRS investments... 2 2.1 Loans... 3 3 IRBRS loans and their impact on the economic structure... 4 4 Employment stimulation...
China, People s Republic of
 1 POPULATION Total population as of 31 December (million) 1,267.4 1,276.3 1,284.5 1,292.3 1,299.9 1,307.6 1,314.5 1,321.3 1,328.0 1,334.5 1,340.9 1,347.4 1,354.0 1,360.7 1,367.8 1,374.6 1,382.7 1,390.1
China Economic Outlook 2018 Feb 13, 2018
 Feb 13, Key Developments in Brief Economic Development Drivers of Growth Risks Predicted GDP growth of 6.5% in In 2017 growth exceeded the official target Service and modern production grow faster than
National Bank of Moldova. Translation. Annual Report. 1 Grigore Vieru Avenue MD 2005 Chișinău
 National Bank of Moldova Translation Annual Report 2014 1 Grigore Vieru Avenue MD 2005 Chișinău www.bnm.md E-mail: official@bnm.md Annual Report (NBM, 2014) Note The report was compiled using the latest
Annual Report Statistical Appendix. Rome, 31 May nd. Financial Year nd financial year
 Annual Report Rome, 31 May 2016 2015 122 nd financial year Financial Year 122 nd Annual Report 2015 122 nd Financial Year Rome, 31 May 2016 Banca d Italia, 2016 Address Via Nazionale, 91 00184 Rome - Italy
DEMOGRAPHIC SECURITY INTEGRATED TERRITORIAL INDEX (DSITI)
") POLICYPAPER Olga GAGAUZ, PhD in Sociology, Research Associate (RA) Irina PAHOMII, scientific researcher MARCH-APRIL 2016 MARCH-APRIL 2016 DEMOGRAPHIC SECURITY INTEGRATED TERRITORIAL INDEX (DSITI) SUMMAR
POLICYPAPER Olga GAGAUZ, PhD in Sociology, Research Associate (RA) Irina PAHOMII, scientific researcher MARCH-APRIL 2016 MARCH-APRIL 2016 DEMOGRAPHIC SECURITY INTEGRATED TERRITORIAL INDEX (DSITI) SUMMAR
Economic Update 9/2016
 Economic Update 9/ Date of issue: 10 October Central Bank of Malta, Address Pjazza Kastilja Valletta VLT 1060 Malta Telephone (+356) 2550 0000 Fax (+356) 2550 2500 Website https://www.centralbankmalta.org
Monthly policy monetary report November monetary policy monthly report
 Monthly policy monetary report 2006 Bank of Albania monetary policy monthly report NOVEMBER 2006 Bank of Albania 2006 Monthly policy monetary report I Main highlights Annual inflation rate in 2006 recorded
I. Continuing presence of some factors supporting the continuation of a low inflation level:
 Warsaw, 31 March 2004 INFORMATION FROM A MEETING OF THE MONETARY POLICY COUNCIL Held on 30-31 March 2004 On 30-31 March 2004 the Monetary Policy Council held a meeting. The Council read materials prepared
Invest in Moldova An insider s perspective. 3 February 2017 EBA MOLDOVA
 Invest in Moldova An insider s perspective 3 February 2017 EBA MOLDOVA EBA Moldova >50 Members European companies Moldovan companies exporters, service providers, etc. Member of European Business Organization
The Economic Letter March 2018
 ASSOCIATION OF BANKS IN LEBANON Research & Statistics Department The Economic Letter March 2018 Summary: In the first quarter 2018, most real sector indicators retreated with regard to the corresponding
EU Trade Policy and CETA
 EU Trade Policy and CETA http://www.youtube.com/watch?v=iioc5xg2i5y The EU a major trading power European Commission, 2013 The EU a major trading power % of global exports, goods, 2012 % of global exports,
Azerbaijan Export and Investment Promotion Foundation. Azerbaijan Country Presentation
 Azerbaijan Country Presentation Basics Establishment: 28 May 1918 Independence: 18 October 1991 Area: Population: Official Language: Government system: Membership in: 86.6 thsd km2 9.48 million Azerbaijani
The Analysis of the Situation of Foreign Direct Investments in Romania
 The Analysis of the Situation of Foreign Direct Investments in Romania Camelia Milea 1, Florin Bălăşescu 2 Abstract: Foreign direct investments represent one of the ways of financing any economy. But like
4. Balance of Payments and Foreign Trade
 24 4. Balance of Payments and Foreign Trade 4. Balance of Payments and Foreign Trade Current account deficit in 2014 was lower than the one realised in 2013 In the period January- November 2014, current