MOLDOVAN ECONOMIC TRENDS
|
|
|
- Jocelin Edwards
- 5 years ago
- Views:
Transcription


1 Academy of Sciences of Moldova Institute of Economy, Finance and Statistics Ministry of Economy of the Republic of Moldova MOLDOVAN ECONOMIC TRENDS Nr. 6 (Q II) 2012 ISSN Chisinau Supported by the European Union High Level Policy Advice Mission to the Republic of Moldova
2 ISSN AUTHORS: Alexandru Stratan, Marcel Chistruga, Anatolii Rojco, Alexandru Fala, Tatiana Colesnicova, Victoria Clipa, Viorica Septelici, Veronica Vragaleva, Alexandra Novac, Eugenia Lucasenco, Violeta Golea, Corina Gribincea, Zina Toaca Acknowledgements This initiative was supported by the EUHLPAM Project, funded by European Union and implemented by UNDP Moldova. The MET team would like to acknowledge the cooperation with public institutions: the Ministry of Economy, the Minister of Finance, the National Bank of Moldova and the National Bureau of Statistics. All rights reserved. No information in this publication cannot be reprinted or reproduced in any form without written permission of IEFS. The Moldovan Economic Trends is a quarterly publication, produced with the assistance of the European Union. The contents of this publication are the sole responsibility of Institute of Economy, Finance and Statistics and can in no way be taken to reflect the views of the European Union. Institute of Economy, Finance and Statistics For additional information please contact us: Institute of Economy, Finance and Statistics 2064, RM, Chisinau, Str. Ion Creanga, 45 Tel: ( ) , Fax: ( ) e mail: iefs@iefs.md, web site:
3 CONTENTS The main political, economic and social events in the Republic of Moldova... 7 Edition summary Chapter I. PRODUCTION Chapter II. PRICES AND EXCHANGE RATES Chapter III. FINANCE Chapter IV. EXTERNAL SECTOR Chapter V. BUSINESS ENVIRONMENT Chapter VI. SOCIAL SECTOR FORECAST FOR THE DCFTA BETWEEN MOLDOVA AND THE EU A RISK ASSESSMENT... Jörg Radeke, German Economic Team Moldova COMPARING AN ECONOMY S OUTPUT BEFORE AND AFTER THE BEGINNING OF TRANSITION: A GENERAL ANALYSIS WITH EMPHASIS ON THE CASE OF MOLDOVA... Apostolos Papaphilippou INSTITUTIONS, DEVELOPMENT AND THE REFORM OF MOLDOVA S JUSTICE SYSTEM... Dr. Andrea Lorenzo Capussela STATISTICAL ANNEX
4 GENERAL DATA Official name Capital Head of State President of the Parliament Prime Minister Parliament of the Republic of Moldova REPUBLIC OF MOLDOVA Kishinev Nicolae Timofti, President of the Republic of Moldova Marian Lupu Vlad Filat 101 deputies (the Communist Party of the Republic of Moldova 39, the Liberal Democrat Party of Moldova 31, the Democrat Party of Moldova 15, Liberal Party 12, unaffiliated deputies 4) Independence was obtained on August 27, 1991 Area 33.8 thousand km 2 Administrative units Stable population Main religions Official language National currency 32 districts, 5 municipalities (Chisinau, Balti, Bender, Comrat, Tiraspol), UTA Gagauzia, Administrative territorial units from the left of the Dniester 3,560.4 thousand Orthodox Romanian Moldovan Leu (1 USD = MDL, 1 EUR = MDL) 4
5 ABBREVIATIONS ATP ATU AVE BMA CEFTA CIS CPI CR DCFTA EBRD EC EPC EU FDI GAP GATS GDP GSP GVA HACCP HHI IDA IEFS IIPP IMF IOM IPA MAFI MDL MET MF MFN MFO Autonomous Trade Preferences Autonomous Territorial Unit Ad Valorem Equivalent Bureau for Migration and Asylum Central European Free Trade Agreement Commonwealth of Independent States Consumer Price Index Concentration Ratio Deep and Comprehensive Free Trade Agreement European Bank for Reconstruction of Development European Commission Effective Protection Coefficient European Union Foreign Direct Investment Good Agricultural Practice General Agreement on Trade in Services Gross Domestic Product Generalised System of Preferences Gross Value Added Hazard Analysis and Critical Control Points Herfindahl Hirschman Index International Development Association Institute of Economy, Finance and Statistics Index of Industrial Products Prices International Monetary Fund International Organization for Migration Intellectual Property Rights Ministry of Agriculture and Food Industry Moldovan Leu Moldovan Economic Trends The Ministry of Finance Most Favoured Nation Microfinance Organization 5
6 NBC NBM NBS NCFM NEER NPB NPC ODSME PCA PPI RCA REER SDR SITC SME SPS TBT TN TRC TRQ UN USD VAT WTO YoY National Bank Certificates National Bank of Moldova National Bureau of Statistics National Commission of Financial Market Nominal Effective Exchange Rate National Public Budget Nominal Protection Coefficient Organization for Development of Small and Medium Enterprises Partnership and Cooperation Agreement Production Price Index Revealed Comparative Advantage Real Effective Exchange Rate Special Drawing Rights Standard International Trade Classification Small and Medium Enterprises Sanitary and phytosanitary measures Technical Barriers to Trade Transnistria Total Regulatory Capital Tariff Rate Quota United Nations US Dollar Value Added Tax World Trade Organization Year on Year 6
7 MAIN POLITICAL, ECONOMIC AND SOCIAL EVENTS FROM THE REPUBLIC OF MOLDOVA The second quarter of 2012 had the following economic, political and social events: April 02 The draft law regarding the ratification of the second Additional Protocol between the Government of Romania and the Government of the Republic of Moldova on the implementation of the technical and financial assistance program based on a non reimbursable financial aid in value of 100 million EUR granted to the Republic of Moldova by Romania was approved by the Romanian Senate. April The President of the Council of Europe Parliamentary Assembly made an official visit in the Republic of Moldova, and met with the speaker of the Parliament of the Republic of Moldova, Mr. Marian Lupu. At the meeting topics were discussed about the implementation of the commitments and obligations assumed by the Republic of Moldova when joining the Council of Europe, and aspects related to the development and implementation of political and democratic reforms. April 06 The launch of the Program for supporting and development of the sector of small and medium enterprises for promoting efforts regarding structural economic adjustments was announced. The respective program is financed from the account of the Partner Funds of the Japanese Grant, in value of 15 million MDL. The goal of the program is to facilitate the procurement by the representatives of the SME sector of manufacturing equipment. April 06, 2012 Electricity operator Energocom of the Republic of Moldova signed an electricity supply contract for 2012 with company DTEK Power Trade of Ukraine. The price for a kilowatt was set at 6.9 cents, although initially the Ukrainian company requested 7.5 cents. The contract was signed until the end of the year and shall fully cover the necessary consumptions of S.A. RED NORD and S.A. RED NORD VEST, which ensure electricity for the consumers from Northern Moldova. April 26 The Board of Directors of the National Bank of Moldova decided to maintain the monetary policy interest rate on the current level of 4.5%, and the norm of minimal mandatory reserves in Moldovan lei and foreign currencies on the current level of 14% of the calculation basis. At the same time, it was decided to decrease the basic rate for long term credits (more than 5 years) by 1%, from 6% to 5% a year. These measures shall create premises for the moderation of the antiinflation pressures, which were recently consolidated. May 11 The National Agency for Regulation in Energetics approved the new fees for electricity. Thus, RED Union Fenosa consumers shall pay 1.58 lei for one kwh. The increase compared to the current fee is 6.8%, namely 10 bani more for one kwh. Red Nord shall provide electricity at an average fee of approximately 1.71 lei for one kwh or 8.9% more. The household consumers from the RED North West distribution area shall pay 1.73 lei/kwh or 10.2% more. 7
8 May 18 The European Bank for Reconstruction and Development shall grant to the households of the Republic of Moldova 35 million EUR for reducing the consumption of energy and decreasing invoice payments by a new project "Facilitating Financing in the Field of Energy Efficiency in the Residential Sector of Moldova". The project is designed to encourage households to use the energy resources of the state more efficiently and to reduce the costs of electricity invoices for household use. May 22 The Prime Minister of the Republic of Moldova, Mr. Vlad Filat, and the EBRD Manager for Caucasus, Moldova and Belarus, Mr. Paul Henri Forestier, signed an agreement which provides EBRD granting a loan of 20 million USD for modernizing the power infrastructure of the Republic of Moldova. The loan reimbursement period is 15 years, with a grace period of 3 years. It is estimated that the project shall be completed until April 30, May 28 The Government of the Republic of Moldova and the World Bank signed two agreements which provide the granting of an investment loan of 28.4 million USD, within the implementation of project "Competitiveness in agriculture" The goal of the project is to increase competitiveness in the agricultural and food sector of Moldova by supporting the modernization of the food safety management system, facilitating the access to markets of agricultural manufacturers and integrating environmental and sustainable land management agricultural practices. The first agreement involves an investment loan granted by the International Development Agency, and the second an investment agreement granted by the Global Environment Fund. May 28 By reassessing the risks corresponding to the medium term prospects of inflation, the Board of Directors of the National Bank of Moldova decided that the interest rates for monetary policy instruments would remain at the current level. Thus, the rate applied to the main short term monetary policy operations remains 4.5% a year, the rate of overnight credits 7.5% and that of overnight deposits 1.5% a year. The norm of mandatory reserves obtained in Moldovan lei and in non convertible foreign currencies, and the norm of mandatory reserves from resources obtained in freely convertible currencies remains on the level of 14%. May 29 On May 29, 2012, the meeting of the Parliamentary Committee of Cooperation between EU and the Republic of Moldova took place, with the participation of members from the Parliament of the Republic of Moldova and the European Parliament, and representatives of the European Commission. At the reunion the participants discussed topics related to the evolution of the relations between the Republic of Moldova and the European Union, the progress and problems regarding the negotiation of the Treaty of Association between the Republic of Moldova and EU, including those regarding the compliance with the requirements for concluding the Agreement on the Area of Free, Complex and Complete Trade (DCFTA). June The second round of negotiations regarding the Agreement for the creation of the Area of Complex and Complete Free Exchange RM EU took place. A consensus was reached at the negotiations and a legal text was agreed by both parties regarding the 13 chapters of the document. The two parties especially discussed the chapters regarding competition and the state aid whereby the Republic of Moldova is to assume the obligation of fully taking over and 8
9 applying the European legislation in these fields. Another chapter refers to the public purchases which would impose the takeover of the entire package of European norms regarding this sector. Another open subject is represented by the negotiations on the field of services. The parties decided that the Republic of Moldova and EU would draft concrete offers. At the same time, one of the most sensitive fields under discussion was the negotiation of the customs fees applied between RM and EU. June 26 The perfume and cosmetics manufacturer "Viorica Cosmetic" was sold for the amount of 51 million MLD, and "DAAC Hermes Group" became the new owner of the company. It is estimated that the activities of the company will not be changed, but there are import plans. June 26 The Prime Minister of Moldova, Mr. Vlad Filat, and Mr. Wilhelm Molterer, Vice President of the European Investment Bank, signed an agreement which provides the granting to the Republic of Moldova a credit of 17 million EUR for the modernization of electricity transmission networks. The project will contribute to the enhancement and improvement of the electricity transmission system, in order to bring it closer to the European network of electricity transmission operators (ENTOSO_E) The project includes the modernization of key points, such as: substations, transmission lines and expired transformers. June 26 The agreement on creating a joint air space between the Republic of Moldova and the European Union was signed at Brussels. The effectiveness of this agreement involves the harmonization of the national legislative framework of RM with that of EU and shall lead to the improvement of the safety and quality of air transportation services of the Republic of Moldova. June 29 The European Union is to grant the Republic of Moldova additional support of 28 million EUR as a grant, within the Vicinity and Partnership Instrument. The money is offered for 2012 and represents an increase of 30% of the support granted by the European Union by this instrument this year. June 29 The Board of Directors of NBM decided to maintain the interest rates of monetary policy instruments of NBM on the current levels. Thus, the rate applied to the main short term monetary policy operations remains 4.5% a year, the rate of overnight credits 7.5% and that of overnight deposits 1.5% a year. The norm of mandatory reserves obtained in Moldovan lei and in non convertible foreign currencies, and the norm of mandatory reserves from resources obtained in freely convertible currencies remains on the level of 14%. 9
10 EDITION SUMMARY Production In the first half of the year, subject again to external shocks, national economy has crossed a difficult road, registering a growth of only 0.8%. The evolution of GDP components are modest during this period, GVA increased by 0.9%, industrial production by 0.1%, with major differences in growth rates achieved in previous years. At the level of economic sectors in terms of negative impact on economic activity, after a low level of consumption, the most difficult situation is observed in agricultural production, decreasing in the first half. Because of the natural phenomena of frost and drought in recent periods, plant production declined sharply. Prices and exchange rates In the first half of 2012 the index of consumption prices increased by 5.1% compared to the similar period of last year. In the 2nd quarter of 2011, the increase of prices was attenuated, and the inflation level was 4.2%. The main cause which determined the attenuation of the price increase rates in the 2nd quarter was the decrease of pressures from international prices for food products, which recorded a descending trend in this period. One must mention that the unfavorable weather conditions shall cause the increase of the prices of agricultural and food products, an evolution which shall be materialized in a long term trend, at least until the end of the year. In the first half of 2012 the evolutions of prices in the economy sectors are not uniform: In the first 2 quarters of 2012 there is an attenuation in the evolution of the industrial production price index: in the first quarter the prices of industrial production recorded a 7.8% increase compared to the same period of 2011, and in the 2nd quarter the increase was already 5.8%. Building prices are on the rise, an evolution which started in the 2nd quarter of In the 2nd quarter of 2012, compared to the similar period of last year, prices increased by 10.6%. In the 1st half of 2012, the prices of agricultural products decreased by 2.3% compared to the similar period of last year. The unfavorable economic evolutions in the EURO area are also reflected in the ratio of the national currency towards EURO. In the 2nd quarter of 2012 there was an average exchange rate of 15.4 MDL/ EUR, which represents a 7.2% increase of the national currency, compared to the similar period of After the increase of the sole currency of January 2012 in the following months the leu continued to increase. Starting with August this trend changed the European sole currency started to regain its strength in relation to the Moldovan leu. On the other hand, in the first half of 2012 the average exchange rate of the national currency in relation to USD was MDL/USD, US dollar appreciated with 0.4% compared to the similar period of This tendency has started in April 2012 and continues in the 3rd quarter. These evolutions are associated with the intensification of the activity of NBM on the currency market, which starting with the 2nd quarter and especially in the 3rd quarter procured important foreign currency amounts. Public finances The dominant part of the national public budget continues to be made up of fiscal revenues, maintaining the trend of prevailing indirect revenues in relation to direct ones. It is notable that compared to the similar period of last year, the revenues from grants decreased by 147 % or by 10
11 216.4 million MDL, and their weight from the total revenues increased by 1.5 percentage points in the first half of 2012 year compared to the similar period of An analysis of the structure of expenses from NPB in the 2nd quarter of 2012 shows that the predominant part continues to be social expenses, followed by economic expenses. The state budget in the 1st half of 2012 has a deficit of million MDL. The main financing sources of deficit are: net revenues from the sale of state securities, loans from external sources, assets from the sale and privatization of the public patrimony, etc. At the June 30, 2012 the state debt was composed of 70.2 % external state debts and 29.8 % internal state debts. The increase of internal debt is mostly due to the additional issue of state securities on the primary market. The weight of state securities with maturities up to 1 year from the total state securities sold by tenders was 96.4% We find that in the internal state debt depending on the maturity the highest weight is that of the short term internal debt (91.2 %), followed by medium term internal public debt (8.8 %), and long term internal public debt is completely absent. By analyzing the external state debt depending on the maturity, we find that it is completely made up of the long term external public debt a situation that is similar to that recorded at the end of It is worth mentioning that in the report as of , besides the short term external debt, the external state debt also comprised medium term commitments, and their weight is insignificant (less than 1%). As an evolution, we notice the ascending trend of the external state debt to multilateral creditors. At the same time, the external state debt to bilateral and commercial creditors continued to drop. Banking sector In the first 6 months of 2012, the evolution of the banking sector of the Republic of Moldova recorded a positive development trend. At the same time, in the context of the decrease of economic activities and the aggravation of the financial crisis in EU, the banking sector was also affected by the weakening of the quality of banking portfolios (quality of bank credits). Consequently, in the first half, bad credits in absolute value increased by 24.3% compared to the beginning of 2012 and amounted to million MDL. On June 30, 2012, the weight of bad credits in the total credits was 15.3 %, 2.4% higher than January 02, Since the beginning of 2012, the volume of granted new credits increased, which affected the results of the 1st half of There was a decrease of new credits granted by banks, from million MDL in January 2012 to million MDL in June 2012, a 64.2% increase. The volume of credits granted in MDL in June 2012 was million MDL, an increase of million MDL, 15% more than May. Throughout 2012 there has been constant decrease of the interest rate for the credits granted in the national currency. In June 2012, the average interest rate for the credits granted in the national currency was 13.69%, and the average rate for the deposits in lei was 7.59 %. The average interest rates for the deposits in foreign currencies also decreased from 4.03% in January 2012 to 3.79% in June The banking margin for the operations in the national currency decreased from 7.65 % in January 2012 to 6.1% in June At the end of June, the net revenues in the banking system were million MDL, up by 53.9% compared to the similar period of The improvement of the situation is due to the increase of interest revenues by 10%, and the exclusion of the divisions designed for reducing the losses of assets in the calculation of profits. 11
12 Monetary policy In the first half of 2012, monetary indicators recorded an ascending evolution. At the same time, uncertain evolutions of the national economy conditioned the relaxation of the monetary policy. The rates of the monetary policy instruments decreases in the first quarter of 2012, while in the 2nd quarter their level remained constant. In the 2nd quarter NBM intensified its intervention on the currency market. In order to depreciate the Moldovan leu in relation to the reference currencies (thus decreasing the prices of exported products and stimulating the competitiveness of Moldovan commodities on external markets) NBM resorted to currency procurements. Social sector Demographic situation. The resident population of the Republic of Moldova as of January 01, 2012 was 3,559.5 thousand persons, 0.9 thousand persons less than on the same period of The population by area: urban population 1,485.7 thousand persons, or 41.7% of the total population; rural population 2,073.8 thousand persons, or 58.3%; population by gender: men 1,711.7 thousand persons or 48.1%, women 1,847.8 thousand persons or 51.9%. The structure of the population by age groups is characterized by the weight of population under the active age of 17.5%, 66.6% active population, and 15.9% above active age. The population aging was The total number of live births in the country was 18,979 persons or 10.7 persons per 1,000 inhabitants. The total number of deceased in the country was 20,836 pers. or 11.8 pers. per 1000 inhabitants. The number of deaths dropped by 3.7% compared to previous year. The number of infant deceased was 180 persons or 9.5 infant deceased per 1,000 live births. The natural decrease of the population was 1.1 pers. per 1,000 inhabitants, compared to 1.5 in the 1st half of The total number of marriages in the country was 8,698 or 4.9 marriages per 1,000 inhabitants, a 9.9% decrease compared to the same period of last year. The total number of divorces in the republic was 5,432 or 3.1 divorces per 1,000 inhabitants, 2.7% less than the same period of last year. Population migration. In January June 2012, 1,141 foreign citizens and 222 repatriates received residence permits (permanent and temporary). The structure of immigrants by arrival purpose, was dominated family immigrants 41.4%, for work 39.0%, for studies 6.2%, other causes 13.4%. By the country of emigration, foreign citizens are immigrants from: Ukraine, Romania, Turkey, Russian Federation, Italy, USA, Portugal, Germany, Syria, France, other countries. Labour market. In the second quarter of 2012, the economically active population of the Republic of Moldova was 1,266.9 thousand persons, on 4.7% ( 61.8 thousand) less than in the second quarter of The structure of the active population was modified as follows: the share of employed population increased from 93.8% to 95.5%, and the share of unemployed population decreased from 6.2% to 4.5%. Activity rate of the population aged 15 years and over was 42.5%, and decreased compared to the respective quarter of previous year (44.7%). The number of employed population was 1,209.3 thousand persons, 3.0% less than the 2nd quarter of Employment rate of the population aged 15 and over was 40.5%, a 1.3% decrease compared to the 2nd quarter of The number of unemployed persons, according to the International Labor Office definition, was 57.6 thousand pers., 25.0 thousand pers. less than the 2nd quarter of The unemployment rate on country level was 4.5%, lower compared to Q II 2011 (6.2%). Household disposable income. In the 2nd quarter of 2012, household disposable income was 1,523.1 MDL in average per person monthly, with an increase of 6.0% compared to the similar period of last year. In real terms, household income increased by 1.9%. The urban household disposable income was in average, MDL or 1.5 times higher than those of the rural household disposable income. 12
13 Household consumption expenditure. The average monthly household consumption expenditure in the 2nd quarter of 2012 for a person was 1,582.6 MDL, 3.9% higher than in the same period of last year. In real terms, the population spent in average 0.2% less than the 2nd quarter of last year. Remuneration of labour. The gross nominal average salary in the national economy in January June 2012 was 3,391.1 MDL, a 9.3% increase, compared to similar period of the previous year. The highest salary by the types of economic activities was recorded in the financial sector 6,704.4 MDL; in real estate transactions, leasing and services provided to companies 4,134.0 MDL; transport and communications 4,045.9 MDL. The lowest salary was in fishing 1,538.6 MDL; in agriculture, hunting and forestry 1,944.1 MDL. The gross nominal average salary in the national economy in June 2012 was 3,913.5 MDL, a 10.0% increase, compared to June 2011 and 12.1% compared to May Subsistence minimum. The size of the subsistence minimum in the 2nd quarter of 2012 in average for one person was 1,455.1 MDL, at the level of the 1st quarter. At the same time, compared to the Q II of 2011, the subsistence minimum decreased by 3.2% given that the Index of Consumer Prices for food products was 101.9%. The increase of the subsistence minimum was determined by the increase of prices, especially in food products. Social protection of population. According to the National Agency of Social Insurance, the number of pensioners registered by the social protection institutions as of July 01, 2012 was thousand persons, or 15.1 thousand persons more compared to July 01, The average value of the monthly (indexed) pension, established on July 01, 2012, was MDL, 9.3% more than July 01, Healthcare. The morbidity of the population by some infectious diseases in January June 2012 is characterized by most cases of diseases, such as viral hepatitis 86 cases or 2.4 cases for 100 thousand people, acute intestinal infections 8,664 cases or cases for 100 thousand people, tuberculosis of the breathing apparatus 1,690 cases or 47.5 cases for 100 thousand people, chicken pox 6,307 cases or cases for 100 thousand people. At the same time, there were fewer cases of flu (210 cases compared to 4,567 cases in January June 2011) and acute infections of the respiratory tract with multiple localizations (109.8 thousand cases compared to thousand). Crimes. According to the Ministry of Internal Affairs, in January June 2012 there were 16.9 thousand crimes, or 2.8% more than in the same period of previous year. Out of the total number of crimes, approximately two thirds are reported in urban areas. In average, for 10 thousand people there are 47 crimes. The highest level of crimes was recorded in the city of Balti 69 crimes for every 10,000 people. A high level of crimes was also recorded in the city of Chisinau 67 crimes for every 10,000 people, and the district of Criuleni 51 crimes for every 10,000 people, and the lowest level of crimes was in Falesti district 20 crimes for every 10,000 people. Business environment In the first semester of 2012 compared to the same period of last year, there is a decreasing trend related to the number of companies registered in the State Chamber of Registration, with an index of 91.4%. Thus, according to the State Chamber of Registration, 3,256 companies were registered in the State Register between January June The number of deregistered entities in the first semester of 2012 was 1,612 units or 8.6% less than in the same period of last year. According to NBS data, between 2010 and 2011 there was an insignificant but constant increase of the number of companies: from 46.7 to 48.5 thousand companies, and the index was 103.9%. 13
14 Between 2010 and 2011, the same as in previous years, there is a decreasing trend in the average number of company employees (with an index of 97.0%). In the SME sector, between 2010 and 2011, there was also a decrease trend of the number of employees (the index was 95.07%). On the contrary, the group of micro companies recorded in the given period an increase of the average number of employees (the index was 108.9%). In 2011 compared to 2010 there is an increase of the turnover (with an index of 117%). According to the data of the NBS in January June 2012, there was an increase of 2.9% (in comparable prices) of the revenues from sales for the companies operating in retail compared to the same period of In companies mainly operating in wholesale, in the same period, there was an increase of 3.9% (in current prices). A higher turnover increase for wholesale was recorded by the entities of Kishinev (6.3%) and the Southern region (6.6%). Companies from the North, Center and ATU Gagauzia regions recorded significant decreases of the turnover compared to January June External sector The analysis of the balance of payments of the Republic of Moldova in the 1st semester of this year reflects a slight decrease of the deficit of the current account and of the profit of the financial account, on the other hand. In general lines, this period can be characterized by an attenuation of the increase of the main external flows of goods and capital foreign trade and remittances, even a visible decrease of FDI inflows. In January June of this year the increase of remittances followed the decreasing trend recorded starting with the second half of the previous year. In this period the volume of remittances was million USD, 9.9% higher than the similar period of the last year. Approximately 59.3% of remittances came from the Russian Federation, recording an increase of 17%, an above average value for this semester. The moderate increase of remittances in the first semester seems to be mostly caused by the still unstable economic situation in EU countries which have direct influence on the volume of remittances, and also of the recorded value, given the depreciation in this period of the Euro currency related to the USD. Not even the evolution of the inflows of foreign direct investments can be characterized as good. Moreover, the value of net FDI inflows in the national economy in the 1st semester of 2012 was unexpectedly low, 88.5 million USD, 34.9% lower than the similar period of the last year. Thus, at the end of the first semester of this year, the FDI stock in the national economy was million USD. The increase of investments in the share capital in this period could not compensate the effects of the attenuation of foreign investments performed from the account of reinvested revenues and the decrease of intra group credits, in order to ensure a trend of positive growth of the inflows of FDI compared to the similar period of last year. Also, in tandem with the other afore mentioned external flows, in the first two quarters one can notice a progressive attenuation of foreign trade with goods. In the first 6 months of the year, the value of foreign trade transactions was 3.5 billion USD, an increase of only 4%, or million USD compared to the previous year, and in the similar period of the last year the increase was 1.09 billion USD. In this period there were very modest evolutions both for imports and exports. Although the average rate of exports seems to exceed that of imports, their level was very low exports 1.04 billion USD, an increase of 4.6% (46.2 million USD) more than in the similar period of the last year, and imports amounted to 2.46 billion USD, an increase of 3.6% (86.3 million USD). The recorded commercial balance was 1.4 billion USD, 2.9% higher than in the similar period of the last year. 14
15 The decrease of the value of foreign trade, both imports and exports, was caused by a decrease of unitary values and of the traded volume. These modest evolutions seem to have been influenced by the reduction of exports of agricultural products following the unfavorable agricultural season from this year, of the products from the industries integrated in the international value chain, and of other manufactured products (which are subject to typical re export operations) following the decrease of external demand, especially in European countries, and the decrease of world prices for some products. Regarding imports, the very modest evolutions seem to have been caused by the still slow recovery of end consumption in the post crisis period (2009), and the demand of intermediary goods for the Moldovan industry, which recorded poor evolutions in the first half of the year. 15
16 Chapter I PRODUCTION Between January and June 2012, GDP was million lei in current prices, 0.8% more than in the similar period of 2011, which represents a rather modest evolution compared to The respective performance was reached due to the positive influence of the value of GDP obtained in the 1st quarter with an increase of 1% compared to the same period of last year. This is an insignificant increase because, as shown in the below figure, the economy of the country entered in a declining phase, so we may say that in the following quarters of the year we expect even more drastic decreases of the GDP growth rates. Because of this year drought agricultural production declined dramatically. A compensatory factor is the tax exception of agricultural entities in 2012, but without any heavy impact on the GDP Q Q Q Q Q Q Q1 Q sem.i 2009 sem. I 2010 sem. I 2011 sem. I 2012 Annual growth rate of GDP,% Annual growth rate of GDP,% Annual growth rate of GDP, 2009 Q1=100,% Annual growth rate of GDP, sem.i 2009=100 Figure 1.1. GDP growth rate compared to the previous year, Source: Author's calculation according to NSO data. Gross domestic product by categories of resources In the first 6 months of 2012, GDP components by categories of resources suffered major turbulences. Compared to the previous period of last year, the net product taxes decreased by 0.1%, with a weight in GDP of 15.8%, exceeded by the increase of GVA growth rate by 0.9%. Among the components of GVA, we notice a trend of decreasing growth rates in the agricultural sector accompanied by an increase of its weight in GDP, both in the first half and in the 2nd quarter of Agricultural production, in the first half, recorded a decrease of 5.2% compared to the similar period of 2011, and the evolution of agricultural production in the 2nd quarter was even more modest, and recorded a 7.5% decrease. We emphasize some positive trends in other components of GVA, as in the first half industry was the main factor which contributed to the economic growth, with an increase of 1.1% in the 1st half and 4.3% in the 2nd quarter, compared to the same periods of 2011, compared to the fragile increase of GVA in services by 1.9%. A significant contribution was recorded by the wholesale and retail trade sector, contributing to the increase of GDP by 4.1% in the 1st half, and transport and communications by 0.8%, compared to the similar period of the previous year. 16
17 Q. II 2009 Q. II 2010 Q. II 2011 Q. II 2012 GVA growth in agriculture, 2009 QII=100, % GVA growth in industry, 2009 QII=100, % GVA growth in services, 2009 QII=100, % Figure 1.2. Evolution of VAB indicators by categories of resources, compared to the previous year, , % Source: Author's calculation according to NSO data. Gross domestic product expenditure elements By analysing the situation created on the EU market where several states are declared in crisis situations, we notice that the given situation has negative effects on the national economy. In the first 6 months of this year there was a decrease of the end consumption of population households because of the unemployment phenomenon created on the national and international labor market, where more than a quarter of national residents operate, thus contributing to the decrease of remittances and salaries. Investments financed from the state budget increased in the first half of 2012 by 64.1%, thus making possible an increase of 6.1% in Gross Capital Formation sem. I 2009 sem. I 2010 sem. I 2011 sem. I 2012 Household final consumption Final consumption of admin. public and private Gross fixed capital formation Change in inventories Figure 1.3. Structure by categories of expenses of GDP, % Source: According to NSO data. 17
18 For the 1st half of this year the weight of the exports of goods and services from GDP recorded an insignificant decrease compared to the previous period of only 0.7 p.p. and the imports of goods and services decreased by 1.3 p.p. Domestic demand continues to be an important key component of GDP formation, but much lower than in the similar period of last year with 0.6 p.p, thus its weight decreased to 142.4%. This reduction was caused by the decrease of household expenses for services by 1.1% Q.I 2008 Q. II 2008 Q. I 2009 Q. II 2009 Q. I 2010 Q. II 2010 Domestic demand in GDP, % Q. I 2011 Q. II 2011 Q. I 2012 Q II 2012 Figure 1.4. Weight of internal demand in GDP, % Source: Author's calculation according to NSO data. Investments in long term tangible assets Total investments in long term tangible assets decreased in the first half of the year by 0.6% compared to the previous year, especially those from the private sector with 3.7%, which caused modifications in the business sector. The most significant investments were in dwelling construction, which recorded a 2% increase. By analysing the situation of investments by technological structure, investments increased in construction assembly works by 3.6% and in other capital works and expenditures by 63.9% sem. I 2009 sem. I 2010 sem. I 2011 sem. I 2012 public private Figure 1.5. Evolution of investment increase indexes, % Source: According to NSO data. 18
19 Analysing in terms of ownership, in January June 2012 the largest share in total investment in long term tangible assets is held by private institutions, with a share of 46.7%, followed by 30.4% public. Note that the growth rates of private investment fell by 3.7% compared to the same period last year. Production of goods and services Industry In the first half of this year industrial production registered marginal positive changes, increasing by 0.1% compared to the similar period of last year. The positive evolution in the first half of the year was influenced by an increase of 6.5% in mining and quarrying industry. Thus, the most dynamic sector was mining and quarrying industry, followed by manufacturing industry sem.i sem.i sem. I sem.i sem.i 2011 Industrial production index, f a p,% sem.i 2012 Industrial production index, (sem. I 2007=100) January February March April May June July Industrial production volume indices, f p a, % Industrial production index seasonally adjusted, % Trend Figure 1.6. Evolution of the index of industrial production, % Source: Author's calculation according to NSO data. On the level of the sector of industrial production, the situation is different in the first half of the year. The production delivered in this period amounted to million MDL, and exceeded the manufactured production of this half by 2.8%, because the market delivery included products in stock, especially those from the processing industry. The biggest share on the market continued to be that of internal deliveries with 68.95%. As this was a problematic year because of natural calamities, there was a constant increase of meat products and meat processing by 19.9%, manufacture of dairy products 7.5% which in any period of the year has a symmetric distribution, regardless of the production factors being used, either produced on the internal market or imported. Currently the production of alcoholic beverages and wine have a growth rate of 9.5% compared to the similar period of last year. Trends of decreasing production compared to the similar period of last year are recorded also in clothing and fur mending ( 19.1%), manufacturing cardboard and paper ( 14.2%) and products from the metallurgical industry, especially manufacture of machinery and equipment ( 28.3%), and one of the causes was the reduction of public investments and the absence of qualified specialists. There were increases for production of electrical machinery and equipment by 32.5%, production of medical equipment and devices 80.6%. Agriculture In the first half in RM there was a volume of agricultural production in value of 3738 million lei, 2.1% less than the similar period of last year, compared to the increase of the 1st half of 2011 of 3.9%. 19
20 sem. I 2008 sem. I 2009 sem. I 2010 sem.i 2011 sem.i 2012 Figure 1.7. Index of the agricultural production index, , % Source: Author's calculation according to NSO data. The created situation was influenced especially by the recession from the vegetable sector, which considerably decreased compared to the similar period of last year, by 15.4%. However, animal production increased by 0.6% due to seasonal reproduction factors, the increase was particularly obtained in the 1st quarter. The official data records an increase of seeded areas of vegetables by 1.5% and of grains by 4.5%, for which a below average harvest decrease per hectare is envisaged because of this summer drought. As afore mentioned, animal production increased in this period, generating an increase of meat production (+4.5%), at the same time the production of milk and eggs decreased by 0.4%, respectively by 14.6%, thus producers faced systematic problems in the production process. Also, there were increases especially regarding the number of sheep and pigs (+7.6% and +6.8%). Trade and services Agricultural production volume index, % Agricultural production volume index, sem. I=2008,% In the first half of 2012, services recorded positive trends. The value of the turnover for the companies whose main activity is market services provided to the population increased by 5% due to the growth rate of April of 9.5%, at the same time there was an increase of the turnover sem. I 2011 sem.i 2012 Retail Services rendered Market services firms january March May July September November January March May July Retail Services for enterprises Figure 1.8. Indexes of the turnover for trade and services, , % Source: According to the data provided by NSO. 20
21 volume in retail trade of 1.3%, but the evolution of retail trade in the second quarter decreased by 1.2%, these branches being the most important sources of growth in the respective sector. Market services provided to companies had a lower influence (+0.5%) in the first half. Transportation In the first 6 months of this year commodities worth million lei were transported, 4.4% less than in the similar period of last year, a situation caused by railway transportation, which decreased by 16.4% because of the increase of the average periods of trains staying in stations, and the average duration of train car loading and unloading. An important factor was also the cease of railway activities on railway route Giurgiulesti Cahul. The number of passengers transported by public transportation means decreased by 0.4%, but the number of passengers increased by 2.7%, especially influenced by river, air and bus transportation. Communications In January June 2012, the number of Internet service subscribers increased considerably compared to the end of last year (8.4%), where 64.76% of users were connected to SA Moldelecom, 12.5% to Starnet and 12.4% to Sun Communication, and the remaining 10.09% to Orange and Moldcell etc. At the same time, there was a 20.2% increase of the number of 3G mobile Internet users. In the first half of the year there was an increase in revenues derived from data transmissions and landline Internet access (14%), mostly held by SA Moldelecom, SA Orange, SRL Starnet. In this period there was an increase in the services provided to the population as payment of indemnifications, allowances, by post offices (2.7%), and there were decreases in the distribution of magazines and newspapers ( 8.9%). Tourism In January June, travel agencies provided services worth 11.9% more than in the similar period of last year. There were significant increases on the level of outgoing and incoming tourism, by 14.9% and 12.6%, but the number of outgoing tourists exceeded the number of incoming tourists by 2.3%. The highest weight of Moldovan travellers abroad was to Bulgaria 33.9%, Turkey 33.4% and Romania 11.8%, and the increase was determined by seasonal factors and leave periods. 21
22 Chapter II PRICES AND EXCHANGE RATES In the first half of 2012 the index of consumption prices increased by 5.1% compared to the similar period of last year. In the same period, CPI components recorded the following increases: food products 3.3%, non food products 4.8 %, services 7.7%. In the 2nd quarter of 2011, the increase of prices was attenuated, and the inflation level was 4.2% (compared to the same period of last year). The monthly indexes of prices, calculated compared to the similar period of 2011, recorded the following increases: in April by 4.7%, in May by 4.1%, and in June by 3.7%. The main cause which determined the attenuation of the price increase rates in the 2nd quarter was the decrease of pressures from international prices for food products, which recorded a descending trend in this period. Table 2.1. Evolution of international prices for agricultural and food products, % Indexes of the prices of food products Indexes of prices for meat Indexes of the prices of dairy products Indexes of the prices of grains Indexes of the prices of oils Indexes of the prices of sugar Jan. 2012/ Jan Feb. 2012/ Feb Mar. 2012/ Mar Apr. 2012/ Apr May 2012/ Jan June 2012/ June Source: Data taken from: home/foodpricesindex/en/ In the 2nd quarter, the prices of food products increased by 1.9% (monthly, compared to the same period of last year, there were the following increases: in April 2.9%, in May 2% and in June 0.9%). The prices of non food products increased by 4.5% (monthly, compared to the same period of last year, the increases were: 4.9% in April, 4.5% in May and 4.1% in June), the prices of services increased by 6,3% (monthly, compared to the same period of last year, the increases were: in April 6.3%, In May 6.1% and in June 6.4%) CPI Food Non-food Services Figure 2.1. Annual growth rates of CPI and its components, % Source: According to the National Statistics Office. 22
23 In the 2nd quarter of 2012, among the food products, the highest price increases, compared to the same period of last year, were for: eggs 83.9%, pork 16.3%, cucumbers 15.8%, mutton 14.4%, meat semi products 11.3%, beef 10.7%. At the same time, unfavorable weather conditions shall cause the increase of the prices of agricultural and food products, an evolution which shall be materialized in a long term trend, at least until the end of the year 2012 (see Section). For non food products, there were higher price increases for the following commodities: tobacco 11%, building materials 8.2%, fuels 7.5%, cotton 6.2%. Among the services, the most important price increase was recorded for communal housing services a 12.8% increase. In the 2nd quarter of 2012, the base inflation recorded a descending trend, and continued the trend which started in September Between September 2011 and June 2012 the base inflation decreased from 6.8% to 4.3% (growth rates compared to the similar months of last year). In July and August 2012 this evolution continued, and the base inflation decreased to 4% and then to 3.9%. The decrease of the base inflation most probably must be associated to internal demand Base inflation CPI Figure 2.2. Annual increase rate of base inflation and CPI, % Source: According to the National Statistics Office. In the first quarter of 2012, the index of industrial production prices increased by 6.4%, compared to the similar period of last year. In the industry branch there were the following increases: extractive industry 0.4%, processing industry 3.5%, energy sector 10.4%. In the first 2 quarters of 2012 there is an attenuation in the evolution of the industrial production price index: in the first quarter the prices of industrial production recorded a 7.8% increase compared to the same period of 2011, and in the 2nd quarter the increase was already 5.8%. In the 2nd quarter of 2012, the monthly increases of industry production prices (compared to the similar periods of last year) were 5.8% in April, 5.7% in May and 6% in June. In the 2nd quarter of 2011, compared to the similar period of last year, in the sub sectors of the industry there were the following increases: in the extractive industry, prices recorded an increase of 1.3% (monthly modifications compared to the similar period of last year were 1.1% in April, 0.1% in May and 5.2% in June); in the processing industry the price index increased by 5.3% (the monthly increases compared to the similar period of last year were 5.7% in April, 5% in May and 5.3% in June); in the energy sector an increase of 9% (monthly increases, compared to the similar period of last year: 7.3% in April, 9.9% in May and 9.9% in June). 23
24 In the 2nd quarter of 2012, there were advanced levels of price increases, compared to the similar period of 2011 in: making distilled alcoholic beverages 40.1%, generating electricity 19.6%, manufacturing clothing items 13.4% and making milling products, starch and starch products 13.1%, supply of steam and hot water 11.3% Production price index Mining and quaring Manufacturing industry Electricity and heat, gas and water Figure 2.3. Annual growth rate of the industrial production price index and its components, % Source: According to the National Statistics Office. Construction prices are on the rise, an evolution which started in the 2nd quarter of In the 2nd quarter of 2012, compared to the similar period of last year, prices increased by 10.6%. By sectors, the most important increases of construction prices were in transportation 15.2%, trade and public food products 11.8% and manufacturing social and cultural products 11% Growth rate of prices in constructions Figure 2.4. Growth rate of construction prices, % (compared to the same period of last year) Source: According to the National Statistics Office. In the 1st half of 2012, the prices of agricultural products decreased by 2.3% compared to the similar period of last year. The decrease of agricultural production prices was caused by the decrease of the prices of vegetable products by 14.8%, while the prices of animal products increased by 17.9%. For vegetable products, the highest price decreases were recorded for potatoes 80.1%, vegetables 31.2% and grains and vegetable cultures, seeds 10.1%. Regarding animal products there were increases of prices for wool 42.1%, pork 29.7%, eggs 21.6%. In the 2nd quarter of 2012 there was an average exchange rate of 15.4 MDL/ EUR, which represents a 7.2% increase of the national currency, compared to the similar period of After the increase of the sole currency at the beginning of the year, in February the exchange rate was 24
25 15.7 MDL/EUR, while in January 2012 the exchange rate was 15.2 MDL/EUR, and in the following months the MDL continued to grow (in June 2012 the exchange rate was MDL/EUR). The unfavorable economic evolutions in the EURO area are also reflected in the ratio of the national currency towards EURO. Starting with August this trend changed the European sole currency started to regain its strength in relation to the Moldovan leu. On the other hand, in the first half of 2012 the average exchange rate of the national currency in relation to USD was MDL/USD, US dollar increase with 0.4 % compared to the similar period of In the 2nd quarter of 2012, compared to the same period of last year, USD increased in relation to the national currency by 2.5%. Starting with April 2012 USD increased in relation to MDL, a trend which continues in the 3rd quarter. These evolutions are associated with the intensification of the activity of NBM on the currency market, which starting with the 2nd quarter and especially in the 3rd quarter procured important foreign currency amounts. MDL Figure 2.5. Evolution of the monthly exchange rate MDL/USD and MDL/EUR Source: According to the data of the National Bank of Moldova. In the 1st half of 2012, compared to the same period of last year, the real rate of the national currency increased in relation to the main reference currencies: by 2.3% in relation to USD and by 9.5% in relation to EUR. At the same time, in the 2nd quarter the real exchange rate MDL/USD decreased by 0.4% compared to the same period of last year, and a different evolution was recorded in the 1st quarter, when the exchange rate increased by 4.9%. The real exchange rate MDL/USD continuously increased in the 2nd quarter, when the national currency increased in real terms by 10%. Region left of the Dniester MDL/USD exchange rate In the left part of the Dniester in June 2012, compared to December 2011 the inflation was 7.75%. In the same month of 2012, compared to December 2011, CPI components recorded the following price modifications: food products 8.85%, non food products 4.82%, services 9.52%. Industrial production prices in June 2012, compared to December 2011, increased by 7.4%, and the sale prices of agricultural production in January June 2012 compared to the similar period of last year increased by 6.6%. In January June 2012 the average exchange rate in relation to USD was rubles in the region left of the Dniester for one USD, a 8.7% increase compared to the same period of last year. 25
26 Chapter III FINANCES 3.1. Public finances Revenues of the national public budget In the first half of 2012 NPB accumulated total revenues of million MDL, 1680 million MDL or 12.3% more than in the similar period of At the same time, the collections plan was implemented 97.9 % (not collected, million MDL). By analyzing the NPB, we find that in the first 6 months of 2012, the revenues of the state budget for all components were million MDL, which is less by million MDL, or by 5.7 %. Compared to the similar period of 2011, the accumulated revenues increased by million MDL, or by 10.0 %. At the same time, the budget of administrative territorial units for all components recorded million MDL (including million MDL transfers from the state budget), or % compared to the estimates of the administration period. The expense part of the budget of state social insurance was executed in the value of million MDL (including transfers from the state budget of million MDL, which is 17.5 million MDL, or 0.4 % less compared to the estimates of the administration period. The mandatory medical insurance funds collected total revenues of million MDL (including transfers from the state budget of million MDL, which is million MDL, or 16.1 % less than the provisions of the administration period. By examining the structure of NPB revenues in the first half of 2012, we find that the dominant part continues to be formed of fiscal revenues (83.9%), and the respective weight is 1.1% higher than the similar period of last year. An increase of the weight compared to the first half of the previous year was recorded only by "Grants" (by 1.5%) and "Non fiscal revenues" (by 0.1%), and all the other weights decreased a trend also shown as the result of the analysis of the dynamics of revenues in the 2nd quarter of 2012 compared to the similar period of % 4% 1% 5% Fiscal revenues Non-fiscal revenues 84% Revenues from special resources of public institutions Revenues from special funds Grants Figure Structure of the revenues of the national budget in the 1st quarter of 2012 Source: According to the data of the Ministry of Finance. Compared to the 2nd quarter of 2011, the fiscal revenues from the corresponding period of 2012 increased by 1%, compared to 26.4% recorded in the 1st quarter of 2012 compared to the similar period of 2011, which denotes a slowing down of the fiscal collections growth rate. From fiscal revenues, the most important weight is represented by revenues from VAT (48.3% in the 2nd quarter of 2012), social contributions 30.9%, excises 11.1%, income taxes 10.8%, and compulsory medical assistance premiums 8.4%. 26
27 The trend of indirect revenues prevailing in relation to direct revenues is maintained At the same time, as estimated in the previous edition, certain changes occurred in this relation with the increase, as of January 01, 2012, of the level of the tax on the revenues of legal entities from 0% to 12% Non fiscal revenues in the 2nd quarter of 2012 represented million MDL, and the weight in the total revenues is 6.9%, while in the similar period of 2011 this indicator was 6.2%. The most important contribution to the formation of revenues from grants is represented by external grants. For the 2nd quarter of 2012, the total amount of budget revenues as grants was million MDL, out of which million MDL external grants and 10.6 million MDL internal grants. It is notable that compared to the similar period of last year, the revenues from grants decreased by 147% or by million MDL, and their weight from the total revenues increased by 1.5% in the examined period of 2012 compared to the similar period of Expenses of the national public budget In the half of 2012, the budget incurred total expenses of million MDL, million MDL or 8.4% more than in the similar period of The part of expenses of the national public budget was executed in a volume of 84.7% compared to the provided plan. By analyzing the components of the national public budget, the expense part of the state budget was million MDL, namely 83.0% of the provided plan, million MDL or 4.5% more than in the respective period of Consequently, the performance of the state budget resulted in a deficit of million MDL. In the budgets of administrative territorial units there were total expenses of million MDL, 76.9% of the provided plan, an increase by million MDL or 7.1% compared to the similar period of last year. Consequently, the performance of the budgets of administrative territorial units resulted in a deficit of 16.8 million MDL. The expense part of the budget of state social insurance was million MDL or 100% of the plan and million MDL or 5.7% more than in the respective period of Consequently, the performance of the state social insurance budget resulted in a deficit of 68.6 million MDL. The expenses of the mandatory medical insurance funds represented million MDL, or 96.4% compared to the estimates of the period, and million MDL or 8.6% more than in the respective period of last year. Consequently, the performance of the mandatory insurance funds for medical assistance was million MDL First half of 2011 Q 1_2011 First half of 2012 Q 2_2012 State debt service Environmental protection and hydrometeorology Economic expenditures Science and innovation Social expenditures Maintaining public order and national security Justice and constitutional jurisdiction Figure Volume of expenses from NPB, million MDL Source: According to the data of the Ministry of Finance. 27
28 By analyzing the structure of expenses from GDP in the 2nd half of 2012, we notice that the predominant part continues to be social expenses (72.3%), and their weight decreased by 0.6% compared to the similar period of last year. In the 2nd quarter of 2012, out of the total social expenses, the highest weight is represented by expenses on social insurance and assistance (34.1%), which shows an increase (+2.6%) based on the data for the similar period of 2011, on the background of the increase of the weight of health protection 1.4%. Other components from this group also recorded increases of the weight from the total, such as education by 0.6%. Social expenses were, in the first 6 months of 2012, 5.5% higher than in the similar period of 2011, for all components. Another important component of public expenses is represented by economic expenses, whose weight in the examined period was 11.6% a weight which increased by approximately 2% compared to that of the similar period of last year. The main component of economic expenses is represented by transportations, road administration, communications and computer science, which in the 2nd quarter of 2012 represented 37.0% of the total economic expenses. The weight of the respective expenses increased by 5 compared to the similar period of last year. At the same time, the weight of the expenses from agriculture, forestry administration, fishing administration and water administration out of the total economic expenses increased by 8.1% compared to the similar period of last year. In absolute values, the economic expenses incurred in the 2nd quarter of 2012 increased by 27.6 % compared to the similar period of Budget financial result The performance of the state budget in the 1st half of 2012 resulted in a deficit of million MDL. Among the main financing sources of the budget deficit there are net revenues from the sale of state movable assets ( million MDL), loans paid from external sources ( million MDL), assets from the sale and privatization of the public patrimony (+54.8 million MDL) etc. Public debt According to the report of March 31, 2012, the balance of public debt increased compared to the start of the year by 1,221.8 million MDL, or by 4.9%, and represented 26,034.2 million MDL. The public debt as of March 31, 2012 is composed of: State debts 19,479.0 million MDL (74.8%). BNM debts million MDL (18.5%). Debts of entities from the public sector 1,550.8 million MDL (5.9%). UAT debts million MDL (0.8%). The modification of the balance of public debt towards the end of the 1st quarter of 2012 compared to the beginning of the year is conditioned by the increase of the debt balance of all the components which form the public debt, except for the UAT debt. Thus, the highest increase was the balance of the NBM debt by million MDL, followed by the state debt, which increased by million MDL and that of entities from the public sector by 7.4 million MDL. In the same period, the UAT debt decreased by 2.8 million MDL. Compared to the situation at the end of the 1st quarter of 2011, the balance of the public debt increased by approximately 13.9%. 28
, and the internal public debt was 7102.16 mil. MDL (27.3%).")

29 Debt of UAT Debt of interprises from public sector Debt of NBM State debt 0 Q1_ Q1_2012 Figure Structure of public debts, million MDL Source: According to the data of the Ministry of Finance At the end of the 1st quarter of 2012, the external public debt was million MDL (or 72.7% of the public debt balance as of March 31, 2012), and the internal public debt was mil. MDL (27.3%). Compared to the situation at the end of 2011, the weight of the external public debt increased by 0.9%. Regarding arrears to the loans from the public sector, they recorded as of March 31, 2012, a value of million MDL, being completely composed of arrears to the internal loans of the entities from the public sector and UAT. Compared to the situation at the end of 2011, the value of arrears to internal loans increased by 21.3 million MDL, and this increase was especially conditioned by the increase of arrears to the loans of the entities from the public sector. The arrears to the external loans of the entities of the public sector were not registered. State debt According to the situation of June 30, 2012, the balance of the state debt was million MDL, an increase of million MDL from the start of the year. Regarding the structure by debt type, the state debt as of June 30, 2012 was composed of 70.2 % external state debts and 29.8 % internal state debts. Table Structure of state debts, million MDL Internal External % of the total state debt state debt % of the total Total 2nd quarter of % % % % st quarter of % % nd quarter of % % Source: According to the data of the Ministry of Finance Internal state debt As of June 31, the internal state debt was million MDL and is completely formed of state movable assets. Compared to the situation as of January 01, 2012, the internal state debt recorded an increase of 84.2 million MDL, or by 1.4%. Compared to the same situation of last year, the internal public debt increased by million MDL, or by 10.4 %. The increase of internal debt is mostly due to the additional issuance of state movable assets on the primary market. 29
30 By analyzing the internal state debt by its components, we notice that million MDL or 57.2% is constituted by state movable assets issued on the primary market (as of June 30, 2011 they were million MDL and 58.8%), million MDL or 37.3% converted state movable assets (as of June 30, million MDL and 41.2%), 326 million MDL or 5.5% state movable assets issued for ensuring financial stability (as of June 30, 2011 they were not issued). The state movable assets with maturities up to a year were issued with three terms: T notes of 91 days, 182 days and 364 days, whose weight in the total SMA traded by tenders was 96.4%. The highest weight in issued SMA belonged to T notes on 182 days (42.6%) and 91 days (33.8%) weights which remained relatively constant in relation to the similar period of last year. It is worth mentioning that a significant increase compared to the report of was recorded by state bonds with maturities up to 2 years, whose weight increased from 0.4% as of June 30, 2011 to 1.5% as of June 30, 2012, and at the same time the weight of state bonds by subscription decreased from 3.2% from the total SMA traded on the primary market to 2.1%. By analyzing the internal state debt depending on the maturity as of 6/30/2012, we find that the highest weight is that of the short term internal debt (91.2%), followed by medium term internal public debt (8.8%), and long term internal public debt is completely absent. Thus, the trend mentioned in the previous editions of Moldovan Economy Trends, namely the increase of the weight of short term debt is emphasized Short term internal state debt Medium term internal state debt 0 First half of First half of 2012 Figure Structure of internal state debts, million MDL Source: According to the data of the Ministry of Finance Compared to the end of 2011, the weight of the short term public debts increased by approximately 0.5%. External state debt According to the report of June 30, 2012, the external state debt was million MDL. Compared to the situation as of January 01, 2012, the internal state debt recorded an increase of million MDL, or by 4.4%. Compared to the similar report of last year, the internal public debt increased by million MDL, or by 2.6%. By analyzing the external state debt depending on the maturity as of June 30, 2012, we find that it is completely made up of the long term external public debt a situation that is similar to that recorded at the end of It is worth mentioning that in the report as of June 30, 2011, besides the short term external debt, the external state debt also comprised medium term commitments (4.4 million MDL out of million MDL external state debt on the mentioned date), and their weight is insignificant (less than 1%). 30
31 First half of First half of 2012 Medium term external state debt Long term external state debt Figure Structure of external state debts, million MDL Source: According to the data of the Ministry of Finance. Depending on the currency structure of the debt, the external debt is examined without the breakdown of SDR and with the breakdown of SDR. Table Structure of the external state debt by currency, % of the total external debt Currency type SDR USD EURO JPY GBP WPU With the breakdown of 47.4% 32.4% 8.9% 8.3% 2.6% SDR Without the breakdown of SDR 71.3% 16.4% 7.9% 1.7% 0.1% 2.6% Source: According to the data of the Ministry of Finance In the structure of the external state debt by creditors, multilateral creditors continue to be the main creditors of the Government of the Republic of Moldova. The external state debt to multilateral creditors, as of June 30, 2012, was 81.6% of the total external state debt, to bilateral creditors 17.8%, to commercial creditors 0.6%. The highest weight in the balance of the external state debt to multilateral creditors is that of AID with 47.7%, followed by IMF with 34.5%, IBRD with 7.0%, FIDA with 5.1 %, etc. As an evolution, we notice the ascending trend of the external state debt to multilateral creditors. At the same time, the external state debt to bilateral and commercial creditors continued to drop. State debt service In the first half of 2012 for the state debt service, assets of million MDL were used from the state budget, out of which: external state debt service of million MDL (98.3% of the amount provided for the respective period) and the internal state debt service of million MDL (99.5% of the provided value). From the total external state debt, million MDL was used to reimburse the main amount and 47.4 million MDL for the external state debt service. Public finances of region left of Dniester In the first half of 2012, the revenues of the budget of region left of Dniester were million MDL, which represents 9.7% of the total revenues obtained on the controlled territory of the Republic of Moldova (at the end of the first quarter of 2012, they were 6%), and 6.1% more than the revenues planned for the respective period, out of which: 31
32 919.0 million MDL in fiscal payments (70.8%); million MDL in non fiscal payments (13.3%); 99.4 million MDL revenues from special destination funds (7.7%); 78.1 million MDL revenues from enterprising activities and other revenues (6.0%). The accumulation of budget revenues in the first half of 2012 was 53.5% higher than in the similar period of Thus, fiscal revenues increased by 51.9%, non fiscal revenues 2.4 times, revenues from special destination funds by 12.9%, revenues from enterprising activities and other revenues by 10.0%. In this context, we mention a high increase of revenues to the national budget of region left of Dniester on the account of the increase of each of the components, especially fiscal revenues. The expenses of the budget of region left of Dniester represented million MDL or 18.8% of the total expenses incurred on the controlled territory of the Republic of Moldova, which constitutes 76.3% variation from the established plan of expenses. Compared to the similar period of last year, expenses increased by 22.5%. The most important weight in the total expenses is that of social expenses, especially salary expenses, expenses for social and medical protection, education, science, culture. The consolidated budget of region left of Dniester as of June 30, 2012 recorded a deficit of million MDL, namely 84.2% of the deficit of the same date of Banking sector In the first 6 months of 2012, the evolution of the banking system of the Republic of Moldova recorded a significant performance, showing positive dynamics of most indicators. The banking sector of the Republic of Moldova is made up of two levels, represented by the National Bank of Moldova (NBM) and 14 licensed commercial banks. In the fourth quarter of 2011, BC Universalbank S.A recorded negative financial results. Starting with 2012, an important step was taken within the supervision of the banks from the Republic of Moldova, as financial institutions are obligated to comply with the requirements of the International Financial Reporting Standards (IFRS). Until 2011 banks reported financial results by the standards of the Moldovan accounting system. The total number of employees from the banking system as of June 30, 2012 was 11059, 104 more than January 2, Namely, in average for each employee from the banking sector there were assets of 4.8 million lei, 0.4 % more than January 2, In the first half of 2012, the total assets of the banking system totaled million MDL, a 7.3% increase compared to January In July 2012 the total assets of the banking system were million MDL, a 9.8 % increase compared to January The evolution of the banking assets was determined by the accentuated growth of profit generating assets, the highest weight in the total assets was that of the credit portfolio 59.3%, 2% higher than January 02, The gradual growth of assets by components leads to the conclusion of relative banking stability. Thus, on June 30, 2012, compared to January 02, 2012, there were the following modifications: increase of cash by 16.6%, to million MDL; increase of other assets by 27.6%, to million MDL; increase of loans and receivables by 5.8%, to million MDL; increase of tax receivables by 49.8 %, to 86.2 million MDL; net increase of non current assets and assignment groups, classified as held for sales, by 17.2%, to million MDL; decrease of intangible assets by 1.4 %, to million MDL. 32
33 100% 90% 80% 70% 60% 50% 40% 30% 20% 10% 0% 31/12/ /06/2012 Other net assets Claims on taxes Intangible assets and investments in subsidiaries, etc. Tangible asset Investments held to maturity Loans and receivables Financial assets available for sale Assets held for trading Cash Fig Evolution of banking assets by volume and structure, 1st half of 2012, % Source: Accoding to the data of the National Bank of Moldova. The volume of credits in the economy was million MDL as of June 30, 2012, 1565 million MDL more than January 2, At the end of June 2012, the balance of credits in the economy was million MDL, million MDL (2.7%) more than May The increase trends were due to the increase of the balance of credits granted in the national currency by million MDL (1.8%), and of the balance of credits in foreign currencies by million MDL (3.9%). The increase of the balance of credits in MDL occurred following the increase of the balance of credits granted in all economy sectors, and thus the balance of the credits granted in the private sector increased by million MDL (1.1%), to natural persons by million MDL (2.2%), to state companies by 65.8 million MDL (13.4%) and other organizations which carry out certain financial operations by 13.8 million MDL. The balance of credits in foreign currencies (recalculated in MDL) recorded an increase determined by the increase of the balances of the credits granted to all the sectors of the economy, thus the balance of credits granted to the private sector increased by million MDL (4.2%) and other organizations which carry out certain financial operations by 12.8 million MDL (2.7 %), to state companies by 3.5 million MDL (0.6%), to natural persons by 3.1 million MDL (1.1 %). Expressed in USD, the balance of credits in foreign currencies was million MDL, an increase of 19.9 million USD (1.7 %), compared to May In the first half, bad credits in absolute value increased by 24.3% compared to the beginning of 2012 and amounted to million MDL. On June 30, 2012, the weight of bad credits in the total credits was 15.3 %, 2.4% higher than January 02, The same volume of bad credits, projected on CNT, was 71.4% on June 30, 2012, 4.6% higher by 19% than January 02, In this context, the discounts for the credit debt increased by 1.2%, and reached 10.3% at the end of June. In July 2012, the decreases for the credit debt were 10.3%. In June 2012 the average interest rate for the credits granted in the national currency decreased by 0.6%, reaching 13.6%, and on June 30, 2011 it was 14.2%. In June 2012, the average interest rate for the credits granted in foreign currencies decreased by 0.3%, reaching 7.9 %, compared to June 30, 2011, namely 8.2%. This decrease was caused by the decrease of the average rate of credits granted to legal entities, which in June 2012 was 7.9%, 0.9% less than in June
34 /12/ /06/ /06/ /07/2012 Non-performing loans Provision for loan losses Figure Evolution of banking credit quality, % Source: According to the data of the National Bank of Moldova. In the 1st half of 2012, there was a decrease of new credits granted by banks, from million MDL in January 2012 to million MDL in June 2012, a 64.2% increase. The volume of credits granted in MDL in June 2012 was million MDL, an increase of million MDL, 15% more than in May. Thus, in June 2012 the average interest rate for the credits granted in the national currency decreased by 0.29%, to 13.69%, as a result of the average decrease of the interest rates for the credits granted to legal entities by 0.32%, to 13.20%, while the average interest rate for the credits granted to natural persons increased by 0.05%, to 15.42%. The volume of credits in foreign currencies granted to legal entities was million MDL (equivalent of 83.6 million USD, an increase of million MDL (equivalent of 25.2 million USD compared to May The average interest rate for the credits in foreign currencies granted to legal entities decreased by 0.12% compared to May, and was 7.89% in June In the 1st half of 2012, there was an increase in the value of the assets of the commercial banks of the Republic of Moldova. Thus, by the value of banking assets, the market is dominated by 4 commercial banks, with 63% of the total assets. The leader by the value of assets is BC Moldova Agroindbank, whose total assets as of June 30, 2012 were million MDL, an increase of 1039 million MDL compared to December 31, 2011, and the market share of the bank decreased by 0.4%, to 19.1%. The following position is held by BC Victoriabank, with a volume assets of million MDL, million MDL more than December 31, 2011, and the market share of the bank increased by 0.7%, to 17.8%. In the 1st half of 2012, the market concentration index (Herfindahl Hirschman index) was within the limits of a banking market in the Republic of Moldova, with a concentration degree of points by the value of assets (see table 3.2.1). In the 1st half of 2011, the evolution of the credits of commercial banks recorded increases. Thus, as of June 30, 2012, by the balance of bank credits, the market is dominated by 4 commercial banks, which own 61 % of the total credits, out of which BC Moldova Agroindbank with 22%, BC Victoriabank with 16%, BC Moldindconbank with 15% and BC Eximbank with 9%. Namely, BC Moldova Agroindbank leader on the banking market, recorded a balance of credits of million MDL as of June 30, 2012, more than million MDL compared to December 31,
35 Table Concentration indicators in the banking sector, in st half of 2012, % No. Bank name Market share by the value of assets (%) Market share by the value of credits (%) Market share by the value of deposits (%) Comerţbank Banca Socială Victoriabank Moldova Agroindbank Moldindconbank Banca de Economii EuroCreditBank Unikbank FinComBank Universalbank 0.4 x 0.4 x 2.2 x 11 Energbank ProCreditBank BCR Chişinău Eximbank Gruppo Veneto Banca Mobiasbanca 15 Grupe Societe Generale HHI indicator (points) CR 4 indicator (%) Source: Calculations based on the data provided by commercial banks In July 2012, there was an increase in the volume of deposits of commercial banks of the Republic of Moldova. Thus, by the value of banking assets, the market is dominated by 4 commercial banks, which own 69%. The leader by the volume of obtained deposits is BC Victoriabank, which on June 30, 2012 had obtained deposits with a total value of million MDL, an increase of 1001 million MDL compared to December 31, 2011, and the market share of the bank increased by 1%, to 22%. The second position as of June 30, 2012 is held by BC Moldova Agroindbank, with obtained deposits of 6436 million MDL, an increase of million MDL compared to December 31, 2011, and the market share of the bank was 18.2%. The total normative capital, a factor of bank solvency, as of June 30, 2012, was million MDL, 8.4% less than on January 02, Thus, the risk weighed assets amounted to million MDL, more by 6.8% than the end of January The 1st degree capital, as of June 30, 2012, decreased by 9.1% to million MDL compared to January 02, The positive value of this indicator confirms the resistance and safety of the system in case of financial shocks. On June 30, 2012, bank bonds were million MDL, 8.7 % more than January 2, In the 1st half of 2012, the deposit balance in the banking system was million MDL, 5.7% more than in January At the end of June 2012, the balance of deposits in the banking sector increased by million MDL (3.4%) compared to May, as a result of the increase of the deposit of deposits in the national currencies by million MDL (1.1%) and deposits in foreign currencies by million MDL (6.6%). The balance of open deposit accounts was million MDL, million MDL more than in May 2012 and represents 29.6% of the 35
36 total balance of deposits. The balance of term deposits amounted to million MDL, an increase of million MDL (1.4%) /12/ /06/ /06/ /07/2012 CNT First tier capital Total risk weighted assets Figure Evolution of the banking system capital Source: According to the data of the National Bank of Moldova. The volume of new deposits obtained by banks as of June 30, 2012 was million MDL, 1.9% less than in the first half of In July 2012, compared to July 2011, there were the following modifications in the structure of term deposits in the national currency: increase of term deposits of up to 1 month by 1.3%, to million MDL; decrease of term deposits of 1 3 months by 50.9%, to million MDL; decrease of term deposits of 3 6 months by 25.1%, to million MDL; decrease of term deposits of 6 12 months by 4.2%, to million MDL; increase of term deposits of more than 12 months by 12.6%, to million MDL. In the structure of term deposits in foreign currencies, in July 2012, compared to July 2011, there was an increase of million MDL, and the deposits in foreign currencies with terms up to 1 month amounted to million MDL. At the same time, there was a decrease of deposits in foreign currencies with terms of 3 6 months by 16%, to million MDL. There were increase trends in interest rates. In the first half of 2012, the interest rate in the deposits in lei was 7.59 %, a 0.31% increase compared to the 1st half of 2011, when this indicator was 7.28 %. Respectively, in August 2012 the average interest rate of the interests in the deposits in lei was 7.15%, 0.44% less than June The banking margin of operations in the national currency dropped from 8,22% in December 2010 to 5.51% in December In January 2012, the banking margin for operations in the national currency was 7.65%, and in June 2012 it was 6.71 %. In this context, we notice that the average interest rates of deposits in the national currency increased in January 2011, to 6.7%. Respectively, the average interest rates for the deposits in foreign currencies increased more significantly after the beginning of the year from 4.03% in January 2012 to 4.5% in August In the first half of 2012 the net revenues in relation to assets (ROA) was 2.3% on June 30, 2012, and in relation to the equity capital (ROE) was 11.6 %. At the same time with the increase of the volume of the shareholding capital and assets, the increase of ROE and ROA shows that the growth rate of the net profit is much faster, which is quite encouraging. Thus, in the first half of 36
37 2012, the net revenues of banks in the entire system amounted to million MDL or 53.9% more than the revenues recorded in the 1st half of January 2009 July2009 may 2009 March 2009 September 2009 July2010 may 2010 March 2010 January 2010 November 2009 September 2010 July.2011 may 2011 March 2011 January2011 November 2010 September 2011 august 2012 July2012 may2012 March 2012 February 2012 December 2011 November 2011 Average rate for deposits in MDL Average rate for credits in MDL Banking margin Figure Evolution of the banking margin*, of average interest rates of deposits and credits in MDL, % Source: Source: calculations based on the data provided by the National Bank of Moldova *NB: The banking margin indicator was calculated as the difference between the average interest rate of deposits in MDL and the average rate of credits in MDL. ROE ROA Figure Evolution of banking profitability, % Source: According to the data of the National Bank of Moldova The weight of assets, generated by interests in the total assets, as of June 30, 2012, decreased by 1.8% and was 79.2% compared to January 2, 2012, which was 81%. Respectively, as of June 30, 2012, the level of the net interest margin was 5.3%. Thus, banks in more difficult situations compensate revenues from other sources, especially from transfer commissions, including from abroad, and from other commissions applied by banks. The efficiency index, determined as the ratio between the net revenues corresponding to interests plus revenues not corresponding to interests for expenses not corresponding to interests, as of June 30, 2012 is 144.6%. 37


38 ian.2011 april.2011 iunie 2011 ian.2012 april.2012 iunie.2012 iulie 2012 Liquid assets / total assets The minimum capital adequacy Capital adequacy Minimum level of liquidity Figure Liquidity indicators and capital sufficiency, % Source: According to the data of the National Bank of Moldova The capital sufficiency degree is maintained on a high level of 25.6% on June 30, Although over the minimum necessary level of 12%, we notice a decrease of this indicator by 4.2% compared to January 02, We consider that the banking capital sufficiency degree is explainable by the considerable increase of the credit portfolio, which is part of the risky assets with a major weight in the risk. Table Trends of banking liquidity, % Indicators Second principle of liquidity First principle of liquidity Source: According to the data of the National Bank of Moldova Banking liquidity may be regarded both based on the weight of liquid assets in the total assets, and based on bonds, which the bank is obligated to pay. Thus, in the 1st half of 2012, the weight of liquid assets (2nd principle of liquidity) was 32.3%, which shows that the payment capacity of banks is unaffected. Long term liquidity or the 1st principle of liquidity, for the entire banking system recorded 0.7% as of June 30, These values of the liquidity indicators show the existence of adequate sources for supporting payments corresponding to bonds. Section Access to financing in the Republic of Moldova banking sector vs. micro financing organizations Micro financing institutions developed as an alternative to the banking sector. The alternative of credits granted by commercial banks currently constitutes the products provided by micro financing organizations, predominantly in rural areas, facilitating the access to cheap financial sources, and stimulating private initiatives. These organizations ( Corporația de Finanțare Rurală SA, Microinvest SRL and ProCredit SA) operate in virtue of Law no. 280 XV of July 22, 2004 on Micro financing organizations (hereinafter referred to as OMF) and allocate loans from own/loaned resources, and are not entitled to accept deposits. 38
39 Micro financing institutions serve clients that do not have sufficient guarantees for obtaining financing from banks or live in areas where banking services are not available. Two types of financiers operated on the market in 2011: micro financing institutions, with total assets of million lei, and savings and loans associations, with total assets of million lei, and the banking sector has total assets of million lei. In , there was an increase of the banking sector in relation to GDP, with slight deviations in 2008 and Banking assets in relation to GDP increased from 47.6% in 2006 to 58.8% in Similar evolutions were recorded for micro financing operations in relation to GDP. Thus, assets in relation to GDP increased from 2.83% in 2006 to 3.9% in 2008, and in 2011 this indicator decreased, and reached 2.24% OMF Banking sector Figure Evolution of assets related to GDP (%) of the banking sector and OMF, in Source: According to the data of the National Bank of Moldova and CNPF. The evolution of banking profitability denotes that banks were capable of increasing the net revenues related to assets related to shareholding capital (ROE) by 8.9%, as of December 31, 2011, and recorded 11.5%, compared to December 31, At the same time with the increase of the volume of the shareholding capital and assets, the increase of ROE and ROA shows that the growth rate of the net profit is much faster, which is quite encouraging. Within the micro financing system, the net revenues related to assets related to shareholding capital decreased from 18.2% to 12% in Nevertheless, at the end of 2011, the net revenues of banks from the entire system amounted to million MDL, or 4.7 times more than the revenues recorded in Respectively, the revenues from the microfinancing sector represented million lei in 2011, 1.3 times more than in Not taking into consideration that in the last years there was a positive trend of the number and volume of credits granted by the banking sector, small business entities continue to face difficulties in the access to finance. This statement is also proven by the fact that the weight of credits directed for the micro financing sector does not exceed 15% of the total, and most of them were granted to the companies concentrated around Kishinev. At the same time, most small business credits are from resources of international financial institutions, which grant credit lines to national commercial banks, and the latter allocate financial resources to the companies from this sector. The region of the Republic of Moldova to the left of the Dniester. In the first six months of 2012, the evolution of the banking sector of Transnistria recorded relatively stable development trends. The banking system to the left of the Dniester is composed of 9 banks, and reports were submitted by 6 banking institutions. Consequently, Banca Dezvoltarii Sectorului Agrar has recently started operating, and "Laminat" and "Benderysotsbank" banks had their licenses suspended by the central bank. The total assets of the banking system of Transnistria totaled at the beginning of June million rubles, the equivalent value of 473 million dollars. Compared to the start of 2012, they increased by 2.6%, and compared to August, they decreased by 1061 million rubles. 39
40 In the 1st half of 2012, the share capital of banks reached the value of million rubles, and recorded an increase of 4.9%. The total bonds of the banking sector increased by 1.6% in June 2012, the equivalent value of million rubles. The deposit portfolio of the population in the first half increased by 7.61% to million rubles, compared to the end of 2011, namely million rubles. The balance of credits granted in the economic sector reached almost million rubles at the end of June. This was due to the fact that the credits granted to natural persons in this period increased by 5% to million rubles at the end of June, and the credits granted to legal entities increased by 8.5% to million rubles compared to the end of Monetary policy In the first quarter of 2012 the monetary indicators recorded a positive evolution and as a result the stock of monetary aggregates as of June 30, 2012 was larger compared to June 30, 2011: monetary aggregate M0 constituted approximately billion MDL (compared to: June 30, 2011 the M0 aggregate was billion MDL); monetary aggregate M1 was 17.4 billion MDL (compared to: June 30, 2011 the M1 aggregate was billion MDL); monetary aggregate M2 reached a level of 29.5 billion MDL (compared to: June 30, 2011 the M1 aggregate was 26.4 billion MDL); monetary aggregate M3 was 43.2 billion MDL (compared to: June 30, 2011 the M1 aggregate was 39.5 billion MDL). Likewise, the monetary basis increased, and on June 30, 2012 it was billion MDL, while on June 30, 2011 this indicator was approximately 13.4 billion MDL Monetary aggregate M0 Monetary aggregate M2 Monetary base Monetary aggregate M1 Monetary aggregate M3 Figure Evolution of monetary aggregates and the monetary basis, million MDL Source: According to the data of the National Bank of Moldova. On June 30, 2012, the components of the monetary mass were distributed as follows: monetary aggregate M0 (circulating money) 26.3%; overnight deposits 14.5%; monetary market instruments %; term deposits 27.8% and foreign currency deposits 31.4%. For 2011 and the 1st half of 2012 there was a constant evolution of the weight of monetary masses. 40
41 100% 90% 80% 70% 60% 50% 40% 30% 20% 10% 0% Currency deposits Long term deposits Instruments of monetary market Short term deposits Monetary aggregate M0 Figure Monetary mass structure Source: According to the data of the National Bank of Moldova. The decrease of the growth rates of prices and the uncertain evolutions of the national economy in the 1st half of 2012 led to a relaxation of the monetary policy. The rates of the monetary policy instruments decreased in the first quarter of 2012, while in the 2nd quarter their level remained constant. Table Evolution of the interest rates for the monetary policy instruments of the National Bank of Moldova Base rate, % Interest rate for overnight credits, % Interest rate for overnight deposits, % January / / /5.5 February / / /3.5 March / / /1.5 April May June Source: According to the data of the National Bank of Moldova. In the 2nd quarter of 2012, the operations with CBN increased continuously. In June, compared to April 2012, the daily average balance of the transactions with CBN increased from 3.38 billion MDL to 3.68 billion MDL. In the 3rd quarter the volume of the transactions with CBN were below the level recorded in March 2012 (the daily average balance was 3.85 billion MDL). In the same period, commercial banks did not request from NBM the provision of overnight credit facilities. Similarly, in the 2nd quarter, the request of overnight deposits increased from a daily average balance of million MDL in April to million MDL in June In the first quarter of 2012 and in April and May of the same year the National Bank of Moldova did not modify the rate of mandatory reserves, and its level remained 14%. In the 2nd quarter NBM intensified its intervention on the currency market. In order to depreciate the Moldovan leu in relation to the reference currencies (thus decreasing the prices of exported products and stimulating the competitiveness of internal commodities) NBM used currency procurements. In the 2nd quarter the maximum value of currency procurements was achieved in May, and the amount of 20.3 million USD was purchased from the market. In the 2nd quarter the activity of NBM increased: in August the volume of currency procurements was million USD, in May. At the same time, the balance of official reserve assets exceeded the level of 2 billion USD (on June 29, 2012 the balance of currency reserves was 2.06 billion. USD). 41
42 CNB, average daily stock Overnight credits, average daily stock Overnight deposits, average daily stock Figure Monetary policy instruments, million MDL Source: According to the data of the National Bank of Moldova. Region left of the Dniester On June 30, 2013, the monetary mass in the region left of the Dniester was million rubles. Characteristic for the region left of the Dniester is the high impact of the dollar on December 31, 2012 this indicator was 62%. In the 1st half of 2012, under the conditions of an increase in the liquidity excess the rate of the mandatory reserves increased twice: on January 01, 2012 from 11 to 13% and on February 01, 2012 from 13 to 14%. The rate of mandatory reserves of 14% remained constant in February June
43 CHAPTER IV EXTERNAL SECTOR Balans of payments The overview of current economic transactions and of capital of the Republic of Moldova with foreign partners in the first half year indicates a visible moderation. In the 1st semester of 2012 the current account was closed with a negative balance of million USD. Compared to the 28% increase recorded in the 1st semester of 2011 related to the similar period of 2010, in the first six months of this year it recorded a decrease of 7.3%. Thus, in all the sub accounts of the balance of payments, except for the revenues account, there were decreases in the growth rate compared to the dynamics of the last year. Table 4.1. Balance of payments Current account (synthetic presentation) Value, million USD Growth rate, % 2011 S S / S1 2011/ S1 2012/ Current accounts Commodities Export Import Services Export Import Revenues Collections Payments Current transfers Collections Payments Source: According to the data of the National Bank of Moldova. The unexpected growth moderation registered from the beginning of this year was equally surprising as the increase of the trade with goods last year. Exports were affected both by the supply of goods, and by external demand, and the evolutions of world prices for certain products, which are subject to external commercial transactions of the Republic of Moldova, and the increase of imports seems to have been maintained within rather low values (a more detailed analysis of foreign trade with goods is presented below). Exports of service in the 1st semester of 2012 constituted million USD, 6% more than in the similar period of the last year. Structurally, 93.2% of exports were transportation services (39.2%), travel (21.5%), communications (16.1%), computer and informational services (5.7%) and other business services (10.7%). In this period there was a decrease of construction services exports, insurance, financial and royalty services. Other services, except personal and governmental services recorded a visible moderation. The value of services imports in January June 2012 was million USD. Transportation services (41.1%), travels (33.7%), communications (4.1%), other business services (7.9%) and governmental services (4%) constituted 94.4% of the total imports. In this period the imports of 43
44 insurance, financial and communication services decreased compared to the similar period of the last year. Practically, there was a more than twofold decrease of transportation imports. At the same time, there was a significant increase for the imports of construction, computer and informational, business, governmental, personal, cultural and recreational services. The dynamics of services exports of the last year caused a decrease of the negative balance of the commercial balance of services from 63.5 million USD in 2010 to 2.6 million USD in In the first semester of this year there was a moderation in the growth of exports of services, which caused a negative balance of 34.3 million USD, compared to 1.9 million USD in the same period of the last year. The trade with transportation, travel, constructions, and governmental, personal, cultural, recreational, financial and insurance services contributed to the negative balance of the commercial balance. Table 4.2. Evolution of foreign trade with services in the first half of the 2012 year Exports Imports Trade S I 2011/ S I 2011/ S I 2011/ S I 2011/ SI 2012 S I 2012 balance Total Transportation Travel Communications services Constructions services Insurance services Financial services Computer and informational services Royalty services and license fees Other business services Personal, cultural and recreational services Governmental services not included elsewhere Source: According to the data of the National Bank of Moldova. Together with the current account balance decrease, a negative trend has had the positive balance of the financial account as well. Thus, in the first half of this year it amounted to 214,5 million USD, 26,2 % lower than in the similar period of the last year. At the same time, in the 1st semester of the last year, the positive balance of the financial account was formed due to assets attenuation, especially at the expense of residents cash holdings in foreign currencies and their placements abroad. This year, the reduction of the financial account proficit was determined by the positive evolutions of foreign currencies deposited by residents and their deposits abroad, 44
45 despite an increase with 26% of liabilities. Although ISD recorded a very modest evolution, even a decrease compared to the similar period of the last year, the increase of net loans contracted by monetary authorities (69.6 million USD) and by other sectors (97.1 million USD four times more than in the same period of the last year) contributed to the increase of liabilities. Table 4.3. Balance of payments Capital and financial account (synthetic presentation), million USD Value, million USD Growth rate, % 2011 S S / S1 2011/ S1 2012/ Capital and financial account Capital account Inputs Outputs Financial account ,8 214, ,8 26,2 Direct investments Portfolio investments Financial derivatives, net ,7 142,1 Other investments Backup assets ,2 114, ,2 2,7 Assets ,2 163, ,3 1892,6 ISD Portfolio investments Financial derivatives Other investments Backup assets ,2 114, ,2 2,7 Liabilities ISD Portfolio investments Financial derivatives, liabilities Other investments Source: according to the data of the National Bank of Moldova Remittances In January June of this year the increase of remittances followed a decreasing trend. In the first quarter of this year, the volume of remittances was million USD, 13% higher than in the similar period of the last year, while in the second quarter they accounted mil. USD, increasing by 7%. Thus in the first semester of this year the value of remittances amounted to mil. USD, up by 9.9% compared to S I million USD or 65.6% of the inflow of remittances came from CIS countries, out of which 90.4% (59.3% of the total) came from the Russian Federation. For comparison purposes, in the 1st semester of 2011, the volume of remittances from the Russian Federation was million USD or 55.8% of the total inflow. Thus, in the first six months of the year the value of remittances from the Russian Federation increased more rapidly than the total average, and recorded a 17% increase. 45
46 Q I 2008 Q II 2008 Q III 2008 Q IV 2008 Q I 2009 Q II 2009 Q III 2009 Q IV 2009 Q I 2010 Q II 2010 Q III 2010 Q IV 2010 Q I 2011 Q II 2011 Q III 2011 Q IV 2011 Q I 2012 Q II Migrants' transfers Personal transfers Compensation of employees Remittances growth rate,% (right axis) Figure 4.1. Evolution of remittance inflows in Source: According to the data of the National Bank of Moldova. Regarding the structure of remittances by components of the balance of payments, 55.3% are composed of labor compensations and 44.1% of personal transfers made from non residents to residents. The 9.9% increase of remittances inflow in the 1st semester of 2012 compared to the first semester of 2011 was determined by 6.1% by the increase of labor compensations, while personal transfers accounted for a lower contribution of 3.7% due to a more modest increase. In this period the former increased by 11.2%, while the latter by 8.3%. Figure 4.2. Money transfers from other countries to natural persons via the banking system of the Republic of Moldova in Source: According to the data of the National Bank of Moldova. The latter trends seem to have caused a very modest increase, of 6%, of money transfers from other countries to natural persons by the banking system in the 1st semester of 2012 compared to the similar period of the last year. In the 1 st semester, 2012, the value of money transfers from other countries amounted to 651 mil. USD, up by 2.2% compared to S I To note that their growth has moderated since the second half of the last year, while in the second quarter of this year they have registered a 1% decrease. The modest trends of the transfers made from other countries can be explained by the unfavorable evolutions of the EU countries and the depreciation of the European currency in relation to the American dollar. In the 2nd quarter of this year there was a decline of 0.6% in EU 27, including in European states representing important destinations of Moldovan emigrants where the economic situation worsened: 2.8% Italy; 1.6% Spain. 46
47 Q I Q II Euro USD Russian ruble % 20% 40% 60% 80% 100% Figure 4.3. Money transfers from other countries to natural persons via the banking system of the Republic of Moldova in Source: According to the data of the National Bank of Moldova. Direct foreign investments Like the other inflows of foreign capital from abroad remittances and exports, the evolutions of foreign direct investments cannot be characterized as good. Moreover, regarding net FDI inflows, their value in the 1st semester of 2012 was unexpectedly low, 88.5 million USD, 34.9% lower than in the similar period of the last year. Thus, at the end of the first semester of this year, the FDI stock in the national economy was million USD. Figure 4.4. FDI in the Republic of Moldova in Source: According to the data of the National Bank of Moldova. Regarding their capital form, the drastic reduction of FDI in the analyzed period occurred following the decrease of inter company investments in the national economy, or in other words the increase of the volume of reimbursed credits versus those obtained in the companies with foreign capital from the country. Thus the net value of 23.7 million USD of direct foreign investments performed as inter company credits was determined by the decrease of the values obtained by the economy from 78.4 million USD in the 1st semester of 2011 to 44.6 million USD in the 1st semester of 2012, on the background of reimbursed credits from 43 million USD to 68.3 million USD in the same period. Also, a negative influence on the FDI inflow in the 1st semester of 2012 was the reduction, practically triple, of the reinvested earnings in the economy. Their value in the first semester of the year was 16.6 million USD, compared to 45.4 million USD in the similar period of the last year. Quarterly developments may notice their reduction. The trend seems to be caused by the 47
48 modifications operated in the fiscal budget policy for the current budget year, which marked the end of the fiscal facilities granted to the taxation of reinvested revenues Q II Q 8.7 I Q IV Q III Q II Q I Other capital Reinvested earnings Equity Figure 4.5. DFI in the Republic of Moldova by capital forms in Source: According to the data of the National Bank of Moldova. At the same time, the growth of foreign direct investments in equity capital couldn t compensate the negative evolutions of the reinvested revenues and the inter company credits. The value of FDI in equity capital was 95.6 million USD, in the 1st semester that is 77% higher than the recorded value in the similar period of the last year. They have grown in the first two quarters of this year by 23.6% and 2.5 times. At the same time, FDI in the share capital recorded a regress of 37% in the 3rd quarter, respectively 8% in the 4th quarter of 2011, compared to the similar periods of 2010 year. The general reduction of FDI inflows in the national economy seems to have been largely influenced by the economic instability of the countries of Western Europe which represent the largest investors in the Republic of Moldova. Balance of payments of the trans Dniester region In the first three months of 2012, the current account of the region on the left of the Dniester recorded a deficit of million USD, 134% higher than the similar period of the last year. The factors which determined the deterioration of the negative balance of the current account were: Increase of the import of goods by 56.3% compared to the 8.9% increase of exports; Decrease of 10.8% of the export of services on the background of increasing imports by 11.3%, which generated a deficit of the commercial balance of services of 12.1 million USD, an increase of 3.7 million USD compared to the similar period of the last year; Increase of the negative balance of the revenue sub account from 13 million USD in the 1st quarter of 2011 to 24.2 million USD in the first quarter of 2012, following the increase of payments made in favor of foreign investors, while the accumulated revenues were only 1.1 million USD; These effects were only partially compensated by the evolutions of the current transfers subaccount. It concluded the quarter with a positive balance of 35.9 million USD, but that is lower compared to 46.4 million USD in the first quarter of The transfers of money from other countries in favor of natural persons by fast transfer systems constituted 42.7 million USD, 14.8% more than in the similar period of last year. With the deterioration of the current account, there was an increase of the proficit of the financial account by 14.7% from million USD in the 1st quarter of 2011 to 248 million USD in the first quarter of Net foreign investments in the region were 4.1 million USD, while 48
49 last year, in January March, they represented 5.7 million USD. The residents from the region did not perform direct and portfolio investments abroad in the first quarter of At the same time, other investments were made in value of 7.2 million USD, while in the first quarter of 2012 they decreased by 3 million USD. Consequently, the balance of the financial sub account was mainly made up of the debts accumulated in this period for gas of million USD. Foreign trade In the first half of the year, the value of the foreign trade transactions of the Republic of Moldova was 3.5 billion USD, an increase of only 4%, or million USD compared to the previous year, and in the similar period of last year the increase was of 1.09 billion USD. In this period there were very modest evolutions both for imports and exports. Although the average rate of exports seems to exceed that of imports, their absolute value level is insignificant. In the first six months of the year, the value of exports was 1.04 billion USD, 4.6% (46.2 million USD) more than in the similar period of last year, while imports amounted to 2.46 billion USD, an increase of 3.6% (86.3 million USD). Consequently, the commercial balance recorded a deficit of 1.4 billion USD, 2.9% more than in the similar period of last year Q I 2010 Q II 2010 Q III 2010 Q IV 2010 Q I 2011 Q II 2011 Q III 2011 Q IV 2011 Q I 2012 Q II 2012 Exports, mil. dolari SUA Imports, mil. dolari SUA Exports growth rate, % Imports growth rate, % Jan Mar May 11 Jul Sept Nov Jan Mar Jun 11 Jul Exports, mil. dolari SUA Imports, mil. dolari SUA Exports growth rate, % Imports growth rate, % Figure 4.6. Quarterly and monthly evolutions of the Moldovan foreign trade Source: According to the National Statistics Office Export Import Unit value indices, % Unit value indices, % Volume growth, % Volume growth, % Figure 4.7. Quarterly evolutions of volume and of the unitary value of exports and imports Source: According to the National Statistics Office. 49
50 After witnessing an unexpectedly small increase of foreign trade in the 1st quarter of this year, the 2nd quarter was not better. The value of exports was million USD in the 2nd quarter of 2012, a 2.9% increase compared to the similar period, and imports 1256 million USD, and recorded a decrease of 1.5%. Regarding monthly evolutions, we find that the long term evolution seems to be pessimistic, too, at least for exports, which decreased in July by approximately 10% compared to July Q I Q II Q III Q IV Q I Q II Q III Q IV 2011 Q I Q II 2012 Figure 4.8. Quarterly evolution of the terms of trade, % Source: According to the National Statistics Office. The moderate increase of the value of exports in the 1st half of 2012 was determined by the attenuation of the increase of the volume of goods delivered on external markets, continuing the trend which started in the 3rd quarter of 2011, and the reduction of the value of unitary values. The same situation may be noticed in case of imports. At the same time, the terms of trade remains under 100%. The main factors which influence this evolution are: Faster reduction of export prices compared to import prices; Depreciation of the national currency and of the EURO currency transaction currency for a large volume of external deliveries of the Republic of Moldova (the weight of EU countries from Moldovan exports is approximately 47.6%), compared to USD Jan Feb Mar Apr May 11 Jun 11 Jul Aug Sep Oct Nov Dec Jan Feb Mar Apr Jul 11 Aug 11 Jul Aug Sep Energy Agriculture Beverages Metals and minerals Figure 4.9. Evolution of world prices for some products with important positions in Moldovan foreign trade, 2005=100 Source: according to the data of the World Bank 50
51 Exports Since the beginning of the year we have witnessed an attenuation of exports for the three major export directions of Moldovan products. Regarding the geographical structure of exports in the first half of the year, we notice a consolidation of the position of Eastern partners CIS, by 2.1% (41.1%), on the background of the weakening of the positions of EU countries by 0.8% (48.8%) and of other countries by 1.3% (10.1%). Exports to CIS countries proved to be rigid, compared to other markets, and recorded an increase of 10.2% in the first half, and the value was million USD. At the same time, the quarterly evolutions indicate a continuous attenuation. The exports to the Russian Federation increased by 14.7% in the first half of the year and to Kazakhstan by 34.7%, due to the relatively good evolutions from the 1st quarter. In Ukraine, the exports in the 1st half year decreased by 7.8%. A positive contribution to the increase of exports to CIS countries in January June 2012 was represented by the exports of beverages, edible fruits, pharmaceutical products, terrestrial vehicles, furniture due to their relatively high weight in the structure of exports for this destination, and also products such as essential oils, which increased 21 times, knitted and weaved clothing and clothing accessories more than 4 times, vehicles and equipment for railways or similar and the parts thereof, approximately 5 times, etc. On the other hand, their evolution was negatively influenced by the reduction of the exports of nuclear reactors, boilers, machines, mechanical equipment and devices and parts thereof by 29%, oleaginous seeds and fruits by 31%, vegetables and vegetable products by 32.6%, respectively 20.7%, tobacco and tobacco replacements by 31.5% etc Q I Q II Q III Q IV Q I Q II Q III Q IV Q I Q II Total CIS EU Other countries Figure Moldovan exports by geographical destinations, % Source: According to the National Statistics Office. The decrease of the growth rates of exports to Western Europe was even more significant, as their value in EU in January June was 508 million USD, 2.9% higher than the similar period of last year. While deliveries recorded decreased on most markets in this direction, in some countries they dropped radically, e.g. Romania 1 ( 1.7%), Germany ( 34.3%), Great Britain 1 In January June 2012 there was a decrease of exports to Romania compared to the similar period of last year in several tariff positions: corn from thousand USD to thousand USD), wheat flour from 2.6 million USD to 6.7 thousand USD), soy flour from 2.5 million USD to 1.1 million USD, sunflower seed oil from 21.8 million USD to 5.5 million USD), fruit 51
52 ( 9.4%), Greece ( 58.3), Lithuania ( 47). In the 2nd quarter the deliveries of goods in Romania decreased by 10%. Despite these evolutions, exports managed to maintain a rather good increase on other markets Italy (22.2%), France (40.1%), Hungary (46%), Netherlands (60%), and Bulgaria (11.2%). At the same time, regarding the quarterly evolutions and those from July of the current year, the situation seems to deteriorate. In July the exports to EU decreased by 23.5%, compared to July In the first half of 2012, still the positive trend of exports on Western markets was due to the increase compared to the similar period of the last year of sugar deliveries by 9 times, amounting 13 million USD, fruits by 41.2%, there were some deliveries of milk and dairy products 2 etc. At the same time there were visible decreases of the exports of the main products delivered on the European market: cables (20.3% compared to 45.7% in the similar period of last year), clothing (1.9%), animal fat (67.9%, compared to % in the similar period of last year), furniture (20.7%, compared to 245.4% in the similar period of last year), footwear (8.9%). There were significant decreases of the exports of oleaginous seeds and fruit (by 39.4%), grains (by 62.5%), knitted and weaved clothing and clothing items (by 12.5%), etc. Although the exports to other markets, other than CIS and EU, seem to recover little by little, the data for the first six months reflect a decrease of 6.7%. The exports on the main markets of this group Turkey and USA decreased in this period by 38.9%, respectively 3%, although starting with the 2nd quarter the exports to USA started to recover, and started increasing again. There were positive trends in the 1st half, compared to the similar period of last year, to Iraq by 4.8 times, Georgia by 54.4%, New Zealand by times, China by 2.5 times, Libya by 19,7% etc. Regarding the exports to Turkey in this period, there was a decrease for some products with high weights in the structure of deliveries for this destination last year, such as knitted and weaved products ( 23.8% 1 ; 9.5 million USD 2 ) 3, practically the exports of oleaginous grains and fruits decreased almost to zero ( 99.6%; 49,7 thousand USD), also waste of cast iron, iron or steel ( 100% from 7 million last year), wheat ( 100% from million USD last year), corn ( 36.7%; million USD). At the same time, the deliveries for other destinations increased, especially the exports of oleaginous grains and fruit to New Zealand, wines to China and Georgia, fresh unpeeled or dry fruit to Iraq, live animals such as bovines to Libya, etc. As a result of the afore mentioned aspects, and as reflected in Table 4.4, in the first half of this year, the positive trend of exports was maintained by several products which, although had lower growth rates, positively influenced exports due to their high weight in the structure of exports. Here we can mention the deliveries on external markets of fats and oils, textile materials, cables and other insulated electrical conductors, with or without connectors (a subgroup which represents 80% of the exports of electrical machines, devices and equipment and parts thereof), furniture, knitted and weaved textiles, etc. Besides these products, the exports of fruits and vegetables, various optical instruments and devices (e.g. compasses, to the Russian Federation, orthopedic items and devices to Italy, weaving machines and devices to Germany, gas meters to Poland and Bulgaria, etc.) were also successful. Also, there was an invigoration of exports of wines and sugar, which increased by 21%, after a decrease of 14.5% in the similar period of last year, and sugar, which increased 3.6 times. In the first six months of this year, the volume of cane or beet sugar exports amounted 15.6 thousand tons, with a value of 13.6 million USD. In the similar period of last year, there were exports of 2.05 thousand tons ( thousand USD) practically fully oriented to the Russian market (2.04 thousand tons). This year, in the 1st half there were exports on this market of 2.6 juices thousand USD to thousand USD), petroleum oils from 6.7 million USD to 1.2 million USD), Diesel from 1.9 million USD to 588 thousand USD), black oil from 4.6 million USD to thousand USD), integrated circuits and electronic micro assemblies from 2.1 million USD to 0, etc. 2 Dairy exports increased from thousand USD to thousand USD, and were delivered mainly in Great Britain. 3 The indicated values reflect: 1. Growth rate; 2. Value. 52
53 thousand tons, but which represented only 16.4% of the exports of sugar from this period. 83.6% or 13.1 thousand tons (11.5 million USD) were exported to EU countries: to Romania 5.1 thousand tons; to Poland 4.3 thousand tons; to Bulgaria 3.7 thousand tons (1.1 tons were exported in the similar period of last year). Despite the increase of the exported quantity of sugar, there was a decrease of the unit value of exports from 0.96 to 0.8 USD cents on the Russian market and from 1.02 to 0.88 USD cents on European markets. SA code Table 4.4. List of products with the highest influence on the increase of exports in the 1st half of 2012 Commodity group name Nominal value, million USD Structure % Growth rate, % Influence degree Edible fruits and nuts Alcoholic beverages, alcoholfree beverages and vinegars Animal or vegetable fats and oils and dissociated products Electrical machines, devices and equipment and parts thereof 17 Sugar and sugar based products Optical, photographic or cinematographic, measurement, control or precision instruments and devices 94 Furniture Other manufactured textile items Knitted or weaved textile materials Vehicles and equipment for railways or similar, and parts thereof Source: According to the National Statistics Office. Section 4.1 Evolutions of the exports of Moldovan wines in the first half of the year In January July 2012, there were exports on external markets of 579 thousand hl of wine in value of 65.6 million USD. After a decrease of 11,2%, respectively 5% of the unit value and of the quantity delivered in the 1st half of 2011 compared to the similar period of 2010, in 2012 they decreased by 12.5, respectively 21.3%. The average value of a decaliter of wine delivered on external markets was 11.3 USD, compared to 10.1 USD last year. Except for Belarus and Ukraine, the nominal value of wine exports increased on almost all CIS markets Azerbaijan, Kirghistan, Kazakhstan, Tajikistan and the Russian Federation. There were exports to the Russian Federation in this period of 170 thousand hl, in value of 21 million USD. The growth trend was caused by the increase of the export unit value, despite the decrease of the exported volume. 53
54 CIS EU Other countries Unit value, USD/hl Volume, mii hl Value, mil. USD Figure Exports of wines in the 1st half of 2012 Source: According to the National Statistics Office. At the same time, an inverse situation can be noticed on EU markets and on other markets, where the increase of the nominal value was maintained by the increase of delivered volumes, on the background of a significant decrease of the average export values. At the same time, an optimistic note is that the exports of Moldovan wines seem to be gradually reoriented towards other markets. The volume exported on markets other than CIS and EU increased by more than 3 times. An increase of 4.8 times was recorded for the quantities delivered to Georgia, namely 33.6 thousand hl, China by 3.4 times 10.3 thousand hl, Nigeria by 65% 1.2 thousand hl, Israel by 2.4 times 858 hl, Japan 1.5 times 265 hl etc. At the same time, many products which last year contributed to the fast increase of exports, this year recorded significant decreases: various agricultural and food products, especially oleaginous grains and fruits, grains, vegetables and vegetable products, etc.; metals, knitted and weaved clothing and clothing accessories, fuels, etc. The decrease of the delivery of these products can be determined by the reduction of the vegetable production and of the metallurgic industry by 15.4%, respectively 19.3%, but can probably be explained also by the decrease of external demand on some markets following the high pressure economic situation. SA code Table 4.5. List of products with the highest influence on the decrease of exports in the 1st half of 2012 Commodity group name Nominal value, million USD Structure % Growth rate, % Influence degree Oleaginous grains and fruits 72 Cast iron, iron and steel Grains Nuclear reactors, boilers, mechanical machines, equipment and devices Copper and copper items
55 Vegetables, plants, roots and food tubers Mineral fuels, oil and products resulted from their distillation Products made from vegetables, fruits or the parts of plants Paper and cardboard; products made of cellulose, paper or cardboard 70 Glass and glass items Aerial vehicles, space aircraft and parts thereof Clothing and clothing accessories, knitted or weaved 73 Products made of cast iron, iron or steel Mill industry products Source: according to the National Statistics Office Imports While in the first quarter imports recorded evolutions which were better than exports, in the 2nd quarter they recorded a negative trend compared to the similar period of last year, and this evolution was predominant in the commercial relations with CIS countries. Overall, in the 1st half of the year, the increase of imports was of only 3.6%, and their structure was modified in the detriment of CIS countries by 0.3% and EU by 1.2%, and the share of other countries increased by 1.5%. Thus, they were distributed as follows: EU 43.3%, CIS 32.5%, other countries 24.2% Q I Q II Q III Q IV Q I Q II Q III Q IV Q I Q II Total CIS EU Other countries Figure Moldovan exports by geographical destinations, % Source: According to the National Statistics Office. 55
56 CIS imports constituted thousand USD in January June 2012, a 2.7% increase this modest evolution was conditioned by the decrease in the 2nd quarter of the imports from the main CIS partner states the Russian Federation, Ukraine and Belarus. A more visible decrease in this period was recorded for the imports of fuels, various metals, nuclear reactors, electrical machines, equipment and devices, terrestrial vehicles. For the first 6 months, EU imports recorded a low increase of 0.9%, although the decrease from the 2nd quarter was not as high as in the case of imports from CIS countries. The products with predominantly negative trends were fuels 12.9% decrease (151.6 million), nuclear reactors, by 10.9% (82.6 million USD), rubber and rubber items by 19.4%, optical instruments and devices, knitted and weaved textile materials, synthetic or artificial fibers, etc. Half of the imports from EU are mineral fuels (14.2%), electrical equipment and devices (10.2%), land vehicles (8.7%), nuclear reactors (7.8%), pharmaceutical products (6%), plastic materials (4.6%), etc. Unlike the main commercial partners of EU and CIS, the imports of other countries were less volatile. In the first half of the year, the imports from these countries amounted million USD, 10.4% more than in the similar period of last year. Among the products which conditioned decreases of imports for these destinations, there was the decrease of the deliveries of vegetables and grains, from 21.6 million USD to 16 million USD), respectively from 1.5 million USD to 776 thousand USD, electrical devices and equipment by 4.5% (64 million USD), pharmaceutical products by 0.8%, namely 28.3 million USD), paper and cardboard products (11.7 million USD), cast iron, steel and iron products (12.6 million USD), aluminum and products made of aluminum by 33.7% (4.2 million USD) etc. Overall, among the products with the highest contribution to imports in the first half of the year were cane and beet sugar (with 4.7 million USD, 15 times more), fuels 4, essential oils, and the products shown in Table 4.6. SA code Table 4.6. List of products with the highest influence on the increase of imports in the 1st half of 2012 Names of products Nominal value, million USD Structure % Growth rate, % Influence degree, % Mineral fuels Essential and resinbased oils Other manufactured textile items Plastic materials and products Meat and edible organs Alcoholic beverages, alcohol free beverages and vinegars The value of fuel imports in the 1st quarter was million USD, and in the 2nd quarter, 238 million USD. After a 19% increase of fuel imports in the 1st quarter compared to the similar period of last year, in the 2nd quarter they decreased by 0.8%, following decreases in the deliveries from EU and CIS by 5.8% and 6%. At the same time, in both quarters, the imports from other countries increased from 1.5 million USD to 28.6 million USD. There were imports of Diesel from Israel of 18.2 million USD, also from South Korea (2 million USD) 56
57 Pharmaceutical products Furniture Sugar and sugar based products Source: According to the National Statistics Office. On the contrary, the decrease of imports influenced the decrease of commercial inflows of vegetables, various manufactured products, metals, paper and cardboard, etc. SA code Table 4.7. List of products with the highest negative influence on the increase of imports in the 1st half of 2012 Names of products Nominal value, thousand USD Structure % Growth rate, % Influence degree, % Nuclear reactors, boilers, mechanical machines, equipment and devices Vegetables, plants, roots and food tubers Tobacco and processed tobacco replacements 74 Copper and copper items Paper and cardboard Cast iron, iron and steel Inorganic chemical products, inorganic or organic compounds of precious metals Electrical machines, devices and equipment and parts thereof Products made of cast iron, iron or steel Source: According to the National Statistics Office. Evolution of the foreign trade of the region on the left side of the Dniester In the first quarter of 2012, the foreign trade of Transnistria amounted to million USD, a 41.7% increase compared to the similar period of last year, after a 9.1% reduction in the similar period of The higher dynamics of imports compared to exports, contrary to the trend 57
58 recorded in the first quarter of last year, generated an almost twofold increase of the commercial deficit, from million USD to million USD. The exports which in January March 2011 decreased by 8.7%, compared to the similar period of 2010, increased by 8.9% this year. The value of exports amounted to million USD in the first three months of this year. The increase of exports in this period was supported by the increase of deliveries to CIS countries by 17.2% in the Russian Federation by 14.1%, in the Republic of Moldova by 2.7%. Exports to Romania increased by 70% and approximately 4 times to Poland. At the same time, negative evolutions on other markets, including Italy ( 22.9%) and Germany (28.1%) conditioned a decrease of exports to other countries, excluding CIS by 3.4%. Consequently, approximately 62% of exports were oriented in this period on the markets of CIS, out of which 60.6% in the Republic of Moldova (34.8%), Russian Federation (18.9%), Ukraine (6.9%). 38% of deliveries were to other countries, including Romania (16.7%), Italy (9.2%), Germany (5.4%), Poland (2.1%). Regarding the delivered products 58.7% or 75.7 million USD were deliveries of fuel (47.4 million USD) and metals (28.3 million USD). They increased compared to the similar period of last year by 7.5%, and correspondingly, 8.8 times. Last year, in the 1st quarter, metal exports represented only 3.2 million USD. At the same time, following the decrease of external demand, as well have declined the exports of products from the light industry (to 28.6 million USD), of the machine manufacture industry (to 6.5 million USD) and agricultural and food products by approximately 40% (to 11.4 million USD). Imports, in the 1st quarter of 2012, amounted to million USD, a 56.3% increase compared to the similar period of last year, after a decrease of 9.4% in the 1st quarter of last year. With an increase of approximately 2 times, the imports from CIS represented 82.9% of the total imports, out of which 76.4% came from the Russian Federation, 10.4% from Ukraine, 5.8% from the Republic of Moldova, 5.2% from Belarus. Imports from Russia in the 1st quarter of 2012 were million USD, 2.4 times higher, and imports from the Republic of Moldova increased from less than 4 million USD to 20 million USD. At the same time, imports from Ukraine and Belarus recorded a negative trend. Other countries which provided products for the Transnistria market, although in a lower value than in the 1st quarter were Italy (3.8%), Germany (1.4%), Romania, etc. Like in the case of exports, the increase of imports mainly occurred, predominantly, 70% of the total imports, from fuel deliveries (270.7 million USD) and raw materials for the metallurgic industry (23.8 million USD). Their increase was significant 2.5 times, respectively 2 times compared to the similar period of At the same time, the imports of agricultural and food products, raw materials for the clothing industry and products for the machine manufacturing industry decreased. Trends and policies in the main countries which are economic partners of the Republic of Moldova World economy continues to rebound progressively, despite a relatively synchronized decrease of the growth rate in the 2nd quarter of The most recent data from surveys indicate some signs of stabilization for the 3rd quarter, although very weak. Starting with the 4th quarter, we expect a gradual consolidation of economic activities. We anticipate a world economic growth of 3.5% 5 for 2012, forecasts conditioned by the anti crisis actions of European leaders which shall gradually improve the situation of the states in difficult situations, and monetary policy measures taken in some emerging economy states. A trend of the large central banks of the world is to decrease interests and extend liquidity programs in order to encourage crediting and stimulate the economy
59 Table 4.8. Development trends of the main economic partners of the Republic of Moldova (2nd quarter compared to the similar period of last year, %) Country/Indicator GDP IPC Export Import Unemployment rate USA European Union Romania Russian Federation Ukraine Source: National statistics of USA, Romania, CIS, Russia, Ukraine, Eurostat. Note: The unemployment rate in Ukraine is indicated for the 1st quarter of USA The economy of the United States is facing enormous challenges in the first half of Although the bases of economic freedom remain strong, the recent interventions of the Government set drastic limits on public expenditure, on all governance levels, which currently exceed 1/3 of GDP. The trust in the determination of the Government to promote or even sustain open markets discouraged entrepreneurship and investments in the dynamic framework of the private sector. For USA, IMF estimates an economic growth of 2% this year, and 2.3% for In the 2nd quarter of 2012, GDP in USA increased by 2.1% compared to the similar period of last year (1.9%). Regarding the expenditure component, the increase of GDP was mainly determined by the increase of the consumption of durable goods, which increased by 7.5% compared to 0.9% for non durable goods, by the increase of private investments by 10.9% (in the 2nd quarter of 2011 the increase was of 3.9%), by the exports of goods and services by 4.3%, which exceeded the increase of imports of 3.9%. At the same time, there is a decrease of governmental expenditure. The unemployment rate as of July 2012 was 8.3%, compared to 9.1% last year. Historically, from 1948 to 2012, the USA unemployment rate was in average 5.79%, with a peak of 10.80% in 1982 and a record minimum of 2.50% in In the 2nd quarter, the annual rate of the consumer price index in USA was 101.9%, less than the 103.4% increase recorded in the 2nd quarter of At the same time, compared to the previous period, in the first two quarters the index was 108%. The value of the exports of goods in the 2nd quarter was 392 billion USD, a 5.9% increase compared to the similar period of last year, while the increase of imports was 3.7%, amounting 595 billion USD. Thus, the deficit of the commercial balance of goods was 203 billion USD, 10% more than in the similar period of last year. Although USA maintained its external commercial flows on a positive trend, their increase was significantly lower compared to the evolutions of last year. European Union Between January and June 2012, the Euro area was the epicenter of stress on the financial market, triggered by the political and financial uncertainty of Greece and the problems from the banking sector of Spain. The evolution of the GDP in the 2nd quarter indicates the possibility that the economy of the Euro area and EU would continue to be in recession in the next quarter as well. In the 2nd quarter of 2012 the economy of the European Union recorded a decline of 0.6% compared to the similar period of last year. In the first quarter of 2012, the growth rate was 59
60 0.0%. The most obvious decrease of GDP in the 2nd quarter of 2012 occurred in Greece ( ) 6.3%, Slovenia ( ) 3.2%, Italy ( ) 2.8%, Cyprus ( ) 2.3%, the Czech Republic ( ) 1.7%, Belgium and the Netherlands ( ) 0.4% etc.; at the same time, in other European economies which represent important commercial partners of the Republic of Moldova Romania and Germany, there were positive trends of 1.2% and 0.5%, etc. According to the forecasts of the Central European Bank 6, the growth rate of the real GDP in the Euro area will be between 0.5% and 0.1% in 2012, and the available forecasts for 2013 indicate values between 0.3% and 1.0%. Since the beginning of the year, in the Euro area (17) there was a decrease of 0.3% in the 1st quarter, and in the 2nd quarter a decline of 0.8%. In the 2nd quarter of 2012, the unemployment rate was 10.4%, compared to 9.6% in the similar period of last year. Among the member states, the lowest unemployment rate was in Austria (4.5%), the Netherlands (5.3%), Germany and Luxembourg (5.5%), and the highest in Spain (25.1%) and Greece (23.1% in May 2012). Compared to last year, the unemployment rate decreased in 10 member states, but increased in 16 countries and remained stable only in Slovenia. The consumer price index, annual average, has decreased since the beginning of In the 1st quarter it was 103.1%, while in April the value was 103.1%, in May 103%, and in June 102.9%. In 2011 the increases were more modest, of 0.1%, from 2.2% in January to 2.7% in June. After a 28.2% increase of exports and a 25.7% increase of imports in the 2nd quarter in 2012, compared to the same period of last year, the growth rate of the foreign trade of EU countries continued to decrease, and in the 2nd quarter there was even a decline of 1.1%, respectively 8.4%. Thus, in April June 2012 exports amounted to billion USD, and imports billion USD. Romania While the Euro area and the European Union were in recession, Romania recorded in the 2nd quarter of 2012 an economic growth of 1.2% compared to the second quarter of last year. The increase of GDP in the second quarter of 2012 was sustained by the positive dynamics of the gross formation of fixed capital (+15.2%), compared to the 1.4% decrease recorded in the 2nd quarter of last year and that of consumer expenses of households (+1.6%), of exports of services (+14.4%) and the very low increase, of 0.2%, of the imports of goods and services. At the same time, these evolutions were compensated by the negative trends of the consumption of public administrations and the decrease of the exports of goods. By production components, the economic growth in Romania was negatively influenced by the decrease of agricultural production by 1.6% and the decrease of industrial production, which increased by only 0.5% compared to 4.9% in the similar period of last year and the deceleration of the volume of trade and intermediation services by 0.2% and 0.9%. Inflation in the 2nd quarter of 2012 compared to the same period of last year was 103%. The highest values in relation to the second quarter of 2011 were recorded in the sector of services (105.7%), followed by non food products (103.37%) and food products (101.2%). In the second quarter of 2012, the unemployment rate was 6.9%, less than the recorded value in the last quarter (7.6%) and that of the same period in 2011 (7.2%). By genders, the gap between the two unemployment rates was 1.4% (7.5% for men compared to 6.1% for women). Exports in the second quarter of 2012 were 14.4 billion USD, and imports 18 billion USD. Exports decreased by 9.1%, and imports by 11%, compared to the similar period of
61 Although there was a downward trend of the growth rates of the Romanian foreign trade in the second half of last year, since the beginning of this year it resumed the negative trend recorded at the end of Ukraine The GDP of Ukraine in the second quarter of 2012 increased compared to the similar period of last year by 3%. At the same time, the increase of GDP in the first quarter of 2012 was 2%. According to Ukrainian statistics, the increase of GDP in the first half of this year was 2.5%, and the nominal value was 631 billion USD. According to the estimates of Ukrainian authorities, the increase of the GDP of Ukraine in 2012 will be 3.9%. At the same time, the experts of international financial organizations estimate an increase of 1.3%. In the second quarter of 2012, in Ukraine the inflation rate increased by 1.09% compared to the similar period of last year, and it was 99.8%. The highest increases of consumer prices were recorded for transportation services (100.5%), followed by communal services (100.0%), and a decreasing trend was recorded at IPC for goods and services (99.8%), including food products (99.5%). The unemployment rate in the first quarter of 2012 was 8.4%, and at the end of the half year the indicator decreased by 0.6 p.p. For reference purposes, the values of the indicators for the corresponding periods of 2011 were 8.7% and 8.2%. In the second quarter of 2012 exports amounted to 17.5 billion USD, exceeding the value recorded in the similar period of last year by 0,3%,; imports recorded 21.8 billion USD, 9.9 % more compared to the same quarter of Russian Federation In the first quarter of this year the volume of GDP of the Russian Federation increased by 4.9% compared to the same period of last year, and in the 2nd quarter the increase was 4%. Because we have insufficient data, we cannot analyze the GDP in the 2nd quarter by categories of uses, but the available data for the 1st quarter allows us to conclude that the increase of GDP was generated by the increase of fixed capital investments by 15% (compared to 4.9% in the similar period of last year), of household consumption by 7.2%, a 1.1% increase compared to the similar period of last year, and the increase of the export of goods and services by 4.4%. The positive effects of the aforementioned components were partially compensated by the negative effects of public administration consumption by 0.5% and of the imports of goods and services by 10.2%. The consumer price index for the 2nd quarter decreased compared to the 1st quarter of 2012 and was 103.8%. At the same time, we estimate an acceleration of inflation in the 3rd quarter, as a result of drought in many regions of Russia and of the new indexation as of September 01. In 2011, 2nd quarter, compared to the same period of last year, inflation was 109.5%. The highest values were recorded for non food products (105.7%). The unemployment rate in the 2nd quarter of 2012 was 5.4%, 0.9% less than in the same period of last year. The increase of the value of foreign trade in the first three months of this year followed the tendency of attenuation from the second half of last year. Nevertheless, in the first quarter the external commercial flows maintained a positive trend. However, the second quarter marked a decrease of both imports and of exports compared to last year. Thus, in April June 2012 exports amounted billion USD, and imports 81.2 billion USD, 1.7%, respectively 2.2% less. 61


62 Chapter V BUSINESS ENVIRONMENT Business activities. Number of registered entities: classification by organizational legal forms. According to the data of the State Chamber of Registration, as of July 01, 2012, the State Register contained information on 162,360 legal entities and individual entrepreneurs. On July 01, 2012, compared to January 01, 2012, the number of entities from the Register increased by 1,643 companies, or 1%. Compared to the similar period of the previous year, the weight of the companies recorded in the Register by organizational legal form was not essentially modified, and entrepreneurs prefer to register their business especially by two organizational legal form: limited liability companies (49%), which increased by 2 pp compared to the previous period, and individual entrepreneurs (41%). The weight of joint stock companies is 3%. The weight of state and municipal entities in the State Register is 1%. state and municiapal enterprises 1% non commercial organizations 2% cooperative 2% others 2% joint stock companies 3% limited liability companies 49% individual enterprises 41% Figure 5.1. Companies registered by organizational legal form, by Source: According to the data of the State Chamber of Registration. Dynamics of entities registered and deregistered during the first semester of The number of entities registered at the State Chamber of Registration decreased in the first half year of 2012 compared to the same period of last year, and the index is 91.4%. Thus, according to the State Chamber of Registration, 3,256 companies were registered in the State Register between January June In the first semester of 2012, in the official territory of Chisinau, 1,949 new companies were recorded, constituting 59.8% of the total number of companies recorded in January June, current year. The number of deregistered entities in the first semester of 2012 was 1,612 units or 8.6% less than in the same period of last year. 62
63 year 2011 year jan. feb. mar. apr. may jun. Figure 5.2. Evolution of the number of entities registered in January June Source: According to the data of the State Chamber of Registration year 2011 year jan. feb. mar. apr. may jun. Figure 5.3. Evolution of the number of entities deregistered in the January June Source: According to the data of the State Chamber of Registration % of the companies deregistered between January and June 2012 were outside Kishinev. The calculated indicator, which characterizes the net increase/decrease of the number of entities (registered minus deregistered), shows that in the first semester of there was a net decrease of the number of entities, as the index was 91.4 %. According to NBS data, between 2010 and 2011 there was an insignificant bur constant increase of the number of companies: from 46.7 to 48.5 thousand companies, and the index was 103.9%. 63
64 Table 5.1. Dynamics of the entities registered and deregistered in the first semester of Net increase/decrease Years/month Number of units (registered minus deregistered) Index, % 2011, 1st semester 1, , 1st semester, including: 1, January February March April May June Source: Calculations of the authors according to the data of the State Chamber of Registration. Business development indicators in 2011 The average number of company employees, according to NBS data, between 2010 and 2011, recorded, the same as in previous years, a decrease trend (the index was 97.0%). Table 5.2. Dynamics of the main indicators of companies activity in Number of units, thousand units Indices % Number of employees, thousand persons Indices % Revenues from sales, million MDL 177, ,677.0 Indices % Profit (+), loss ( ) before taxation, million MDL 13, ,427.0 Indices % 3.6 times Source: Authors' calculations according to the NBS data. In the SME sector, between 2010 and 2011, there was also a decrease trend of the number of employees (the index was 95.07%). On the contrary, the group of micro companies recorded in the given period an increase of the average number of employees (the index was 108.9%). In this period, we noticed a slight decrease of the average number of employees from the SME sector in most sectors of the economy (by 21.3% in the agricultural sector compared to 2010; by 9.9% in the processing industry; 4.4% in constructions, etc.) The average number of employees in the SME sector is 6.2 persons per company, and for micro companies, the given indicator is
65 Although the weight of large companies is only 2.5%, in 2011 they generated 65.4% of the revenues from sales (2.2 pp more than in the previous year). In 2011, there was an increase of revenues in economy sectors (the turnover increased by 17.0% compared to 2010). In , the highest increase of the revenues from sales was recorded by the following sectors: trade (by 18.8%), agriculture (18.3%), processing industry (18.0%). Table 5.3. Distribution of the number of active companies and the employment rate by size, 2011 Size Number of companies Weight of companies (%) Number of employees Weight of employees (%) Average size of the company Micro 36, , Small 9, , Medium 1, , SME 47, , Large 1, , Total 48, , Source: Authors' calculations according to the NBS data. mil MDL Agric., hunting ec., wood cult. Processing industry Electric power, gas and water Constructions Wholesale and retail trade Other activities Figure 5.4. Revenues from sales by types of activities, Source: According to the NBS data. The sector of small and medium enterprises represents 97.5% of the total number of companies, employed 57.7% of the employees and generated 34.6% of the revenues of the formal sector in According to the data of the NBS in January June 2012, there was an increase of only 2.9% (in comparable prices) of the revenues from sales for the companies operating in retail 7 compared to the same period of In the 1st semester of 2012, an increase of the turnover of entities operating in retail was registered only in the Southern region (an 11.9% increase) and in Kishinev (by 4.2%) compared to the similar period of last year. 7 Entities which had retail trade as their main scope of activity, with more than 20 employees, comprised in the monthly statistical research on short term indexes (SERV TS). 65

 of the turnover of the companies mainly operating in wholesale 8 compared to the same period of 2011.")


66 % average number of employees sale revenues 0.0 medium enterprises small enterprises micro enterprises large enterprises Figure 5.5. Structure of revenues from sales and average number of employees by company size, 2011 Source: According to the NBS data. According to NBS, in January June 2012, there was an increase of 3.9 % (in current prices) of the turnover of the companies mainly operating in wholesale 8 compared to the same period of The companies from the Southern region and Kishinev recorded an increase of the retail turnover (by 6.6% in the Southern region and 6.3% in Kishinev). Companies from the North, Center and ATU Gagauzia regions recorded significant decreases of the turnover compared to January June In January June 2012, there was a 4.4% increase of the turnover for the companies mainly operating in market services provided to the population 9 (in comparable prices) compared to the similar period of last year. In this period, the entities from Kishinev, the Northern, Center and Southern regions recorded turnover increases compared to the first semester of % Turnover in retail trade Turnover in wholesale trade Turnover with market services rendered to public Turnover with market services rendered to business Chisinau North Center South Figure 5.6. Evolution of the turnover for trade and services by development regions in the 1st year half of 2012 in % compared to the 1st year half of 2011 Source: According to the National Statistics Office. 8 Entities which had wholesale trade as their main scope of activity with more than 20 employees included in the monthly statistical research on short term indexes (SERV TS). 9 Entities which had market services provided to the population as their main scope of activity, with more than 20 employees, included in the monthly statistical research on short term indexes (SERV TS). 66
67 The value index of the turnover of the companies mainly operating in market services provided especially to companies 10, in January June 2012 increased by 0.7% (in current prices) compared to the 1st semester of A higher turnover increase was recorded by the entities of ATU Gagauzia (27.2%) and the Southern region (15.8%). As of August 15, 2012, the development strategy for the sector of small and medium enterprises for was approved, wich aim is to support and develop the SME sector and the creation of a favorable business environment. The following are among the priority directions of the Strategy: adjustment of the normative framework of regulation to the necessities of SMEs development, the improvement of the access to financing, increasing the competitiveness of SMEs and developing business partnerships. Box 5.1 Moldova in the Global Competitiveness Report ( ) The Global Competitiveness Report is annually published by World Economic Forum, measures the competitiveness of the country, and depending on these findings it rates the analyzed nations. According to the Global Competitiveness Report ( ), out of 144 states, which participated in the study, Moldova was 87th, 6 positions higher. According to the rankings, these are some of the countries that ranked higher than Moldova: Ukraine (73), Georgia (77), Romania (78), the Russian Federation (67). According to the Global Competitiveness Report, Moldova is in the stage I, namely competitiveness determined by production factors (unqualified or poorly qualified labor force, natural resources). The report also assumes the presence of basic, essential conditions (institutions, infrastructure, macroeconomy, health and primary education). Thus, under the Institutions indicator, we have an unfavorable position in the following fields: ownership rights (position 122), justice system independence (position 138), favoritism in the decisions of governmental officials (121). In the field of the quality of total infrastructure, and in this period, there is an unfavorable situation (position 116), and regarding the quality of roads, we are the same as last year, on the last position. Out of the 12 aforementioned components, Moldova obtained relatively higher rankings for indicators "workforce efficiency" (position 81) "technological qualification" (position 65). In the field of innovations, the Republic of Moldova was 135th, 7 positions lower than in the previous period. IGC for RM is Institutions Infrastructure Macroeconomic environment Health and primary education Higher education and training Good market efficiency Labour market efficiency Financianal market development Technological readiness Market size Business sophistication Innovation Figure 5.7. Evolution of the Global Competitiveness Index by components, for and Source: According to the Global Competitiveness Report and the Global Competitiveness Report Entities which had market services provided to enterprises as their main scope of activity, with more than 20 employees, comprised in the monthly statistical research on short term indexes (SERV TS) 67
68 Business development indicators in the region of the left side of the Dniester In the region of the left side of the Dniester, there were 160 companies and organizations which incurred losses in January March Among the organizations which incurred losses in this period, the highest weight is that of organizations operating in industry (28.7% of organizations incurred losses). Also value wise, industry entities incurred the highest loss (85.4% of the total losses). Table 5.4. Loss of organizations by types of activities, January March 2012 Number of organizations which incurred losses Loss amount, thousand RUB total in % Total ,839 including: industry ,253 agriculture ,408 transportation ,210 communications constructions ,969 trade and public catering ,966 housing administration and communal services ,007 other branches ,612 Source: Report on the Social Economic Developmnet of the Moldovan Transnistrian Republic, Januaryseptember
69 Chapter VI SOCIAL SECTOR Demographic situation. The resident population of the Republic of Moldova as of January 01, 2012 was 3,559.5 thousand persons, 0.9 thousand persons less than on the same period of The population by area: urban population 1,485.7 thousand persons, or 41.7% of the total population; rural population 2,073.8 thousand persons, or 58.3%; population by gender: men 1,711.7 thousand persons or 48.1%, women 1,847.8 thousand persons or 51.9%. The structure of the population by age groups is characterized by the weight of population under the active age of 17.5%, 66.6% active population, and 15.9% above active age. The population aging coefficient (number of people of 60 and over per 100 inhabitants) was Almost 15.5% of the rural population exceeded the age of 60 and 18.4% of old women are in the total rural women. In January June 2012, the total number of live births in the country was 18,979 persons or 10.7 persons per 1,000 inhabitants. The number of live births increased by 2.0% compared to the same period of previous year. The number of live births of children in Chisinau was 5,142 pers. or 13.0 pers. per 1,000 inhabitants; in the North region 4,801 pers. or 9.7 pers. per 1,000 inhabitants; in the Center region 5,415 pers. or 10.3 pers. per 1,000 inhabitants; in the South region 2,603 pers. or 9.7 pers. per 1,000 inhabitants; in UTA Găgăuzia 987 pers. or 12.3 pers. per 1,000 inhabitants Live-births per 1000 inhabitants Deaths per 1000 inhabitants Natural decrease Fig Birth rate, death and natural decrease of population in January June , promile Source: According to the National Bureau of Statistics. The total number of deceased in the country was 20,836 pers. or 11.8 pers. per 1000 inhabitants. The number of deaths dropped by 3.7% compared to previous year. The number of deceased in Chisinau was 3,250 pers. or 8.2 pers. per 1,000 inhabitants; in the Northern region 6,925 pers. or 13.9 pers. per 1,000 inhabitants; in the Center region 6,491 pers. or 12.3 pers. per 1,000 inhabitants; in the South region 3,253 pers. or 12.2 pers. per 1,000 inhabitants; in UTA Găgăuzia 914 pers. or 11.4 pers. per 1000 inhabitants. 69
70 The number of infant deceased was 180 persons or 9.5 infant deceased per 1,000 live births. The number of infant deceased in Chisinau was 66 pers.; in the North region 32 pers.; Center 51 pers.; South 22 pers.; UTA Găgăuzia 9 pers. The structure of mortality by classes of decease causes shows that most deaths (59.7%) are caused by diseases of the circulatory apparatus, malign tumors represent 13.7%, diseases of the digestive apparatus 8.7%, accidents, intoxications and traumas 7.0%, diseases of the respiratory apparatus 4.6%, other classes 6.3%. In January June 2012, the natural decrease of the population was 1.1 pers. per 1,000 inhabitants, compared to 1.5 in the 1st half of The natural decrease in Chisinau was 1,892 pers. or 4.8 pers. per 1,000 inhabitants; in the Northern region 2,124 pers. or 4.3 pers. per 1,000 inhabitants; in the Center region 1,076 pers. or 2,0 pers. per 1,000 inhabitants; in the South region 650 pers. or 2.4 pers. per 1,000 inhabitants; in UTA Găgăuzia 73 pers. or 0.9 pers. per 1,000 inhabitants. The total number of marriages in the country was 8,698 or 4.9 marriages per 1,000 inhabitants, a 9.9% decrease compared to the same period of last year. The number of marriages in Chisinau was 2,222 marriages or 5.6 marriages per 1,000 inhabitants; in the Northern region 2,171 marriages or 4.4 marriages per 1,000 inhabitants; in the Center region 2,663 marriages or 5.0 marriages per 1,000 inhabitants; in the South region 1,183 marriages or 4.4 marriages per 1,000 inhabitants; in UTA Găgăuzia 453 marriages or 5.6 marriages per 1,000 inhabitants. The total number of divorces in the republic was 5,432 or 3.1 divorces per 1,000 inhabitants, 2.7% less than the same period of last year. The number of divorces in Chisinau was 1,444 divorces or 3.6 divorces per 1,000 inhabitants; in the Northern region 1,353 divorces or 2.7 divorces per 1,000 inhabitants; in the Center region 1,642 divorces or 3.1 divorces per 1,000 inhabitants; in the South region 730 divorces or 2.7 divorces per 1,000 inhabitants; in UTA Găgăuzia 234 divorces or 2.9 divorces per 1,000 inhabitants. Population migration. In January June 2012, according to the Ministry of Internal Affairs, 1,141 foreign citizens and 222 repatriates received residence permits (permanent and temporary). The structure of immigrants by arrival purpose, was dominated family immigrants 41.4%, for work 39.0%, for studies 6.2%, other causes 13.4%. other causes % studies - 6.2% family immigration % immigration for work % Fig.6.2. Distribution of foreign citizens by the purpose of arrival in the Republic of Moldova in January June 2012, % Source: According to the Ministry of Internal Affairs. 70
71 By the country of emigration, foreign citizens are immigrants from: Ukraine 183 pers., Romania 173 pers., Turkey 134 pers., Russian Federation 129 pers., Italy 60 pers., USA 46 pers., Portugal 30 pers., Germany 29 pers., Syria 24 pers., France 22 pers., other countries 262 pers. Labour market. In the second quarter of 2012, the economically active population of the Republic of Moldova was 1,266.9 thousand persons, on 4.7% ( 61.8 thousand) less than in the second quarter of The structure of the active population was modified as follows: the share of employed population increased from 93.8% to 95.5%, and the share of unemployed population decreased from 6.2% to 4.5% Q.I 2012 Q.II 2012 Share of employed population Share of unemployed population Figure 6.3. Structure of active population in the Republic of Moldova in the 1st and 2nd quarters of 2012, % Source: According to the National Bureau of Statistics. There were no important disparities by sexes and areas among economically active persons: the share of men 51.2%, of women 48.8%, and the share of economically active persons from the rural areas 53.2% were higher than that of the active population from the urban areas 46.8%. Activity rate of the population aged 15 years and over (the proportion of the active population aged 15 years and over in total population aged 15 years and over) was 42.5%, and decreased compared to the respective quarter of previous year (44.7%). This indicator reached higher values among the male population 45.6%, compared to the rate of the female population 39.6%. The activity rate by areas has reached the following values: 46.3% in the urban areas and 39.6% in the rural areas. In age category 15 29, this indicator was 29.1%, and in age category (the active age in the countries of the European Union according to the Eurostat methodology) 47.1%, 2.4% lower than the level of the 2nd quarter of The activity rate of the active population (16 56 for women and for men) was 49.5%. The number of employed population was 1,209.3 thousand persons, 3.0% less than the 2nd quarter of Like in the case of the economically active population, there were no significant disparities by gender (49.3% women and 50.7% men). The same situation was recorded by areas (45.7% urban and 54.3% rural). 71
72 Employment rate of the population aged 15 and over (the proportion of the employed population aged 15 and over in total population of the same age category) was 40.5%, a 1.3% decrease compared to the 2nd quarter of For men it was higher 43.1%, compared to women 38.2%. In the distribution by residence, the employment rate was 43.2% in the urban areas and 38.6% in the rural areas. The employment rate of the work able population (16 56/61) was 47.1%, of the population aged %, and in the age category this indicator was 27.0%. In the distribution by the activities in the national economy: in the agricultural sector thousand persons are active (31.3% from the total number of active persons). Compared to the 2nd quarter of 2011, the number of the active population in agriculture decreased by 9.3 thousand persons, or 2.4% in non agricultural activities the number of active persons was thousand persons, 27.5 thousand or 3.2% lower compared to the 2nd quarter of The weight of active persons in industry was 12.5% (12.6% in the 1st quarter of 2011) and in constructions, respectively, 5.7% (5.8% in 2011). The number of active persons in industry decreased by 3.4% in constructions, 5.3% less than the previous year. In the sector of services there were 50.5% of all active persons, the same as in the 2nd quarter of 2011, while the absolute number of active persons in the sector of services decreased by 18.3 thousand persons. According to the distribution by types of ownership 67.3% of the population was active in units with private types of ownership, 26.1% in units with public types of ownership, and 6.6% in units with mixed types of ownership (public and private) and with the participation of foreign capital. The structure of active population by professional status shows that the number of employees was 66.2% of the total. In the informal sector, there are 13.6% of the total active persons in the economy, and 31.7% had informal jobs. Out of the number of informally employed persons, employees are 19.8%, and 9.5% of total employees have informal jobs. The number of underemployed persons (i.e. those who had a job, but total actually worked hours during the reference period were less than 40 hours a week, while they wanted and were available to work overtime) was 80.8 thousand pers., which represents 6.7% of the total number of employed persons. The number of persons from this category decreased by 19.3% compared to the 2nd quarter of The number of unemployed persons, according to the International Labor Office definition, was 57.6 thousand pers., 25.0 thousand pers. less than the 2nd quarter of Unemployment affected men more 60.9% from the total number of unemployed persons, and people from the urban areas 69.9%. The unemployment rate (rate of unemployed persons from the active population) on country level was 4.5%, lower compared to Q II 2011 (6.2%). The unemployment rate in men and women recorded the following values: 5.4% and 3.6%. Significant disparities were recorded between the unemployment rates from the urban areas 6.8%, compared to the rural areas 2.6%. Among youth (15 24) the unemployment rate was 11.2%. In the age category this indicator was 7.5%. The inactive population aged 15 years and over was 57.5% of the total population of the same age category, higher than the level of the same quarter of 2011 by 2.2%, or 69.2 thousand persons. Regarding the relation to the labor market, there are two important categories within the inactive population: discouraged persons and persons who were declared by household units as having left to other countries looking for work. Discouraged persons were 23.1 thousand pers. compared to 23.5 thousand pers. in The number of persons declared by household units as having left to other countries looking for work was, according to estimates, thousand persons compared to thousand in the Q II Out of the number of persons who left the country, men were 67.3%. The share of persons who left from the rural areas was 73.6%. 72
73 Household disposable income. In the 2nd quarter of 2012, household disposable income was 1,523.1 MDL (according to the Household Budget Survey) in average per person monthly, with an increase of 6.0% compared to the similar period of last year. In real terms (adjusted to consumer price index), household income increased by 1.9%. Depending on residence, the urban household disposable income was in average, MDL or 1.5 times higher than those of the rural household disposable income. In the urban areas, the main income source is salaries 57.0% and social services 15.7% of the total incomes. For the rural population, the most important income source is also represented by salaries 28.5%, and social services 22.6%. The incomes obtained from individual agricultural activities were 19.6% of the total household disposable income from the rural areas. Income sources are distributed by their contribution to available incomes: 43.7% salary payments, which form the main sources of income from total disposable ones, a decrease of 0.3% compared to the 2nd quarter of Social services are another important source of income, with a share of 19.0% (a reduction of 0.2% compared to the same period of 2011). The incomes obtained from individual agricultural activities are 9.8% (a decrease of 0.3% compared to the same period of 2011) from the total household disposable income. The incomes obtained from non agricultural activities were 6.3%. An important source in the formation of the household disposable income is remittances, whose contribution is 15.5%, an increase of 1.1% compared to the same period of Household consumption expenditure. The average monthly household consumption expenditure in the 2nd quarter of 2012 for a person was 1,582.6 MDL, 3.9% higher than in the same period of last year. In real terms (adjusted to consumer price index), the population spent in average 0.2% less than the 2nd quarter of last year. Most of the traditional expenditures are for food 43.7% (0.7% higher compared to the same period of 2011). For housing maintenance, a person allocated, in average, 18.5% of the total household consumption expenditure (+0.5%), and for clothes and footwear 11.2% (+1.1%). Other expenditures were as follows: health 4.8% (compared to 5.4% in the same period of last year); transportation 4.5% (compared to 5.2%); communications 4.5% (compared to 4.3%); house fitting 3.3% (compared to 3.6%); education 0.9% (compared to 1.1%) etc. Remuneration of labour. The gross nominal average salary in the national economy in January June 2012, according to the National Bureau of Statistics of the Republic of Moldova, was 3,391.1 MDL, a 9.3% increase, compared to similar period of the previous year. The highest salary in January June 2012, by the types of economic activities was recorded in the financial sector 6,704.4 MDL; in real estate transactions, leasing and services provided to companies 4,134.0 MDL; transport and communications 4,045.9 MDL. The lowest salary was in fishing 1,538.6 MDL; in agriculture, hunting and forestry 1,944.1 MDL. The gross nominal average salary in the national economy in June 2012 was 3,913.5 MDL, a 10.0% increase, compared to June 2011 and 12.1% compared to May The index of the real salary for June 2012 compared to June 2011 was 106.1% (calculated as the ratio between the index of the gross nominal salary and the index of consumer prices). In the public sector the average salary in June this year was 4,560.5 MDL (+14.6% compared to June 2011). In the real economic sector the salary in June 2012 was 3,617.5 MDL (+7.6% compared to June 2011). In the sphere of education the maximum recorded salary was 5,298.2 MDL in June. However, earning growth in the sphere of education is exclusively granted by leave benefits. From 2011 these are not be distributed for the months of leave, but are included in the month of calculations. 73
74 Table 6.3. The average monthly salary by the types of economic activities in January June 2012, MDL January June 2012 in % I VI compared with January June 2011 Total 3, , , , , , , including: Agriculture, hunting and forestry 1, , , , , , , Fishing 1, , , , , , , Industry 3, , , , , , , Construction 3, , , , , , , Wholesale and retail trade, repair of moto vehicles, motorcycles and 2, , , , , , , household and personal goods Hotels and restaurants 2, , , , , , , Transport and communications 3, , , , , , , Financial intermediation 5, , , , , , , Real estate transactions, renting and business 3, , , , , , , services Public administration 3, , , , , , , Education 2, , , , , , , Health and social work 2, , , , , , , Other collective, social and 2, , , , , , ,811.3 personal service activities Source: According to the National Bureau of Statistics. January February March April May June Subsistence minimum. The size of the subsistence minimum in the 2nd quarter of 2012 in average for one person was 1,455.1 MDL, at the level of the 1st quarter. At the same time, compared to the 2nd quarter of 2011, the subsistence minimum decreased by 3.2% given that the Index of Consumer Prices for food products was 101.9%. The downward of the subsistence minimum was determined by the reduction of prices, especially in food products. By categories of population, the maximum value of the subsistence minimum belongs to the active population 1,531.1 MDL, especially men 1,610.6 MDL. For pensioners the subsistence minimum was 1,259.7 MDL, 86.6% from the average value for the total population. At the same time, the average value of the monthly pension set as of July 01, 2012 was MDL, or 9.3% more compared to the same period of last year. Given that the average value of the pension increased, and the subsistence minimum recorded decreasing trends, respectively the average pension covers the subsistence minimum 76.0% compared to 66.8% in the 2nd quarter of 2011 and 69.5% in the 1st quarter of The subsistence minimum of children, in average, was 1,357.5 MDL per month, with a differentiation depending on children's age: from MDL for a child up to 1 year old to 1,512.7 MDL for a child aged By residence, the subsistence minimum is characterized by higher values for the urban areas 1,608.0 MDL, or 19.5% more compared to the rural areas 1,345.5 MDL. This difference is 74
75 especially due to the different structure of consumer expenses, including a higher weight for the food sector, which determines a lower value of the subsistence minimum in the rural areas. Social protection of population. According to the National Agency of Social Insurance, the number of pensioners registered by the social protection institutions as of July 01, 2012 was thousand persons, or 15.1 thousand persons more compared to July 01, The average value of the monthly (indexed) pension, established on July 01, 2012, was MDL, 9.3% more than July 01, Healthcare According to the preliminary information of the Ministry of Health, the morbidity of the population by some infectious diseases in January June 2012 is characterized by most cases of diseases, such as viral hepatitis 86 cases or 2.4 cases for 100 thousand people, acute intestinal infections 8,664 cases or cases for 100 thousand people, tuberculosis of the breathing apparatus 1,690 cases or 47.5 cases for 100 thousand people, chicken pox 6,307 cases or cases for 100 thousand people. At the same time, there were fewer cases of flu (210 cases compared to 4,567 cases in January June 2011) and acute infections of the respiratory tract with multiple localizations (109.8 thousand cases compared to thousand). In case of the morbidity caused by "socially determined" diseases, we notice a decrease of the cases of pediculosis and gonococcus infections. For 100,000 people there are approximately 45.5 cases of pediculosis and 15.3 cases of gonococcus infection. In January June 2012 the number of HIV carriers was 259,3 cases less compared to January June At the same time, there are 129 cases of AIDS, especially in Chisinau and Balti, respectively 37 and 20 cases. Crimes. According to the Ministry of Internal Affairs, in January June 2012 there were 16.9 thousand crimes, or 2.8% more than in the same period of previous year. Out of the total number of crimes, approximately two thirds are reported in urban areas. In average, for 10 thousand people there are 47 crimes. The highest level of crimes was recorded in the city of Balti 69 crimes for every 10,000 people. A high level of crimes was also recorded in the city of Chisinau 67 crimes for every 10,000 people, and the district of Criuleni 51 crimes for every 10,000 people, and the lowest level of crimes was in Falesti district 20 crimes for every 10,000 people. In January June 2012 there were more economic crimes (by 30.8%), crimes against family and minors (by 56.1%), sex crimes (by 32.3%), crimes against public health and social coexistence (5.3%), against public security and public order (12.5%). At the same time, there were more cases of domestic violence (by 71.8%), money counterfeiting (by 61.6%), rape (by 43.2%), extortion (by 14.3%) and hooliganism (by 10.6%). In the same period there were fewer crimes against the property and against public life and safety. With the involvement of firearms, explosives and grenades, there were 29 cases, compared to 37 cases in January June In January June 2012, there were 3.0 thousand crimes, and 236 murders, 6 less more in January June The main causes of death were road accidents (42.8%), murders (31.4%) and intentional harm (11.9%). Out of the total crimes, every fourth crime was committed by work able, unemployed persons. The weight of crimes committed by minors or with their participation was 4.0%. In January June 2012 there were 9.7 thousand persons who committed crimes, 1.2 thousand persons more than in January June Most often criminals are unemployed (81.7%), and every 10th criminal is a minor (9.5%). Most criminals are first time offenders (94.0%). Compared to January June 2011, the number of persons who committed crimes under the influence of alcohol almost doubled. There were also more repeat or group offenders. 75
76 In January June 2012 there were 1185 cases of road accidents, approximately 3 a day. Following these accidents, 152 people died (including 20 children), and 1487 persons suffered traumas (including 267 children). In average, for 100 thousand people there are 33 road accidents. According to the data of the Service of Civil Protection and Exceptional Situations of the Ministry of Internal Affairs, the number of fires in January June 2012 was 7.8% higher compared to January June 2011, namely 1089 cases. There were 79 deaths, including 5 children. Following the fires, the economy of the country incurred losses of 16.5 million MDL. The region from the left side of the river Dniester According to the data of the Statistical Service of Transnistria: Demographic situation. The calculated number of people as of July 1, 2012 was thousand persons. At the same time, the number of people in urban areas was thousand persons, and the number of rural population thousand persons. The natural decrease of the population for January June 2012 was 1,384 persons. There were 2,432 live births, but the number of the deceased was 3,816 persons. Infantile mortality for January June 2012 was 21 persons. The main causes of infantile mortality are: the state occurred in the perinatal period (7 cases), congenital anomalies (7 cases) and intoxications, traumas (3 cases). The migration decrease of population for January June 2012 (considering internal and external migration) was 736 persons, compared to the similar period of last year, a 22.4% decrease. In January June 2012, 3,427 persons arrived in the region, namely 112.5% of the number of the persons arrived in January March 2011, out of which 603 children less than 16 years, or 17.6% of the total number of arrived persons. 4,163 people left or 99.9% of the people who left in January June 2011, including children less than 16 years 592 persons or 14.2% of the total number of persons who left. Out of the total number of people who came in the region 47.4% are men (1,614 persons), while out of the people who left, 48.5% were men (2,021 persons) In January June 2012, 2,354 people came and 3,108 people left urban areas, or compared to the similar period of % and 100.2%, respectively. In rural areas, 1,073 people came and 1,055 left (96.0% and 99.0%, respectively). The number of recorded marriages was 1,357, 1.5% less than in January June The number of divorces was 982, 4.8% more than in the same period of Labour market. In January June 2012 the active population was thousand pers., 220 pers. Less, or 0.2% less than in January June On July 1, 2012, the number of unemployed citizens registered by labor employment agencies was 6,022 and compared to January June 2011, 4.5% less, out of which 3,627 pers. or 60.2% women. Overall, in January June 2012, the Transnistrian Employment Agency helped hire 1,313 pers. In the analyzed period there were professional consultation sessions with students: group of consultations 161, amounting to 2,845 persons, and individual consultations 793, involving 786 persons, with the adult population: individual consultations 3,904 consultations, including 3,764 persons. For professional training, thousand rubles were spent, including for paying scholarships thousand rubles. For unemployment benefits, 11,050.0 thousand rubles were spent. The average value of the unemployment benefit was rubles. Remuneration of labour. In January June 2012, the average monthly nominal salary, calculated for one employee (except for small entrepreneurs) was 3259 rubles, or 117.5% compared to January June 2011 (at the official exchange rate of the monetary authorities on the left of the Dniester 293 USD or 107.1% compared to 2011). In January June 2012, the average monthly nominal salary calculated for one employee in the following economic activities: Industry (4,408 rubles or 396 USD), Transport (3,266 rubles or 293 USD), Electro and radiocommunications (7,647 rubles or 687 USD), Constructions (3,563 rubles or 320 USD), Trade and public food sector (3,959 rubles or 356 USD), Banks and credits (6,608 rubles or 594 USD), Insurance (4,827 rubles or 434 USD), General commercial activities (4,349 rubles or 76
77 391 USD) higher than the average salary in the region. At the same time, the average monthly salary calculated for one employee in the following economic activities: Geology and meteorology (1,494 rubles or 134 USD), Welfare (1,620 rubles or 146 USD), Forestry (1,629 rubles or 146 USD), Education (2,097 rubles or 188 USD), Postal communications (1,971 rubles or 177 USD), Culture and art (1,960 rubles or 176 USD), Administration bodies (1,994 rubles or 179 USD), Health (2,072 rubles or 186 USD), Agriculture (2,438 rubles or 219 USD) lower than the than the average salary in the region. In industry, the highest average nominal monthly salary in January June 2021 was recorded for the employees of the following economic sub activities: electricity 489 USD, more than the average salary in the region by 67.0%, ferrous metallurgy 494 USD or 168.8% of the average salary in the economy, food industry 370 USD or 26.4% more than the average salary in the economy. The lowest average nominal monthly salary calculated for January June 2012 was for the employees of the following industry branches: other industrial branches 198 USD the lower than the average salary in the region on 32.5%; wood processing industry 194 USD, which is 20.0% below the average wage in the region; polygraphic industry 286 USD, which is 2.2% below the average wage in the region; chemical industry 297 USD or 1.4% below the average wage in the region. Social protection of population. The average number of pensioners for April June 2012 was as 137,689 persons, including 133,315 persons were receiving working pensions, and 4,375 persons social pensions. The average value of pensions was 1, rubles (working pension 1, rubles, social pension rubles). The average value of pensions related to the minimum subsistence level of pensioners was 117.1%. Subsistence minimum. The value of the subsistence minimum in January June 2012 in average for one person was 1, rubles per month. By population categories, the value of the subsistence minimum for active men is 1, rubles per month, for women is 1, rubles per month. The subsistence minimum of pensioners is rubles per month, children under 6 years 1, rubles per month, children aged 7 to 15 1, rubles per month. Crimes. In January June 2012, public order protection agencies recorded 5363 complaints and reports regarding crimes or 13.4% more than in January June There were 2,930 crimes, 25.1% less than January June of previous year. They are including: 22 murders, 34 severe intentional attacks, 142 crimes related to illegal arm trafficking, 104 crimes committed by the use of, arms, munitions and explosives, 297 crimes against the public order, 234 drug related crimes, 93 frauds, 619 thefts, 103 larcenies, other crimes 957, etc. The crimes affected 1,613 persons, out of which 49 persons died (3.0%), and 107 persons were seriously injured (6.6%). 77
78 FORECAST FOR 2012 The external evolutions and the structure of the national economy condition the economic increase of the Republic of Moldova. The decrease of the growth rates of remittances and the drought of this year worsened the outlook on the evolution of the national economy. The evolution of the national economy for 2012 is more pessimistic after the last forecast period. The economy of EU hovers in an area of uncertainty, and this influences the national economy. Thus, after a recovery of two years after the financial crisis, the growth rates of the Moldovan production shall cease, because of the external demand lower than last year and because of unfavorable weather conditions. The short term prospects of economic growth are uncertain and depend on the evolution of remittances from abroad, of exports and stagnating investments. Banks shall be reticent in granting financial resources because of the compromising evolution of bad credits. On the other hand, a positive sign of recovery contributes to the decrease of unemployment. In EU, in the first half of the year, there was a decrease of the economy, while our neighbors Romania, Ukraine and Russia recorded economy increases. Thus, the remittances from EU decreased, and those from CIS increased. The impact of the drought on the national economy is uncertain. Under these conditions, the forecast for 2013 is difficult to capture. Agriculture It is one of the main dangers for the economic growth of this year. The vegetable production decreased (15.4%). The last two quarters are essential for the contribution of agriculture to GDP. The impact of the drought on economic growth cannot be precisely estimated, although preliminary calculations show a decrease of agricultural production between 20% and 25%. Thus, we shall witness a dramatic decrease of the contribution of this sector to GDP. Animal production moderately increased by 0.6%. One of the major hazards is the decrease of the number of animals and consequently of the overall animal production. The drought affected technical crops, thus the most vulnerable shall be countryside households with a lower number of animals. There is the possibility until the end of year of a decrease regarding animal production. The modeling exercise shows us that agricultural production shall decrease by 18 20% in 2012, with negative effects on industrial production. Another aspect with negative implications on agricultural production is the world price of agricultural and food products, which decreased in Internal manufacturers shall not be stimulated by the external price of products in order to produce more. Industry The growth rate of industrial production is estimated at 4% for We believe that this increase shall be caused by industrial production in branches such as manufacture of electrical machinery and apparatus and mining and quarrying production. Another element which shall determine a positive evolution of industry is the Gross Formation of Fixed Capital, where we estimate an increase of up to 10%. The arguments of this increase is the increase of credits granted by the banking system, on one hand, and by the public investments in infrastructure and capital repairs, on the other hand. We have to mention, the FBCF deflator is 104.8, lower than the GDP deflator for the year. 78
79 Services The highest contribution to the increase of GDP shall be associated to the sector of services, which because of the decrease of remittances, especially in the 2nd quarter, recorded more modest rates than last year. The main engine shall be trade, which shall slightly increase, stimulated by internal revenues, provided there is an increase of remittances of 4 5% until the end of the year. FOREIGN TRADE recorded a rather good evolution, especially exports, which recorded increases compared to last year, when there were good results. We believe that exports will grow by 3 4% this year, re export component will have less influence than the previous year, but still significant. For the current forecast, the main hypotheses of the model Conceptually, this year is difficult for forecasters. We shall continue to present the main results of the modeling exercise. We shall present the limits in which GDP should fit by resources for the national economy to record positive economic growth at least mathematically. We chose to ground our explanations on resources in order to have a better understanding of the national production outlook. The exchange rate of the national currency was set to an average annual value of 12 MDL/USD. The average interest rate for 2012 is 13.5%. Remittances (transfers) shall increase by 5%; The price index of agricultural and food products follow the world trend and according to the estimates of international institutions they shall decrease by 9 10% compared to The macroeconomic exercise shows that, for the economic growth to stay positive, the national economy must be within the following limits (see the table below). Table 7.1. GDP resources, Agriculture Industry Trade Transport Other Net Taxes GDP Growth Services on Product Thus, if the decrease of VAB in agriculture is higher than 11%, we shall most likely have a negative economic evolution (the other elements remaining constant). The estimated value of 1.5% increase of VAB in industry is achievable and is a minimum prerequisite, although we believe there are premises for an increase of maximum 3%. Trade will be supported by remittances, which at year end forecast to grow by 4%. Remittances in absolute terms will remain at least at the level of the previous year, although our forecast is based on a 5% growth rate in We expect that the dynamics of trade and consumption will depend to a greater extent on internal factors. We believe that the average salary will record positive values, but the situation is complicated by the number of employees employed. We 79
80 recognize that it is a rather strange evolution of unemployment rate in Moldova, with increases in times of economic boom and vice versa, most likely, the labor market has extended periods of adjustment and response. But economic logic requires that the number of employees would be reduced. Net taxes on products could be higher due to the combined efforts of the authorities to increase tax compliance and discipline. Forecast of 2.8% is achievable and necessary to support both BPN and a positive growth. In the third quarter of 2012 we risk a negative growth compared with 2011, but in the fourth quarter situation should improve. For 2013, the modeling exercise gives a 2.4% economic growth. Because of uncertainties in the European Union, and lack of information on the impact of agriculture on growth this year, most likely will make some corrections to the forecasts in another issue of MET which analyzes the entire year of Unit of Measurement prognoză Nominal GDP billion MDL Compared to the previous year in comparable prices % Average annual CPI % MDL average exchange rate MDL/USD Export of goods million USD Compared to the previous year % Import of goods million USD Compared to the previous year % Trade balance million USD Industrial production in current prices billion MDL Compared to the previous year in comparable prices % Agricultural production in current prices billion MDL Compared to the previous year in comparable prices % Average monthly nominal wage lei Workforce '000pers Number of employees in the national economy '000pers ,9 80
81 1. Introduction THE DCFTA BETWEEN MOLDOVA AND THE EU A RISK ASSESSMENT Jörg Radeke, German Economic Team Moldova The Republic of Moldova and the European Union are in the process of negotiating a Deep and Comprehensive Free Trade Agreement (DCFTA). Naturally, an important aspect of this agreement will be reducing and abolishing the remaining import tariffs. However, being a deep and comprehensive trade agreement, the negotiations will also attempt to remove non tariff trade barriers and accelerate harmonisation of regulations in additional selected areas, such as specific service sectors, energy, and competition policy. The economic impact of such an agreement will be significant. After all, exports to the European Union reached USD 1.08 bn in 2011 accounting for almost half of Moldova s total exports. At the same time products worth USD 2.2 bn were imported from the European Union in % of Moldova s total imports (NBS 2012). Steps involved in the risk assessment Research suggests that the impact is largely positive for all stakeholders private households, companies and the government s finances. However, there will be winners and losers and it is important for policy makers to understand which areas are affected in order to be able to ease the adjustment process where required. To provide a basis for such a risk assessment we have carried out the first steps that should be part of assessing the risks connected to removing import tariffs on European Union imports. 1) Which products are disproportionately affected? (Section 0) 2) Is the increase in imports significant compared to the size of the affected industry? (see section 0 of this report) 3) Have the products affected economic relevance? Specifically, do the sectors provide a significant share of output? Consequently, would a decrease in economic activity lead to high adjustment costs through, for example, unemployment or loss in economic output? (also covered in section 0) 4) What is the fiscal impact? What would it mean for tax and tariff income? (see section 0) While not covered in this report, a suitable risk assessment should then go on to ask if the sector or product is likely to ever become competitive. Finally, policy makers need to be aware that import tariffs have high costs as they increase the prices for the goods and services affected by them. Consequently, the risk assessment should involve the following additional questions: 5) How competitive is the affected product or industry? Is the sector or product in question already subject to intensive competition or is it shielded from effective competition? 6) Is there a prospect for competitiveness in the future? What are the chances that the industry will use the any transition periods to improve competitiveness? 7) What are the costs for consumers and businesses of delaying trade liberalisation? 81
82 Interpreting the results The results presented here are based on an simulation run with the online tariff policy simulation tool SMART provided by the World Bank (WITS 2012). SMART employs a Partial Equilibrium Model to estimate the impact from tariff changes on trade flows, tariff revenues, welfare, etc. Being based on the extensive TRAINS database it offers a wealth of data that allows analysing the impact on specific products 11. However, as a partial equilibrium model unlike Computable General Equilibrium Models (CGEs) the simulation tool is not able to simulate the more long term second round effects that are likely to materialise from such a trade agreement. For example, it does not consider that lower prices will lead to higher disposable income among Moldovans which will partly be used to buy more domestic and foreign products. As such, the results presented here will very likely underestimate the full impact from the trade agreement. Nevertheless the detailed breakdown of the results is indispensable when identifying how specific industries and products are affected. Our simulation does only consider the effects of removing import tariffs. We do not estimate the impact of any other non tariff measure such as aligning standards, liberalising the services sector or competition policy. In our scenario we model a full reduction of all import tariffs on imports from the European Union and Turkey as a free trade agreement with the latter is a pre condition for a DCFTA between Moldova and the EU (Prohnitchi 2012). As with any other economic model, the SMART model greatly simplifies the way the economy works. Furthermore, the speed and extend to which people react is based on historic relationships which may not be equally true for the future. The way consumers and companies will react to changed prices is determined by various factors. With that in mind, the results need to be treated with some caution. They can only be a first indication of areas where impacts are likely to happen. Nevertheless, the simulation result will be an indispensable guide when assessing the risks connected to abolishing tariffs in EU imports. The impact from removing tariffs for EU imports Clearly, removing tariffs on imports from Europe (and Turkey) will lead to increased demand for those products. In this section of the report we identify which products will be mainly affected from removing import tariffs on European products. However, to begin with it is useful to look at some of the research about the full economic impact of a DCFTA between Moldova and the EU. Indeed, as our analysis considers only the short term impact from removing tariffs 12 and does not look at the impact from removing other trade barriers, it is useful to see what the overall long term impact from the DCFTA will be. Summary of top level results The standard instruments to estimate the long term dynamic impact of trade agreements are computable general equilibrium models (CGE). With Prohnitchi (2012) and ECORYS (2012) two relevant and insightful studies exist which employ CGE modelling to explore the overall impact of the DCFTA on Moldova s economy. Both find that the DCFTA will be beneficial and will add between 5.4 and 6.4% to Moldova s GDP the equivalent of one year solid economic growth. Exports are expected to increase by 11 16% while imports are estimated to see an increase in the range of 6 8%. Consequently, both pieces of research expect exports to grow more than imports at least in relative terms. Prohnitchi (2012) expects the government to benefit as its revenues increase by around 1.6% as additional VAT, corporate and income tax revenues compensate for the losses in tariff revenues. What is more, both studies suggest that the 11 For example, the database produced for this report contained almost 5000 different product categories. 12 As a reminder, the SMART Simulation Tool only considers the direct impact from removing tariffs as opposed to any effects resulting from removing non tariff barriers or second round effects. 82
83 agreement will be beneficial for private households as they benefit from lower consumer prices as well as increase wage income. The resulting increase in disposable incomes will see private consumption increasing by 7.8% (Prohnitchi 2012). While the overall impact of the trade agreement is likely to be beneficial for Moldova, it will not be without pain. Indeed, the ECORYS (2012) study suggests that most of the economic benefits will not arise from reducing the actual tariffs but from removing non tariff measures, aligning regulation and standards and opening up of the services sector. Furthermore, it will take time for the benefits to materialise. Industries that have previously been shielded from competing foreign products through high import tariffs or other trade barriers will face increased competition which may force some inefficient companies out of the market. If everything goes well though, and according to economic theory, capital and labour will be employed in those sectors that will expand following the trade liberalisation. However, there will be costs resulting from this adjustment in the shape of write offs of machinery and equipment for company owners; unemployment and retraining for workers as well as shifting tax revenues and social welfare expenditures for the government (Santiago Fernandez de Cordoba 2008). Therefore, while the long run gains from trade agreements are widely considered to be positive, it is important to understand which sectors, products and economic actors are affected so the government can take the right steps to minimise the adjustment costs. Impact on demand for imports In this chapter we look at how the reduction in tariffs on imports from the European Union (and Turkey) would affect the demand for products from this region. Naturally, lowering the tariffs on imports from Europe would lead to an increase in demand for these products. We estimate that, based on a simulation run with the SMART tariff change simulation tool, the removal of all tariffs with the European Union and Turkey would lead to an initial increase in the value of imports of around USD 76 m per year a 2.2% increase compared to value of all imports in As such, the overall increase in imports is only modest. However, it is important to note that this only reflects the impact from removing tariffs. As research by Prohnitchi (2012) and ECORYS (2012) indicate, the overall and long term impact from a DCFTA on import demand will be larger as non tariff barriers would increase import demand further. In addition, second round effects such as income increases and changes in companies inputs would also increase the demand for European imports further. As such the 2.2% increase is more likely to be indicative of the initial impact from removing tariffs on imports. The headline increase also masks the considerable differences among some imported products. While the average weighted tariff rate was only 3.5% in 2010 some products are heavily taxed when crossing the border. For example, the tariff on sugar imports is 30%, tariffs on meat imports are generally above 15%, as are tariffs on most fruits and vegetables. The domestic textile industry is also heavily protected from outside competition. Table 1 provides examples of some of the products with the highest import tariffs. Regardless the motivation behind the tariffs, a high tariff level suggests that removing this trade barrier will reduce the prices for imports which will be visible in a demand increase. How much demand increases does not depend on the tariff level alone. It also depends on how sensitively consumers react to price changes. This is usually expressed by the so called import demand elasticity. Products with high import demand elasticity are likely to see consumers shift demand quickly to competing imports when tariffs are reduced. This is for example the case for fruits and vegetables for which demand increases by two per cent for each one per cent price drop. Other sensitive products are knitted and woven fabrics and pharmaceutical products. Beverages and spirits, perfumes and metals are usually less sensitive to price changes. 83
84 Table 1. Top 20 tariff items in 2010 Product area Average tariff 13 1 Cane sugar 30 2 Beet sugar 25 3 Hams and cuts thereof 20 4 Shoulders and cuts thereof 20 5 Pears 20 6 Other textile materials 20 7 Tomatoes, whole or in pieces 20 8 Pineapples 20 9 Citrus fruit Other Turkeys Peas Peaches, including nectarines Carpets and other textile floor coverings Other live animals Animal fats Meat and edible meat offal Natural honey Cut flowers Lettuce and chicory 15 Source: UNCTAD TRAINS (2012). Together the actual tariff change and the import demand elasticity determine how much a product will react to reducing or abolishing tariffs. To determine which products and sectors are particularly affected it makes sense to look first at products which will see the highest import growth following trade liberalisation. Ошибка! Источник ссылки не найден. shows the results for the product categories where we expect the largest changes. The simulation results suggest that imports of carpets are expected to increase by 21% compared to 2010 levels not surprising given that imported carpets and other floor coverings are currently subject to an average tariff rate of 12.6%. Similarly we expect imports of furs and clothing to increase by 16% and 13% respectively. In addition to the relative increase it makes sense to consider which areas will experience the largest absolute increase in imports that is, which products will see the highest trade increase in USD terms. Figure 2 shows the product categories for which our simulation suggests the largest increases in the value of imports. The numbers suggests that electrical equipment will see a large absolute increase in imports of around USD 6 m if tariffs were abolished here. However, this reflects rather the fact that electrical machinery and equipment constitutes a large share (almost 10%) of Moldova s imports. In relative terms Moldova s demand for imported electrical products from Europe will only increase by 2%. The second largest absolute increase in imports is expected for imports of knitted clothing which are estimated to grow by USD 5.2 m. A closer examination shows that several textile products are among the products affected by the simulated tariffs reduction. Indeed, taken together clothing, textiles and fibres will see an increase in the value of imports of USD 10.6 m making it the product groups affected the most by the tariff reduction. 13 Add valorem in 2010, please note that the tariff rate charged may have changed for some of the items as tariffs, especially for agricultural products, are adjusted on a regular basis. 84
85 25% 20% 15% 10% 5% 0% Carpets Furskins and artificial fur Clothing knitted Sugars and sugar Live tree & other plant Products of animal origin Articles of leather Vegetable Other textile articles Meat and fish products Meat Fruits and nuts Special woven fabric Clothing not knitted Pearls, precious stones & Printed books, newspapers Silk. Live animals Misc. metal articles Man made staple fibres. Figure 1. Relative change of import demand following tariff reduction Source: Own analysis based on WITS (2012) USD million Electrical machinery Clothing (knitted) Plastics Fruits and nuts Vegetable Furniture Other textile articles Vehicles Clothing (not knitted) Perfumes, cosmetic, toiletries Sugars and sugar confectionery Paper & paperboard Carpets Misc. metal articles Ceramic products Staple fibres Other food Vegetable, fruit & nut products Printed books, newspapers etc. Dairy products Figure 2. Absolute import change by product category Source: Own analysis based on WITS (2012). 85
86 To sum up, while the initial increase in imports is only modest, it masks the fact that some areas will see a considerable increase in import demand. This reflects large differences in the tariff regime across product groups. The question for policy makers is if the expected change in imports poses a risk for the domestic producers and how it affects consumers or public finances. Identifying risk areas for the domestic economy Protecting domestic industries from international competition through high import tariffs is counterproductive and has often high costs for consumers who need to pay more and have less choice. This is especially true since Moldova is competitive in most areas that are currently protected through high import tariffs. However, for those sectors which are currently heavily protected and also contribute significantly to economic output a too swift removal of imports may come at high adjustment costs. Consequently, it is important to understand which industries are chiefly affected through trade liberalisation and to what degree competition through imported products would affect them. Specifically, one could argue that an industry is likely to be overwhelmed with foreign competition if the value of increased imports is large compared to the value of domestic production. To get some indication where this may be the case, we compared the expected increase in imports with the production value of different sectors. As the results in Table 2 below suggest manufacturers of soap, detergents and cleaning products may face an inflow of foreign products worth almost 75% of their production value the third column shows the ratio between the increase in imports and the production value of the industry in question. We have ranked the result starting with those sectors where the inflow of imports is large compared to the value of goods produced in the industry. However, that in itself is not a reason to delay tariff adjustments. High tariffs on imports mean additional cost to Moldovan consumers and companies as it increases the cost for the product in question. Also, it stops companies from improving their competitiveness. There is little sense in having consumers paying high prices in order to protect the interest of a few company owners. The additional cost of higher prices and less choice may only be warranted if at all if the industry in question is contributing significantly to the domestic economy. For example, a closer look at the data for soap, detergent and cleaning products manufacturers the first entry in Table 2 suggest that this is not the case. The share of output compared to the value of goods produced in the rest of the economy is only 0.1%. Consequently, tariffs are currently causing large additional cost through higher prices for every day products like soaps and washing powders while protecting the interest of a small industry. Despite producers of soaps and other cleaning products only manufacturers of leather products, manufacturers of textiles and producers of tiles and brick are likely to see a significant increase in foreign competition. While these sectors are not large taken together they have a significant economic contribution. Furthermore, textiles and apparel producers are also traditionally labour intensive industries. For those industries a broader risk assessment which takes into account how competitive these industries are and if their main market is domestic or international would help assessing if a gradual tariff adjustment is needed. Overall, despite those industries mentioned above, our analysis suggests that none of the large sectors (for example agricultural products such as live animals, fruits and nuts, cereals) will see a significant increase in imports that would have a lasting effect on their domestic market shares. 86
87 Table 2. How will imports affect domestic industries? Industry name Production value (USD m) Expected increase in imports (USD m) Ratio import increase/ output Economic contribution of the sector Manufacture of soap, detergents, cleaning products % 0.1% Manufacture of leather, leather products and manufacture of footwear % 0.7% Manufacture of textiles % 1.1% Manufacture of tiles and bricks in baked clay % 0.3% Manufacture of wearing apparel; dressing and dyeing of furs % 1.9% Manufacture of paper and paperboard % 0.6% Manufacture of rubber and plastic products % 1.9% Manufacture of machinery and equipment % 1.0% Manufacture of fabricated metal products, except machinery and equipment % 1.1% Publishing, printing and reproduction of informational materials % 1.3% Manufacture of sugar % 2.2% Сhemical industry % 1.5% Metallurgical industry % 0.5% Production, processing and preserving of meat and meat products % 3.0% Manufacture of tobacco products % 1.4% Manufacture of products of flour milling industry, of starches and starch products % 0.3% Processing and preserving of fruits and vegetables % 2.1% Fruits and nuts % 10.0% Manufacture of glass and glass products % 1.5% Manufacture of dairy products % 2.5% Vegetable % 8.0% Manufacture of bread and pastry products % 2.3% Manufacture of articles of concrete, % 2.0% gypsum and cement Manufacture of cocoa, chocolate and sugar confectionery % 1.0% Malt; starches; inulin; wheat % 4.2% Oil seed and fruits % 7.5% Live animals % 20.7% Manufacture of wood and wood products % 0.3% Cereals % 12.8% Manufacture of medicaments and pharmaceutical products % 0.7% Manufacture of other non metallic mineral products % 5.0% Source: Own analysis based on WITS (2012), NBS (2012), FAOSTAT (2012). 87
88 Impact on government finances Tariff income is an important source of revenue for the Moldovan government generating income of around USD 133 m in 2010 (UNCTAD TRAINS 2012) 14. Tariffs on imports from the EU and Turkey amounted to about USD 83 m in 2010 over 60% of total tariff revenues. As such, a full removal of all tariffs is likely to have a significant impact on government finances. Overall revenues from import tariffs account for around 6% of government receipts if the UNCTAD figures are considered. Naturally, the estimated USD 83 m in revenues from tariffs on EU (and Turkish) imports will disappear once a Deep and Comprehensive Free Trade Agreement is fully implemented. Consequently, the Moldovan government will have to find ways to plug this revenues gap. It is likely though, that the loss in government revenues will be only temporary. Indeed, both Prohnitchi (2012) and ECORYS (2012) estimate that the overall, long term impact from a DCFTA on government finances will be positive. Nevertheless, the Moldovan government may face a liquidity problem with import tariffs disappearing overnight while increases in value added tax and receipts from income tax will take time to materialise. Therefore it is worthwhile to understand which areas will account for the largest losses in import tariff revenues. Table 3 shows that the top 20 items account for two thirds of the expected revenue loss. While electrical machinery and equipment will account for the largest single loss of around USD 4.2 m, the data suggest that the revenue losses are spread out evenly on a number of products areas. Consequently, there is no single product category that accounts for a large share of the losses. Table 3. Top 20 Products most affected from tariff revenue loss Products Loss in tariff revenues (USD m) Share of revenue loss Cumulated share Electrical machinery % 7% 2 Plastics % 13% 3 Fruits and nuts % 19% 4 Vegetable % 23% 5 Furniture % 27% 6 Vehicles % 31% 7 Paper & paperboard % 35% 8 Clothing knitted % 38% 9 Tobacco % 41% 10 Other food % 43% 11 Clothing not knitted % 46% 12 Ceramic products % 48% 13 Bread, pastry % 51% 14 Perfumes, cosmetic/toiletries % 53% 15 Other textile articles % 56% 16 Soap, cleaning utensils % 58% 14 Depending on the source used there are considerable discrepancies in how much revenue was generated from custom import duties. While UNCTAD estimates that tariff revenues were USD 133 m in 2010, government statistics only show around USD 86 m. This may be due to UNCTAD estimating theoretical revenues based on reported imports and applicable tariff rates while government statistics show the actual amount collected. Although we use the UNCTAD numbers, the finding here are equally true although somewhat different in order of magnitude if they were based on actual tax receipts. 88
89 Rubber % 60% 18 Sugars and sugar confectionery % 62% 19 Misc. chemical products % 64% 20 Dairy products % 65% Source: Own analysis based on WITS (2012). Naturally, the main share of tariff income is generated from products which are already traded intensively with its European partners and have comparatively low tariff rates. With this in mind a gradual adjustment could be justified given the already low tariff rates and would reduce the risk of liquidity problems. Recommendations There is no doubt that the DCFTA between Moldova and the European Union will be beneficial for Moldova and result in higher incomes, lower prices, increased trade and more prosperity. As such the Moldovan government is well advised to lead constructive negotiations to come to a comprehensive free trade agreement with the EU. However, there are risks for the domestic economy which need to be assessed and managed so they do not turn into costs. Specifically, the government needs to understand which products and sectors will be disproportionately affected from removing imports tariffs on EU goods. While we find that the short term increase in imported goods from the EU is only a modest 2.2%, there are some sectors that will see a significant increase. Indeed, although the average tariff rate is only 3.5% there are some products that are taxed with double digit import rates. Naturally, those are the candidates that will see the largest increase in imports if tariffs for EU products are abolished. We find that upon removal of tariffs, carpets, clothing and textiles will see a significant increase in import demand in relative and absolute terms. So the assessment should identify if the competing imports are likely to force out domestic suppliers. A good indicator here is if the import increase would be large compared to the economic size of industry. Secondly, there is the question if the industry affected is large enough to have serious knock on effects for the economy. The larger the sector affected the larger the adjustment costs through unemployment, write offs, etc. Our analysis suggests that manufacturers of leather products, textiles, wearing apparel as well as producers of tiles and bricks may see significant increase in competition. Additionally, some selected agricultural products may see a substantial increase in imports. As these sectors also account for larger shares of economic output a more thorough assessment is recommended. Furthermore, the assessment should consider if the sector or product in question is already subject to intensive competition. In some cases removing tariffs may only remove monopoly rents of industries that have faced very little competition in the past. In this context, there is the question if the products in question can ever be produced competitively in Moldova. Indeed, it makes only sense to grant transition periods to those industries that are likely to use the additional transition periods to improve productivity and become more competitive. Initial evidence suggests that this is especially relevant for a number of agricultural products. While Moldova has good pre conditions for agricultural production, productivity in many areas is still much below the EU average. So there may be a case in delaying trade liberalisation and using the transition period to invest in productivity enhancing measures. Given that agricultural products are among those most protected through tariffs a detailed impact assessment should be carried out to guide the DCFTA negotiation process. 89
90 However, the government needs to bear in mind that import tariffs are not without costs. They mean higher prices for domestic consumers and producers. Furthermore, import tariffs reduce choice for consumers. So the government needs to ask whose interests it protects by delaying trade liberalisation. Protecting the interest of a few niche producers at the cost of high prices and limited choice for all Moldovan consumers is not a good proposition. Finally, another factor to consider for the government is how abolishing tariffs will affect its revenues. European imports accounted for USD 83 m in 2010 according to the UNCTAD TRAINS (2012) database however actual revenue collected may have been less. Nevertheless, abolishing tariffs altogether opens a temporary gap in government finances. While the overall long term impact on the public budget is expected to be positive, the government may face a liquidity problem as new sources of revenues take time to materialise. Typically, revenues are earned with products that have a reasonably low tariff rate and are imported already intensively. With tariffs already low for the main tariff earning products, there may be some justification for a gradual reduction in order to reduce the strain on public finances. Overall, however, our analysis suggests that concerns of high adjustment costs are not justified. Firstly, the initial 2.2% import increase is low compared to fluctuations observed in the recent past for example the economic slowdown following the credit crunch. It reflects that average tariff rates were low to begin with. Secondly, research suggests that the benefits will outweigh the costs. So, while some sectors that have been heavily protected in the past will experience larger shocks there are only few instances imaginable were trade liberalisation should be delayed. In those cases the government should assess thoroughly if the expected adjustment costs justify the foregone benefits from trade liberalisation. References ECORYS (2012). Trade Sustainability Impact Assessment in support of negotiations of a DCFTA between the EU and Georgia and the Republic of Moldova Interim technical report. TSIA in support of negotiations of a DCFTA between the EU and Georgia and the Republic of Moldova. Rotterdam. FAOSTAT (2012). Food Production Value, FOOD AND AGRICULTURE ORGANIZATION OF THE UNITED NATIONS. NBS (2012). International Trade Statistics. Moldova National Statistics. NBS (2012). Main indicators of industry ( ). National Bureau of Statistics of the Republic of Moldova. Prohnitchi, V. (2012). Strategic Comparions of Moldova's Integration Options: Deep and Comprehensive Economic Integration with the EU vs. the Accession to the Russia Belarus Kazakhstand Customs Union. ECONOMIC ANALYSIS AND FORECAST PAPER. E. Grup. NR. 3/2012. Santiago Fernandez de Cordoba, S. L., Jean Christophe Maur, Jose Maria Serena (2008). Adjustment cost and trade liberalisation, UNCTAD. UNCTAD TRAINS (2012). Database on Trade Control Measures UNCTAD. WITS (2012). World Integrated Trade Solution SMART Analysis Tool. List of recent Policy Papers FDI Attraction to Moldova: Facts, Potential and Recommendations, by Ricardo Giucci and Jörg Radeke, Policy Paper 02, April
91 Emission Trading as a Catalyst for Energy Efficiency Improvements: Options and Potential for Moldova, by Jörg Radeke and Georg Zachmann, Policy Paper 01, February 2012 Credit Growth in Moldova: Empirical Analysis and Policy Recommendations, by Enzo Weber and Robert Kirchner, Policy Paper 03, July 2011 Options for a Deep and Comprehensive Free Trade Agreement between Moldova and the EU, by Matthias Luecke, Alex Oprunenco and Valeriu Prohnitchi, Policy Paper 02, May 2011 Proposals for Reducing the Administrative Burden of Tax Regulations in Moldova, by Ricardo Giucci, Alexander Knuth, Natalia Cotruta and Ana Popa, Policy Paper 01, March 2011 SME Regulation in Moldova: Recommendations from an Economic Perspective, by Alexander Knuth, Policy Paper 02, November 2010 Electricity Sector in Moldova: Evaluation of strategic options, by Georg Zachmann and Alex Oprunenco, Policy Paper 01, September 2010 List of recent Policy Briefings The Third Energy Package and Electricity Market Reform, Jörg Radeke and Georg Zachmann, Policy Briefing 01, June 2012 Moldovan Carbon Credits beyond 2012, by Georg Zachmann, Policy Briefing 09, December 2011 Comments on the Draft Law on Small and Medium Enterprises as of October 2011, by Alexander Knuth, Policy Briefing 08, October 2011 Reform Proposals for Primary Documentation in Moldova, by Alexander Knuth and Natalia Cotruta, Policy Briefing 07, October 2011 Reform Proposals for the Accounting Standards for Micro Enterprises in Moldova Presentation of a Complete Draft and Discussion of Related Issues, by Alexander Knuth, Natalia Cotruta, Alexander Nederita and Natalia Tsiriulnikova, Policy Briefing 06, October 2011 SME sector monitoring in Germany, by Alexander Knuth, Policy Briefing 05, July 2011 Primary Documentation in Germany, by Alexander Knuth and Ilona Kaiser, Policy Briefing 04, May 2011 Comments on the Draft Law on Small and Medium Enterprises as of March 2011, by Alexander Knuth, Policy Briefing 03, May 2011 EU Energy Strategy and its Implications for Moldova, by Georg Zachmann and Alex Oprunenco, Policy Briefing 02, July 2011 Economic cost of cheap Russian gas. Analysis and Policy Recommendations, by Ricardo Giucci and Georg Zachmann, Policy Briefing 01, February
92 COMPARING AN ECONOMY S OUTPUT BEFORE AND AFTER THE BEGINNING OF TRANSITION: A GENERAL ANALYSIS WITH EMPHASIS ON THE CASE OF MOLDOVA Apostolos Papaphilippou 1. INTRODUCTION AND OVERVIEW A recurrent theme in discussions of output developments in the economy of Moldova is the claim that the volume of output remains well below its level prior to the onset of the transition process. For example in an article by Kovalenko (2012) that analysed the Moldova 2020 document it was noted that, under both growth scenarios contained in the document, the forecasted level of output in 2020 will be less that the level of Moldova s output in More specifically the article referred to calculations that suggested that, under the baseline growth scenario in the Moldova 2020 document, the economy s forecasted output in 2020 would correspond to only 83 percent of its level in 1989, while, under the alternative scenario and more optimistic growth scenario, it would correspond to 95 percent of its level in These calculations presumably take 1989 as a base and then incorporate the (actual and projected) annual rates of growth of the volume of output for 1990 to However it is well known that the indicators capturing the volume of output under the command economy and the market economy are not directly comparable. The goal of this paper is to provide a critical assessment of relative output developments before and after the onset of the transition process. The paper argues that, due to a combination of: 1. The statistical issues concerning the properties and likely biases of the indicators used to capture output under the command economy and the market economy; and 2. A number of country specific factors that render the comparison of Moldova s output evolution in the early transition years particularly problematic, the comparison of the economy s official output before and after the transition makes little sense in general and is, furthermore, likely to be particularly misleading for the special case of Moldova. The rest of the paper is organized as follows: Section 2 provides an overview of the statistical issues, and likely statistical biases, that an analyst encounters while trying to assess the output drop which Former Soviet Union Republics experienced with the onset of the transition process. Drawing upon the studies cited therein, section 2 provides a brief overview of a number of statistical issues that characterized the command economy s output indicators, and contrasts these with the different issues that emerged with the beginning of the transition process. The combined effect of the analyzed issues would imply that the official statistics are likely to exacerbate significantly the real output fall which was experienced at the beginning of the transition process. Section 3 proceeds to provide a revised assessment of Moldova s output developments over the transition period. It also summarises a number of country specific characteristics of the evolution of growth in Moldova. Section 4 utilises the EBRD database covering 29 transition economies and also data by the Moldovan National Bureau of Statistics to provide a comparative analysis of Moldova s output evolution. More specifically section 4: (i) provides estimates of the 2010 level of output of the Moldovan economy as a share of the level of Moldova s output under three 92
93 different years that are taken as a base; and, for these three base years, (ii) reports Moldova s relative ranking with regard to cumulative growth to 2010 over the 29 transition economies covered in the EBRD database. Section 5 concludes by: (i) reiterating that a comparison of official growth estimates before and after the beginning of transition is nonsensical, and (ii) analysing a number of reasons suggesting that taking as a base the year 1995 may be a more efficient choice for undertaking a comparative analysis of growth, at least for economies that belonged to the Former Soviet Union. Finally the paper s statistical annex reproduces the data that were used in order to generate the comparative estimates reported in the paper. 2. MOVING FROM A COMMAND ECONOMY TO A MARKET BASED ECONOMY: AN OVERVIEW OF STATISTICAL ISSUES AND POSSIBLE BIASES The change from the command economy to a market based system necessitated a fundamental change in the statistical system. While a detailed comparative analysis of the two statistical systems and their possible biases lies beyond the confines of the present paper, a brief overview of selected key issues is indispensable in order to provide an insight into the problems that are encountered when output comparisons are made, especially prior and after the onset of transition. Indicators characterising the output under the command economy were compiled under the Material Product System and are thus not readily comparable with the Gross Domestic Product (GDP) estimates compiled under a market based system. In comparison to the GDP indicator, the Net Material Product indicator omits depreciation and most of the value added of the services sector (with only the services linked with the distribution of physical products, such as storage, transportation and marketing being included in the Net Material Product aggregate). It is wellknown that the service sector was under developed under the command economy and an area of growth over the transition process, which was closely connected with the growth in private sector activities. And that the growth in the private sector activity was only partially covered in official statistics, especially in the early years of transition. Statistical issues under the command economy A number of well known characteristics render the output statistics of the command economy of limited usefulness when one seeks to compare the level of output prior and after the beginning of the transition process. In more detail these include the following inter related issues: 1. Persistent over reporting of production: Under the command economy there was an in built incentive to over report production as the bonuses of workers and enterprises depended upon the fulfilment of the plan in general and gross output targets in particular. This persistent overproduction was estimated to be of the order of around 5 percent of GDP [Aslund (1990)]. 2. Low quality of products: The command economy was characterized by a combination of: (i) the incentive to maximize gross output, which was noted in the previous point, coupled with (ii) limited competition among goods and an excess demand for goods in general at their (administratively set) low prices (with this excess demand at the administered prices manifesting itself by persistent queues and rationing). The result of these two factors was that the quality of a number of goods, especially consumer goods, was low. 3. Value subtracting activities by some enterprises: A number of enterprises, especially in the manufacturing sector, were in fact producing negative value added. In such an enterprise the proper (market) valuation of all the costs of production exceeds the market value of the produced output. And thus, rather than adding to an economy s value added, such an enterprise s production process 93
94 subtracts value added: in other words its continuing production wastes more resources than it creates. 4. Subsidies, including implicit trade subsidies: Most of the Former Soviet Union Republics were subsidized explicitly through credits. These subsidies were phased out by the mid 1990 s. On the other hand, and with the exception of the 5 Former Soviet Republics of Central Asia, direct budget transfers were generally of limited significance. And as Aslund (2001) notes these direct budget subsidies to Former Soviet Republics were gone by Much more significant, however, were the implicit trade subsidies provided to energy importing Former Soviet Union Republics due to the very low energy prices before the breakup of the Soviet Union. With the sudden increase in energy prices towards the international level which occurred early in the transition process, energy importing Former Soviet Union Republics experienced a significant adverse Terms of Trade shock (i.e. an adverse significant change in the ratio between the prices of its export and imports). As noted in section 3 below this was particularly important for the economy of Moldova. Statistical issues following the beginning of the transition process The beginning of transition resulted in a number of challenges to statistical offices. Along with the need to change their statistical methodologies, statisticians needed to address a set of different incentives linked to reporting at the micro level. With the onset of transition: (i) the characteristics giving rise to the possible upward biases analyzed in the previous subsection with regard to the command economy s output indicators seize to exist; and (ii) the incentive to maximise reported output under the command economy is being replaced by an incentive to under report output under a market based one, so as to limit tax liabilities. In more detail: 1. As noted already the official statistics provided only a limited coverage of the emerging private sector activity and of the growing shadow economy, especially in the early years of transition. Statistical bureaus were required to rely less on a compilation methodology based on the complete reporting undertaken by production units (as was the case under the command economy), and gradually replace it with more efficient survey based methodologies. 2. The incentive to over report production under the command economy, which as we have already noted would give an upward bias to official output statistics under the command economy, was in fact reversed: it was replaced by an incentive to under report production and income so as to limit taxation liabilities. 3. With regard to quality improvements in a number of domestically produced goods these became increasingly necessary under the new environment which was characterized by enhanced competition (including through the effect of the liberalization of prices and trade and, thus, the competition from imported substitutes of domestic goods). This contrasted with the situation under the command economy noted already: where goods were scarce and there was an excess demand at the administered prices, which resulted in rationing. These quality improvements may not have been fully captured through the year to year output comparisons, which were made on the basis of last year s prices, especially in the early years of transition. 4. The possible biases before and after the beginning of transition related to the possible existence of value subtracting enterprises becomes apparent when one takes into account that: On the one hand an output indicator based on measuring gross output would register the disappearance of this enterprise as an adverse development (a drop in the gross output produced). In contrast, and concentrating on value added, the reduction in value subtracting 94
95 activities through the closure of this enterprise is a net addition to GDP (and, other things being equal, a welcome development) 15. However in practical terms there has not been a significant effect in the first few years of transition due to the existence of value subtracting enterprises, as the re organisation of production was delayed. This was partly due to the fact that enterprises did not in reality face hard budget constraints for some time after the beginning of transition. In particular many enterprises in transition economies continued their operations financing them through debt accumulation, a situation which gave rise at the macro level to significant amounts of interenterprise arrears, which persisted until the mid to late 1990 s. 5. With regard to subsidies, explicit subsidies were phased out by the middle of the 1990 s. Indirect trade subsidies to energy importing Former Soviet Union republics were, however, dramatically reduced with the early increase in energy prices towards international prices. To recapitulate the combined effect of the above mentioned issues prior and after the beginning of the transition process implies that a mechanistic comparison of the available official statistics between and after the beginning of transition is likely to give rise to a significant overestimation of the real output drop which actually occurred. In short, and for the reasons analyzed above, while there in no doubt that there was a drop in output accompanying the transition process, the official statistics are likely to significantly exaggerate it. 3. A REVISED ASSESSMENT OF MOLDOVA S OUTPUT EVOLUTION AND COUNTRY SPECIFIC CHARACTERISTICS OF ECONOMIC GROWTH A revised assessment of Moldova s output The question which naturally arises is whether the biases noted in the previous section can be quantified. Table 1 below summarizes the results of the study by Aslund (2001) for the particular case of Moldova. The study attempted to revise the official GDP estimates of the Former Soviet Union Republics by making a number of adjustments. Table 1: Revision of Moldova s 1995 GDP level (expressed as a percent of the level of GDP in 1991). Official GDP 1995 Including unofficial economy Deduction of value subtraction from base GDP Deduction of implicit trade subsidies from base GDP Source: Aslund (2001). In more detail in table 1: Column (1) expresses the official real GDP in 1995 as a percentage of its level in 1991; thus, according to the official figures the level of real GDP in 1995 corresponded to 47.6 percent of the level of real GDP in Column (2) makes an upward adjustment of the official 47.6 percent figure to 54 percent in order to fully capture the unofficial economy. The adjustment in column (2) relied on 15 A brief note should clarify the other things being equal noted in the parenthesis: there are, of course, transitional costs related to the closure of a value subtracting enterprise unit and the (hopefully) temporary unemployment of the resources previously used by this enterprise, including labour. These need to be addressed through social safety nets and, possibly, through active labour market policies facilitating the relocation of unemployed labour. However, in the longer run, the closure of this enterprise frees the resources that this enterprise uses inefficiently, i.e. capital and labour, to be used more productively in other activities in the economy. This is part of the Schumpeterian creative destruction process inherent in the evolution of a market economy. 95
96 the results of the empirical study of the unofficial economies of transition countries undertaken by Johnson, Kaufmann and Shleifer (1997). Finally the adjustments contained in columns (3) and (4) adjust the base 1991 level of output for: (i) the existence of value subtracting enterprises in the economy; and (ii) the existence of implicit trade subsidies respectively. It is notable that: o The adjustment in column (3) is only marginal, from 54 to 54.5 percent. This reflects the little change in Moldova s industrial structure over the period to o In contrast the adjustment in column (4) is very substantial, bringing output to 65 percent, and is based on the results of the empirical work by Orlowski (1993) and Tarr (1994). Both studies indicated that Moldova was the hardest hit Former Soviet Union Republic, with the implicit inter republican trade transfers at the onset of transition estimated by these studies at 18.8 and 24.1 percent of Moldova s output respectively. At the same time it should be noted that the coverage of the official 1991 and 1995 output figures compared in the Aslund (2001) study is different for the special case of Moldova, as the Moldovan statistics from 1995 onwards exclude the Transistrian region. On country specific characteristics of economic growth in Moldova The beginning of the transition period was particularly harsh for Moldova. Following the breakup of the Soviet Union Moldova lost access to both subsidized inputs to its production process, as well as subsidized markets for its export industries. It is well known that the adverse Termsof Trade effect was particularly pronounced in Moldova s case: as noted already the comparative studies by Orlowski (1993) and Tarr (1994) provide firm evidence that the Terms of Trade effect for the Moldovan economy was very significant and the largest among all the Former Soviet Union Republics. Other country specific shocks for Moldova over the transition period included the Transnistrian conflict in 1992 and a series of natural disasters. The latter have had a pronounced effect given the significant share of the country s agricultural sector and the associated agro processing sector in total output. Adverse weather conditions included the 1992 and 1994 floods and droughts in 2000 and Finally Moldova has been, and continues to remain, vulnerable to external shocks. The economy was particularly adversely affected by the 1998 Russian crisis and the international financial crisis in Graph 1 portrays the annual rate of growth of Moldova s real GDP over the period inclusive Graph 1. Annual rate of growth of real GDP in Moldova (percent) Source: National Bureau of Statistics. Note: The 2011 estimate is preliminary. 96
97 4. A COMPARATIVE ANALYSIS OF MOLDOVA S OUTPUT EVOLUTION We now turn to compare Moldova s latest output level (i.e. the level of output in 2010) with the level of Moldova s output under a number of different base years. We report the results for the following years: 1989: this is the year cited in the Kovalenko (2012) article which we referred to in the paper s introduction, and is also widely used as a benchmark year to assess the relative evolution of output over the transition period, including by the EBRD. 1991: year 1991 marks the breakup of the Soviet Union and the beginning of the transition period for a number of economies; and 1995: For the reasons noted in section 5 below, the year 1995 may be a more reliable basis for an efficient comparative analysis of output developments, at least between economies belonging to the Former Soviet Union. To undertake the comparative analysis we have utilised the EBRD database, which is available over the web. The data used for the calculations reported below where downloaded in July 2012 and appear in the paper s statistical annex. They refer to the annual growth rate of the volume of output of 29 transition countries over the period inclusive. It is notable that Moldova is the only case where data are not reported prior to 1995, presumably due to the exclusion of the Transnistrian region from 1995 onwards. However in order to be able to undertake the calculations with the base 1989 and 1991 we have incorporated in the database the existing official estimates of the annual change in the volume of Moldova s output in 1990 to 1994 inclusive. Table 2: Estimates of the annual rate of growth in Moldova s volume of output (percent) Year Rate of growth in the volume of output Source: National Bureau of Statistics. Note: The table provides estimates of the rate of growth in the volume of output for Moldova s economy (including the Transnistrian region). The figures for 1992 to 1994 refer to the rate of growth in real GDP, while earlier figures may largely reflect the rate of growth in the volume of Net Material Product aggregate. In assessing the results reported below the reader should keep in mind: 1. That, for the issues analysed in section 2, the comparison of a transition economy s output index prior and after the beginning of transition is problematic; and, furthermore, 2. That, for the case of Moldova, the coverage of the indicators are very different. This renders Moldova a special case and the comparison of output levels before and after the beginning of transition particularly problematic. Table 3 below summarises the results of the calculations over the set of the 29 economies covered in the database. The mechanical incorporation of the annual rates of growth of the volume of output over the period suggests that Moldova s level of output in 2010 corresponds to only 56 percent of its output in 1989 and 70 percent of its output in In both cases Moldova ranks last among the 29 transition economies covered in the database. 97
98 Table 3. Moldova s level of output in 2010 as a share of different base years and its relative ranking over the 29 transition economies covered in the EBRD s database Base year Moldova s 2010 output as a share of the base Moldova s ranking 1989 = th 1991 = th 1995 = th Source: Own calculations on EBRD and Moldovan National Bureau of Statistics data. Note: The estimates in column 2 are rounded to the nearest integer. The paper s statistical annex provides the data used to generate the results for 1989 and Moldova s 2010 output corresponds to 146 percent of its output in However taking 1995 as the base results in a slight improvement in Moldova s ranking to the 25 th position. In particular taking 1995 as the base implies that: Moldova outranks Romania (whose level of output in 2010 corresponds to only 135 percent of its level in 1995), Ukraine (137) and Macedonia and Bulgaria (both at 143); while Moldova s outcome is only marginally lower than the Czech Republic (at also 146), and is close to Hungary (at 149), with the next four positions taken by Croatia (153), Serbia (158), Slovenia (162), and Montenegro (165). A thorough analysis of the comparative evolution of growth outcomes among transition economies may be a natural area for further work. It, however, lies outside the confines of the current paper. 4. CONCLUDING COMMENTS To recapitulate it is clear that the combination of: 1. The statistical issues concerning the properties and likely biases of the indicators used to capture aggregate output under the command economy and the market economy; and 2. A number of country specific factors that render the comparison of Moldova s output evolution in the early transition years particularly problematic, render the comparison of the Moldovan economy s output before and after the transition nonsensical. In contrast to the widely used base of 1989 in the literature, we would argue that the selection of 1995 as a base may be a more reliable basis for an efficient comparative analysis of output developments among economies that belonged to the Former Soviet Union. More specifically, and in addition to avoiding the possible biases analysed in section 2, reasons to prefer 1995 as a base include: The fact that the compilation of national accounts and the GDP estimates in the early transition years were largely based upon adaptations of the output estimates derived under the Material Product System for a number of economies, thus giving rise to possible significant variations in the actual methodologies used. In many economies, and following the liberalisation of administered prices, the early transition years were periods of very high inflation which, other things being equal, increases the uncertainty inherent in the national accounts compilation. The fact that the subsidies given to several Former Soviet Union economies were phased out by This provides a more balanced starting point to assess the subsequent relative output evolution among these economies. Finally, and for the particular case of Moldova, the earlier period is simply not comparable, as Moldovan statistics from 1995 onwards exclude the Transnistrian region. 98
99 References Aslund, A. (1990), How Small is the Soviet National Income? in Rowen, H.S. and C. Wolf, Jr. (eds.), The Impoverished Superpower Perestroika and the Soviet Military Burden, San Francisco: Institute for Contemporary Studies. Aslund, A. (2001), The Myth of Output Collapse after Communism, Carnegie Endowment for International Peace, Working Paper No. 18. International Monetary Fund (1994), Economic Review: Financial Relations among the Countries of the Former Soviet Union, Washington D.C.: IMF. Johnson, S., Kaufmann, D. and A. Shleifer (1997), The Unofficial Economy in Transition, Brookings Papers on Economic Activity, No. 27 (2). Kaufmann, D. and A. Kaliberda (1996), Integrating the Unofficial Economy into the Dynamics of Post Socialist Economies: A Framework of Analysis and Evidence, in Kaminski, B. (ed.), Economic Transition in Russia and the New States of Eurasia, Armonk, N.Y.: M.E. Sharpe. Kovalenko, I. (2012), Moldova 2020: Loterea Prioritetov, Ekonomitseskie Obozrenie, No. 10 (938), 16 March. Orlowski, L. (1993), Indirect Transfers in Trade among Former Soviet Union Republics: Sources, Patterns and Policy Responses in the Post Soviet Period, Europe Asia Studies, No. 45(6). Tarr, D.G. (1994), The Terms of Trade Effects of Moving to World Prices on Countries of the Former Soviet Union, Journal of Comparative Economics, No. 18 (1). 99

100 MOLDOVAN ECONOMIC TRENDS 100
101 INSTITUTIONS, DEVELOPMENT AND THE REFORM OF MOLDOVA S JUSTICE SYSTEM 1. Institutions and the causes of long term economic growth. Dr. Andrea Lorenzo Capussela Neoclassical theories of economic growth focus on the accumulation of human and physical capital and, more recently, on technological progress. These, however, seem proximate causes of growth, not its fundamental determinants: what leads certain countries to accumulate capital and innovate more rapidly than others? Why do they invest more and have better schools? In other words, why is GDP per capita in Norway about five hundred times greater than in Burundi, and is poverty the inevitable destiny of the latter? Four main answers have been given to these questions: geography, and therefore climate, exposure to diseases, endowment of natural resources and proximity to transport routes (Diamond, 1997; Sachs, 2001); trade and integration in international markets (Frankel and Romer, 1999); culture, religion and beliefs, following Max Weber s theory (Grief, 1994; Landes, 1998); and institutions (North and Thomas, 1973; North, 1990 and 1991). A growing body of literature holds that the quality of the institutions of a country is a first order cause of its longterm growth, and has greater impact on cross country differences in economic performance than either geography, trade integration or cultural traditions (see Acemoglu et al., 2005, also for further bibliographical references; for a different approach, see Glaeser et al., 2004). This also implies that, with the right institutions, no country and certainly not Moldova is predestined to poverty and fragility. In laying the seed for this school of thought, North defined institutions as the rules of the game in a society or, more formally, [ ] the humanly devised constraints that shape human interaction (1990, p. 3): a definition that encompasses the framework within which political, social and economic exchange occurs. Among them, economists have primarily focused on the regulation of property rights, markets, contracts and corporations, which structure the incentives of households and firms and thus influence the organisation of production and economic exchange, the allocation of resources, the investment in capital and innovation and the distribution of wealth (Baumol, 1990; Rodrik et al., 2004; Beck, 2012). In their simplest form their conclusions seem intuitive, and can be traced back to Adam Smith: if the right to property is not well designed and effectively protected, if the contracts by which such rights are exchanged cannot be predictably enforced, and if the markets where such exchanges occur are not open to competition, there will be little incentive or opportunity to invest and innovate, resources will not be allocated to their most efficient use, productivity and growth will remain below their potential, and markets will be smaller than they would otherwise be (including the crucial market for capital: Beck and Levine, 2005). Whereas societies whose economy is organised around institutions that effectively protect property rights, contracts and competition are more likely to invest, innovate and prosper. As the link between these theories and the political economy of development which is more directly relevant for Moldova is clear and broadly recognised (Adam and Dercon, 2009; Besley and Persson, 2011), they have increasingly been adopted by development organisations as part of the scientific background for their work (World Bank, 2008). Hence, the efficiency of institutions quite apart from the question of their fairness can be judged objectively, depending on whether they enhance aggregate economic growth and social welfare (Voigt, 2009). Work conducted mainly at the World Bank has developed two of the most respected and widely used sets of indicators of the quality of institutions (the Worldwide Governance Indicators, on which see: Kaufman et al., 1999; Kaufman et al., 2007; Kaufman and 101
102 Kraay, 2008; Kaufman et al., 2009; and the Doing Business indicators: World Bank and IFC, 2012), which shall be used below to describe Moldova s conditions. 2. The emergence of inefficient institutions. But how, and why do inefficient institutions emerge and persist? Culture, once more, and legal traditions certainly influence the shape of the institutions of a society, but a more persuasive line of reasoning moves from the observation that institutions determine not only the allocation of resources but also the distribution of wealth, and are the product of the collective choices of a polity (Acemoglu et al., 2005). Social groups holding political power will therefore want to adopt institutions that allow them to capture a larger share of both the resources and the profits of an economy. But such institutions are typically inefficient ones such as institutions that permit the predation of property rights, to use an extreme example, or allow incumbent firms to extract rents by closing their markets to new entrants and therefore in order to appropriate a larger slice of the cake these groups must organise the economy in such a way that the size of the cake is smaller than it could otherwise be. Other social groups will oppose this, whether because they wish to receive a larger share themselves or because they care about the aggregate growth of the economy, and the conflict between these two sets of interests will be solved depending on their relative political strength, and not only on the merits of the conflicting proposals as to the shape of the institutions. The political power of each group, in turn, is determined by their strength inside the institutions where de jure political power resides, but also by the availability of material resources, such as money to advertise one s views, on which their de facto political power is based. And the distribution of resources depends on the institutions that organise the economy, namely the framework within which households and firms take economic decisions and the government makes economic policy. Distinguishing between political institutions and economic ones, on one hand, and between de jure and de facto political power, on the other hand, clarifies the picture: if the future design of the economic institutions is being debated, the existing political institutions and the existing distribution of resources will influence the outcome of such debate, which, in turn, will determine the future performance of the economy, the future distribution of resources and, indirectly, also the future distribution of de facto political power; in the absence of constraints to its political power, the existing élite will win the debate: the new economic institutions will accordingly distribute to its members a disproportionate share of the resources of the economy, which the élite shall then be able to use in order to reshape also the political institutions in such a way as to further increase its own de jure political power, so that at the next round the élite shall extract an even larger share of the resources and profits produced by the economy, and of the political power they afford. It is thus that an élite can perpetuate, at once, its own power and the extractive economic and political institutions on which it rests (Acemoglu and Johnson, 2012). And if these institutions are inefficient which they will typically be, for the élite cannot credibly commit to protect property rights or competition if its own political power ultimately depends on weakening them (Acemoglu, 2003) also the misallocation of the resources of the economy will be perpetuated, to the detriment of social welfare. So, while it is economic institutions that directly influence economic outcomes, the long term performance of an economy depends also on the quality of its political institutions, whose openness is crucial: if they place effective checks on the élite and constrain its ability to reshape the institutions to its own advantage, and if power is diffused, or can easily change hands because the political system is open and pluralistic, the emergence of inefficient institutions, both economic and political, will be less likely (for instance, Acemoglu and Robinson, 2012, persuasively argue that it is the quality of its political institutions that largely explains Botswana s relative prosperity, a country whose GDP per capita is about four times greater than the average in sub Saharan Africa and fifty five times greater than Burundi s) 16. Indeed, economists have often investigated the 16 These data on per capita GDP are, and those mentioned in paragraph 1, are drawn from observations taken by the World Bank (available at 102
103 correlation between economic outcomes and institutions that are more usually associated with the health of a democracy than of an economy, such as the electoral accountability of governments and the role of the mass media (Besley and Burgess, 2001 and 2002) or the electoral systems and the form of government (Persson and Tabellini, 2003). And the so called transition economies of central and eastern Europe including Moldova are of particular interest from this perspective because after 1989 they have reformed both their economic institutions, by liberalising prices and markets, and their political ones, by opening them to competitive and pluralistic politics, in either case with widely diverging results (Frye and Shleifer, 1997; Campos and Coricelli, 2002; Beck and Laeven, 2006). 3. The importance of the judiciary. In the sense used here, institutions are rules. And rules shape reality depending on how they are enforced: addressing an audience of development specialists, North reminded them that when you go to a third world country and try to improve performance, there is only one of the three elements of institutions that you can alter and that is the formal rules of the game. But, of course, performance is the result of all three: the formal rules, informal norms and their enforcement characteristics (2003, p. 7). Policy choices are made in parliaments and governments, not in courts: Montesquieu s metaphor that judges are la bouche de la loi has long been surpassed, but it remains true that the function of courts is merely that of verifying the correspondence between the laws and their application, and courts oversee only a small fraction of the instances in which laws or contracts are to be enforced. Yet, courts matter for both the overall quality of the institutions and for economic development because they are the bedrock upon which the spontaneous enforcement of laws and contracts rests: if the judiciary doesn t function the discrepancy between the rules and their application grows, the trust in their mandatory character declines, spontaneous enforcement recedes, and the laws and institutions lose their power to shape social life. Dam notes that no degree of improvement in substantive law even world best practice substantive law will bring the rule of law to a country that does not have effective enforcement (2006, p. 1): the strength of the judiciary, therefore, greatly influences the effectiveness of the formal institutions, political and economic alike, and the shape of the informal ones: it is in the courts that the enforcement characteristics of a set of institutions is ultimately determined. Indeed, much empirical research shows that a strong judiciary favours economic development, and in transition economies is associated in particular with progress in the depth and efficiency of the capital and credit markets, which are potent engines for growth (Pistor et al., 2000; Beck and Levine, 2005; see also Roland and Verdier, 2003). To protect citizens property rights and enforce their contracts vis à vis both their peers and the government, a strong judiciary must be independent and accountable. What matters is less its formal than its de facto independence, without which courts may be unwilling to sanction a government that breaches its commitment to protect property rights or market competition; and as the credibility of such commitments favours investment and economic growth, Feld and Voigt (2003) found evidence that while formal judicial independence does not have any impact on growth, de facto judicial independence enhances it considerably. The independence of the judiciary is also a disincentive against more naked abuses of public power, such as corruption or extortion. But while judges generally are at least formally independent, prosecutors are often dependent on the executive: in such cases, their incentive to prosecute government corruption declines, and governments can even use criminal process for their partisan interests; whereas empirical research unsurprisingly shows that the de facto independence of prosecutors is a potent deterrent against government corruption (Aaken et al., 2004; Aaken et al., 2010). A tension exists, however, between the independence and the accountability of the judiciary, as the former can lead to negligence or judicial corruption: equally predictably, empirical evidence shows that these phenomena are more widespread where accountability is lacking, and that an effective accountability system for the judiciary enhances aggregate economic growth and welfare primarily through a reduction of judicial corruption (Voigt, 2008). 103
104 Most transition countries, pressed by the EU to stem corruption, have established the formal independence of their judiciaries but their de facto independence and their accountability often remained unsatisfactory (Anderson and Gray, 2007). This is no coincidence, because a survey of developing countries suggests that these problems are more political than technical in nature (Court et al., 2003): where corruption and political interference prevail, vested interests will oppose radical judicial reforms because as we noted above the existing élite has an incentive to perpetuate institutions that, albeit inefficient, reserve to it a disproportionate share of wealth and resources. 4. The quality of Moldova s institutions. The indicators mentioned at the end of paragraph 1 provide a rather reliable, if necessarily imprecise, indication of the quality of Moldova s institutions, political and economic alike, including the strength rule of law and the efficiency of the judicial system. The quality of governance broadly understood is measured by the Worldwide Governance Indicators, which look both at economic institutions and at eminently political ones, such as those considered by the voice and accountability indicator 17. The following table indicates Moldova s progress over the past decade. Figure 1. Moldova s Worldwide Governance Indicators. This table testifies of considerable and constant improvement on all six indicators, with the exception only of control of corruption, which has improved significantly between 2002 and 2006 but marked a slight decline between 2006 and To better assess the significance of this data, however, it is necessary to compare Moldova with other countries. The following tables offer a comparison between Moldova s ranking and (figure 17 The Worldwide Governance Indicators (available here: are six meta indicators, based on more than forty underlying indicators drawn from more than twenty sources, which estimate six aspects of institutional development and for each of which standard errors are indicated. 104
105 2) the average ranking of the economies of the Europe and Central Asia region, and the average ranking of Moldova s income category, and (figure 3) the ranking of Moldova s immediate neighbours (Ukraine and Moldova), and that ranking of the worst performing of the three EU member states that, like Moldova, were part of the Soviet Union (Latvia). Voice and Accountability Political Stability/Absence of Violance Gouvernment Effectiveness Regulatory Quality Rule of Law Control of Corruption Ukraina Romania Latvia Moldova Regional Average Income Average, Percentile Figure 2. Moldova s Worldwide Governance Indicators, compared to income category average, regional average and selected economies. Source: Worldwide Governance Indicators. It thus appears that, while Moldova is better governed than the average of its own income category (with the exception, again, of control of corruption, in respect of which Moldova is slightly below average), it stands significantly below the average of the broader region it is part of, which includes the member states of the EU. Once more, the most significant distance is observed on control of corruption. Predictably, the quality of governance in Moldova is markedly worse than in Romania and, by a wider margin, in Latvia. Moldova, conversely, appears to be better governed than Ukraine, often significantly so: including, remarkably, on both rule of law and control of corruption. The quality of governance and of the rule of law are indirectly reflected also by the Doing Business indicators 18. Moldova has made great strides towards improving its business environment recently, as such indicators testify. But as the next table demonstrates it would appear that progress has been concentrated in some areas, such as getting credit and starting a business, and has not been observed in the two indicators that more directly reflect the conditions of the judiciary, the quality of the rule of law and the overall quality of the institutions, namely protecting investors (which measures the legal protection of a minority shareholder vis à vis both the controlling shareholder and the management of a corporation) and enforcing contracts: on these two indicators Moldova marked a slight decline. 18 The World Bank IFC Doing Business indicators for Moldova are available here: 105
106 Income average Region average Moldova Romania Ukraina Latvia Figure 3. Moldova s Doing Business overall ranking, compared to selected averages and economies. Source: Doing Business, World Bank IFC. Resolving Insolvency Enforcing Contracts Trading Across Borders Paying Taxes Protecting Investors Getting Credit Registering Property Getting Electricity Dealing with Construction Permits Starting a Business Figure 4. Moldova s Doing Business ranking on each indicator. Source: Doing Business, World Bank IFC. Those two indicators protecting investors and enforcing contracts measure the quality of crucial economic institutions, and, aside from their intrinsic importance, they can also be seen as a proxy of the overall quality of the institutional framework of Moldova s economy. Moldova s ranking in these two indicators, however, is quite different, which does not allow any sweeping conclusion: it is rather high (26 out of 183 economies, after a drop of 11 positions between 2011 and 2012) on enforcing contracts, whereas it is rather low (111, after a drop of 3 positions between 2011 and 2012) protecting investors. This last indicator would seem to confirm the situation reflected by the governance indicators discussed above, but Moldova s good performance in enforcing contracts would seem to imply that at least in certain areas Moldova s institutions are efficient and can thus form a solid basis for further improvements: policies aimed at such objective, therefore, hold promise. 106
107 5. Institutions and the constraints to economic growth in Moldova. According to several recent analyses, the problems highlighted by the indicators discussed above are important obstacles to Moldova s economic development. In particular, reference can be made to a study that, on the basis of empirical estimates of the incremental capital output ratio of the Moldovan economy, argues that while investment was not the major factor for Moldova s recent growth episode, observed in the aftermath of the downturn, the importance of investment and, consequently, the relevance of the investment climate is likely to increase in the future, after output has reached its pre crisis levels 19. And to three studies that, from a different perspective, complement this analysis by seeking to identify the most binding constraints to growth in Moldova. Based on a comparative survey of recent literature, the first of such studies argues that microeconomic risks more precisely, constraints such as corruption (whose gravity emerges rather clearly from the Worldwide Governance Indicators indicators) and inefficient bureaucracy, the weakness of property rights, and the lack of a proper competitive environment and inadequate access to financial resources are the most immediate binding constraints: such constraints this study further notes are both related to the weakness of the institutions underpinning the economy, and can thus be viewed as one and the same constraint, with implications for both the financial sector and the business and investment climate 20. The other two studies deal more specifically with each of these two constraints, and offer further evidence for such conclusions 21. The results achieved by this recent research thus offers an empirical confirmation of the theories discussed in the first two paragraph of this note, which suggest that the weaknesses of Moldova s institutions represent important obstacles to its economic development, especially now that the impulse of the recovery from the downturn has begun to slow down. This approach finds support in recent broader studies of the Moldovan economy 22. I would quote, in particular, the succinct but significant analysis offered by the IMF in its concluding statement on the latest Article IV consultations, which qualifies the weakness of the judicial system as a fundamental weakness of the Moldovan economy, and accordingly advises the authorities to improve the protection of property rights and to reform the judicial sector, which are seen alongside other suggested measures as essential to attract investors, improve the business climate and thus raise potential growth 23. It is therefore possible to maintain that that improving the quality of Moldova s political and economic institutions and especially the rule of law and the judicial system, for the reasons outlined in paragraph 3 above could bring Moldova to higher and more sustainable levels of growth, and that, over the medium to long term, this might be among the most effective development strategies available to the country (assuming, of course, that the political economy environment will be permissive). 19 See Apostolos Papaphilippou, On Moldova s incremental capital output ratio, with some observations on growth, investment and the conduct of policy, in Moldovan Economic Trends (2012, n.4, QI), p See Andrea Lorenzo Capussela and Marcel Chistruga, What are the immediate constraints to economic growth in Moldova? A comparative study, in Moldovan Economic Trends (2011, n.2, QII), p See, respectively: Andrea Lorenzo Capussela and Alexandru Fală, The weak business and investment climate is a major constraint to growth, in Moldovan Economic Trends (2011, n.2, QII), p ; and Andrea Lorenzo Capussela and Marcel Chistruga, Access to finance Constraint to economic growth in Moldova, in Moldovan Economic Trends (2011, n.2, QII), p See, especially, World Bank, MoldovaAfter the Global Crisis Promoting Competitiveness and Shared Growth, Report No MD, World Bank, Washington, D.C., 2011, available at: wds.worldbank.org/external/default/ WDSContentServer/WDSP/IB/2011/12/14/ _ /Rendered/PDF/551950ESW0p1090sclosed0Dec pdf: although this study offers to Moldova s authorities rather comprehensive policy suggestions, aimed at stimulating the emergence of a second engine of growth from exports of goods and services, the concern for the weak business and investment climate and for the institutional weaknesses that constitute its causes underlies much of its analysis. 23 See IMF, Moldova 2012 Article IV Consultation, Concluding Statement, IMF, Washington, D.C., 17 May 2012, at paragraphs 16 and 18, available at: 107
108 6. Moldova s justice reform strategy and its relevance for economic growth. In the context described above, Moldova s government has adopted a strategy to reform the judicial sector 24. This strategy is explicitly aimed also at supporting economic development, and it includes specific measures intended to achieve that objective. It might therefore be useful, by way of conclusion, to briefly discuss this strategy in the light of the literature summarised above, which highlights the importance of institutions for economic development and, among them, the centrality of efforts to improve the rule of law and the quality of the judiciary, which can have positive horizontal effects on the efficiency of all formal institutions, political and economic alike. The overall objective of the strategy, in its own words, is to build a justice sector which is affordable, efficient, independent, transparent, professional and accountable to society, that meets European standards, ensures the rule of law and the observance of human rights and contributes to safeguarding society s trust in justice 25. And the first, and apparently the most important, specific objective is to strengthen the independence, accountability, impartiality, efficiency and transparency of the judicial system 26. The strategy also contains an objective that is targeted specifically at favouring economic development, namely the intention to implement measures by which the justice sector would help create a favourable climate for sustainable economic development. Such measures form one of the seven pillars of the strategy, the fifth one, concerning the contribution of the justice sector to economic growth. The measures that are part of such pillar are the following: (i) strengthening the alternative dispute resolution system; (ii) improving the insolvency procedure; and (iii) modernising the system of keeping business records and of access to information on businesses 27. Each of these measures seems well chosen, and their proper implementation would certainly have positive effects on growth. Improving the insolvency procedures, for instance, could both reduce the cost of credit and speed up the reallocation of production factors from inefficient enterprises to more efficient ones. Yet, the aptness of this choice should not lead one to forget as the strategy itself underlines 28 that the crucial problem for the development of Moldova is the broader efficiency of the justice system, in terms of its ability to ensure more widespread respect for the rule of law, better protection of property rights, and better enforcement of contracts. This point can be illustrated by an example drawn directly from recent experience, namely the so called bank raids of the summer of 2011: it is in relation to these events that the IMF notes the weakness of the judicial system (Moldova s courts had recognised and enforced certain dubious arbitration awards, and did so in an allegedly improper manner) and observes that there is little hope of sustainable business development and foreign direct investment unless these weaknesses are addressed 29. In other words, the problem lies less in single aspects of the judicial system, such as the three ones specifically addressed by the reform strategy, than in its more general unreliability. The greatest contribution that the reform of the justice sector can give to Moldova s economic development, therefore, lies less in the implementation of those three measures than in the 24 Government of Moldova, Strategy for Justice Sector Reform The strategy has been approved by Moldova s government and by Moldova s parliament on 20 September and 25 November 2011, respectively, and the relevant action plan has been approved by Moldova s government and by Moldova s parliament on 13 December 2011 and 16 February 2012, respectively; the strategy and its action plan is now being implemented. The text of the strategy is available in Romanian, Russian and English at: 25 Government of Moldova, Strategy for Justice Sector Reform , p Ibidem. 27 Ibidem, p It should be noted that these measures, naturally, are not the only ones that may improve the effectiveness of the judicial system from the narrow perspective of the needs of the economy: for instance, Moldova has recently changed the bailiff system for enforcing judgments, an important reform whose implementation is underway. 28 Ibidem, p IMF, Moldova 2012 Article IV Consultation, Concluding Statement, cit., paragraph
109 attainment of the main objective of the strategy: namely, having a more efficient, impartial and predictable judicial system. To achieve this aim, according to the literature mentioned in paragraph 3 above, strengthening the de facto independence and the accountability of the judges and prosecutors will be crucial. According to the analysis given in the strategy itself, however, the current situation of the independence and accountability of the justice sector is such that considerable efforts will be required to achieve significant improvements. More precisely, according to the strategy: the promotion of judges and prosecutors is insufficiently transparent and is not based on merit, which weakens both their independence and their accountability; there are no effective mechanisms of accountability of the justice sector actors ; and, more generally, professional, moral and ethical standards have not become an important part of the professionals work in the [judicial] sector 30. Moreover, according to a 2009 parliamentary resolution quoted by the strategy, the judiciary in Moldova is seriously affected by corruption, a phenomenon which, as we noted, emerges rather clearly from the governance indicators discussed in paragraph 4 above. Moldova has recently adopted also an anti corruption strategy, which combines prevention with repression and will bring significant institutional changes. The blunt observation of Moldova s parliament further confirms that the accountability of the judiciary must be accorded considerable attention because judicial corruption typically flourishes where accountability is weak and suggests careful attention to the repression aspects of the anti corruption strategy. The frankness of this assessment is commendable, and explains the considerable attention devoted to such issues by the strategy, but it also suggests that the core objectives of the strategy might meet resistance by vested interests. In this scenario, therefore, the political economy of this broad reform effort appears to be a rather challenging one, and it is presumable that its proper implementation will require strong political support. References Aaken Van, Anne, Eli Salzberger and Stefan Voigt (2004) The Prosecution of Public Figures and the Separation of Powers: Confusion within the Executive Branch A Conceptual Framework. Constitutional Political Economy, 15: Aaken Van, Anne, Lars Feld and Stefan Voigt (2010) Do Independent Prosecutors Deter Political Corruption? An Empirical Evaluation Across Seventy Eight Countries. American Law and Economics Review, 12: Acemoglu, Daron (2003) Why Not a Political Coase Theorem? Social Conflict, Commitment and Politics. Journal of Comparative Economics, 31: Acemoglu, Daron (2006) A Simple Model of Inefficient Institutions. Scandinavian Journal of Economics, 108: Acemoglu, Daron and Simon Johnson (2012) Why Nations Fail. The origins of power, prosperity and poverty. New York, Random House, Acemoglu, Daron, Simon Johnson, and James Robinson (2005) Institutions as a Fundamental Cause of Long Run Growth. in P. Aghion and S. Durlauf (eds.) Handbook of Economic Growth: Elsevier, Amsterdam, Adam, Christopher and Stefan Dercon (2009) The political economy of development: an assessment. Oxford Review of Economic Policy, 25: Government of Moldova, Strategy for Justice Sector Reform , cit., p
110 Anderson, James and Cheryl Gray (2007), Transforming Judicial Systems in Europe and Central Asia. in F. Bourguignon and B. Pleskovic (eds.) Annual World Bank Conference on Development Economics: World Bank, Washington D.C., Baumol, William (1990) Entrepreneurship: Productive, Unproductive and Destructive. Journal of Political Economy, 98: Beck, Thorsten (2012) Legal Institutions and Economic Development. in D. Müller (ed.) Oxford Handbook of Capitalism. Oxford University Press, Oxford, [Not yet published: available as CentER Discussion Paper Series No , at: papers.cfm?abstract_id= ] Beck, Thorsten and Luc Laeven (2006) Institution Building and Growth in Transition Economies. Journal of Economic Growth, 11: Beck, Thorsten and Ross Levine (2005) Legal Institutions and Financial Development. in C. Ménard and M. Shirley (eds.) Handbook of New Institutional Economics: Springer, Dordrecht, Besley, Timothy and Robin Burgess (2001) Political agency, government responsiveness and the role of the media. European Economic Review, 45: Besley, Timothy and Robin Burgess (2002) The political economy of government responsiveness: theory and evidence from India. The Quarterly Journal of Economics, 117: Besley, Timothy and Torsten Persson (2011) Fragile states and development policy forthcoming in Journal of the European Economic Association, 9: Campos, Nauro and Fabrizio Coricelli (2002) Growth in Transition: What We Know, What WE Don t, and What We Should. Journal of Economic Literature, 40: Court, Julius, Goran Hyden and Ken Mease (2003) The Judiciary and Governance in 16 Developing Countries. World Governance Survey Discussion Paper, 9. United Nations University, Tokyo, Dam, Kenneth (2006) The Judiciary and Economic Development. The University of Chicago, Olin Law & Economics Working Paper, 287. University of Chicago, Chicago, Diamond, Jared (1997) Guns, Germs and Steel: The Fate of Human Societies. Norton, New York, Feld, Lars and Stefan Voigt (2003) Economic Growth and Judicial Independence: Cross Country Evidence Using a New Set of Indicators. European Journal of Political Economy, 19: Frankel, Jeffrey and David Romer (1999) Does Trade Cause Growth? American Economic Review, 89: Frye, Timothy and Andrei Shleifer (1997) The Invisible Hand and the Grabbing Hand. American Economic Review, Papers and Proceedings, 87: Glaeser, Edward, Rafael La Porta, Florencio Lopez de Silanes, and Andrei Shleifer (2004) Do Institutions Cause Growth? Journal of Economic Growth, 9: Greif, Avner (1994) Cultural Beliefs and the Organization of Society: A Historical and Theoretical Reflection on Collectivist and Individualist Societies. Journal of Political Economy, 102: Kaufman, Daniel and Aart Kraay (2008) Governance Indicators: Where Are We, Where Should We Be Going? The World Bank Research Observer, 23: 1 30 (available at: worldbank.org/bitstream/handle/10986/4412/wbro_23_1_1.pdf?sequence=1). 110
111 Kaufman, Daniel, Aart Kraay and Massimo Mastruzzi (2007) The Worldwide Governance Indicators Project: Answering the Critics. World Bank Policy Research Working Paper, World Bank, Washington D.C., 2007 (available at: wds.worldbank.org/servlet/ WDSContentServer/WDSP/IB/2007/02/23/ _ /Rendered/PDF/wps4149.pdf). Kaufman, Daniel, Aart Kraay and Massimo Mastruzzi (2009) Governance Matters VIII. World Bank Policy Research Working Paper, World Bank, Washington D.C., 2009 (available at: wds.worldbank.org/servlet/wdscontentserver/wdsp/ib/2009/06/29/ _ /Rendered/PDF/WPS4978.pdf). Kaufman, Daniel, Aart Kraay and Pablo Zoido Lobatón (1999) Governance Matters. World Bank Policy Research Working Paper, World Bank, Washington D.C., 1999 (available at: wds.worldbank.org/external/default/wdscontentserver/iw3p/ib/1999/10/27/ _ /Rendered/PDF/multi_page.pdf). Landes, David (1998) The Wealth and Poverty of Nations: Why Some Are So Rich and Some So Poor. Norton, New York, North, Douglass (1990) Institutions, Institutional Change, and Economic Performance. Cambridge University Press, Cambridge, North, Douglass (1991) Institutions. Journal of Economic Perspectives, 5: North, Douglass (2003) The Role of Institutions in Economic Development. UNECE Discussion Papers, 2003 (available at: 2.pdf). North, Douglass and Robert Thomas (1973) The Rise of the Western World. Cambridge University Press, Cambridge, Persson, Torsten and Guido Tabellini (2003) The Economic Effects of Constitutions. MIT Press, Cambridge MA., Pistor, Katharina, Martin Raiser and Stanislaw Gelfer (2000) Law and Finance in Transition Economies. Economics of Transition, 8: Rodrik, Dani, Arvind Subramanian and Francesco Trebbi (2004) Institutions Rule: The Primacy of Institutions over Geography and Integration in Economic Development. Journal of Economic Growth, 9: Roland, Gérard and Thierry Verdier (2003) Law Enforcement and Transition. European Economic Review, 47: Sachs, Jeffrey (2001) Tropical Underdevelopment. NBER Working Paper, 8119 (available at: Voigt, Stefan (2008) The Economic Effects of Judicial Accountability Cross Country Evidence. European Journal of Law and Economics, 25: Voigt, Stefan (2009) How to Measure the Rule of Law. Working paper (available at: World Bank and International Finance Corporation (2012) Doing Business 2012: Doing Business in a More Transparent World. World Bank, Washington D.C., 2012 (available at: reports/doing business 2012). 111
112 STATISTICAL ANNEX 112

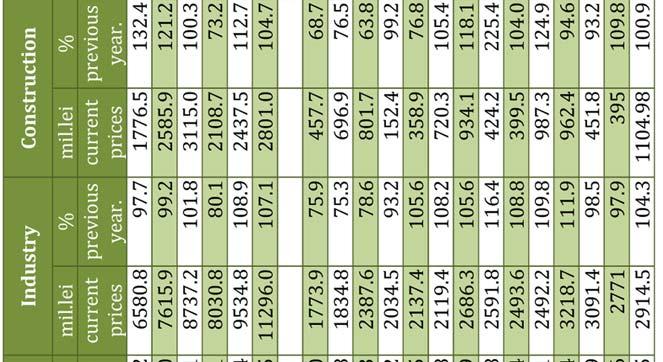
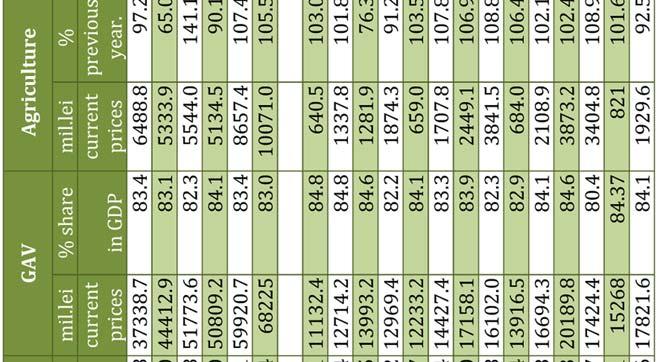
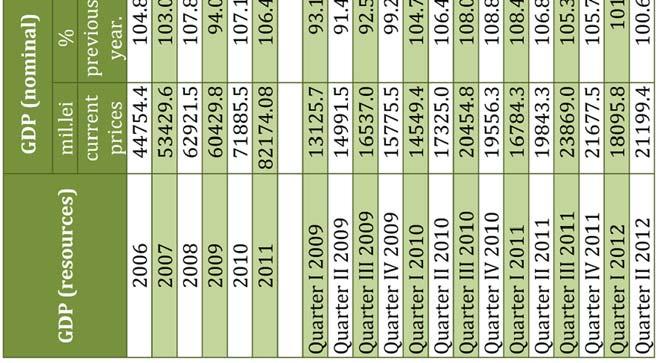
113 113

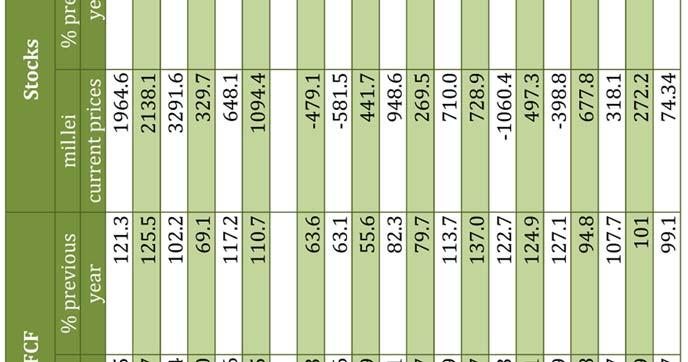
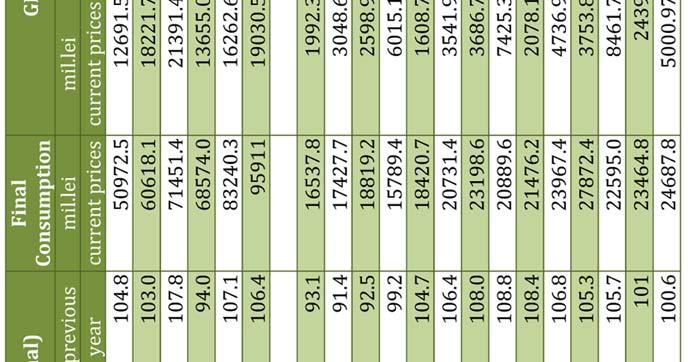
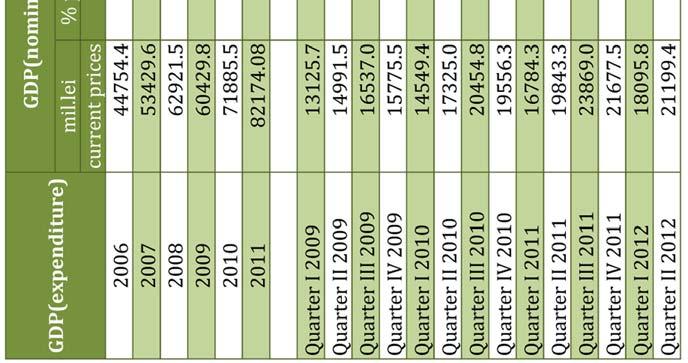
114 114

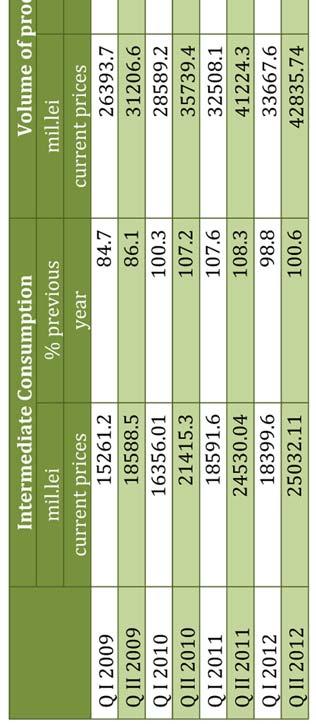
115 115

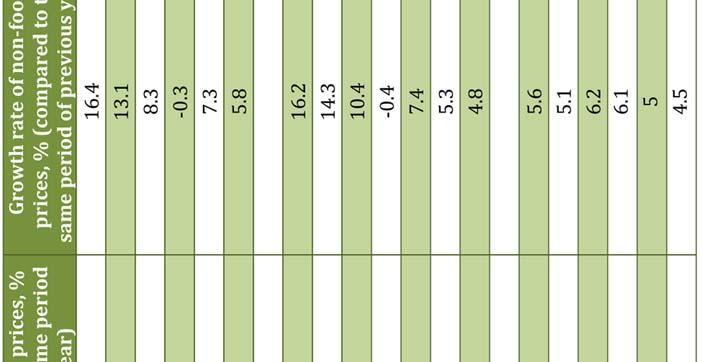
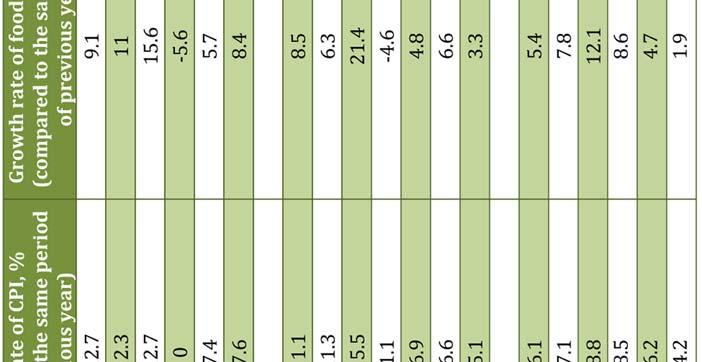
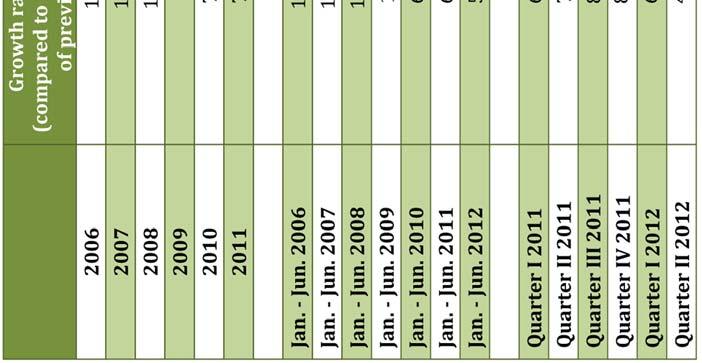
116 116
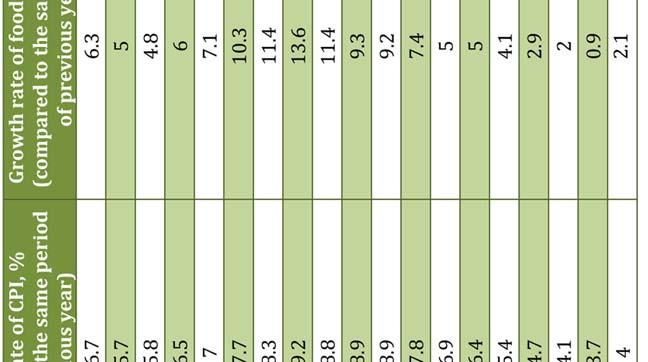
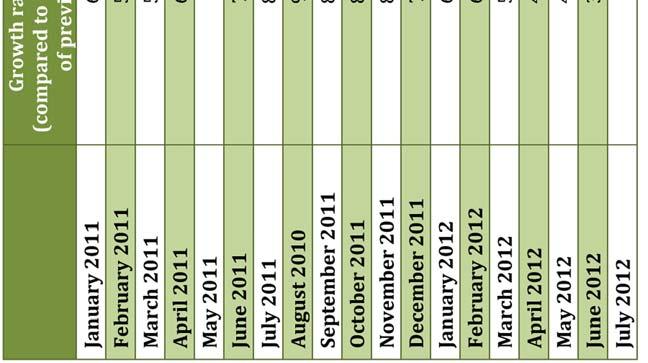
117 117

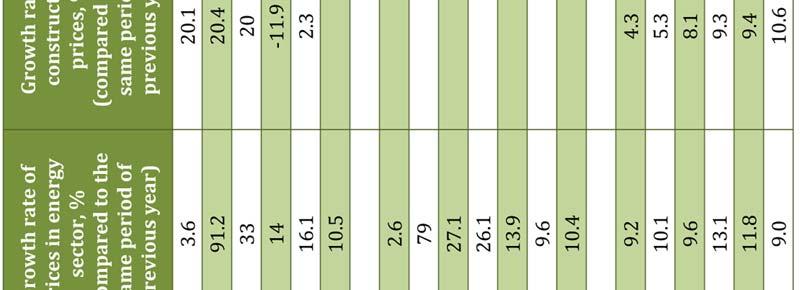
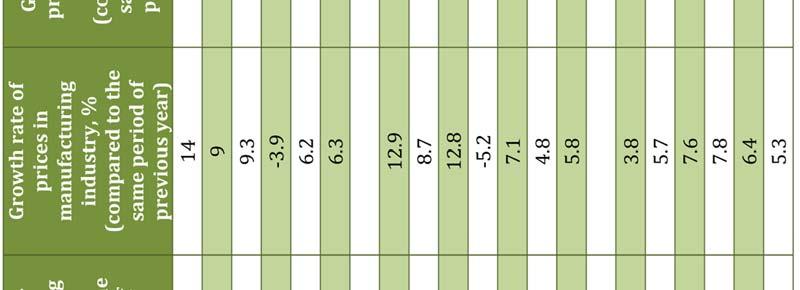
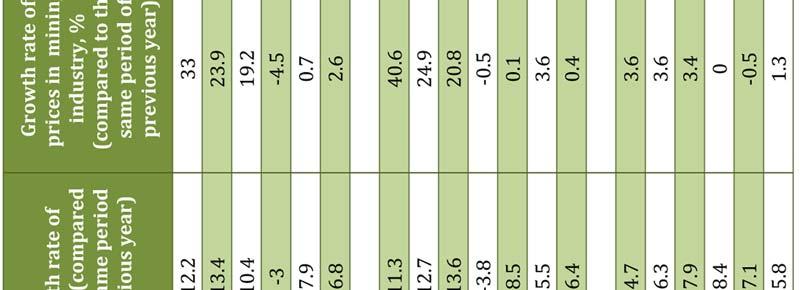
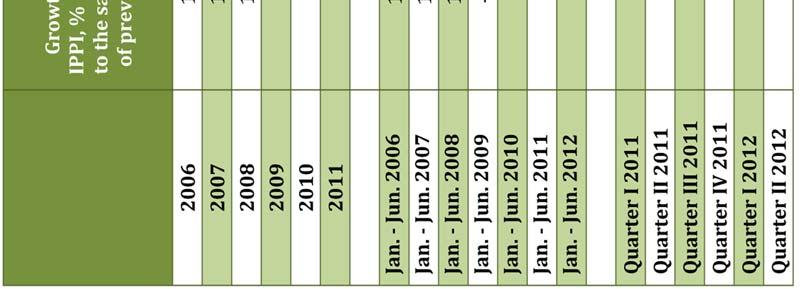
118 118

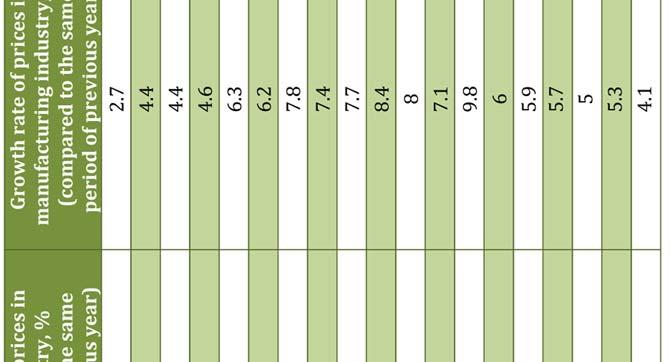
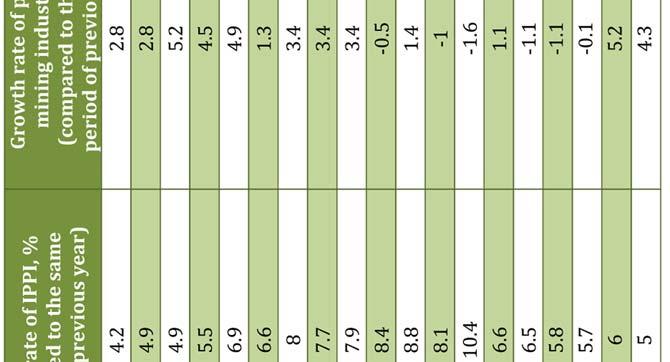

119 119


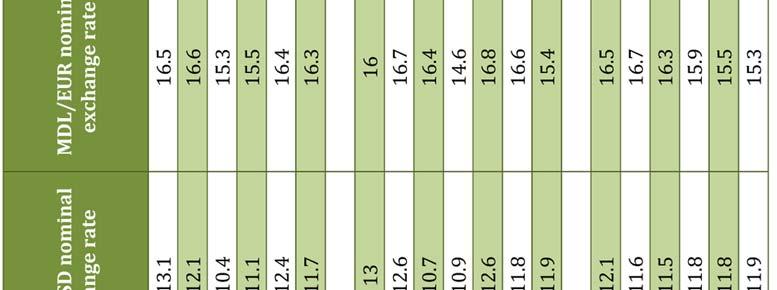
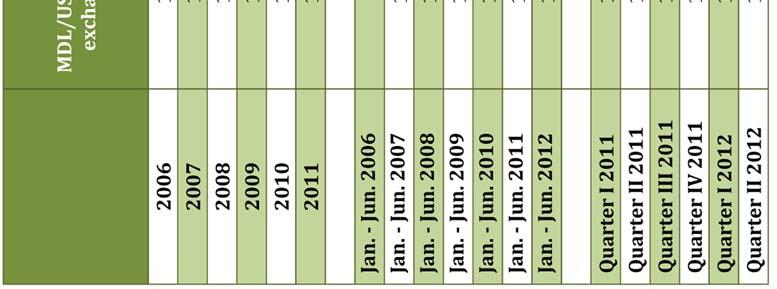
120 120


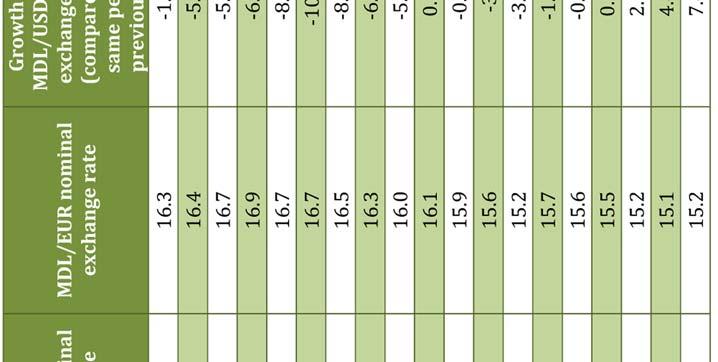
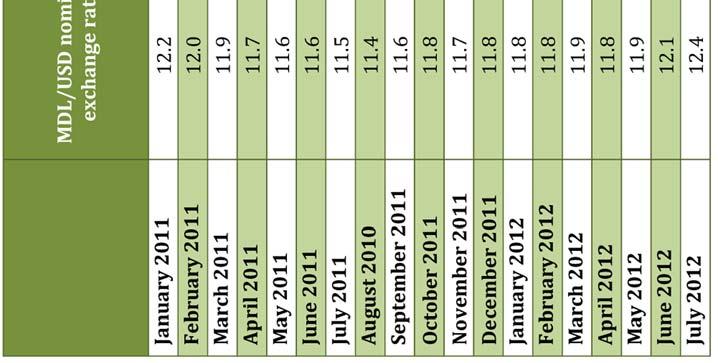
121 121


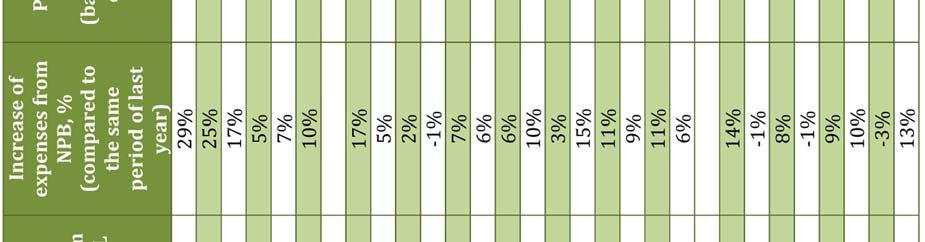

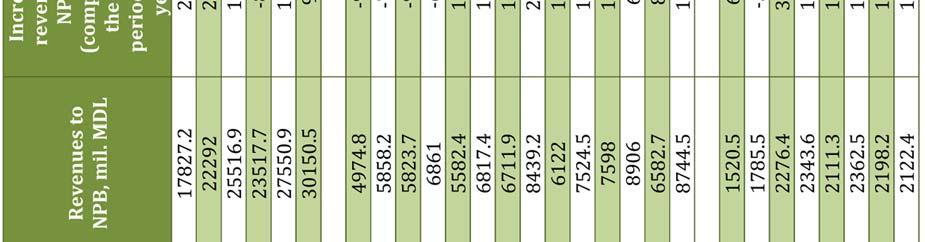
122 122

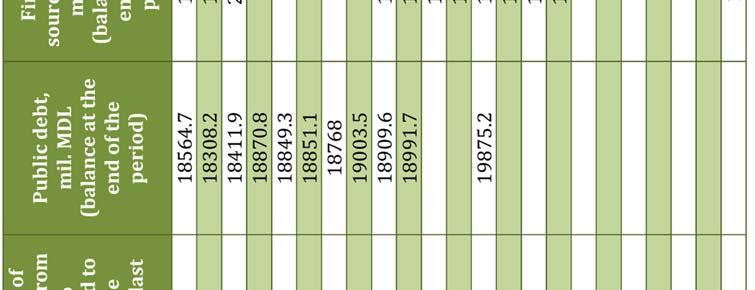

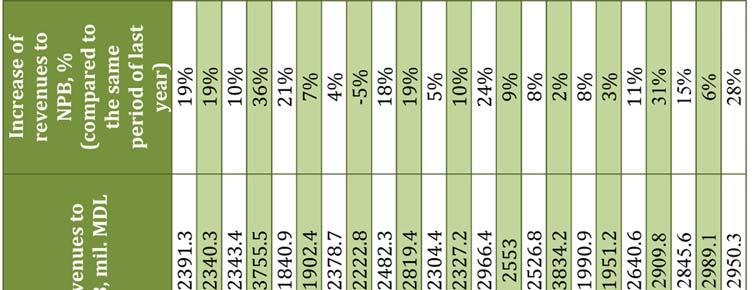
123 123

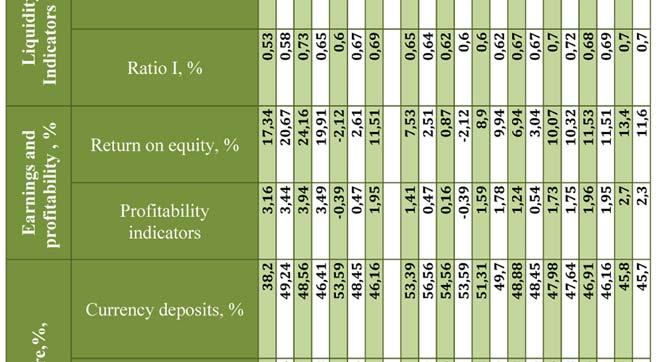
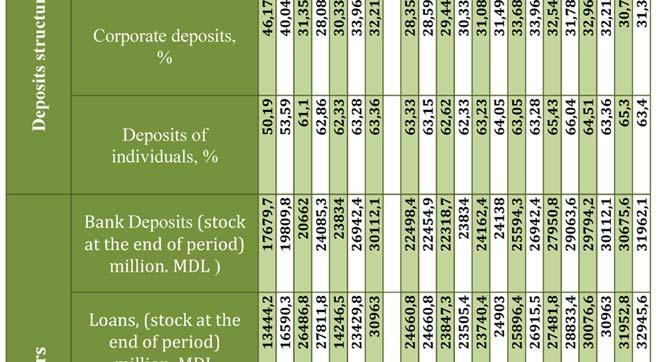
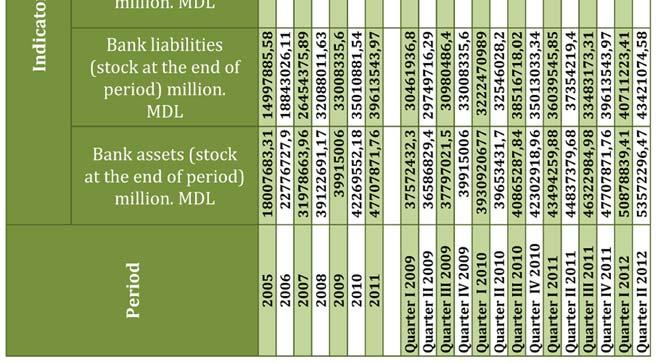
124 124

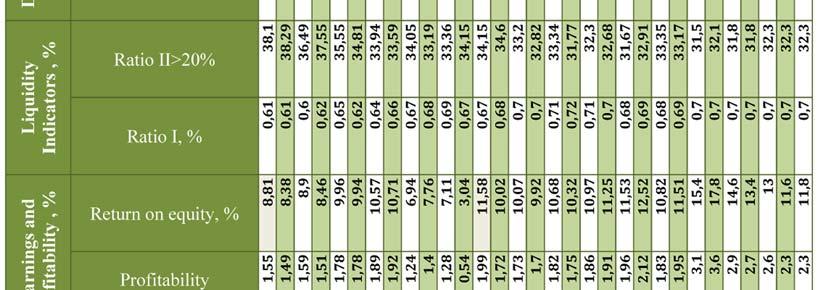

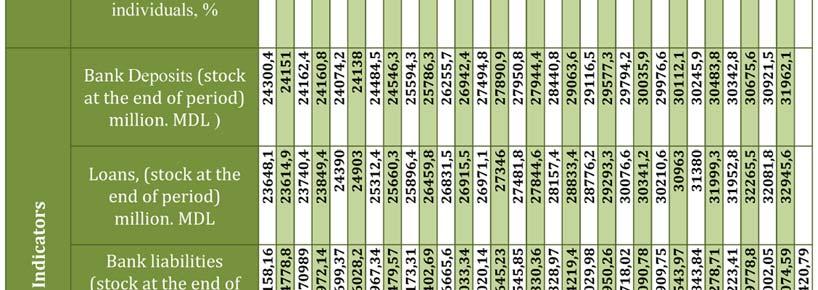
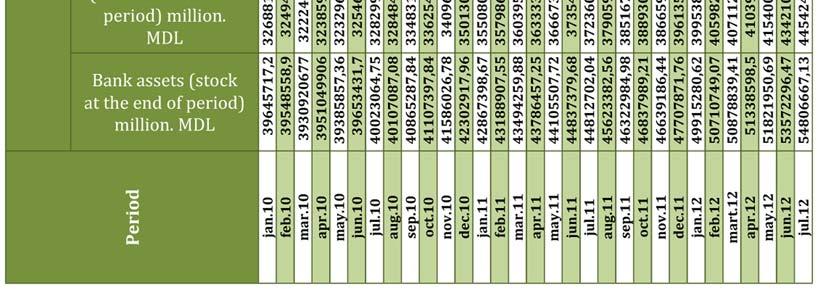
125 125

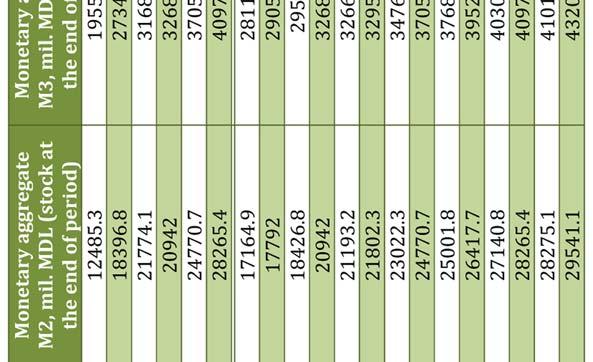
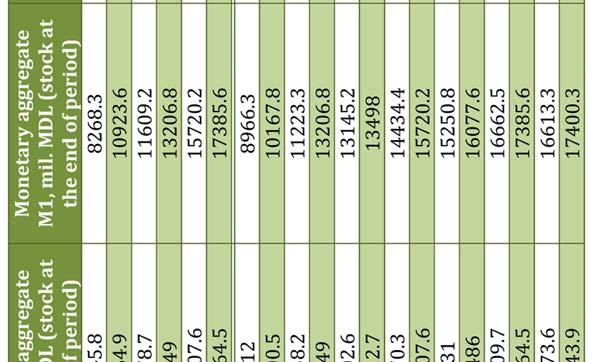
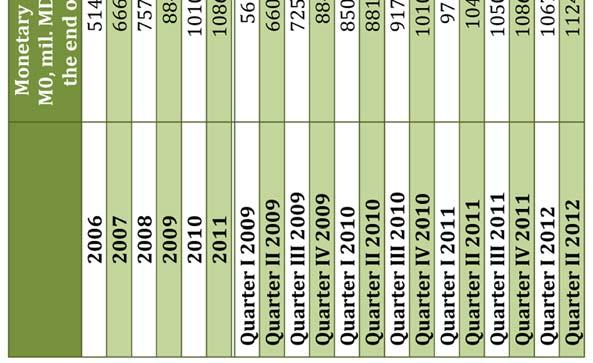
126 126

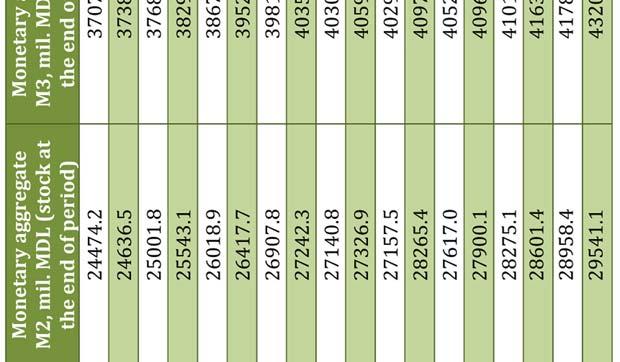

127 127

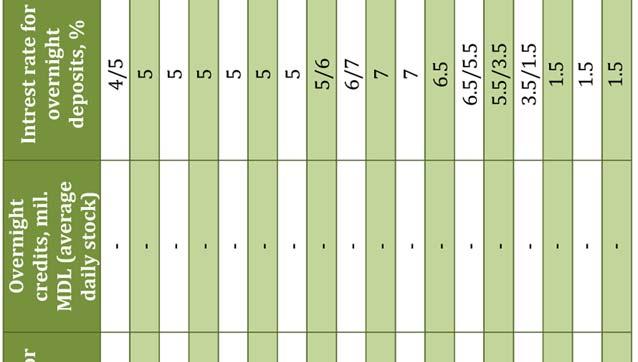
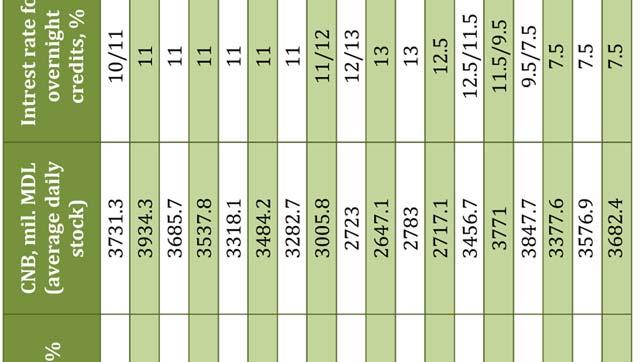
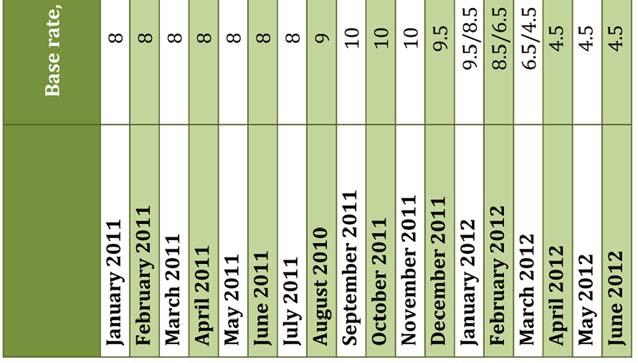
128 128

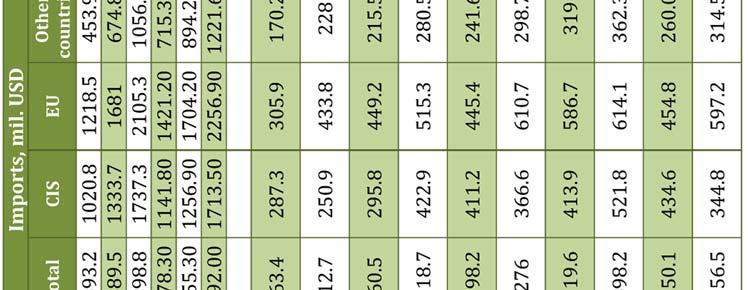
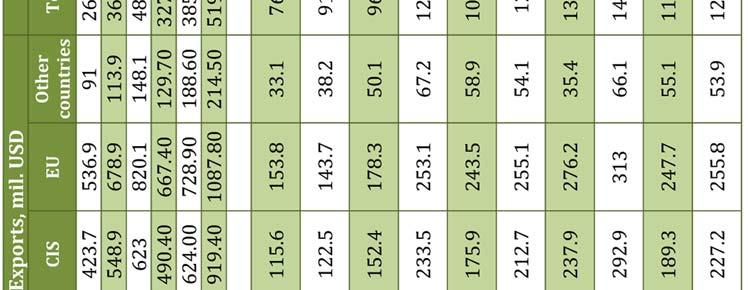
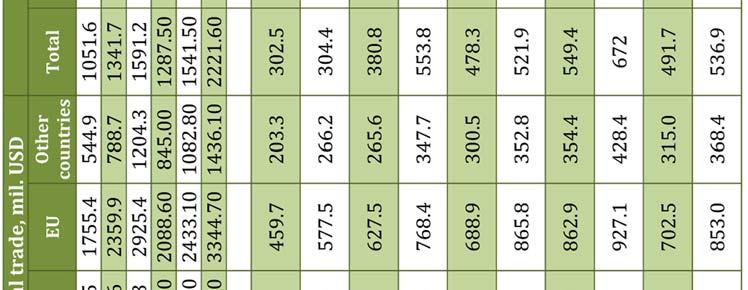

129 129

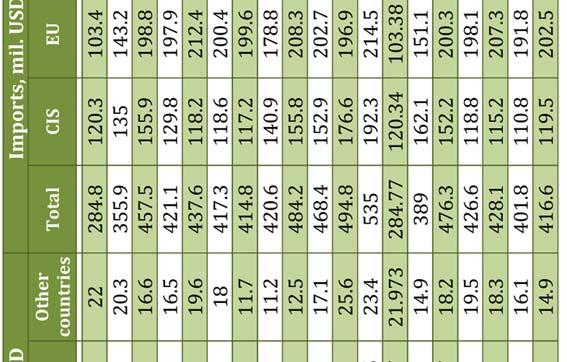
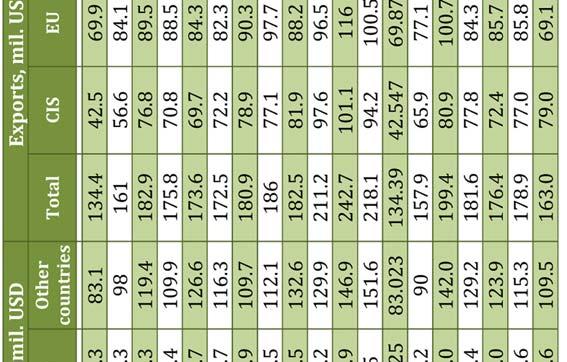
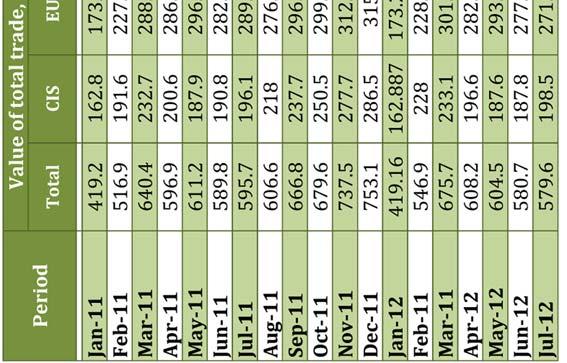
130 130


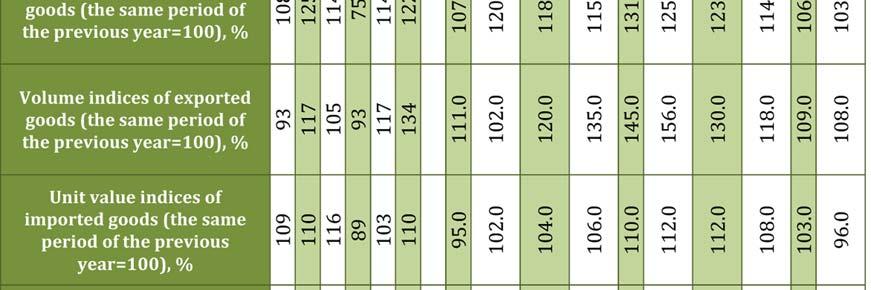
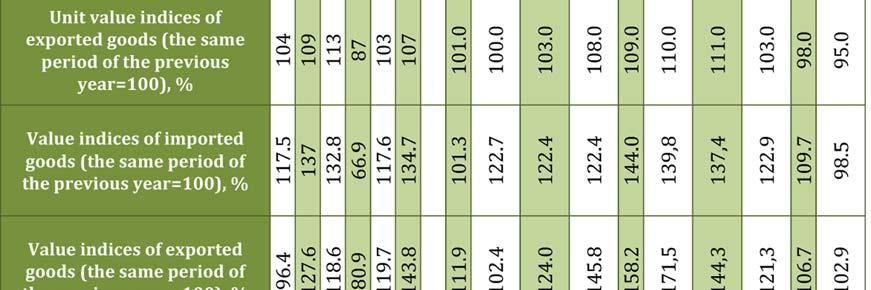
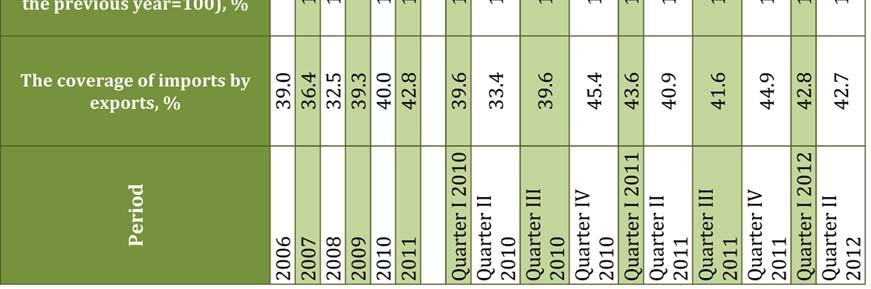
131 131

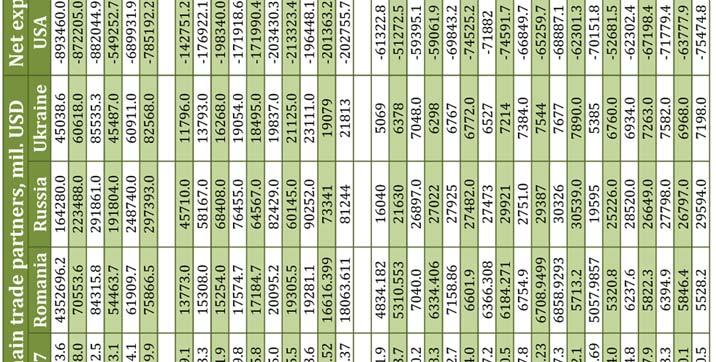
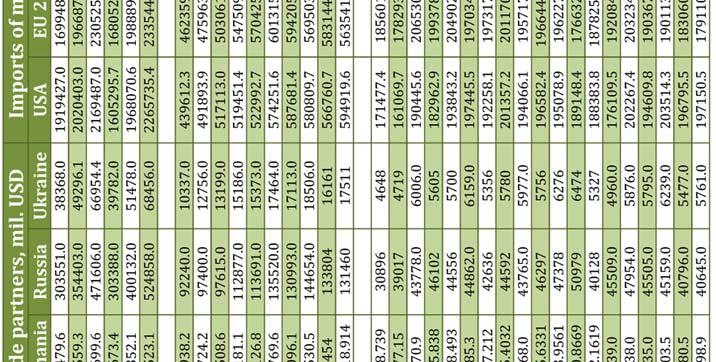
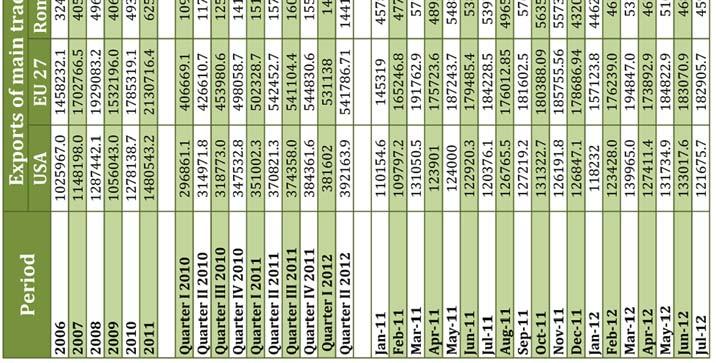
132 132
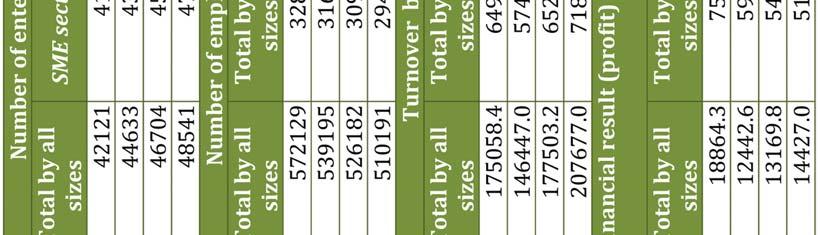
133 133

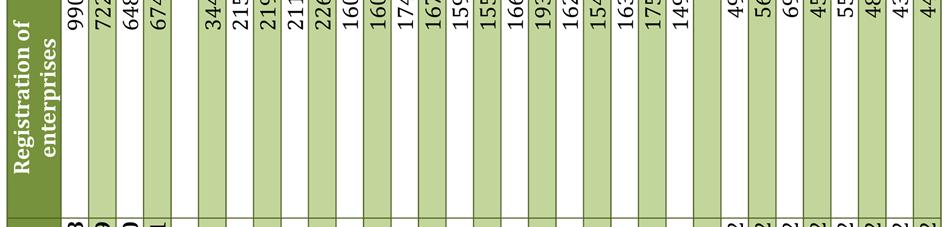
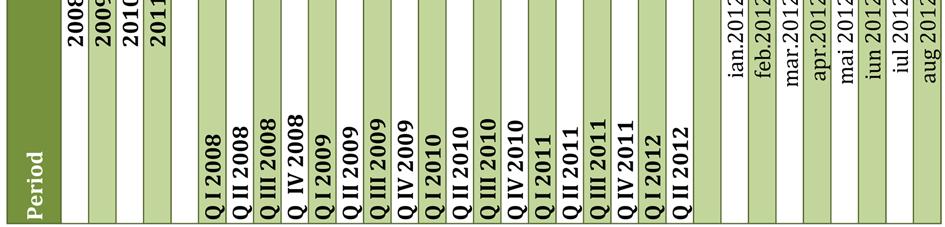
134 134

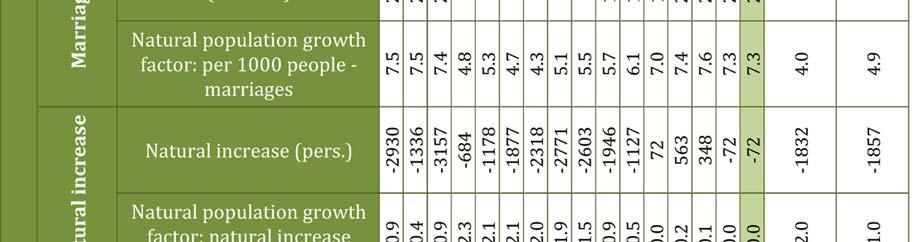
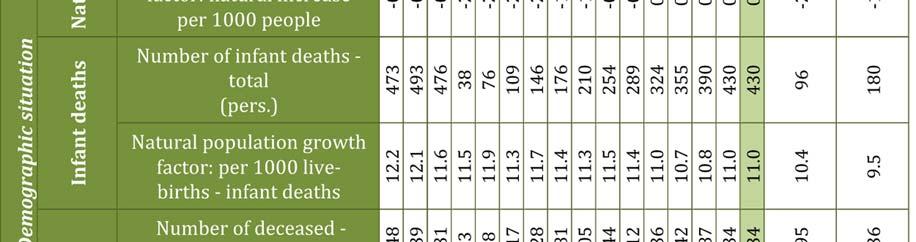
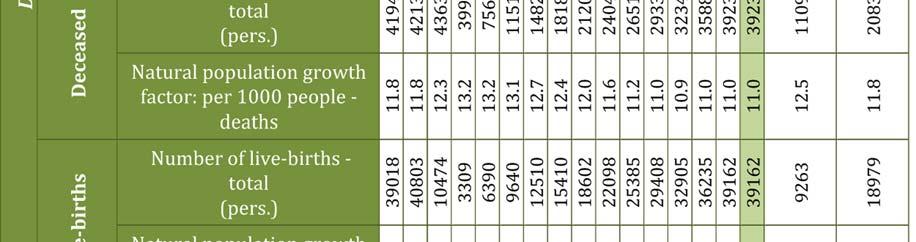
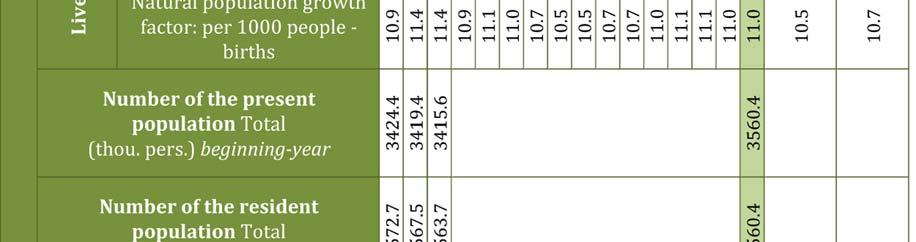
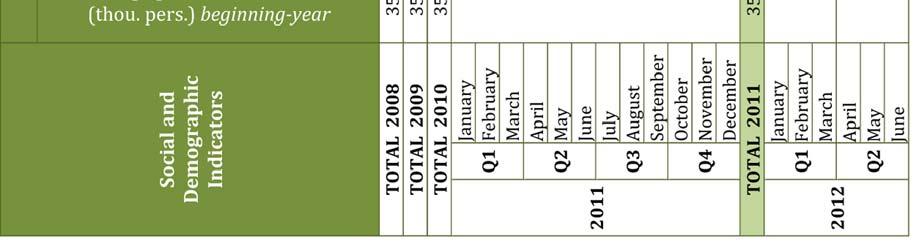
135 135

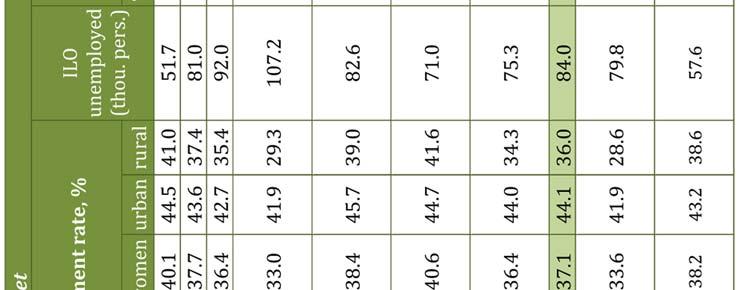
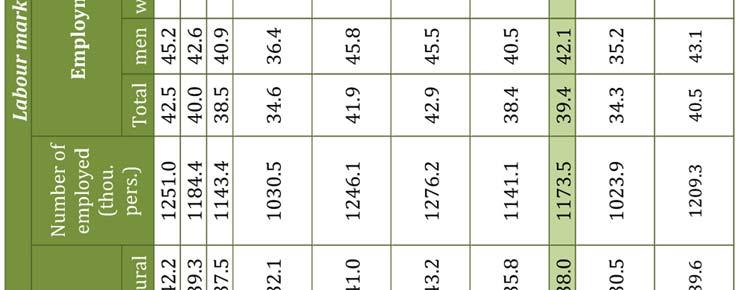
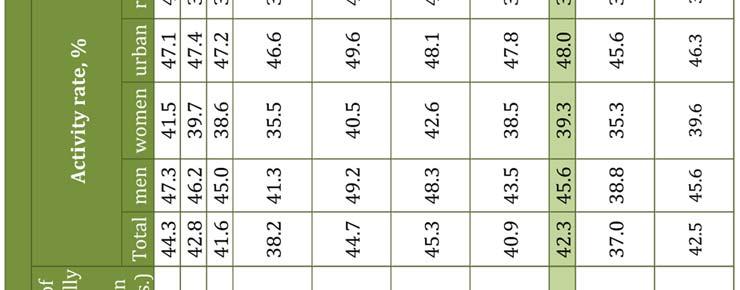
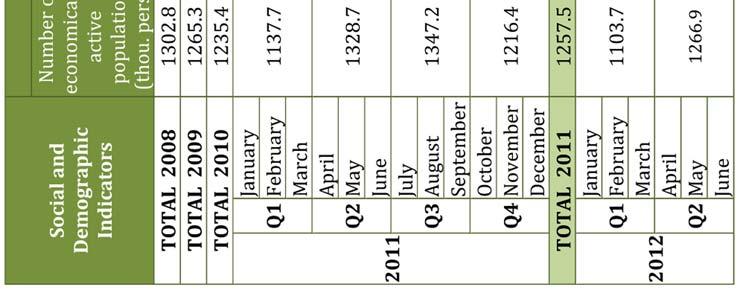
136 136

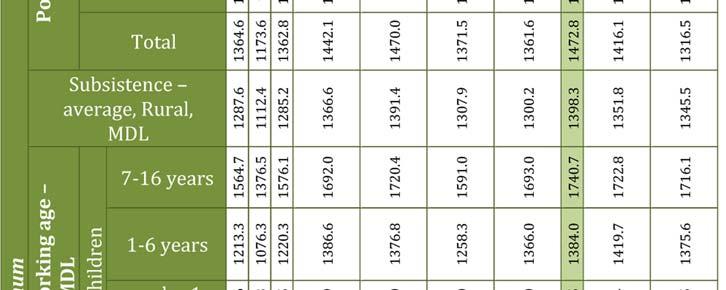
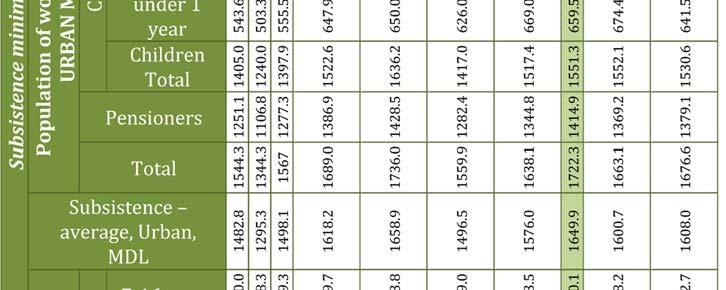
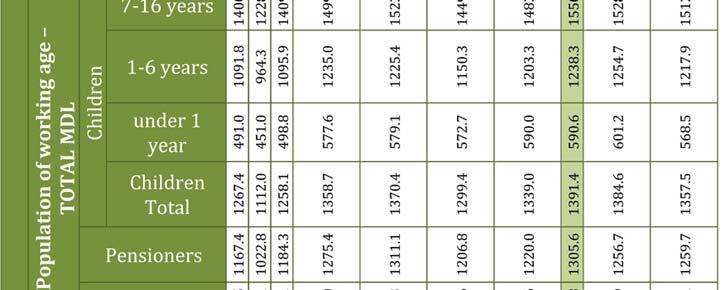
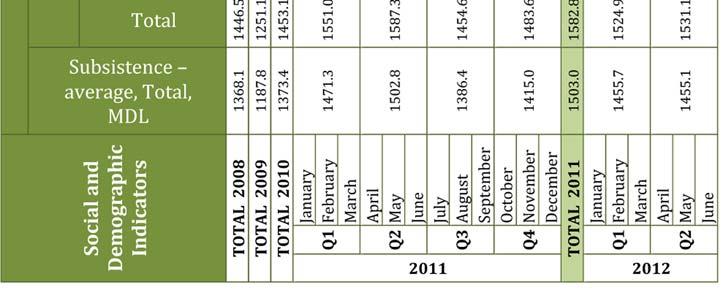
137 137

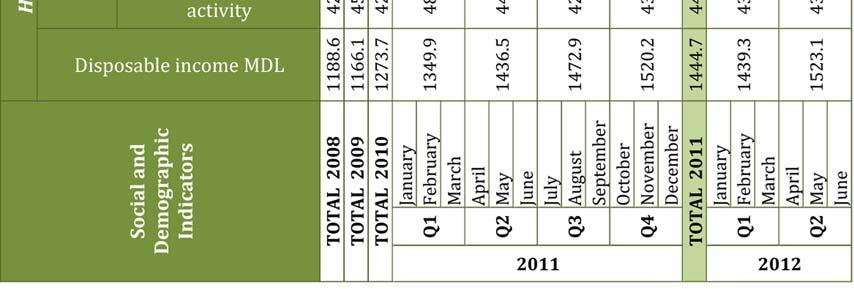
138 138

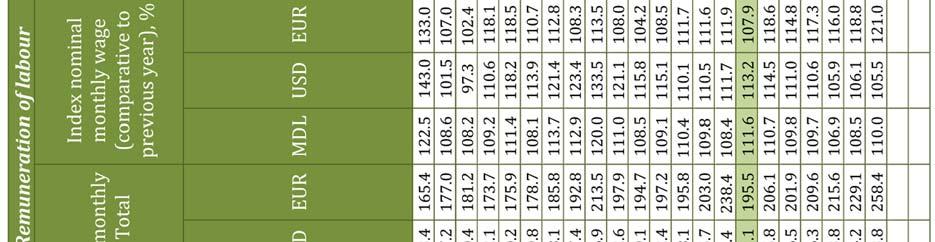
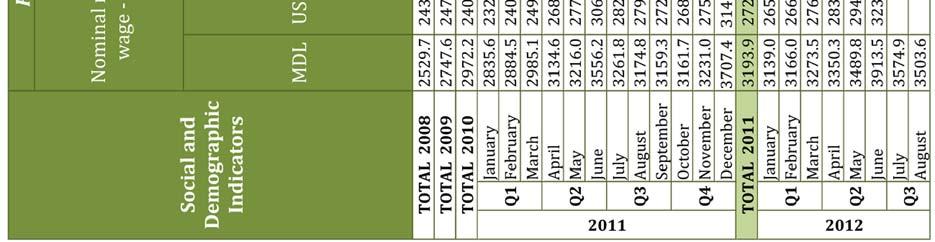
139 139

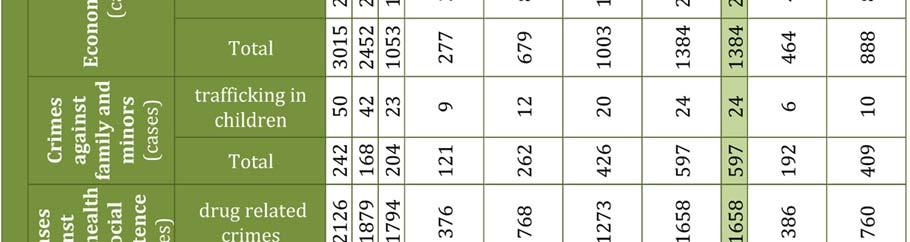
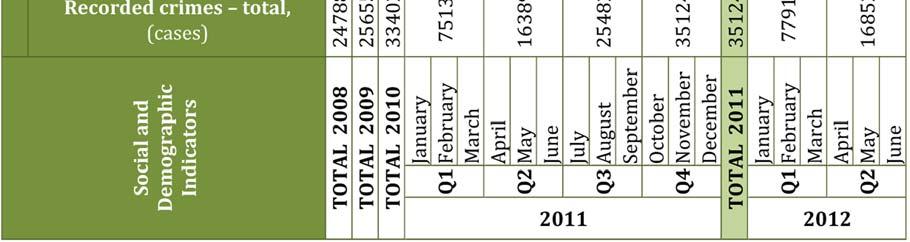
140 140
MOLDOVAN ECONOMIC TRENDS
 Academy of Sciences of Moldova National Institute for Economic Research Ministry of Economy of the Republic of Moldova MOLDOVAN ECONOMIC TRENDS ISSN 1857-3134 Chisinau Supported by the European Union High
MOLDOVAN ECONOMIC TRENDS
 Academy of Sciences of Moldova National Institute for Economic Research Ministry of Economy of the Republic of Moldova MOLDOVAN ECONOMIC TRENDS ISSN 1857 3134 Chisinau ISSN 1857 3134 AUTHORS: Alexandru
National Bank of Moldova
 Note Monetary Policy Report no. 3, August 2010 was prepared bearing on the most recent statistical data compiled by the National Bank of Moldova, National Bureau of Statistics, Ministry of Economy and
ECONOMIC MONITOR MOLDOVA Issue 7 January 2018
 ECONOMIC MONITOR MOLDOVA Issue 7 January 218 Overview Economic growth at 3.5% in 217 Weaker growth of 3.% expected in 218 due to decreased consumption demand Inflation at 6.6% in average during 217; lower
Priorities of the Government of the Republic of Moldova in the area of attracting investments and promoting exports
 Ministry of Economy and Infrastructure of the Republic of Moldova Priorities of the Government of the Republic of Moldova in the area of attracting investments and promoting exports THE REPUBLIC OF MOLDOVA
CATALOGUE of statistical publications
 National Bureau for Statistics of the Republic of Moldova CATALOGUE of statistical publications 2008 Chisinau 2008 Contents pag. Services offered by NBS... 4 Annual publications Statistical Yearbook of
MOLDOVAN ECONOMIC TRENDS
 Academy of Science of Moldova National Institute for Economic Research Ministry of Economy of Moldova MOLDOVAN ECONOMIC TRENDS ISSN 1857-3126 Chisinau ISSN 1857-3126 MET TEAM: Alexandru Stratan, Alexandru
Regional Economic Integration of the Republic of Moldova: Opportunities and Challenges
 Regional Economic Integration of the Republic of Moldova: Opportunities and Challenges Octavian CALMÎC, Deputy Minister of Economy of the Republic of Moldova, Chişinău 2015 Republic of Moldova: geo - economic
ECONOMIC MONITOR MOLDOVA Issue 8 June 2018
 ECONOMIC MONITOR MOLDOVA Issue 8 June 218 Overview Economic growth of 4.5% in 217, slowdown to low 3.8% expected for 218 Growth driven by private consumption, also positive contribution from investment
Highlights 2/2017. Main topics: Ministry of Finance of the Republic of Bulgaria. Economic and Financial Policy Directorate ISSN
 BULGARIAN месечен ECONOMY обзор Monthly Report Ministry of Finance of the Republic of Bulgaria 2/217 Economic and Financial Policy Directorate ISSN 2367-2 Main topics:» Gross domestic product» Short-term
Italy. May 2018 Statistical Factsheet
 May 2018 Statistical Factsheet Italy CONTENTS Main figures 1. KEY DATA 2. POPULATI ON & ECONOMY 3. FINANCIAL ASPECTS 4. ECONOMI C ACCOUNTS 5. AGRICULTURAL TRADE 6. FARM STRUCTURE 1 2 3 4-5 6-12 13-14 15-16
France. May 2018 Statistical Factsheet
 May 2018 Statistical Factsheet France CONTENTS Main figures 1. KEY DATA 2. POPULATI ON & ECONOMY 3. FINANCIAL ASPECTS 4. ECONOMI C ACCOUNTS 5. AGRICULTURAL TRADE 6. FARM STRUCTURE 1 2 3 4-5 6-12 13-14
Statistical Factsheet. Italy CONTENTS. Main figures - Year 2016
 June 2017 Statistical Factsheet Italy CONTENTS Main figures 2016 1. KEY DATA 2. POPULATION & ECONOMY 3. FINANCIAL ASPECTS 4. ECONOMIC ACCOUNTS 5. AGRICULTURAL TRADE 6. FARM STRUCTURE 1 2 3 4-5 6-12 13-14
Statistical Factsheet. France CONTENTS. Main figures - Year 2016
 June 2017 Statistical Factsheet France CONTENTS Main figures 2016 1. KEY DATA 2. POPULATION & ECONOMY 3. FINANCIAL ASPECTS 4. ECONOMIC ACCOUNTS 5. AGRICULTURAL TRADE 6. FARM STRUCTURE 1 2 3 4-5 6-12 13-14
Austria. May 2018 Statistical Factsheet
 May 2018 Statistical Factsheet Austria CONTENTS Main figures 1. KEY DATA 2. POPULATI ON & ECONOMY 3. FINANCIAL ASPECTS 4. ECONOMI C ACCOUNTS 5. AGRICULTURAL TRADE 6. FARM STRUCTURE 1 2 3 4-5 6-12 13-14
Netherlands. May 2018 Statistical Factsheet
 May 2018 Statistical Factsheet Netherlands CONTENTS Main figures 1. KEY DATA 2. POPULATI ON & ECONOMY 3. FINANCIAL ASPECTS 4. ECONOMI C ACCOUNTS 5. AGRICULTURAL TRADE 6. FARM STRUCTURE 1 2 3 4-5 6-12 13-14
Estonia. May 2018 Statistical Factsheet
 May 2018 Statistical Factsheet Estonia CONTENTS Main figures 1. KEY DATA 2. POPULATI ON & ECONOMY 3. FINANCIAL ASPECTS 4. ECONOMI C ACCOUNTS 5. AGRICULTURAL TRADE 6. FARM STRUCTURE 1 2 3 4-5 6-12 13-14
All data in the edition are the last available data as of May 2017
 All data in the edition are the last available data as of May 2017 The quoted data set in this report are the last available data, published in the official source s web sites. The sources are Ministry
Greece. Sources: European Commission, Eurostat, and Directorate General for Economic and Financial Affairs. Updated: M ay 2018
 May 2018 Statistical Factsheet Greece CONTENTS Main figures 1. KEY DATA 2. POPULATI ON & ECONOMY 3. FINANCIAL ASPECTS 4. ECONOMI C ACCOUNTS 5. AGRICULTURAL TRADE 6. FARM STRUCTURE 1 2 3 4-5 6-12 13-14
Statistical Factsheet. Belgium CONTENTS. Main figures - Year 2016
 June 2017 Statistical Factsheet Belgium CONTENTS Main figures 2016 1. KEY DATA 2. POPULATION & ECONOMY 3. FINANCIAL ASPECTS 4. ECONOMIC ACCOUNTS 5. AGRICULTURAL TRADE 6. FARM STRUCTURE 1 2 3 4-5 6-12 13-14
BULGARIA STATISTICAL PANORAMA
 BULGARIA 2008 - STATISTICAL PANORAMA Basic features and specific problems of the demographic, social and economic development, R & D and the environment s conditions in the country are presented in the
Denmark. Sources: European Commission, Eurostat, and Directorate General for Economic and Financial Affairs. Updated: M ay 2018
 May 2018 Statistical Factsheet Denmark CONTENTS Main figures 1. KEY DATA 2. POPULATI ON & ECONOMY 3. FINANCIAL ASPECTS 4. ECONOMI C ACCOUNTS 5. AGRICULTURAL TRADE 6. FARM STRUCTURE 1 2 3 4-5 6-12 13-14
National Bank of Moldova. Translation. Annual Report. 1 Grigore Vieru Avenue MD 2005 Chișinău
 National Bank of Moldova Translation Annual Report 2012 1 Grigore Vieru Avenue MD 2005 Chișinău www.bnm.md E-mail: official@bnm.md Annual Report (NBM, 2012) Note The report was compiled using the latest
Monthly policy monetary report October monetary policy monthly report
 Monthly policy monetary report October 2006 monetary policy monthly report OCTOBER 2006 October 2006 Monthly policy monetary report Main highlights Inflation developments Annual inflation in October experienced
Statistical Factsheet. Lithuania CONTENTS. Main figures - Year 2016
 June 2017 Statistical Factsheet Lithuania CONTENTS Main figures 2016 1. KEY DATA 2. POPULATION & ECONOMY 3. FINANCIAL ASPECTS 4. ECONOMIC ACCOUNTS 5. AGRICULTURAL TRADE 6. FARM STRUCTURE 1 2 3 4-5 6-12
Montenegrin Economic Outlook
 Montenegrin Economic Outlook Institute For Strategic Studies and Prognoses This publication is created under the project Increasing the analytical capacities of ISSP which is implemented by KOF and ISSP
DEVELOPMENT TRENDS, INFLUENCE FACTORS, FORECAST MACROINDICATORS OF UKRAINE S ECONOMY FOR THE PERION UNTIL 1015
 UKRAINE COUNTRY REPORT: DEVELOPMENT TRENDS, INFLUENCE FACTORS, FORECAST MACROINDICATORS OF UKRAINE S ECONOMY FOR THE PERION UNTIL 1015 New York, October 22-24, 2012 Valeriy Heyets, Maria Skrypnychenko
Irish economy: Outlook
 Irish economy: Outlook 2018-2020 Terry Quinn and Thomas Conefrey (IEA), Civic Society Roundtable, November 30 th 2018 Terry Quinn Irish Economic Analysis Division Overview Economy continues to expand at
UKRAINIAN ECONOMIC OUTLOOK
 3 UKRAINIAN ECONOMIC OUTLOOK tendencies estimates forecasts 2007 w w w.case-ukraine.com.ua UKRAINIAN ECONOMIC OUTLOOK Quarterly 3/2007 (2 quarter 2007) TENDENCIES ESTIMATES FORECASTS CONTENT 1. Overview
CANADA EUROPEAN UNION
 THE EUROPEAN UNION S PROFILE Economic Indicators Gross domestic product (GDP) at purchasing power parity (PPP): US$20.3 trillion (2016) GDP per capita at PPP: US$39,600 (2016) Population: 511.5 million
NBS MoNthly BulletiN december 2017
 Published by: Národná banka Slovenska Address: Národná banka Slovenska Imricha Karvaša 1, 81 Bratislava Slovakia Contact: +1//787 1 http://www.nbs.sk Discussed by the Bank Board on 19 December 17. All
for small and medium business enterprises, simplifying procedures for obtaining permits to conduct business, start and exit the business and more.
 NATIONAL REPORT Promoting productive capacity and decent work to eradicate poverty in the context of inclusive, sustainable and equitable economic growth at all levels for achieving Millennium Development
BULGARIA: ECONOMIC AND MARKET ANALYSES Monthly report, August 2015
 BULGARIA: ECONOMIC AND MARKET ANALYSES Monthly report, August 2015 All data in the edition are the last available data as of 29 of August 2015 The quoted data set in this report are the last available
Quarterly Report for the Greek Economy
 Quarterly Report for the Greek Economy 3-2016 October 11 th, 2016 This presentation is supported by Various developments in the current period Positive developments: international tourism, low energy prices,
International Monetary Fund Washington, D.C.
 2008 International Monetary Fund October 2008 IMF Country Report No. 08/330 St. Lucia: Statistical Appendix This Statistical Appendix for St. Lucia was prepared by a staff team of the International Monetary
International Monetary Fund Washington, D.C.
 2004 International Monetary Fund May 2004 IMF Country Report No. 04/140 January 29, 2001 January 29, 2001 January 29, 2001 January 29, 2001 January 29, 2001 Republic of Belarus: Statistical Appendix This
CORRELATION OF DEMOGRAPHIC- ECONOMIC EVOLUTIONS IN ROMANIA AFTER THE 2008 ECONOMIC CRISIS
 Bulletin of the Transilvania University of Braşov Vol. 6 (55) No. 2-2013 Series V: Economic Sciences CORRELATION OF DEMOGRAPHIC- ECONOMIC EVOLUTIONS IN ROMANIA AFTER THE 2008 ECONOMIC CRISIS Adriana Veronica
Recent Macroeconomic and Monetary Developments in the Czech Republic and Outlook
 Recent Macroeconomic and Monetary Developments in the Czech Republic and Outlook Miroslav Singer Governor, Czech National Bank FORECASTING DINNER 212, Czech CFA Society Prague, 22 February 212 M. Recent
Nicaragua. 1. General trends. 2. Economic policy. The economy grew by 4.5% in 2010, after shrinking by 1.5% in 2009, indicating that Nicaragua
 Economic Survey of Latin America and the Caribbean 2010-2011 197 Nicaragua 1. General trends The economy grew by 4.5% in 2010, after shrinking by 1.5% in 2009, indicating that Nicaragua has recovered from
Trade, sanctions, and economic issues in EU- Russian Relations
 Trade, sanctions, and economic issues in EU- Russian Relations Presented by Crina Viju Carleton University Presentation prepared for the Jean Monnet Chair EUREAST Workshop: The European Union and Russia:
GUATEMALA. 1. General trends
 Economic Survey of Latin America and the Caribbean 2016 1 GUATEMALA 1. General trends In 2015, Guatemala s GDP grew by 4.1% in real terms (a figure similar to the 4.2% recorded the previous year), driven
Mauritius Economy Update October 2013
 October 28, 2013 Economics Mauritius Economy Update October 2013 Mauritius, a tropical island situated towards the south east coast of Africa comprises 9 districts Flacq, Grand port, Moka, Pamplemousses,
BANK OF ALBANIA MONETARY POLICY REPORT
 MONETARY POLICY REPORT October 2005 MONETARY POLICY REPORT OCTOBER 2005-1 - MONETARY POLICY REPORT October 2005-2 - MONETARY POLICY REPORT October 2005 C O N T E N T S I Main highlights 5 II Inflation
4. Balance of Payments and Foreign Trade
 24 4. Balance of Payments and Foreign Trade 4. Balance of Payments and Foreign Trade Current account deficit in 2014 was lower than the one realised in 2013 In the period January- November 2014, current
MACEDONIAN ECONOMIC OUTLOOK 1
 MACEDONIAN ECONOMIC OUTLOOK 1 Quarterly (Reference period: January March 2012) Center for Economic Analyses (CEA) Skopje, 2012 1 Supported by: Open Society Institute Think Tank Fund Budapest 1 General
NBS MoNthly BulletiN december 2016
 Published by: Národná banka Slovenska Address: Národná banka Slovenska Imricha Karvaša 1, 813 5 Bratislava Slovakia Contact: +1//5787 1 http://www.nbs.sk Discussed by the Bank Board on December 1. All
Graph G3.1 Movements of Unemployment and Employment Rates, 15+, 2008-Q Unemployment rate 11.8
 18 3. Labour Market 3. Labour Market Labour Force Survey data indicate continued improvements on the labour market, which significantly surpass the growth of economy and imply a high decline in productivity
Kazakhstan: on the wave of structural reforms. Aset Irgaliyev, PhD First Deputy Chairman Economic Research Institute
 Kazakhstan: on the wave of structural reforms Aset Irgaliyev, PhD First Deputy Chairman Economic Research Institute September 2015 New economic reality: transformation of global economy Over the last 12
Economic Update 9/2016
 Economic Update 9/ Date of issue: 10 October Central Bank of Malta, Address Pjazza Kastilja Valletta VLT 1060 Malta Telephone (+356) 2550 0000 Fax (+356) 2550 2500 Website https://www.centralbankmalta.org
ACCESSION OF BULGARIA. Communication from Bulgaria
 GENERAL AGREEMENT ON RESTRICTED L/6880/Add.3 16 October 1992 TARIFFS AND TRADE Limited Distribution Original: English ACCESSION OF BULGARIA Communication from Bulgaria The following communication, dated
International Monetary Fund Washington, D.C.
 2008 International Monetary Fund February 2008 IMF Country Report No. 08/68 St. Lucia: Statistical Appendix This Statistical Appendix paper for St. Lucia was prepared by a staff team of the International
ECONOMIC OUTLOOK. September, 2017 MINISTRY OF ECONOMY AND SUSTAINABLE DEVELOPMENT
 ECONOMIC OUTLOOK September, 2017 MINISTRY OF ECONOMY AND SUSTAINABLE DEVELOPMENT CONTENTS GDP growth... 3 Potential Level of Economic Growth and GDP Gap... 3 Macroeconomic Environment in the Region...
Economic UpdatE JUnE 2016
 Economic Update June Date of issue: 30 June Central Bank of Malta, Address Pjazza Kastilja Valletta VLT 1060 Malta Telephone (+356) 2550 0000 Fax (+356) 2550 2500 Website https://www.centralbankmalta.org
A MEDIUM-TERM FORECAST FOR POLAND POLISH ECONOMY FOLLOWS THE SLODOWN IN THE EU.
 University of Łódź Institute of Econometrics Władysław Welfe A MEDIUM-TERM FORECAST FOR POLAND 2012-2015 POLISH ECONOMY FOLLOWS THE SLODOWN IN THE EU. Paper prepared for the PROJECT LINK meeting in New
CHILE TRADE SUMMARY IMPORT POLICIES. Tariffs
 CHILE TRADE SUMMARY The U.S. goods trade deficit with Chile was $692 million in 2007, a decrease of $2.1 billion from $2.8 billion in 2006. U.S. goods exports in 2007 were $8.3 billion, up 22.5 percent
THE ANALYSIS OF FACTORS INFLUENCING THE DEVELOPMENT OF SMALL AND MEDIUM SIZE ENTERPRISES ACTIVITIES
 2/2008(20) MANAGEMENT AND SUSTAINABLE DEVELOPMENT 2/2008(20) THE ANALYSIS OF FACTORS INFLUENCING THE DEVELOPMENT OF SMALL AND MEDIUM SIZE ENTERPRISES ACTIVITIES Evija Liepa, Atis Papins Baltic International
Is economic growth sustainable in Romania?
 MPRA Munich Personal RePEc Archive Is economic growth sustainable in Romania? George Ciobanu and Andreea Maria Ciobanu 18. March 2008 Online at http://mpra.ub.uni-muenchen.de/7810/ MPRA Paper No. 7810,
2 Macroeconomic Scenario
 The macroeconomic scenario was conceived as realistic and conservative with an effort to balance out the positive and negative risks of economic development..1 The World Economy and Technical Assumptions
The Republic of Moldova: Key developments and Challenges
 The Republic of Moldova: Key developments and Challenges Investment opportunities Calmic Octavian, deputy minister Ministry of Economy of the Republic of Moldova May, 2011 Economic recovery GDP compared
Dismantling the myths about Moldova s trade failures after implementing the Association Agreement
 Dismantling the myths about Moldova s trade failures after implementing the Association Agreement Authors: Adrian Lupușor Vadim Gumene This publication was developed under the Project Understanding the
Invest in Moldova An insider s perspective. 3 February 2017 EBA MOLDOVA
 Invest in Moldova An insider s perspective 3 February 2017 EBA MOLDOVA EBA Moldova >50 Members European companies Moldovan companies exporters, service providers, etc. Member of European Business Organization
II. ESTONIAN BALANCE OF PAYMENTS FOR 2001
 18 II ESTONIAN BALANCE OF PAYMENTS FOR 2001 In 2001 a rapid slowdown of economic growth was registered with all Estonia s major export partners The negative import growth of the euro area Finland and Sweden
II. Macroeconomic Developments 2.1 Economic Growth. Overview QUARTERLY ECONOMIC BRIEF UNITED NATIONS DEVELOPMENT PROGRAMME ETHIOPIA.
 QUARTERLY ECONOMIC BRIEF UNITED NATIONS DEVELOPMENT PROGRAMME ETHIOPIA Volume I, 2018 Overview Economic growth recovered from the impact of drought in 2015/16 and registered 10.9 percent annual growth
UKRAINE Market Monitor Review January-June 2018
 Picture: FSLC Ukraine UKRAINE Market Monitor Review January-June 218 HIGHLIGHTS Ukrainian economy continued its gradual growth for the third year in a row with 3.1 percent GDP increase in the first quarter
MACROECONOMIC FORECAST
 MACROECONOMIC FORECAST Spring 17 Ministry of Finance of the Republic of Bulgaria Bulgarian economy is expected to expand by 3% in 17 driven by domestic demand. As compared to 16, the external sector will
APPENDIX 2 TO ANNEX VIII ICELAND SCHEDULE OF SPECIFIC COMMITMENTS
 APPENDIX 2 TO ANNEX VIII ICELAND SCHEDULE OF SPECIFIC COMMITMENTS I. HORIZONTAL COMMITMENTS ALL SECTORS INCLUDED IN THIS SCHEDULE 3) All foreign investment and currency transfers must be reported to the
CANADA GERMANY GERMANY S PROFILE NOTES. Dylan Gowans
 GERMANY S PROFILE Economic Indicators Gross domestic product (GDP) at purchasing power parity (PPP): US$4.0 trillion (2016) GDP per capita at PPP: US$48,700 (2016) Population: 82.7 million (2016) International
II. INTERNATIONAL INVESTMENT POSITION AS OF 12/31/2015
 II. INTERNATIONAL INVESTMENT POSITION AS OF 12/31/215 Page 3 Table 3. International investment position of the Republic of Moldova as of 12/31/215 (US$ million) Position as of 12/31/214* total BOP transactions
CANADA UKRAINE UKRAINE S PROFILE NOTES. Florian Richard
 UKRAINE S PROFILE Economic Indicators Gross domestic product (GDP) at purchasing power parity (PPP): US$353.0 billion (2016) GDP per capita at PPP: US$8,300 (2016) Population: 45.0 million (2016) International
Valentyn Povroznyuk, Radu Mihai Balan, Edilberto L. Segura
 September 214 GDP grew by 1.2% yoy in Q2 214. Industrial output growth was equal to 1.4% yoy in June 214. The consolidated budget deficit narrowed to.2% of GDP in January-July 214. Consumer inflation slightly
Council of the European Union Brussels, 23 April 2018 (OR. en) Eugen Orlando Teodorovici, Minister of Public Finance, Ministry of Public Finance
 Eugen Orlando Teodorovici, Minister of Public Finance, Ministry of Public Finance") Council of the European Union Brussels, 23 April 2018 (OR. en) 8257/18 ECOFIN 354 UEM 125 COVER NOTE From: date of receipt: 23 April 2018 To: Subject: Eugen Orlando Teodorovici, Minister of Public Finance,
Council of the European Union Brussels, 23 April 2018 (OR. en) 8257/18 ECOFIN 354 UEM 125 COVER NOTE From: date of receipt: 23 April 2018 To: Subject: Eugen Orlando Teodorovici, Minister of Public Finance,
Monthly policy monetary report November monetary policy monthly report
 Monthly policy monetary report 2006 Bank of Albania monetary policy monthly report NOVEMBER 2006 Bank of Albania 2006 Monthly policy monetary report I Main highlights Annual inflation rate in 2006 recorded
The Greek economy comes out of recession much more gradually than anticipated, while structural weaknesses inhibit growth.
 ISSUE 23 15 May 2017 INDEX Main indicators 3 Economic climate 4 Employment, prices, wages 5 Industry, trade, services 6 Exports, tourism 7 European Commission s spring forecasts for Greece (European Commission,
Doing Business in Moldova
 Doing Business in Moldova www.bakertillyinternational.com Preface This guide has been prepared by Baker Tilly, an independent member of Baker Tilly International. It is designed to provide information
Monetary and Foreign Exchange Policy of the National Bank of Moldova for 2004
 Monetary and Foreign Exchange Policy of the National Bank of Moldova for 2004 The monetary and foreign exchange policy and the main directions of the NBM activity set with the view to fulfilling the basic
5. Prices and the Exchange Rate
 3 5. Prices and the Exchange Rate 5. Prices and the Exchange Rate Since the beginning of the year, inflation in Serbia has been extremely low, the cumulative growth rate in the first seven months is %.
CROATIAN NATIONAL BANK B U L L E T I N. No. 41/42 - SEPTEMBER 1999
 CROATIAN NATIONAL BANK B U L L E T I N No. 41/42 - SEPTEMBER 1999 REAL SECTOR The weakening of aggregate demand seen at the end of 1998 continued in the first quarter of this year. The real annual change
Eesti Pank ESTONIA S BALANCE OF PAYMENTS FOR 2016
 Eesti Pank ESTONIA S BALANCE OF PAYMENTS FOR 216 217 The Balance of Payments Yearbook is a longer analysis of annual external sector statistics, which includes a number of graphs. In addition, the yearbook
International Monetary Fund Washington, D.C.
 2005 International Monetary Fund August 2005 IMF Country Report No. 05/295 Iraq: Statistical Appendix This Statistical Appendix paper for Iraq was prepared by a staff team of the International Monetary
Republika e Kosovës/ Republika Kosova-Republic of Kosovo. Qeveria Vlada-Government
 Republika e Kosovës/ Republika Kosova-Republic of Kosovo Qeveria Vlada-Government Ministria e Tregtisë dhe Industrisë-Ministarstvo Trgovine i Industrije/Ministry of Trade and Industry Departamenti i Industrisë/Department
OFFICIAL DEVELOPMENT ASSISTANCE STATE CHANCELLERY JULY 9, 2015
 OFFICIAL DEVELOPMENT ASSISTANCE 2014 STATE CHANCELLERY JULY 9, 2015 SOURCES OF DATA COLLECTION 1. DEVELOPMENT PARTNERS 2. CENTRAL PUBLIC AUTHORITIES 3. AID MANAGEMENT PLATFORM (www.amp.gov.md) ODA DISBURSED
No. 6/2017. Information Bulletin
 No. 6/2017 Information Bulletin No. 6/2017 Information Bulletin Warsaw 2017 Compiled from NBP materials by the Department of Statistics as at August 11, 2017. Published by: Narodowy Bank Polski Education
Camelia Elena Ivan 1 Bucharest University of Economic Studies, Romania Economics and International Business
 FOREIGN DIRECT INVESTMENTS IN THE ECONOMY OF THE REPUBLIC OF MOLDOVA Camelia Elena Ivan 1 Bucharest University of Economic Studies, Romania Economics and International Business Abstract The European Union
EN 1 EN. Annex. Sector Policy Support Programme: Sector budget support (centralised management) DAC-code Sector Trade related adjustments
 DAC-code Sector Trade related adjustments") Annex 1. Identification Title/Number Trinidad and Tobago Annual Action Programme 2010 on Accompanying Measures on Sugar; CRIS reference: DCI- SUCRE/2009/21900 Total cost EU contribution : EUR 16 551 000
Annex 1. Identification Title/Number Trinidad and Tobago Annual Action Programme 2010 on Accompanying Measures on Sugar; CRIS reference: DCI- SUCRE/2009/21900 Total cost EU contribution : EUR 16 551 000
No. 8/2016. Information Bulletin
 No. 8/2016 Information Bulletin No. 8/2016 Information Bulletin Warsaw 2016 Compiled from NBP materials by the Department of Statistics as at October 14, 2016. Published by: Narodowy Bank Polski Education
The Analysis of the Situation of Foreign Direct Investments in Romania
 The Analysis of the Situation of Foreign Direct Investments in Romania Camelia Milea 1, Florin Bălăşescu 2 Abstract: Foreign direct investments represent one of the ways of financing any economy. But like
CANADA BELARUS BELARUS S PROFILE NOTES. Florian Richard
 BELARUS S PROFILE Economic Indicators Gross domestic product (GDP) at purchasing power parity (PPP): US$171.7 billion (2016) GDP per capita at PPP: US$18,100 (2016) Population: 9.5 million (2016) International
Local Government System and Finances in the Republic of Moldova
 Local Government System and Finances in the Republic of Moldova V I O R E L R O S C O V A N M A Y 2 7, 2 0 1 5 Overview of this talk Background of Local Governance Legislation, Structure, and Competences
Inflation projection of Narodowy Bank Polski based on the NECMOD model
 Economic Institute Inflation projection of Narodowy Bank Polski based on the NECMOD model Warsaw / 9 March Inflation projection of the NBP based on the NECMOD model Outline: Introduction Changes between
National Bank of the Republic of Macedonia Research Department. Monthly Information 10/2012
 National Bank of the Republic of Macedonia Research Department Monthly Information 1/212 November, 212 Summary During October 212, the National Bank kept the key interest rate at the level of 3.75%, assessing
SDMX CONTENT-ORIENTED GUIDELINES LIST OF SUBJECT-MATTER DOMAINS
 SDMX CONTENT-ORIENTED GUIDELINES LIST OF SUBJECT-MATTER DOMAINS 2009 SDMX 2009 http://www.sdmx.org/ Page 2 of 10 SDMX list of statistical subject-matter domains 1 : Overview Domain 1: Demographic and social
Inflation Report. July September 2012
 July September 1 November 7, 1 1 Outline 1 External Conditions Economic Activity in Mexico 3 Monetary Policy and Inflation Determinants Forecasts and Balance of Risks External Conditions The growth rate
EXTERNAL SECTOR: RECENT TRENDS AND CHALLENGES Bangladesh Economic Update. October 2015
 EXTERNAL SECTOR: RECENT TRENDS AND CHALLENGES Bangladesh Economic Update October 2015 Bangladesh Economic Update Volume 06, No. 09, 2015 Acknowledgement Bangladesh Economic Update is a monthly publication
CANADA SPAIN SPAIN S PROFILE NOTES. Florian Richard
 SPAIN S PROFILE Economic Indicators Gross domestic product (GDP) at purchasing power parity (PPP): US$1.7 trillion (2016) GDP per capita at PPP: US$36,300 (2016) Population: 46.4 million (2016) International
CONTENTS. Topic At A Glance A free trade area with the EU: what does it mean for Georgia? 4
 Issue 1 NOVEMBER 2012 CONTENTS DCFTA Highlights Third round marks further progress in the talks 2 After the October 1st elections: DCFTA-reforms need to continue 2 The EU negotiating team meets with the
Austria s economy will grow by 2¾% in 2017
 Gerhard Fenz, Friedrich Fritzer, Martin Schneider 1 In the first half of 217, Austria s economy gathered further momentum. With growth rates by.8% in both the first and the second quarters, Austria recorded
EVOLUTION AND CURRENT TRENDS IN THE STRUCTURE OF THE MAIN NATIONAL BUDGETARY INDICATORS IN ROMANIA
 50 Evolution and current trends in the structure of the main national budgetary indicators in Romania EVOLUTION AND CURRENT TRENDS IN THE STRUCTURE OF THE MAIN NATIONAL BUDGETARY INDICATORS IN ROMANIA
Economic Impact of Canada s Participation in the Comprehensive and Progressive Agreement for Trans-Pacific Partnership
 Economic Impact of Canada s Participation in the Comprehensive and Progressive Agreement for Trans-Pacific Partnership Office of the Chief Economist, Global Affairs Canada February 16, 2018 1. Introduction
Chart 1 Development of real GDP by quarters (year-on-year growth in %)
") A T E C 1 14 12 1 8 4 2-2 -4 I -9-12 -15 8/29B volume 17, Development of the real economy in the first quarter of 29 Viera Kollárová, Helena Solčánska Národná banka Slovenska The indicators of Slovakia
A T E C 1 14 12 1 8 4 2-2 -4 I -9-12 -15 8/29B volume 17, Development of the real economy in the first quarter of 29 Viera Kollárová, Helena Solčánska Národná banka Slovenska The indicators of Slovakia
ECONOMIC SURVEY OF LATIN AMERICA MONTSERRAT
 UN TED NATIIONS nt* ECONO I[C / Apiza) SOCIAL COUNCII_ Distr. LIMITED E/CEPAL/L.286/Add.24 June 1984 ORIGINAL: INGLES ECLA Economic Commission for Latin America BIBUCTECA EACTUNES MBAS MEM ECONOMIC SURVEY